On November 11, 2022, the cryptocurrency exchange FTX formally filed for bankruptcy protection, revealing a customer-funds shortfall of as much as $8.7 billion on its balance sheet [1]. John J. Ray III, who subsequently took over as chief executive officer and oversaw the bankruptcy proceedings, submitted a sworn declaration to the court stating that, in more than 40 years of legal and restructuring experience, he had never seen such a complete failure of corporate control or such a total absence of trustworthy financial information [2]. The public and the media have often reduced this episode to the personal fraud of the founder. Viewed through the lens of market microstructure and system architecture, however, the emergence of an $8.7 billion customer-funds shortfall is fundamentally an architectural problem rather than a purely moral one. FTX's collapse did not stem from a hack, a market crash, or sophisticated financial engineering. It stemmed from an institution that simultaneously played the roles of exchange, broker, clearinghouse, and custodian and that, absent effective checks and balances, systematically misappropriated customer funds. Under such a heavily function-bundled architecture, conflicts of interest shift from occasional misconduct to a structural norm, and any sufficiently large temptation can produce the same outcome.
This chapter takes neither the one-sided position that centralized exchanges (CEXs) are inherently inferior to decentralized exchanges (DEXs) nor the noncommittal stance that every architecture simply has its own merits and drawbacks. Instead, it uses a precise analytical framework to help readers understand how different service-provider architectures determine the types of risk that users face and how to choose rationally among those risks. To this end, the chapter develops five analytical tools. The risk substitution theorem formalizes the core insight that risk cannot be eliminated, only substituted. The trilemma characterizes the structural tension among performance, transparency, and decentralization. The bundling tax quantifies the hidden cost behind the efficiency advantage of centralized exchanges. The verifiability ladder establishes a five-level assessment standard running from trusting an institution to verifying code. And old problems in new forms reveals the isomorphic mapping between the new problems on-chain and the old problems of traditional finance.
Having established this framework, the chapter analyzes in turn the internal operating logic of three architectures—traditional financial derivatives markets, centralized cryptocurrency exchanges, and on-chain protocols—reveals the risk isomorphism that cuts across them, and examines the systematic effects of architectural evolution on four core dimensions of market microstructure. Chapter 4 analyzed who trades in perpetual futures markets; this chapter turns to who provides the infrastructure for that trading, and Chapter 6 will further examine how different architectures evolve dynamically through competition. After reading this chapter, readers should be able to use the risk substitution theorem and the trilemma to evaluate the architectural choices of any trading service provider, understand the technical criteria and applicable boundaries of each level of the verifiability ladder, and, when facing a concrete platform choice, make rational decisions grounded in architectural analysis rather than brand trust.
5.1 The risk substitution theorem and the service provider's trilemma
The architectural design of a crypto-asset trading platform does not take place in a vacuum; it seeks an optimum within a set of mutually constraining variables. Before analyzing specific service-provider models in depth, this section first establishes a unified set of analytical tools to serve as the coordinate system for the rest of the chapter. This section presents, in turn, the four functional dimensions, the risk substitution theorem, the service provider's trilemma, and the verifiability ladder—together forming a complete theoretical framework that runs from functional decomposition to risk assessment and from characterizing constraints to quantifying trust.
5.1.1 The functional dimensions of the trade lifecycle
Any perpetual futures service provider, whatever its technical form, must perform four core functions. Together these dimensions answer the fundamental question of how a trade moves safely from intent to finality, and their theoretical foundation traces back to Harris's classic treatment of the functions of market microstructure [3]. Harris decomposes trading services into core functions such as providing immediacy, managing counterparty risk, and facilitating price discovery, and he notes that trading venues also perform the economic functions of aggregating information and reducing search costs. The four-dimensional framework of this chapter is a concrete application of that idea to perpetual futures markets. The information-aggregation function in Harris's framework is folded mainly into the trade-execution dimension (price discovery realized through the matching engine), while the search-cost-reduction function is distributed across two dimensions: asset custody, which lowers trust costs, and risk management, which lowers the cost of risk assessment.
Asset custody answers the question of whether traders' funds are safe. It concerns how traders' assets are held and who controls them, and it directly determines the type and degree of counterparty risk. In traditional finance, asset custody is typically handled by heavily regulated custodian banks or central securities depositories, with a legal separation between client assets and the institution's own assets. In crypto markets, the mode of custody determines whether a trader retains control of the private keys. Centralized exchanges use a pooled-custody model: traders deposit assets into wallets the platform controls, and the platform records user balances in an internal database. The risk this model exposed in the FTX episode is that, when the internal database can be altered by management, a user's balance may be nothing more than a number with no guarantee of solvency behind it. Decentralized protocols, by contrast, achieve non-custodial trading through smart contracts: the trader retains control of the assets throughout the trade, and funds move only under the strict conditions set by the smart contract.
Trade execution answers the question of whether an order is executed fairly. It covers the matching of buy and sell orders, price discovery, latency optimization, and execution fairness. The performance of the matching engine directly determines an exchange's throughput and the quality of market liquidity. Centralized exchanges achieve millisecond- or even microsecond-level matching through high-performance, custom in-memory matching engines. In 2024, the top 10 centralized exchanges recorded more than $58 trillion in total perpetual futures volume, with Binance's market share falling from about 43% at the start of the year to 34% by year-end [4]. Decentralized exchanges must instead contend with the latency of blockchain state updates, giving rise to automated market makers (AMMs), on-chain order books, and hybrid models that match off-chain and settle on-chain. Execution fairness is especially fraught on-chain, because the public transparency of a blockchain lets miners or validators observe and exploit a trader's unconfirmed orders, producing front-running and sandwich attacks. This is the technical re-emergence of an old problem: the long-running controversy in traditional finance over payment for order flow (PFOF) shares the same underlying structure: a broker sells client order flow to a market maker that uses its informational advantage to position itself ahead of execution. Maximal extractable value (MEV) is the on-chain, transparent-environment version of this old problem, made more systematic by the blockchain's openness.
Clearing and settlement answers the question of whether post-trade obligations are honored. For a highly leveraged derivative such as perpetual futures, clearing and settlement encompasses the real-time calculation of margin requirements, the mark-to-market processing of unrealized profit and loss (P&L), and the forced liquidation of positions once they become insolvent. In traditional derivatives markets, central counterparty (CCP) clearing absorbs default risk by building a default-waterfall structure that draws in sequence on the defaulter's margin, its default-fund contributions, the clearinghouse's own capital, and the default funds of non-defaulting members, thereby safeguarding the stability of the system [5]. In on-chain finance, smart contracts replace the traditional clearinghouse, executing real-time, deterministic clearing and settlement through preset code logic; this reconfigures the form of counterparty risk found in traditional clearing and eliminates settlement delay. On-chain clearing does not, however, fully eliminate counterparty risk; it transforms it into new forms. Shortfall losses are socialized to other users through the insurance fund or the auto-deleveraging (ADL) mechanism, the liquidator network may respond with delay under extreme conditions as gas fees spike, and the nondeterministic window of oracle price feeds introduces the risk of mark-price deviation.
Risk management answers the question of whether the system will collapse under extreme conditions. It covers the continuous monitoring of margin, the triggering and execution of forced liquidation, the absorption of shortfall losses, and the defense against systemic risk. In a centralized exchange, the risk engine is usually tightly coupled with the matching engine, able to respond to market swings and trigger liquidations within milliseconds. In on-chain protocols, risk management relies on the timely response of the liquidator network and the accuracy of oracle price feeds; under extreme conditions, liquidation delays or improper liquidations caused by price manipulation can occur.
These four dimensions are not independent. The mode of custody directly affects the effectiveness of risk control: when assets are held by a smart contract, the risk engine can enforce margin requirements at the level of code, without relying on the self-restraint of the platform operator. Execution mode and settlement are likewise closely linked: the atomic-settlement capability of an on-chain order book lets a trade and its settlement complete simultaneously within a single blockchain transaction, eliminating the lag between execution and final settlement found in traditional markets. Understanding the interactions among the dimensions is the key to understanding the relative merits of different service-provider architectures. Traditional finance assigns the four functions to separate, independent institutions to achieve a separation of duties; centralized cryptocurrency exchanges concentrate them in a single entity to achieve functional bundling; and on-chain protocols reconfigure them with code and cryptography [6].
5.1.2 The risk substitution theorem
Observing how trading service providers evolved from traditional finance to centralized cryptocurrency exchanges and then to on-chain protocols, one general pattern gradually emerges. Each architectural transition successfully eliminated certain core risks of the preceding architecture, but each also inevitably introduced new types of risk. This pattern can be stated as the risk substitution theorem: for any transition of a service-provider architecture from A to B, the transition eliminates the risk set specific to A while introducing the risk set specific to B. The key proposition is that is always nonempty—that is, no architecture drives all types of risk to zero simultaneously. Architecture choice is therefore not about eliminating risk but about choosing the type of risk. The rational criterion for the choice is whether, for a particular user, the risks in are more identifiable, more quantifiable, and more manageable than those in .
The risk substitution theorem describes a change in the type of risk, not a conservation of total risk. Risks under different architectures can differ by orders of magnitude in expected loss (probability × magnitude) and in tail characteristics. The operational risk of a centralized exchange, for instance, is relatively low in frequency, but once it materializes—as with FTX's $8.7 billion shortfall—it can produce a loss of nearly 100% of principal; the loss from a single smart-contract exploit is usually smaller in scale but occurs more frequently. Tail-risk measures such as conditional value at risk (CVaR) can reveal that certain architectural transitions eliminate low-magnitude risks already effectively mitigated by regulation while introducing high-magnitude risks that lack external constraint. As a result, users with different risk preferences—tail-averse users versus mean-variance users—may reach entirely different optima from the same set of architectural choices.
Applying this theorem to the three architectural transformations of trading service providers reveals a clear symmetry, at each transition, between the risk set eliminated and the risk set introduced (Figure 5-1).
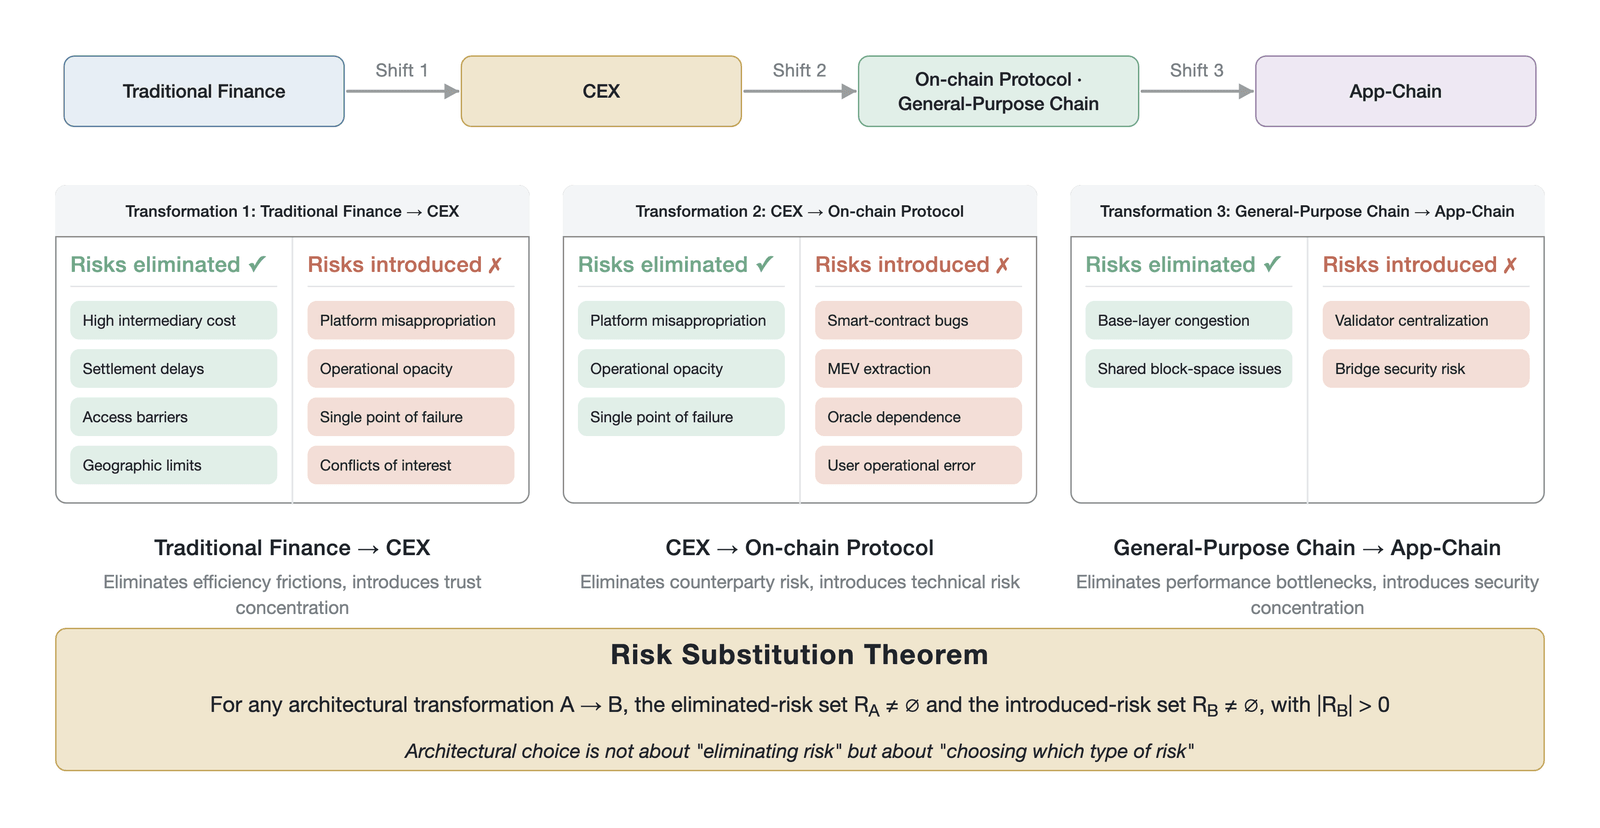
Figure 5-1. The risk substitution theorem — risk mapping across three architectural transitions (conceptual mapping, not empirical data; Data source: Dell'Erba [6], Yadav [7], Three Sigma [8])
Traditional financial markets, through the division of labor among multiple layers of intermediaries and a strict regulatory framework, effectively controlled the risks of fraud and misappropriation of funds. That architecture, however, introduced high intermediation costs, long settlement cycles (typically one to two business days), and significant barriers to access and geographic restrictions. The emergence of centralized cryptocurrency exchanges eliminated these efficiency frictions by adopting a vertically integrated architecture that concentrates all functions in a single entity, enabling around-the-clock global trading and instant transfers of funds. That transition, however, introduced serious risks of platform misappropriation, operational opacity, single points of failure, and conflicts of interest [6]. FTX's $8.7 billion customer-funds shortfall [1] and the Bybit hack of February 2025—in which a North Korean hacking group stole about $1.5 billion in Ethereum assets by manipulating the signing workflow of a multi-signature wallet [9]—are both extreme expressions of this centralization risk.
As markets evolved further toward on-chain protocols, smart contracts and blockchain consensus mechanisms replaced centralized servers. This architectural transition eliminated platform-misappropriation risk and operational opacity through cryptographic verification, achieving trustless trade execution and settlement. Risk did not disappear, however; it shifted to the technical layer. On-chain protocols introduced the risk of smart-contract vulnerabilities, the risk of exploitation through MEV (earlier also called miner extractable value), the risk of dependence on external oracle price feeds, and the risk of users irreversibly losing assets through operational mistakes. In 2024, smart-contract exploits in DeFi caused about $730 million in losses, down from $1.15 billion in 2023 but still a significant systemic threat [8]. Notably, this year-over-year decline may not reflect a simple improvement in security but rather the confluence of several factors: total value locked (TVL) on-chain fluctuated considerably over the same period, and the composition of attack vectors shifted from smart-contract logic flaws to private-key theft and social engineering, the latter of which does not appear in contract-vulnerability statistics. According to a July 2025 report from the European Securities and Markets Authority (ESMA), cumulative MEV revenue on Ethereum since the Merge in September 2022 has amounted to roughly $1 billion to $1.3 billion, with arbitrage—rather than sandwich attacks—contributing the highest monthly revenue [10].
As DEXs on general-purpose public blockchains evolve further into purpose-built application-specific blockchains (app-chains), the logic of risk substitution appears once more. An app-chain, by building a specially optimized blockchain, eliminates the congestion of the underlying chain, competition over gas fees, and the MEV problems created by shared block space; at the same time, it introduces the risk of validator centralization, the security risk of cross-chain bridges, and the reflexivity problem of economic security. This reflexivity deserves particular attention: an app-chain's economic security is usually anchored to the market capitalization of its native token, and that market capitalization depends in turn on user adoption and confidence, forming a positive feedback loop of "token market cap → staking security → user confidence → adoption → token market cap." On the way up, this loop reinforces itself; on the way down, once it falls below some critical threshold, declining security triggers user flight, which depresses the token's market cap and further weakens security, forming a downward spiral that is hard to reverse (Section 5.4.3 analyzes this mechanism further). The security record of cross-chain bridges likewise warrants attention: as of 2025, cross-chain bridge attacks have caused cumulative losses of more than $2.5 billion, nearly 40% of all funds stolen across decentralized finance [11].
The practical import of the risk substitution theorem is this: when someone asserts that "decentralized exchanges are safer than centralized exchanges," the claim is incomplete. The full statement should be that decentralized exchanges eliminate the counterparty risk of centralized exchanges but introduce smart-contract risk and MEV risk; if a user is able to audit code and to use the appropriate protective tools, then a decentralized exchange may be "safer" for that user, and otherwise not necessarily so. The rational criterion for architecture choice is not the absolute quantity of risk but its identifiability, quantifiability, and manageability.
5.1.3 The service provider's trilemma
In the trade-offs of architectural design, a trading service provider faces a core structural dilemma: performance, transparency, and decentralization cannot all be optimized simultaneously under current underlying technical constraints, and a platform must make trade-offs among them. The root of this dilemma lies in the basic constraints of distributed systems: raising performance requires reducing the number of nodes participating in consensus and simplifying verification to lower communication overhead, whereas strengthening decentralization requires precisely the opposite—expanding the validator set and adding redundant verification. Achieving transparency, in turn, requires that all trade data be public to the entire network, which not only increases the verification burden but also exposes unconfirmed trade information to potential front-runners. The tension among the three is rooted in the inherent contradiction between the cost of replicating information and the efficiency of reaching consensus: requiring more independent nodes to verify the same state necessarily consumes more time and bandwidth, while compressing the verification process necessarily reduces the number of independent verifiers or the completeness of verification.
The performance dimension covers trading latency, system throughput, and user interaction experience. For high-frequency traders and market makers, a difference of milliseconds in latency can determine the success or failure of a trading strategy. The transparency dimension requires that the entire trade lifecycle, the platform's asset reserves, and the operating logic of the risk engine be fully visible and independently verifiable to all market participants. The decentralization dimension measures the degree to which the system does not depend on a single entity or a small group of controllers, including the distribution of network nodes, the location of governance rights, and censorship resistance.
Different types of service provider occupy markedly different positions within this triangle (Figure 5-2), as analyzed below.
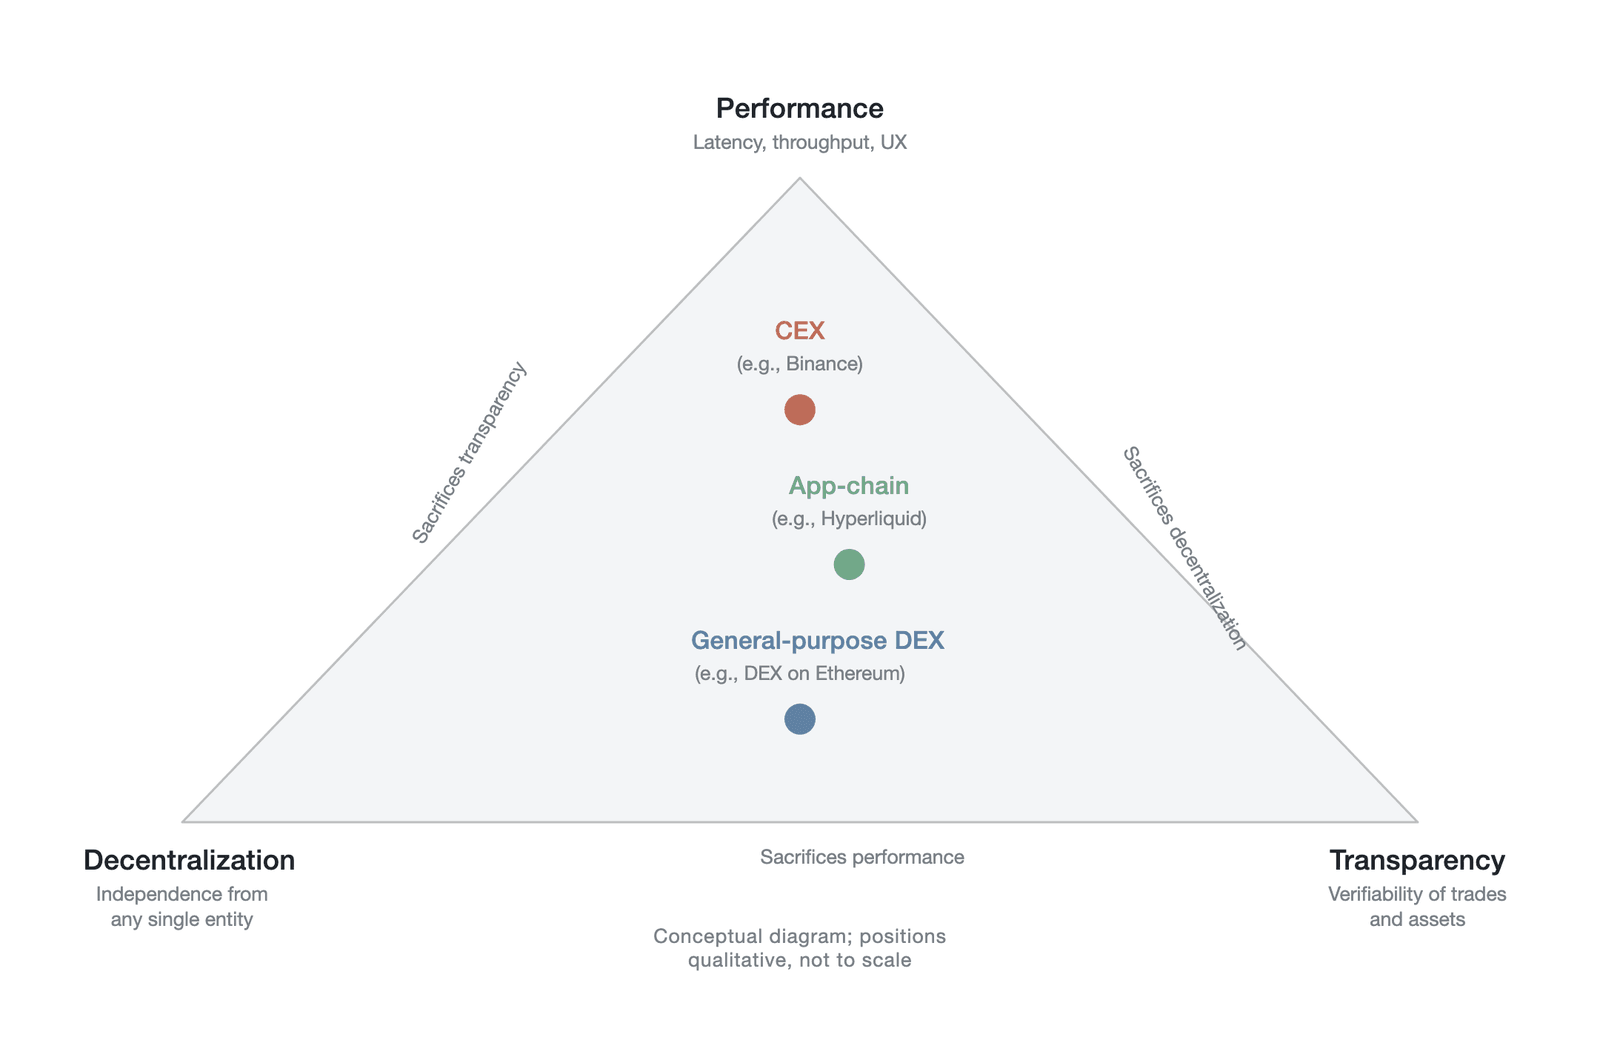
Figure 5-2. The service provider's trilemma — positioning of three paradigms (conceptual triangle; qualitative positions, not measured coordinates; placements reflect the author's qualitative judgment, not empirical data; Data source: CoinGecko [4], The Block [12])
Centralized exchanges prioritize performance and make concessions on transparency and decentralization. Binance handled the largest share of perpetual futures volume in the 2024 market, offering microsecond-level matching latency and deep liquidity, but the internal workings of its matching engine, risk-control logic, and asset management are entirely opaque, and users cannot independently verify whether the platform faithfully executes the rules it claims to follow [4]. Decentralized exchanges deployed on general-purpose public blockchains, by contrast, maximize transparency and decentralization: all trading logic runs openly on-chain, anyone can audit the smart-contract code and verify the execution of every trade, but they are constrained by the block time and computational capacity of the underlying blockchain, so their performance lags far behind their centralized competitors. Ethereum mainnet's block time of roughly 12 seconds means that a perpetual futures exchange built on that chain cannot support complex trading strategies requiring high-frequency order-book updates.
A new generation of derivatives app-chains seeks a better balance between performance and transparency, but usually at some cost to decentralization. By building a sovereign blockchain optimized specifically for order-book trading, Hyperliquid adopts an on-chain state-machine matching model executed by a validator network, achieving sub-second latency while preserving on-chain settlement transparency. In its HyperBFT consensus mechanism, the leader node drives the execution of matching computation while other validators verify the state-transition result, rather than every node independently executing the full matching process. As of early 2025, however, the network was maintained by only about 16 validator nodes (later gradually expanded to about 24) [12]; compared with Ethereum's more than one million validators, its degree of decentralization remains limited. Ethereum's "one million validators," however, refers to the number of 32-ETH staking units, not the number of independent node operators; a large share of validators is concentrated under liquid staking protocols such as Lido, so the actual number of independent operators is far below that figure. The fourth version of dYdX (v4) likewise adopts a sovereign, Cosmos-based blockchain architecture, but its order book uses a design different from Hyperliquid's: the order book is maintained in validator memory (an off-chain order book), and only fill results pass through consensus onto the chain, while order submission and cancellation do not go through blockchain consensus. This design brings dYdX v4's performance close to that of a centralized exchange, but the size and diversity of its validator set face similar constraints.
The analytical value of the trilemma lies in its explanation of why no perfect service provider exists. Every design is a chosen point within the triangle, and the location of that point is determined by the priorities of its target users. The triangle also predicts the direction of future technical progress: zero-knowledge proofs, modular blockchains, and data-availability layers are all, in essence, ways to expand the feasible area of the triangle so that the three goals can be achieved simultaneously at a higher level—yet the triangle itself, as a structural constraint, will not disappear. This trilemma is related to, but distinct from, the classic blockchain trilemma of security, decentralization, and scalability [13]: the latter describes the constraints of the underlying consensus protocol, whereas this chapter's triangle describes constraints at the level of the trading service provider. The constraints of the underlying triangle propagate upward, shaping the boundary of the feasible region for the service-provider triangle.
5.1.4 The verifiability ladder
To assess more precisely how different trading service providers differ in their trust assumptions, it is useful to build a verifiability-ladder model. The model classifies a trading platform's architecture, according to the degree to which its functions are publicly verifiable on-chain, into five progressive levels from L0 to L4. An increase in verifiability is not a binary switch but a graduated continuum. Each step upward means that the user's trust cost falls by one notch but is replaced by a greater cost of technical understanding.
The five levels of the ladder run progressively from the fully unverifiable L0 (such as FTX before its collapse) to the fully verifiable L4 (which no platform has yet reached), and the technical criteria at each level span the mode of asset custody, the degree of disclosure of matching logic, the auditability of risk-control parameters, and the level of decentralization of the governance mechanism (Figure 5-3).
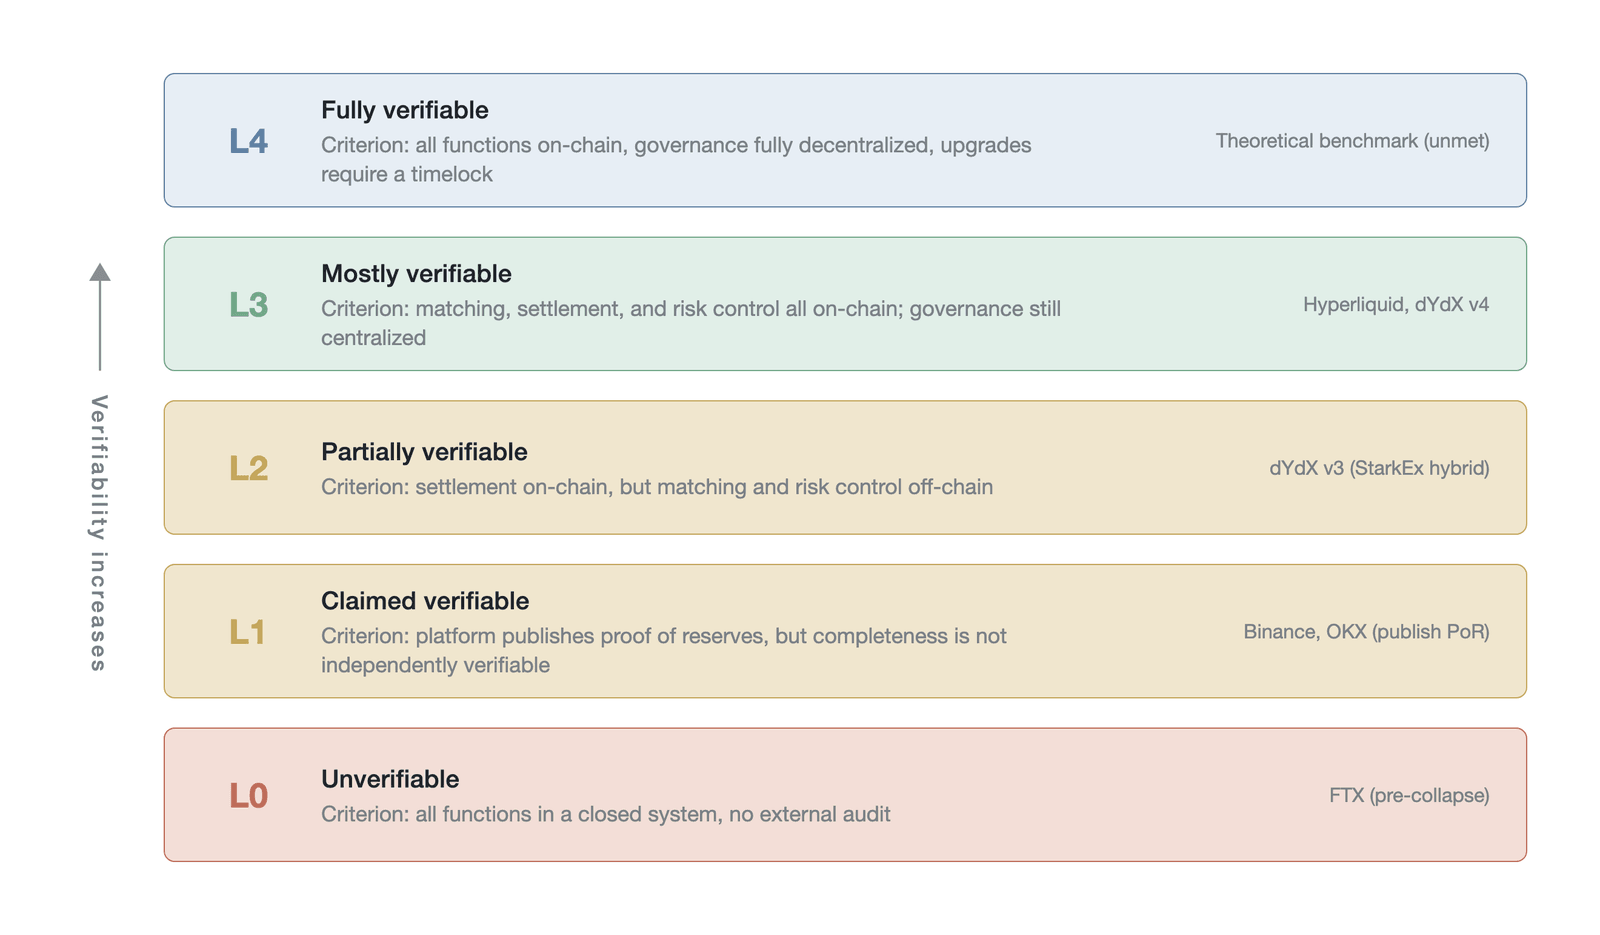
Figure 5-3. The verifiability ladder — the five-level standard from L0 to L4 (conceptual grading framework; the author classifies platforms by technical criteria, not empirical data; platform examples as of 2025, including the proof of reserves (PoR) published by Binance and OKX; Data source: Ray [2], Vidal-Tomás [14], The Block [12])
L0 denotes the unverifiable architecture. At this level, all of the platform's functions run inside a closed, centralized system, and no substantive external audit or verification is possible. FTX before its collapse was a typical L0 platform. In his sworn declaration, John J. Ray III disclosed that FTX did not even maintain a complete balance sheet and used instant-messaging software rather than a formal accounting system to handle financial records [2]. Under an L0 architecture, the user's only option is to trust, and that trust lacks any verifiable basis.
L1 denotes the attestation-based architecture. After FTX's collapse, many centralized exchanges began publishing proof of reserves (PoR) at regular intervals, using Merkle-tree technology to prove their asset positions to users [14]. This form of verification, however, has inherent limitations: proof of reserves is essentially a static point-in-time snapshot, and it often covers only the asset side while being unable to fully verify the liability side (its snapshot nature and liability-side limitations are detailed in Section 5.3.5). Although transparency improves over L0, the system's core operations still depend on the commitments and self-restraint of a centralized entity.
L2 denotes the partially verifiable architecture. At this level, the platform begins to split the key stages of the trade lifecycle, entrusting fund custody and final settlement to on-chain smart contracts while order routing and matching are still handled by high-performance centralized servers. The third version of dYdX (v3) is the archetype of this architecture; it uses StarkEx validity-proof technology to achieve on-chain settlement on Ethereum while running a high-performance matching engine off-chain. Validity proofs provide a mathematical guarantee of certainty: the operator cannot submit an incorrect state transition to Ethereum mainnet, because any settlement that does not conform to the proof rules is rejected by the mainnet contract. This brings the L2 architecture close to L3's level of protection on the dimension of fund safety. The disadvantage of this hybrid architecture, however, is that the matching process itself is not verifiable and carries censorship risk, so traders must still trust the fairness and censorship resistance of the centralized matching engine. Users can audit the code of the on-chain settlement contract but cannot verify whether order priority is manipulated during off-chain matching.
L3 denotes the largely verifiable architecture. The platform migrates matching, settlement, and the risk engine entirely on-chain, achieving public verifiability across the whole trade process. Both Hyperliquid and dYdX v4 adopt this architecture based on a sovereign app-chain [12]. dYdX v4's off-chain order-book design (see Section 5.1.3) means that order submission, cancellation, and matching themselves do not pass through blockchain consensus, but every fill result can be traced and verified through the blockchain's public record; within L3, it therefore makes a greater concession on matching transparency—relative to Hyperliquid's full-state consensus model—in exchange for performance. Although the core trading logic is already fully transparent, the core development team may still retain some degree of centralized control over node-admission mechanisms, emergency upgrade authority, and the adjustment of governance parameters. Such control has real security value in a protocol's early stages, because when a serious vulnerability is discovered, a rapid emergency response may protect user assets better than a fully decentralized governance process; at the same time, it constitutes a trust assumption that must be explicitly flagged.
L4 denotes the fully verifiable architecture. This is currently the highest standard in theory: it requires the platform not only to run entirely on-chain at the trading and settlement layers, but also to make its governance mechanism and protocol upgrades fully decentralized and subject to strict time locks and community consensus. At this level, any modification of a protocol parameter requires an on-chain vote, and the outcome must pass through a public waiting period before execution, giving all stakeholders ample time to review the change and, if necessary, exit the system. At present, no platform in perpetual futures trading fully meets this standard; it represents the direction of the industry's evolution rather than a current reality.
The core insight of the verifiability ladder is this: for ordinary users who lack the technical ability to audit code, the advantage of "verifying code" over "trusting an institution" may be difficult to realize in practice; but for institutional investors with the requisite ability, verifiability offers a depth of due diligence that is impossible under the centralized-exchange model. Yet verifiability is a necessary but not sufficient condition for trust substitution: even if a system provides complete verification capability, information overload and interface complexity may leave most users with no willingness to verify, and the label "code audited" may instead create a false sense of security, so that "willingness to verify" systematically lags "ability to verify." As cryptographic technology and blockchain performance continue to improve, trading service providers keep climbing this ladder toward higher levels, converting ever more trust assumptions into deterministic logic provable by mathematics. This trend not only reshapes the competitive landscape of trading service providers but also fundamentally changes how trust is produced in financial infrastructure.
5.2 The functional-separation architecture of traditional finance
The architecture of traditional financial derivatives markets rests on an institutional foundation of functional separation. Brokers, exchanges, clearinghouses, and custodian banks each perform their own role, achieving risk isolation through physical and legal boundaries. This multi-layered intermediary architecture did not form overnight; it is the institutional accumulation of the lessons of two centuries of financial crises. Starting from the complete flow of a single futures trade, this section analyzes the institutional rationale and the efficiency cost of functional separation, together with the central counterparty's core role in managing systemic risk.
5.2.1 The multi-intermediary flow of a futures trade
The flow of a standardized futures trade through the traditional financial system is not completed within a single institution as a closed loop; it relies on a service network made up of several independent entities. Consider the example of a buy order in S&P 500 futures. The investor places a buy instruction with the futures commission merchant (FCM) that holds the account; after verifying that the client's margin is sufficient, the FCM routes the order to the electronic matching engine of the Chicago Mercantile Exchange (CME). The CME recorded an average daily volume of about 26.5 million contracts in 2024 [15], and its matching engine completes price-time-priority order pairing at the microsecond level. The instant the trade is struck, the CME's clearing division steps in as central counterparty, using novation to split the original buy-sell contract into two independent contracts: one between the buyer and the central counterparty, and one between the central counterparty and the seller. Thereafter the central counterparty computes daily profit and loss and collects margin, while the final transfer of funds is executed by an independent settlement bank, ensuring that client assets and the trading institution's own assets are strictly separated at the legal and physical levels.
Within this flow, each participating institution performs a distinct trust function. The FCM, acting as an agent, owes a fiduciary duty to the client and must place the client's interests above its own; this includes the duty of best execution—routing orders to the venue offering the best execution—and the risk-management responsibility of managing the client's margin account and issuing margin calls when necessary [3]. The FCM also performs a credit-intermediation function, extending leverage to clients and continuously assessing credit risk; when a client defaults, the loss is absorbed by the FCM rather than by the market as a whole, and this buffer prevents an individual default from transmitting directly to the systemic level. The exchange's core value lies in its neutrality: it does not trade, holds no positions, and merely provides a fair and transparent price-discovery venue; its revenue comes from fees rather than trading profits, and its rules and matching algorithms are publicly subject to regulatory review [3]. The central counterparty focuses on risk management, reducing total systemic exposure through multilateral netting and absorbing the default losses of individual members through the default-waterfall mechanism. The custodian bank stands apart from all trading activity; its sole responsibility is to safeguard client assets and to execute transfers of funds and securities on clearing instructions.
In this architecture, the broker sits at the client-interface layer, bearing fiduciary duty and performing credit intermediation; the exchange provides a neutral price-discovery venue at the matching layer; the central counterparty manages systemic default risk at the clearing layer; and the custodian bank ensures the legal segregation of client assets at the asset-safekeeping layer. Clear functional boundaries exist among the four layers, and the institutional barriers of functional separation among layers ensure that the failure of any single layer does not run straight through to the others (Figure 5-4).
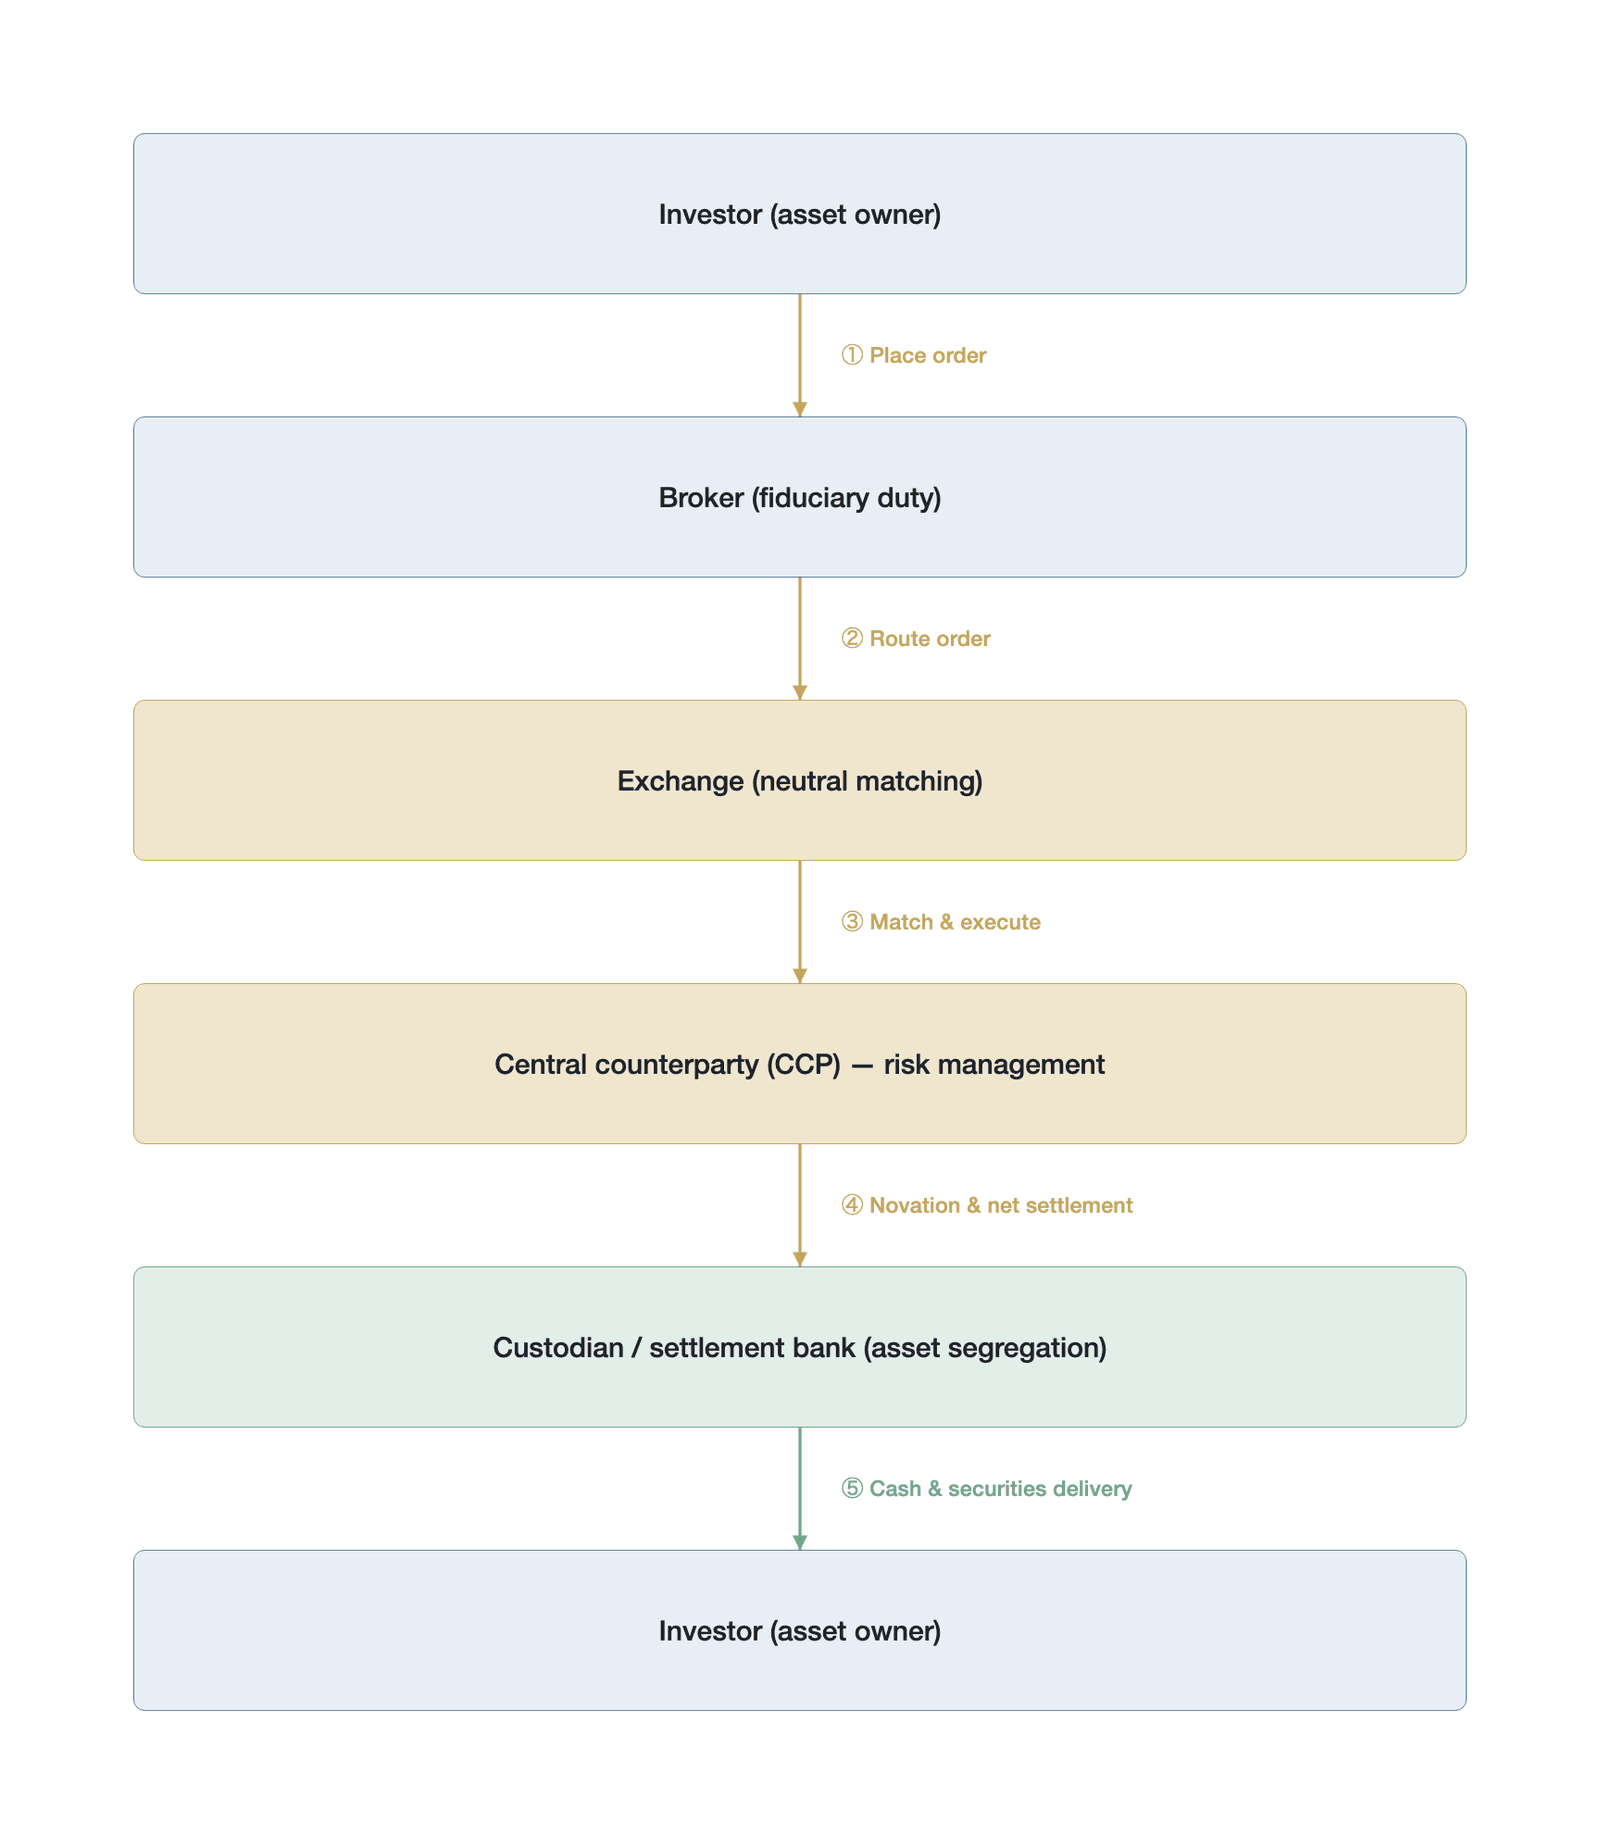
Figure 5-4. The functional-separation architecture of traditional financial service providers, by layer (conceptual architecture based on Harris's 2003 functional-separation framework, not empirical data; Data source: Harris's market microstructure framework [3])
This flow of business through at least four independent institutions in sequence generates time delays and friction costs at every handoff. The FCM collects a commission, the exchange collects a matching fee, the central counterparty collects a clearing fee, and the custodian bank collects a custody fee. On the surface, each layer of friction lowers the efficiency of capital turnover; at a deeper level, however, these are the costs necessarily paid to achieve risk isolation. The core purpose of this architecture is not to pursue the highest trading speed but to prevent the failure of a single node from triggering a global systemic collapse, through physical and legal boundaries. When an exchange converts from a membership-based mutual to a listed company, the tension between commercial interest and market-oversight duty grows increasingly acute; but the institutional framework of functional separation keeps that tension within a controllable range, rather than concentrating every role in one entity and turning conflicts of interest into a structural norm, as with the centralized cryptocurrency exchanges analyzed later.
5.2.2 The institutional rationale for functional separation
The current functional-separation architecture of traditional financial markets is the institutional accumulation of the lessons of two centuries of financial crises. In the early, unregulated markets, institutions that combined client custody, proprietary trading, and brokerage under one roof were common, but this model was repeatedly shown to be prone, under extreme market conditions, to the misappropriation of client assets or to an institution's own speculative losses spilling over onto innocent clients. The Glass-Steagall Act, passed in the United States in 1933, was precisely the legislative response to the systemic risk of the 1929 Great Depression, in which commercial banks used client deposits for speculative trading; the act legally mandated the separation of commercial banking from investment banking [16]. Notably, the Gramm-Leach-Bliley Act of 1999 partially repealed Glass-Steagall's separation requirement, allowing commercial and investment banking to reintegrate. This loosening is widely regarded as one of the institutional triggers of the 2008 global financial crisis, and after the crisis, calls to restore functional separation rose again. This repeated history confirms a core proposition: once the institutional barrier of functional separation is removed, systemic risk reaccumulates along the paths of conflict of interest. The legislative principle of Glass-Steagall was continually extended over the following decades to every part of the securities and derivatives markets, ultimately producing the current institutional configuration in which brokers, exchanges, clearinghouses, and custodian banks each perform their own role.
The institutional rationale for functional separation is expressed mainly along three mutually reinforcing dimensions: risk isolation, checks and balances, and auditability. Risk isolation ensures that the failure of a single institution does not directly destroy the whole system, with losses confined within that institution's functional boundary. The 1995 collapse of Barings Bank offers a classic case: the bank's head of derivatives trading and settlement in Singapore controlled both front-office trading and back-office settlement—two functions that should have been separated—and, absent independent oversight, accumulated hidden losses of up to £827 million, ultimately bankrupting a bank with 233 years of history [17]. The fundamental lesson of Barings is not the moral failing of a single trader but that the combination of functions eliminated internal checks and balances, allowing risk to swell to an irrecoverable scale before it was discovered. Checks and balances are achieved through mutual monitoring among different institutions: the FCM monitors the exchange's execution quality, the exchange is subject to review by regulators, and the central counterparty stands apart from commercial interests and focuses on risk management. As for auditability, each independently operating institution constitutes a clear audit node, and regulators can separately examine the custodian bank's asset reports and the central counterparty's risk models without confronting a single, highly complex, internally interconnected black box.
Fiduciary duty is the central legal cornerstone of the functional-separation architecture. In his classic market microstructure theory, Harris (2003) notes that brokers owe clients a strict fiduciary duty and must place the client's interests above their own [3]. This legal constraint requires the broker, as an independent credit intermediary, not to bet against its clients, thereby suppressing conflicts of interest at the root. The irreplaceability of fiduciary duty lies in the legal protection it provides to the weaker party in an agency relationship: when a broker breaches its fiduciary duty, the client can obtain redress through the courts. This legal constraint disappears entirely in the centralized-cryptocurrency-exchange model, because the exchange simultaneously plays the dual role of agent and trading counterparty, so that conflicts of interest are no longer occasional misconduct but a structural feature embedded in the business model.
Robustness rests on the premise that each participating institution operates independently within its functional boundary, with no cross-boundary interest linkages. The 2011 bankruptcy of MF Global offers a classic cautionary case: facing a liquidity crisis, this FCM improperly misappropriated nearly $1 billion in segregated customer funds to cover its own trading losses on European sovereign bonds [18]. An investigation by the U.S. Commodity Futures Trading Commission (CFTC) found that MF Global had systematically violated customer-fund segregation rules in the final week before its bankruptcy. This episode not only prompted regulators to comprehensively strengthen the customer-fund segregation regime for FCMs but also demonstrated that even within a functional-separation framework, once the bottom line of physical segregation is breached, systemic risk spreads quickly. Yet the MF Global episode also validated the resilience of the functional-separation architecture: because customer funds enjoy priority in bankruptcy under the law, the vast majority of customers ultimately recovered all their funds through the bankruptcy proceedings [18]—a marked contrast to the near-total inability to recover client assets in the centralized-cryptocurrency-exchange bankruptcies discussed later.
5.2.3 The CCP default waterfall mechanism
The central counterparty is the core hub for managing counterparty credit risk in traditional financial markets, and its operation rests on novation (see Chapter 1 for the discussion of the central counterparty and the default waterfall): once a trade is matched, the central counterparty steps in immediately and replaces the original buy-sell contract with two independent contracts to which it is the counterparty, so that the two sides need not assess each other's credit and need only trust the central counterparty's solvency. After the 2008 global financial crisis, the G20 leaders reached a consensus in 2009 requiring all standardized over-the-counter (OTC) derivatives to enter central clearing, establishing the central counterparty's systemically important status in the modern financial system [19]. In 2012, the Committee on Payment and Settlement Systems (CPSS) of the Bank for International Settlements (renamed the Committee on Payments and Market Infrastructures, or CPMI, in 2014) and the International Organization of Securities Commissions (IOSCO) jointly issued the Principles for Financial Market Infrastructures (PFMI), setting 24 international standards for the governance, risk management, and financial resilience of central counterparties worldwide [20].
The central counterparty sharply reduces total exposure within the system through multilateral netting, but it also concentrates counterparty credit risk on itself. To manage this highly concentrated risk, the central counterparty builds a multi-layered loss-absorption mechanism that follows the primary defaulter-pays principle and introduces mutual support only in extreme cases—the default waterfall. This is a five-layer structure that begins with the defaulting member's initial margin and proceeds layer by layer through default-fund contributions and the central counterparty's own capital up to recovery and resolution measures; see Chapter 1 for the discussion of the central counterparty and the default waterfall [21]. The third layer, the contribution of the central counterparty's own capital, is commonly referred to as skin in the game; it is intended to guard against the central counterparty's moral hazard and to ensure that it has sufficient incentive to maintain strict margin standards and prudent risk models. Every layer of the default waterfall is backed by explicit legal force and regulatory review; its parameters are public and transparent, adjustments require formal procedures, and users' rights enjoy legal protection.
The interplay of novation and the default waterfall constitutes the core process of central counterparty risk management: after a trade is matched on the exchange, the central counterparty steps in through novation to replace the original bilateral contract with two independent contracts to which it is the counterparty; thereafter, if one side defaults, the five layers of the waterfall are triggered in the predefined sequence until the loss is fully absorbed or a recovery mechanism is invoked (Figure 5-5).
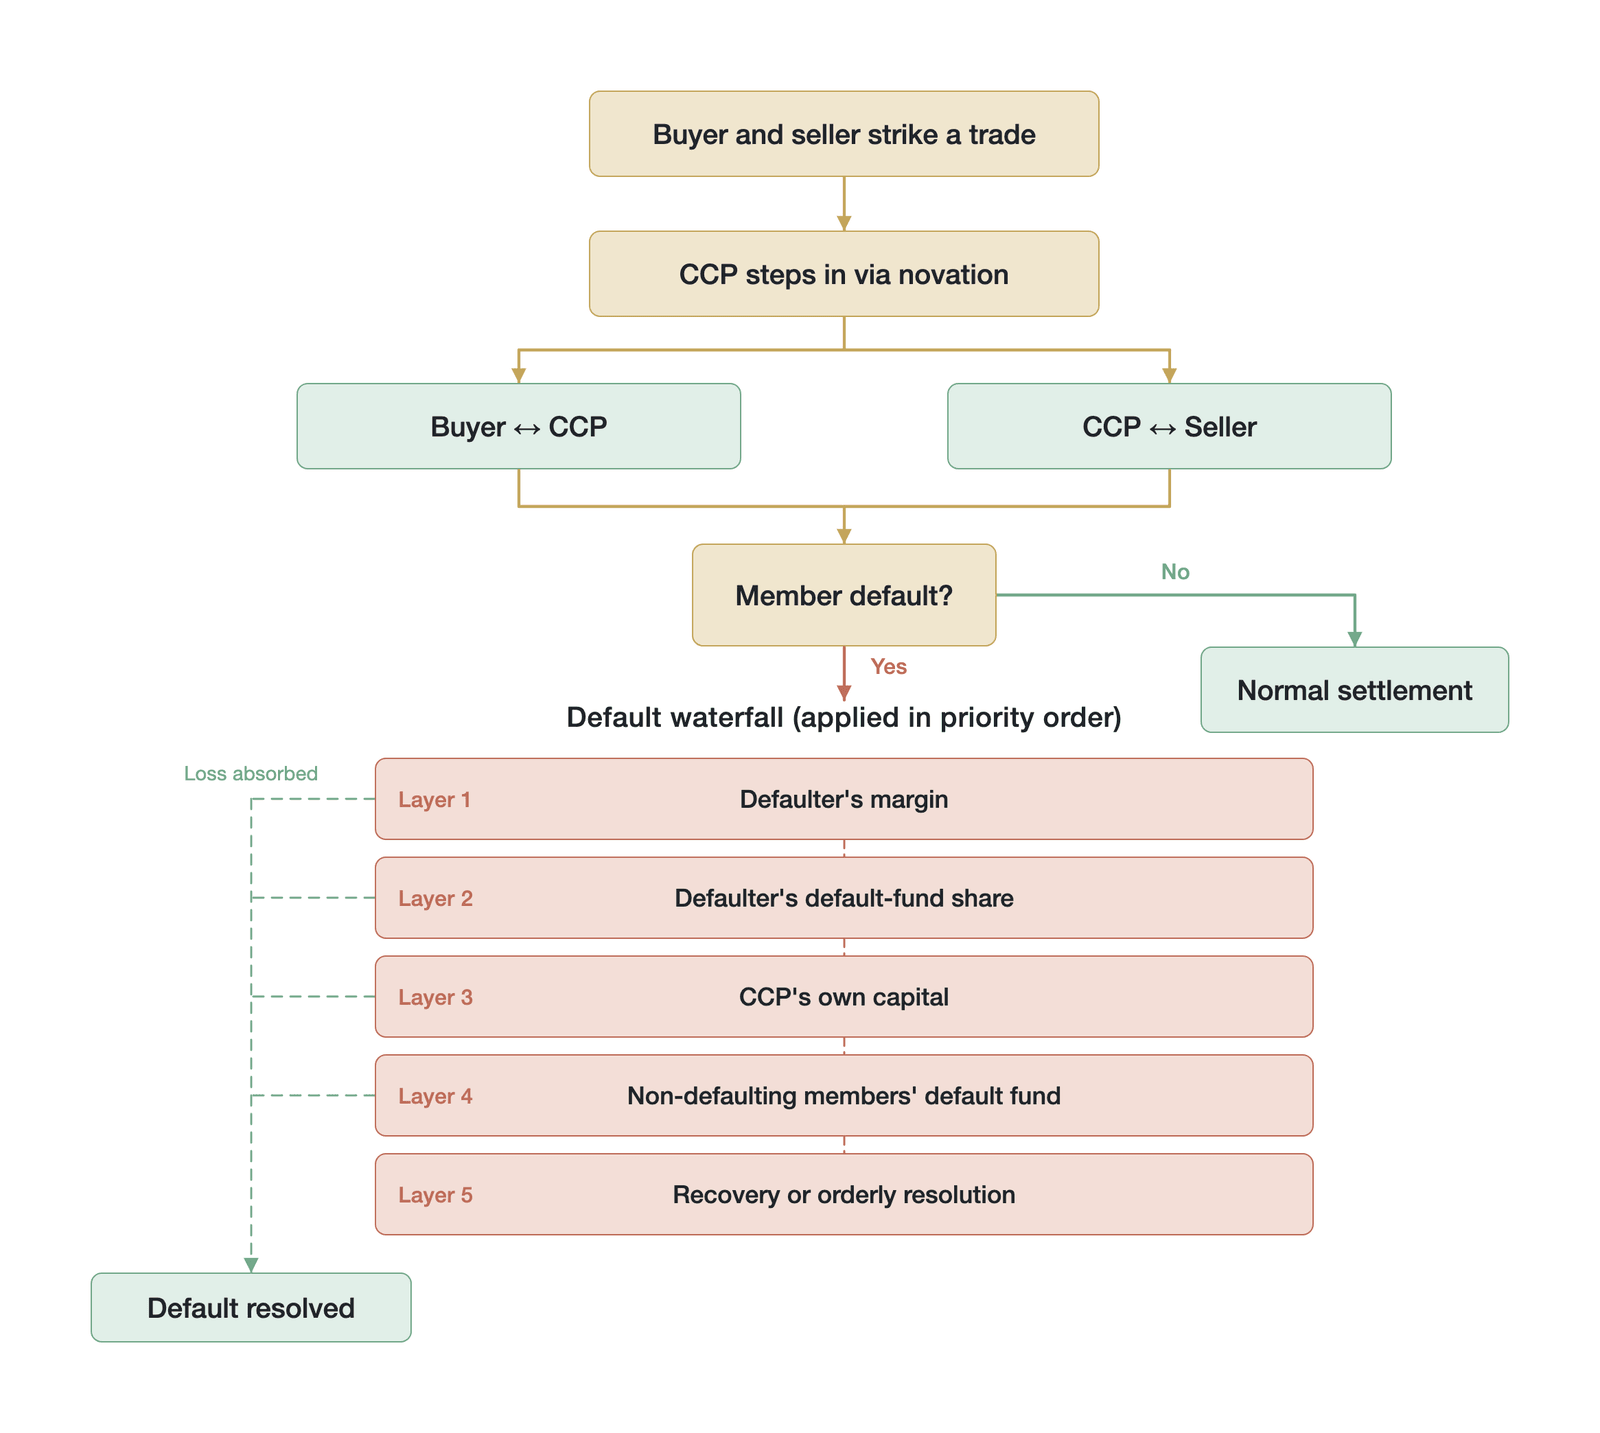
Figure 5-5. CCP novation and the default waterfall (mechanism flow based on the CPMI-IOSCO PFMI [20], not empirical data; Data source: CPMI-IOSCO Principles for Financial Market Infrastructures [20])
The effectiveness of the default waterfall depends heavily on the characteristics of the portfolio and on market-liquidity conditions. When Lehman Brothers failed in 2008, its interest rate swap portfolio cleared in London comprised 66,390 trades with a notional principal of as much as $9 trillion; but because the portfolio was relatively balanced and the interest rate swap market was highly liquid, the central counterparty consumed only about one-third of the margin and, within a few weeks, completed the hedging, auction, and transfer of the positions without inflicting any loss on other clearing members [21]. That success, however, depended on a special set of conditions: the interest rate swap market itself had ample liquidity; Lehman's portfolio was relatively balanced, which lowered the difficulty of hedging the net exposure; and the world's central banks injected large-scale liquidity into the market synchronously during the same period. These conditions do not hold in crypto perpetual futures markets: on-chain insurance funds are limited in size, liquidity can evaporate in an instant under extreme conditions, and no lender-of-last-resort role exists. The central counterparty's performance in the Lehman default was called an "unlikely hero" by Bell and Holden (2018) [21], because even under the extreme condition of a near-total freeze in bilateral markets, central clearing kept functioning normally.
The default at Nasdaq Clearing in Sweden in 2018, however, produced an entirely different outcome. On September 10, 2018, the Norwegian trader Einar Aas failed to meet a margin call from the commodities clearing division of Nasdaq Clearing and was promptly declared in default. Aas had bet that Nordic and German power prices would converge and held large power-futures positions on Nasdaq Oslo. Changes in weather forecasts and adjustments to German carbon-emissions policy drove the two regions' power prices sharply apart, causing the value of his positions to shrink dramatically. In the subsequent auction of the positions, the clearinghouse suffered losses exceeding the value of Aas's posted collateral by €114 million. Nasdaq Clearing's default waterfall was triggered in sequence: it exhausted all of Aas's margin, then drew on €7 million of the clearinghouse's own capital, and ultimately consumed most of the non-defaulting members' €166 million default fund [21]. Post-event analysis revealed that Nasdaq Clearing had granted Aas a correlation offset of up to 50% in its margin calculation and had not charged a concentration add-on margin on his oversized positions in the Nordic power market, even though that market's trading volume had shrunk substantially over the preceding decade [21]. The core lesson of the Aas episode is not simply that "the offset ratio was too high" but that concentration risk was not adequately priced and that correlation assumptions are fragile in tail events. This forms a direct analogy to the concentration risk of whale accounts in a single trading pair in crypto perpetual futures markets and to the fragility of cross-asset correlation assumptions under a unified-margin model.
These two default events, a decade apart, reveal the inherent tension of the central counterparty model: it can effectively manage dispersed, routine defaults, but when confronted with a highly concentrated, illiquid, and highly correlated portfolio, the very feature of risk concentration can turn it into a transmission node for systemic risk rather than a risk-isolation mechanism. The central counterparty has been given a larger systemic role in the post-crisis era, but this also means that its own failure would produce more severe systemic consequences—a paradox that remains one of the core issues in global financial regulation to this day.
5.2.4 The efficiency cost of functional separation
While the functional-separation architecture provides institutional safety, it inevitably sacrifices the efficiency of capital turnover. Because trade execution, clearing, and custody are handled by different institutions, synchronizing the system's state takes time, which manifests directly as the existence of a settlement cycle. The longer the settlement cycle, the larger the time window during which the two sides are exposed to counterparty-default risk and market-price risk before delivery is complete, and the greater the systemic margin required.
The evolution of the settlement cycle in U.S. securities markets reflects traditional finance's continual search for a new balance between safety and efficiency. Before 1995, the standard settlement cycle for U.S. securities was T+5—delivery completed on the fifth business day after the trade date. In 1995, the U.S. Securities and Exchange Commission (SEC) shortened the cycle to T+3 through Rule 15c6-1. In 2017, the rule was amended again, compressing the cycle to T+2. On May 28, 2024, the U.S. market formally transitioned to a T+1 settlement cycle [22]. Each compression of the cycle was accompanied by large-scale infrastructure upgrades and industry coordination—from the digitization of paper certificates to the automation of trade-confirmation processes to the standardization of cross-time-zone settlement instructions.
An after-action report jointly issued by the Investment Company Institute, the Securities Industry and Financial Markets Association, and the Depository Trust & Clearing Corporation shows that after T+1 took effect, the National Securities Clearing Corporation's clearing fund fell from an average of $12.8 billion under T+2 to $9.8 billion, a reduction of 23%, meaning that about $3 billion of capital was released from margin [22]. On settlement quality, the continuous net settlement (CNS) fail rate on the first day of T+1 was 1.90%, below the 2.01% average for May under the earlier T+2 regime; by July 2024, the average fail rate had stabilized at 2.12%, essentially unchanged from the T+2 period [22]. Trade-confirmation efficiency also improved markedly: nearly 95% of trades were confirmed before 9 p.m. on trade date, up from just 73% in January 2024 [22]. These data indicate that, under a multi-layered intermediary architecture, further compressing the time window did not significantly degrade settlement quality—but the scale of margin released also reveals just how large the loss of capital efficiency had been from funds previously locked up by settlement delay.
Although the T+1 reform achieved initial success, the advance of traditional financial infrastructure toward T+0 faces significant technical and institutional obstacles. The inherent contradiction of a multi-layered architecture is that each additional layer of independent intermediary, while enhancing risk isolation, multiplies the coordination complexity of information reconciliation and fund transfer. Under T+0, trade and settlement must occur almost simultaneously, which requires instantaneous data consistency and fund availability among brokers, exchanges, clearinghouses, and custodian banks. Industry reports make clear that pushing T+0 directly within the existing functional-separation framework is not a simple next step but requires a comprehensive, independent assessment of the entire market structure, because the disappearance of the time buffer could trigger large-scale liquidity shortfalls and settlement failures [22]. Traditional financial-infrastructure institutions have begun actively exploring blockchain technology for a breakthrough: the Depository Trust & Clearing Corporation's Project Ion completed a proof of concept in 2021 for T+0 settlement supported by distributed ledger technology (DLT) [23] and has since continued to advance pilots for the tokenization of digital assets, seeking to use atomic settlement to eliminate the risk created by the settlement cycle itself while preserving the advantages of functional separation.
Every increment of safety comes at the cost of some sacrifice in efficiency. When the institutional barrier of functional separation is viewed as a structural constraint impeding gains in capital efficiency, concentrating all authority in a single entity to achieve instantaneous settlement on an internal ledger becomes a commercially attractive alternative. This pursuit of efficiency is the core logic behind the rise of centralized cryptocurrency exchanges, and the structural consequences they bring form the starting point for the next section's analysis.
5.3 The functional bundling of centralized exchanges
The business model of centralized exchanges is rooted in bundling within a single entity the functions that traditional finance keeps separate. Section 5.2 analyzed how traditional finance manages conflicts of interest and systemic risk through functional separation; centralized exchanges represent the diametrically opposite architectural choice. This bundling brings substantial efficiency gains that have made centralized exchanges overwhelmingly dominant in the crypto-derivatives market, but it also creates an ineliminable hidden cost—the concept of the "bundling tax" introduced in this chapter. The bundling tax is the service-provider-level mirror of the "trust tax" from Chapter 1 (elaborated in Section 5.3.2) and is likewise the key to evaluating the relative merits of different service-provider architectures.
5.3.1 The CEX's bundling of five roles
The architecture of traditional financial markets rests on a strict separation of functions. As Section 5.2 described, the broker handles the client interface and owes the client a statutory fiduciary duty, the exchange provides a neutral matching venue and does not participate in trading, the market maker independently supplies liquidity and bears inventory risk, the clearinghouse manages systemic default risk as central counterparty, and the custodian stands apart from trading activity to ensure the safe segregation of client assets [3]. The separation of these five roles is not a waste of efficiency but the institutional accumulation of two centuries of financial-crisis lessons, and its core design principle is to disperse power so that the failure of any single institution is confined to a limited scope.
Centralized exchanges fundamentally alter this architecture by integrating the above five roles into a single, highly integrated technical and commercial entity. Under this model, a centralized exchange not only provides the trading interface and the matching engine but also directly controls the custody of client assets, performs clearing and settlement internally, and, in many cases, acts as the largest market maker on its own platform through a proprietary trading desk or affiliated parties. Dell'Erba (2024) [6] defines this architecture as a "full-service business model" and argues that it creates "unprecedented conflicts of interest." Such a high concentration of functions means that effective information barriers are difficult to establish in practice. An exchange operator can, in theory and in practice, exploit its advantage of seeing client order flow first to front-run, lend client funds from custody wallets to its proprietary market-making desk, adjust liquidation parameters to protect affiliated parties' positions, or handle liquidation orders in ways unfavorable to clients during market swings. These are not purely theoretical conjectures but facts repeatedly demonstrated in crypto markets.
The scope of this bundling can be grasped by comparing it, role by role, with the five independent roles of traditional finance. The broker's fiduciary duty is compressed into a user agreement for the account system; the exchange's neutral matching is folded into an engine the platform itself controls; the market maker's independence gives way to a proprietary trading desk; the clearinghouse's independent risk control becomes an internal module; and the custodian's asset segregation becomes internal bookkeeping within the platform's wallet system. Table 5-1 lays out these five pairings and the original institutional intent behind each.
| Independent role in traditional finance | Counterpart in the CEX | Original intent of functional separation |
|---|---|---|
| Broker | Account system and user interface | Bears a fiduciary duty and acts in the client's interest |
| Exchange | Internal matching engine | Remains neutral and does not participate in trading |
| Market maker | Proprietary market making or affiliated parties | Independent of the exchange, preventing information abuse |
| Clearinghouse | Internal clearing and risk engine | Maintains independent risk management, free from commercial interests |
| Custodian | Hot/cold wallet system controlled by the exchange | Independent of trading activity, ensuring the safe segregation of assets |
Table 5-1. Mapping between traditional finance's functional separation and the centralized exchange's role bundling (Data source: theoretical frameworks based on Harris 2003 and Dell'Erba 2024 [3][6])
This mixing of roles is not an accidental technical lapse but a structural choice through which centralized exchanges gain competitive advantage. Binance, for example, in September 2022 automatically converted competing stablecoins held by customers—USDC, USDP, and TUSD—into its own stablecoin, BUSD, a move that pushed BUSD's market capitalization to $20.5 billion [6]. This case clearly shows how a platform can use its dual identity as both custodian and exchange to reinforce its own commercial interests—behavior that would be impossible under traditional finance's functional-separation architecture. An industry that flies the banner of "decentralization" has in fact produced intermediaries more centralized than those of traditional finance, forming what Yadav (2023) [7] describes as the "centralization paradox." As of 2023, the vast majority of cryptocurrency users—an estimated 90%—chose custodial platforms over self-custody solutions [7]. This figure should not be read simply as users' rational preference for efficiency. A behavioral-finance perspective reveals more complex drivers: status quo bias inclines users who registered early on centralized platforms to stay put, complexity aversion leads nontechnical users to instinctively avoid the cognitive burden of private-key management and smart-contract interaction, and the brand marketing of leading exchanges manufactures a "sense of safety" that may lack substantive basis. Distinguishing a "rational preference for efficiency" from "path dependence driven by cognitive bias" is essential for assessing the true market potential of on-chain alternatives.
When five roles are combined in one entity, conflicts of interest are no longer occasional; they become an intrinsic property of the architecture. Between the custody function and proprietary trading lies a structural incentive to misappropriate funds; between the matching engine and the market-making desk lies a channel for abusing the informational advantage of order flow; and between the clearing function and affiliated parties lies the possibility of parameter manipulation. Multiple conflict paths crisscross one another, forming a self-reinforcing network of bundled interests—precisely the core mechanism by which functional bundling turns occasional risk into structural risk (Figure 5-6).
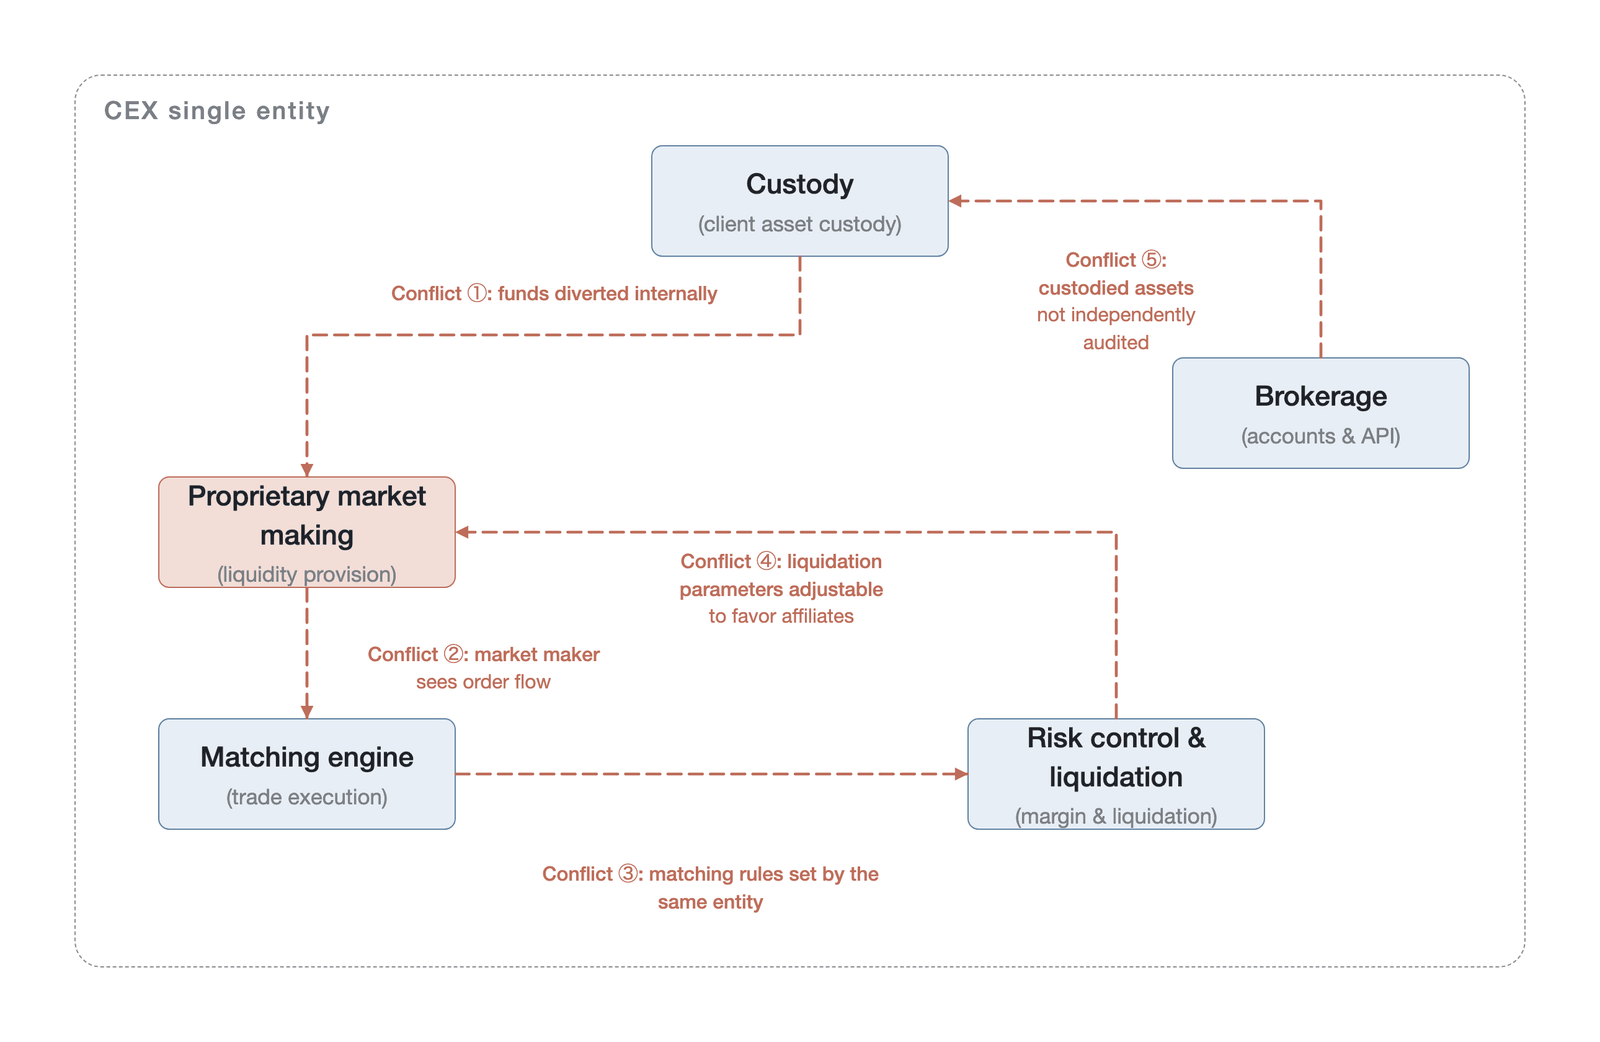
Figure 5-6. Internal functional bundling and conflict-of-interest mapping within a centralized exchange (conceptual conflict-of-interest diagram; edges denote mechanistic relationships, not measured magnitudes; not empirical data; Data source: based on Dell'Erba's 2024 conflict-of-interest analysis [6])
5.3.2 The definition and composition of the bundling tax
A direct consequence of the function-bundling architecture is a systematic hidden cost. Centralized exchanges achieve extremely high trading efficiency by eliminating the friction of cross-institutional coordination, but this efficiency is not without cost. Traders in fact pay a structural risk premium for this convenience, which this chapter defines as the "bundling tax."
The bundling tax is the structural risk cost that users pay for the efficiency and convenience of centralized exchanges, and it consists of three inseparable parts. The opacity cost is the first component; it arises because users cannot independently verify the true safety of their assets, the fairness of order execution, or the effectiveness of the risk-control mechanism. In a centralized exchange's closed system, users can only rely on trust in the exchange operator and cannot verify key parameters for themselves as they could when auditing on-chain smart contracts. FTX before its collapse was the extreme embodiment of this opacity, as revealed by the bankruptcy trustee's statement cited at the opening of this chapter—the complete failure of control and the absence of trustworthy information [2]. The conflict-of-interest cost is the second component; it arises because a single entity simultaneously controls custody, execution, and clearing—three core functions that should check one another. When the exchange is at once the rule-maker and the rule-enforcer, at once the custodian of client assets and the largest participant in the market, both the motive and the ability to favor itself are present. Traditional finance suppresses such conflicts of interest through statutory fiduciary duty and independent regulatory review [3], but in the bundled architecture of a centralized exchange these checks are structurally absent. The single-point-of-failure cost is the third component, and the most easily overlooked. When all core functions are concentrated in one entity, a technical fault, management error, or external attack at any single link immediately spreads to and paralyzes the entire system. In traditional finance, even if one broker fails, client assets remain safely held at an independent custodian and the operation of the exchange and clearinghouse is unaffected. In a centralized exchange, this risk isolation is entirely absent.
Conceptually, the bundling tax can be expressed as a function of three components: , where , , and denote the opacity cost, the conflict-of-interest cost, and the single-point-of-failure cost, respectively. Each component can be approximated through proxy variables: proxies for include the frequency with which proof of reserves is published and the share of on-chain-verifiable assets; proxies for include the degree of disclosure of related-party transactions and the presence or absence of liquidation-exemption clauses; and proxies for include the scale of historical security incidents and the concentration of assets under custody. Notably, the relationship among these three cost components is not simply additive but multiplicatively interactive. (opacity) is the enabling condition for (conflict of interest): only in an environment that outsiders cannot observe can a conflict of interest be systematically exploited. This implies that the optimal strategy for lowering the bundling tax should target opacity first, because greater transparency simultaneously narrows the exploitable space for conflicts of interest. Although this framework has not yet developed into a precise quantitative model, it provides an analytical basis for comparing structural risk across different exchanges.
All three components have already produced serious consequences in reality. The opacity cost manifested in the FTX case as the absence of externally verifiable financial information before the collapse; the conflict-of-interest cost manifested in Alameda Research obtaining a liquidation-exemption privilege and misappropriating $8.7 billion in client funds; and the single-point-of-failure cost was concentrated in the $1.5 billion Bybit theft (Figure 5-7).
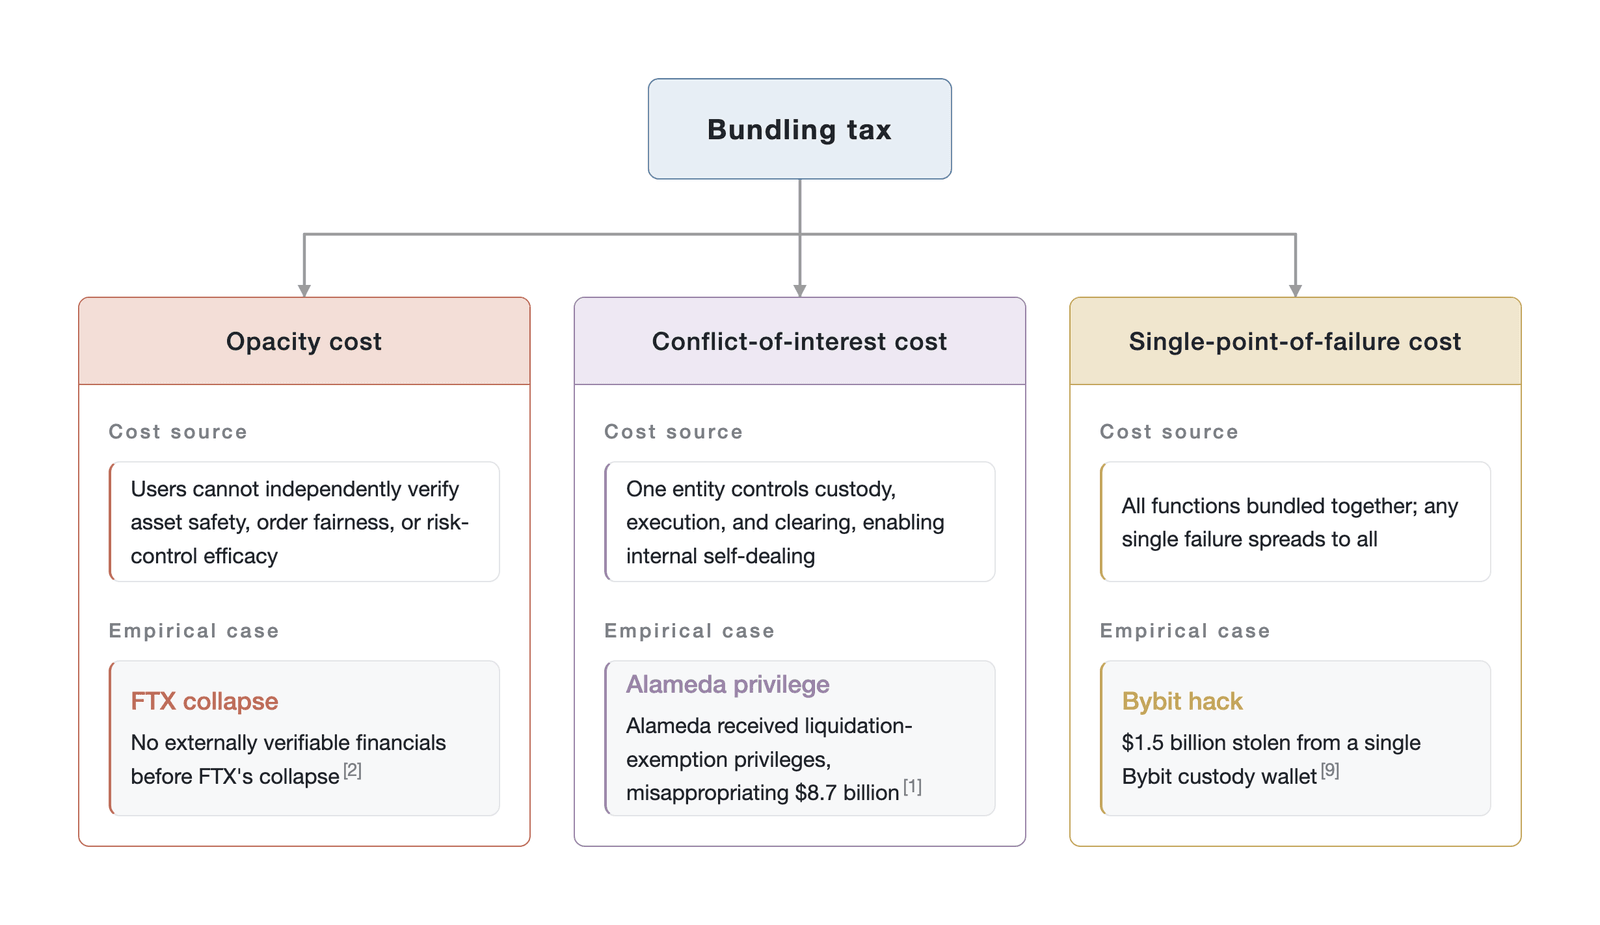
Figure 5-7. The three components of the bundling tax and their empirical cases (Data source: CoinDesk's report on FTX customer liabilities [1], FTX bankruptcy filings [2], and the Wilson Center security report [9])
The bundling tax forms a structural correspondence with the "trust tax" discussed in Chapter 1. Through mandatory functional separation, traditional finance makes traders pay a "trust tax"—high intermediation fees, long settlement cycles, and strict barriers to access—in exchange for the safety of the system and the suppression of conflicts of interest. Centralized exchanges eliminate most of the "trust tax" through functional bundling, achieving a millisecond-level trading experience and near-zero barriers to market access; but the resulting "bundling tax" requires traders to bear three structural risks: opacity, conflict of interest, and single points of failure. The two are the two ends of the same trade-off, and no cost-free architectural choice exists. This tax cannot be fully eliminated through compliance reviews or technical upgrades alone, because as long as the exchange simultaneously controls the private keys to client assets and the matching engine for trade execution, the technical possibility of evading external audit always remains. On the verifiability ladder defined in Section 5.1, a centralized exchange can at most reach the L1 level of "attested verifiability" by publishing proof of reserves and similar attestations, but it is structurally unable to rise to L2 or above, the "partially verifiable" level.
5.3.3 The efficiency advantages of the bundling model
Despite the significant structural risk the bundling tax entails, centralized exchanges still dominate the crypto-derivatives market. In 2024, the top 10 centralized exchanges recorded $58.5 trillion in total perpetual futures volume, double the $28 trillion of 2023 [4]. The fourth quarter of 2024 alone reached $21.2 trillion in volume [4]. This market dominance is no accident; its economic roots lie in the three efficiency advantages created by functional bundling and the powerful network effects that follow.
The first efficiency advantage of centralized exchanges comes from internal-ledger settlement. In traditional finance, a futures trade from order to final settlement must pass in sequence through the broker, the exchange, the clearinghouse, and the custodian bank, and every cross-institutional handoff of information inevitably generates time delays and coordination costs. Centralized exchanges compress these stages within a single unified technology stack, turning settlement essentially into a numeric update in a centralized database and thereby reducing trading latency to the millisecond level, which supports high-frequency trading strategies and complex algorithmic execution. Traditional finance's multi-institution architecture physically cannot match this internalized coordination efficiency.
A unified liquidity pool constitutes the second efficiency advantage. The buy and sell intentions of all users converge in a single order book, maximizing liquidity depth. Deep liquidity directly lowers the bid-ask spread that traders face and the price impact of executing large orders, which has a direct bearing on the institutional traders and high-frequency market makers analyzed in Chapter 4. By contrast, on-chain protocols' liquidity is dispersed across different blockchains and protocols, producing a fragmented market. Yet a unified liquidity pool can also become a source of risk concentration under extreme conditions: when a single asset undergoes large-scale liquidation, the loss can consume the shared insurance fund and affect the safety margin of all trading pairs.
A minimalist user experience is the third efficiency advantage. Users need not manage complex private keys or seed phrases, need not understand the gas-fee mechanism and transaction-confirmation process of the underlying blockchain, and can begin trading with only an email address. This low-barrier design significantly expands the pool of potential users, so that crypto-derivatives trading is no longer confined to technically capable early adopters.
Together, these three advantages form a powerful positive feedback loop of network effects. Abundant liquidity attracts more traders, the concentration of traders in turn attracts market makers to offer narrower bid-ask spreads, and better quotes further lower trading costs and attract still more volume. This self-reinforcing loop makes the market position of leading centralized exchanges hard to shake. Even though a market leader such as Binance saw its perpetual futures market share fall from 43% to 34% in 2024, the lost share was absorbed mainly by other centralized exchanges rather than flowing to on-chain protocols [4]. These data indicate that although competition among centralized exchanges is fierce, the dominance of the bundling model as an architectural paradigm has not been substantively challenged.
5.3.4 Comparing the CEX and CCP risk waterfalls
Clearing and risk management are among the core functions of a trading service provider. In designing their risk-defense mechanisms, centralized exchanges have borrowed heavily, in form, from the default-waterfall model of the central counterparty in traditional finance, but fundamental differences remain in the substance of legal constraint, transparency, and user protection. A precise comparison of the two waterfalls helps reveal the structural defects of a centralized exchange's risk-management system.
As Section 5.2.3 described, the central counterparty's default waterfall is a legally binding, multi-layered defense system. Data from Paddrik and Zhang (2020) [5] show that, in credit central counterparties, the defaulting member's initial margin accounts for about 77.9% of the waterfall's total resources and the central counterparty's own capital for about 2.0%. Every parameter setting, trigger condition, and loss-sharing rule of the waterfall is disclosed in advance and subject to mandatory review by financial regulators [20].
A centralized exchange's risk waterfall mimics this structure in form but differs fundamentally on three key dimensions. On transparency, a centralized exchange sets its margin parameters unilaterally and can adjust them at any time, and the adjustment history is usually not disclosed; the size, funding source, and specific use of the insurance fund often cannot be independently verified from the outside. On legal constraint, a central counterparty's capital adequacy, risk models, and default-handling procedures are bound by statutory regulatory requirements, whereas a centralized exchange in most jurisdictions lacks statutory obligations of comparable rigor. On user protection, a central counterparty's non-defaulting members enjoy loss-sharing rules disclosed in advance and statutory recovery procedures, whereas a centralized exchange's users, when the platform goes bankrupt, can usually participate in bankruptcy proceedings only as general unsecured creditors, ranking behind secured creditors. This generalization, however, is subject to significant cross-jurisdictional variation: in the FTX bankruptcy, convenience-class creditors (with claims below $50,000) ultimately received a recovery of about 119% on their dollar-denominated claims, but claims were fixed at their U.S.-dollar value as of the November 2022 filing date, so customers did not capture the subsequent appreciation of crypto assets, and the portion above 100% came from principal plus roughly 9% statutory interest and recoveries from the bankruptcy estate. The Mt. Gox case in Japan, by contrast, achieved an in-kind (BTC) distribution through civil rehabilitation proceedings, giving customers procedural treatment different from a fixed dollar claim. A blanket "unsecured creditor" judgment may understate the differences in user protection across legal systems.
The risk waterfalls of the three architectures differ fundamentally in their enforcement guarantees: the central counterparty's waterfall is legally binding, and the trigger conditions and loss-sharing rules of each layer are subject to regulatory review and disclosed in advance; a centralized exchange's waterfall is merely asserted by the platform, and its parameter settings and adjustment history are invisible to outsiders; and an on-chain protocol's waterfall is enforced by smart-contract code, with rules hard-coded and auditable by anyone. The three are highly similar in the formal design of their waterfall layers, but the nature of their enforcement guarantees produces a sharp contrast among four modes—legal mandate, platform attestation, code enforcement, and code enforcement with governance override (Figure 5-8)—which is precisely the key variable determining whether a waterfall can be faithfully executed in a moment of crisis. The fourth mode, code enforcement with governance override, refers specifically to the emergency governance-intervention capability that on-chain protocols retain on top of automatic smart-contract execution. When an extreme event exceeds the handling range of the code's preset parameters (such as the JELLY incident analyzed in Section 5.4.4), validators or governance-token holders can override the code logic through a consensus vote. The conditions for such override capability include a validator set small enough for rapid coordination, governance power that is not fully decentralized, and the absence of an on-chain time-lock constraint on emergency intervention. Its trigger threshold is usually the critical situation in which the insurance fund faces depletion or the protocol's solvency is threatened.
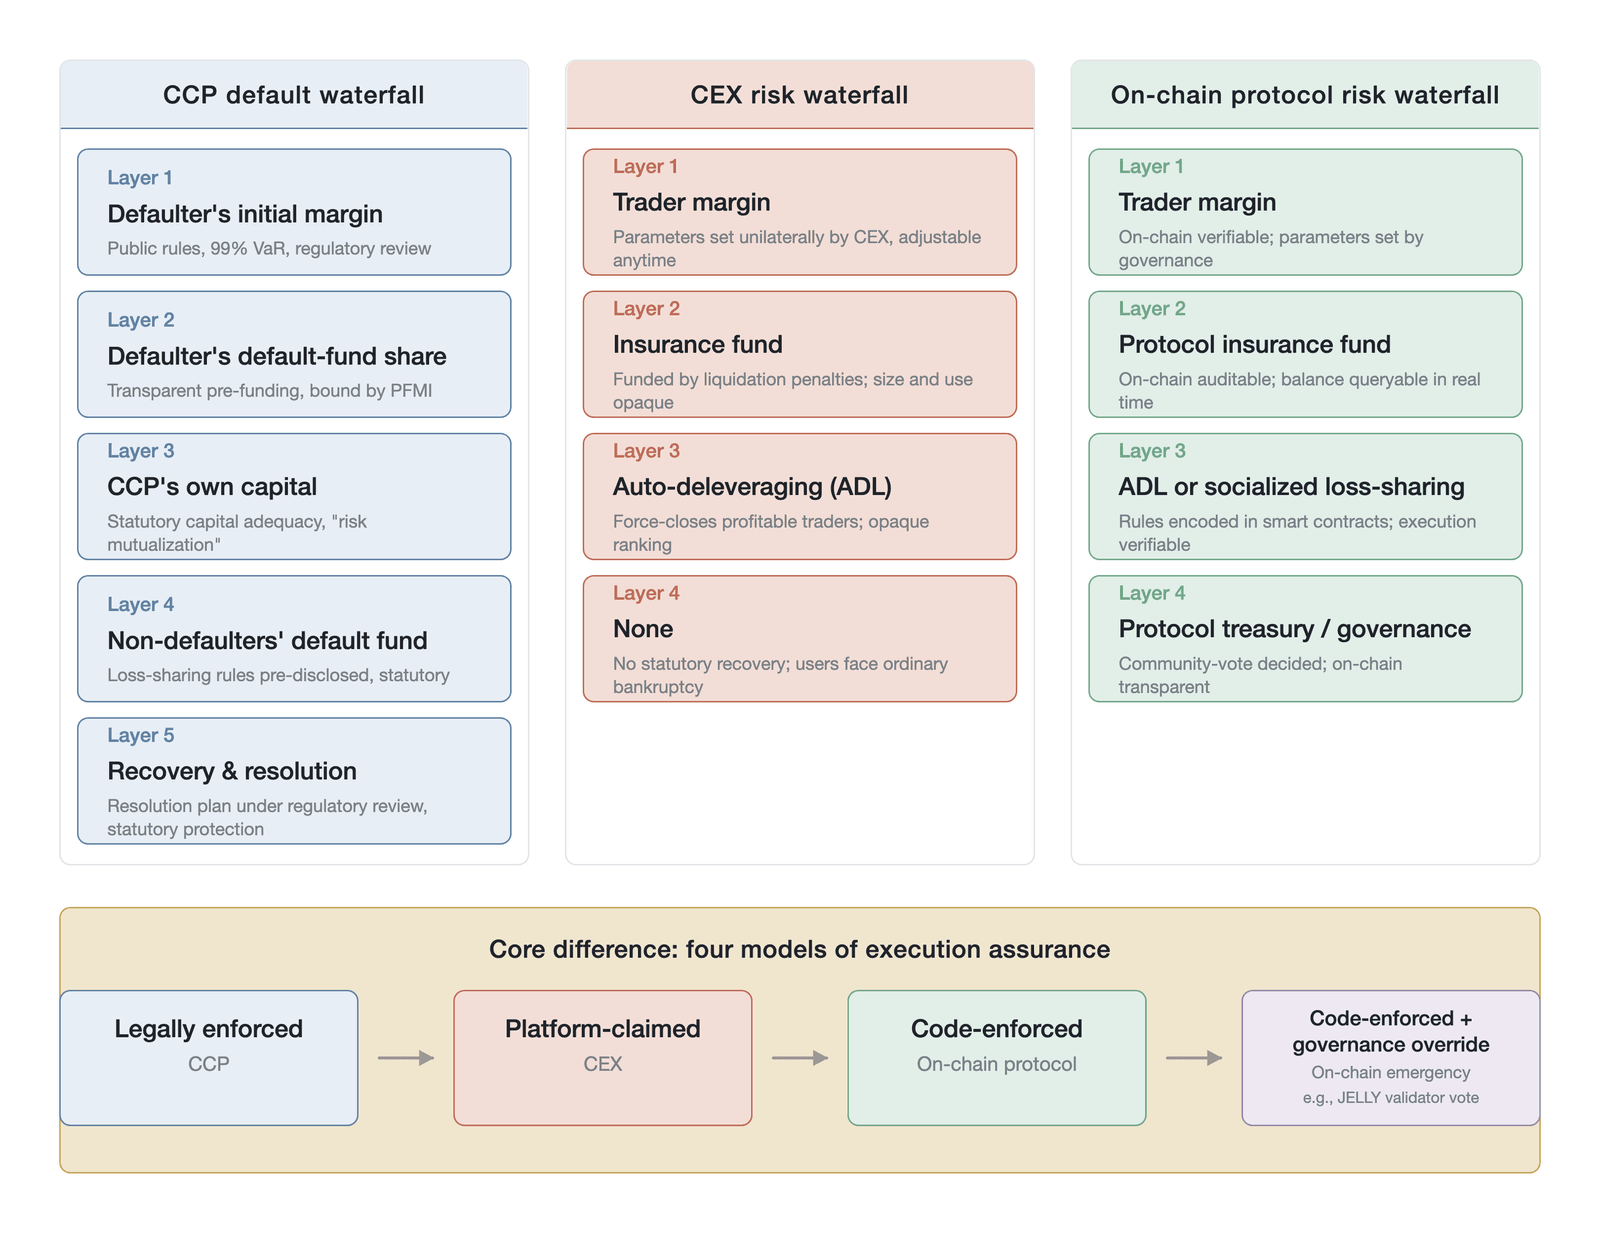
Figure 5-8. A comparison of the risk waterfalls of the central counterparty, the centralized exchange, and on-chain protocols (conceptual comparison of mechanism structures; the waterfall layers and the "99% VaR" follow the CPMI-IOSCO PFMI [20], not empirical data; the 77.9%/2.0% figures from [5] appear in the text, not the figure; Data source: Paddrik & Zhang 2020 [5] and the CPMI-IOSCO Principles [20])
Under normal market conditions, the differences among the three modes of legal mandate, self-attestation, and code enforcement may not be obvious, because the first few layers of the waterfall are usually enough to absorb everyday trading losses. In a moment of crisis, however, when extreme volatility causes systemic shortfalls, a centralized exchange that lacks statutory recovery procedures and transparent loss-sharing rules often leaves users facing an unpredictable allocation of losses. When the insurance fund is exhausted, a centralized exchange usually resorts to auto-deleveraging, forcibly closing the positions of profitable users to make up the loss gap—and the specific algorithm and execution details of this ranking mechanism likewise lack transparency.
5.3.5 The limits of proof of reserves
To ease users' concerns about the opacity cost, centralized exchanges widely introduced proof-of-reserves mechanisms after FTX's collapse. Both academic research and industry practice, however, indicate that proof of reserves has fundamental limitations in addressing the structural risk created by functional bundling.
The core defect of proof of reserves is that it can provide only a point-in-time snapshot of assets and cannot guarantee that assets have not been misappropriated or put to other uses during the audit interval. More critically, proof of reserves usually shows only the on-chain asset balances the exchange controls and cannot effectively reveal its hidden liabilities, complex related-party transactions, or off-balance-sheet commitments. Research by Vidal-Tomás (2025) [14] further points out that, to maintain solvency under extreme market stress, centralized exchanges in fact need to hold additional reserves of 6% to 14% above their liabilities. The study also finds that, among all exchange-bankruptcy events, the collapses of FTX and Celsius had the most significant negative impact on the stability of the entire centralized-exchange market [14], indicating that the failure of a single large exchange has a systemic contagion effect. In the highly opaque system of a centralized exchange, the capacity for external audit faces an unbreakable ceiling—not because audit technology is insufficiently advanced but because the function-bundling architecture itself makes it inevitable. When the audited party simultaneously controls the assets being audited and the system that generates the audit data, the independence of the audit cannot be guaranteed as a matter of logic.
In the face of these structural risks, regulators worldwide have begun to adopt more systematic responses. The European Union's Markets in Crypto-Assets Regulation (MiCA), which took full effect on December 30, 2024, requires crypto-asset service providers to obtain a license and to comply strictly with requirements on client-asset segregation, conflict-of-interest disclosure, and capital adequacy [24]. Notably, MiCA excludes crypto derivatives such as perpetual futures from its direct scope, placing them under the Markets in Financial Instruments Directive (MiFID II); this means that perpetual futures trading in the EU is in fact subject to the regulatory framework for traditional derivatives rather than a dedicated framework for crypto assets. MiCA's Article 70, on the general safekeeping of clients' crypto-assets and funds, poses a direct challenge to the function-bundling model, requiring exchanges to separate client assets from their own assets at the legal and operational levels. This regulatory framework, however, runs into an enforcement dilemma when confronting on-chain protocols: when the "service provider" is a set of validator nodes distributed around the world rather than a registered legal entity, the licensing regime and compliance requirements lack a clear point of enforcement. The U.S. Securities and Exchange Commission has also launched enforcement actions against several leading centralized exchanges. These regulatory measures have, to a considerable degree, raised the legal cost of exchange misconduct, but Dell'Erba (2024) [6] warns that the effectiveness of traditional financial regulation depends heavily on the clear regulatory entry points that the functional-separation architecture provides. When all functions are concentrated inside one entity, regulators are in effect trying to supervise a complex, opaque, closed system from the outside. Merely adding compliance requirements without structurally unbundling the centralized exchange's functions may amount only to "adding more layers on an unstable foundation" [6]. A compliance framework can raise the legal cost of wrongdoing but cannot eliminate the technical possibility of wrongdoing at the base layer. On the verifiability ladder, this means that regulation can help a centralized exchange rise from L0 to L1 but cannot push it across to the verifiable levels of L2 and above.
5.3.6 The FTX and Bybit failure cases
The fragility of the centralized exchange's function-bundling model has already been validated in reality along two distinct paths: one the complete collapse of internal governance, the other the failure of external technical defenses. These two paths respectively represent the extreme realization of the conflict-of-interest cost and the single-point-of-failure cost within the bundling tax, and together they prove that the architecture's structural risk is not an accidental, isolated case.
The extreme case of internal-governance collapse is FTX's bankruptcy. On November 11, 2022, FTX filed for bankruptcy protection, and subsequent investigation revealed that it had misappropriated about $8.7 billion in client funds [1]. These funds were used to cover trading losses at the affiliated market maker Alameda Research, to fund personal loans to executives, and to purchase luxury real estate. Using its dual identity as both matching-engine operator and risk manager, FTX granted Alameda Research the privilege of exemption from automatic liquidation at the level of code, allowing it to maintain enormous positions without sufficient collateral. The essence of this episode is that functional bundling turned all of the exchange's core functions—custody, clearing, and risk control—into tools serving the interests of an affiliated party. Functional bundling made misappropriation technically trivial, because the same entity that controlled the matching engine also controlled the private keys to client assets; the absence of independent external oversight kept the misappropriation undiscovered for a long time, because no independent third party could verify the true state of the assets; and the temptation of billions of dollars in commercial gain made the misappropriation almost inevitable in motive. The FTX case proves that relying on a centralized exchange's self-restraint to manage conflicts of interest is entirely unworkable.
The archetype of technical fragility is the hack Bybit suffered on February 21, 2025. Because the exchange used a centralized-custody model, a vast quantity of client assets was concentrated in a wallet system controlled by a single entity, an architecture that made it a target with high expected returns. The North Korea-linked Lazarus Group, through months of social-engineering infiltration and malware deployment, successfully breached the exchange's internal security defenses and stole about $1.5 billion in digital assets [9]. Specifically, the attackers used a supply-chain attack to infiltrate the signing interface of a multi-signature cold-wallet solution, so that what the signers saw visually was a normal transaction while what they actually signed was a malicious transfer instruction. This attack vector reveals that the real security boundary of a multisig scheme is far lower than its theoretical expectation: when the signing device or interface is compromised, the numeric threshold of the multisig becomes meaningless. Notably, the same attack vector applies equally to multisig governance wallets in DeFi protocols, and the claim that "self-custody eliminates custody risk" must be re-examined in the face of supply-chain attacks. The stolen funds were then dispersed within the first 48 hours across dozens of wallet addresses each holding about 10,000 ETH and were further laundered in layers through decentralized exchanges, cross-chain bridges, and mixers [9], using decentralized exchanges to swap assets and evade freezing. Addresses associated with the Lazarus Group appear on the sanctions list of the U.S. Treasury's Office of Foreign Assets Control (OFAC), which poses a compliance challenge for the entire on-chain ecosystem; the Tornado Cash sanctions precedent shows that decentralized protocols that interact with sanctioned addresses may themselves face regulatory risk. This was the largest crypto theft up to that time, and its scale further confirms the structural fragility of the centralized-custody model: under this architecture, the defender must maintain a perfect defense against every attack, while the attacker need succeed only once to inflict a major, irreversible loss. However much an exchange invests in internal security, the very fact that a vast quantity of assets is concentrated under the control of a single entity constitutes an ineliminable systemic risk.
Whether FTX's internal corruption or Bybit's external breach, the root cause points to the same conclusion: the risk of the function-bundling model is not a matter of a particular operator's moral failure or technical negligence but a structural property of the architecture itself. FTX's collapse exposed the fragility of the bundled architecture along the governance dimension, and Bybit's theft exposed the fragility of the same architecture along the technical dimension. The existence of two failure paths shows that even if a centralized exchange's governance system is sound, it still faces the single-point-of-failure risk at the technical level; conversely, even if its technical defenses are sound, a failure of internal governance can still destroy the entire system at the root. This repeated disappointment with the "trust an institution" model is precisely the fundamental force driving the market to explore alternatives more seriously. Those on-chain trading models that seek to rebuild the foundation of trust through publicly verifiable code and cryptography are analyzed in detail in Section 5.4.
5.4 On-chain trading models
On-chain perpetual futures trading has expanded rapidly over the past several years. By 2025, decentralized exchanges handled $6.7 trillion in perpetual futures volume, up 346% from the prior year and accounting for about 10% of the overall perpetual futures market [25] [26]. This growth reflects traders' persistent demand for alternatives to centralized exchanges. Decentralized exchanges, however, have not eliminated the risks inherent in financial markets; through cryptography and consensus mechanisms, they transform risk from one form into another. This section examines in depth the core mechanisms of on-chain perpetual futures trading and analyzes the new risk exposures it introduces in self-custody, execution models, and app-chain architecture.
5.4.1 Self-custody and atomic settlement
The core promise of decentralized-finance infrastructure is to reshape asset control and the trade-settlement process through cryptography. On a traditional centralized exchange, users must deposit assets into a wallet the platform controls, the platform records users' account balances in an internal database, and trades are booked in the matching engine. This model introduces extremely high centralized-custody risk: once the platform is hacked or funds are misappropriated internally, users' assets face direct loss. The Bybit theft of about $1.5 billion discussed earlier (Section 5.3.6) further demonstrates the fragility of the centralized-custody model [27].
On-chain perpetual futures trading eliminates this platform-custody risk through a self-custody mechanism. Under self-custody, the user controls assets on the blockchain directly through private keys, and a smart contract can operate on those assets only under specific conditions authorized by the user's cryptographic signature. This mechanism ensures that the platform cannot unilaterally misappropriate user funds, eliminating traditional centralized-custody risk at the root. On-chain trading also uses an atomic-settlement mechanism, completing trade matching and fund transfer indivisibly within the same blockchain transaction—if any step fails, the whole transaction reverts—thereby eliminating settlement risk (see Chapter 1 for the discussion of atomic settlement).
The complete flow of on-chain perpetual futures trading includes connecting a wallet, depositing margin, submitting an order, on-chain matching and settlement, and withdrawing funds (Figure 5-9); throughout, assets remain under the control of the user's private keys, a smart contract can operate on funds only under the specific conditions authorized by a cryptographic signature, and matching and fund transfer complete atomically within the same blockchain transaction.
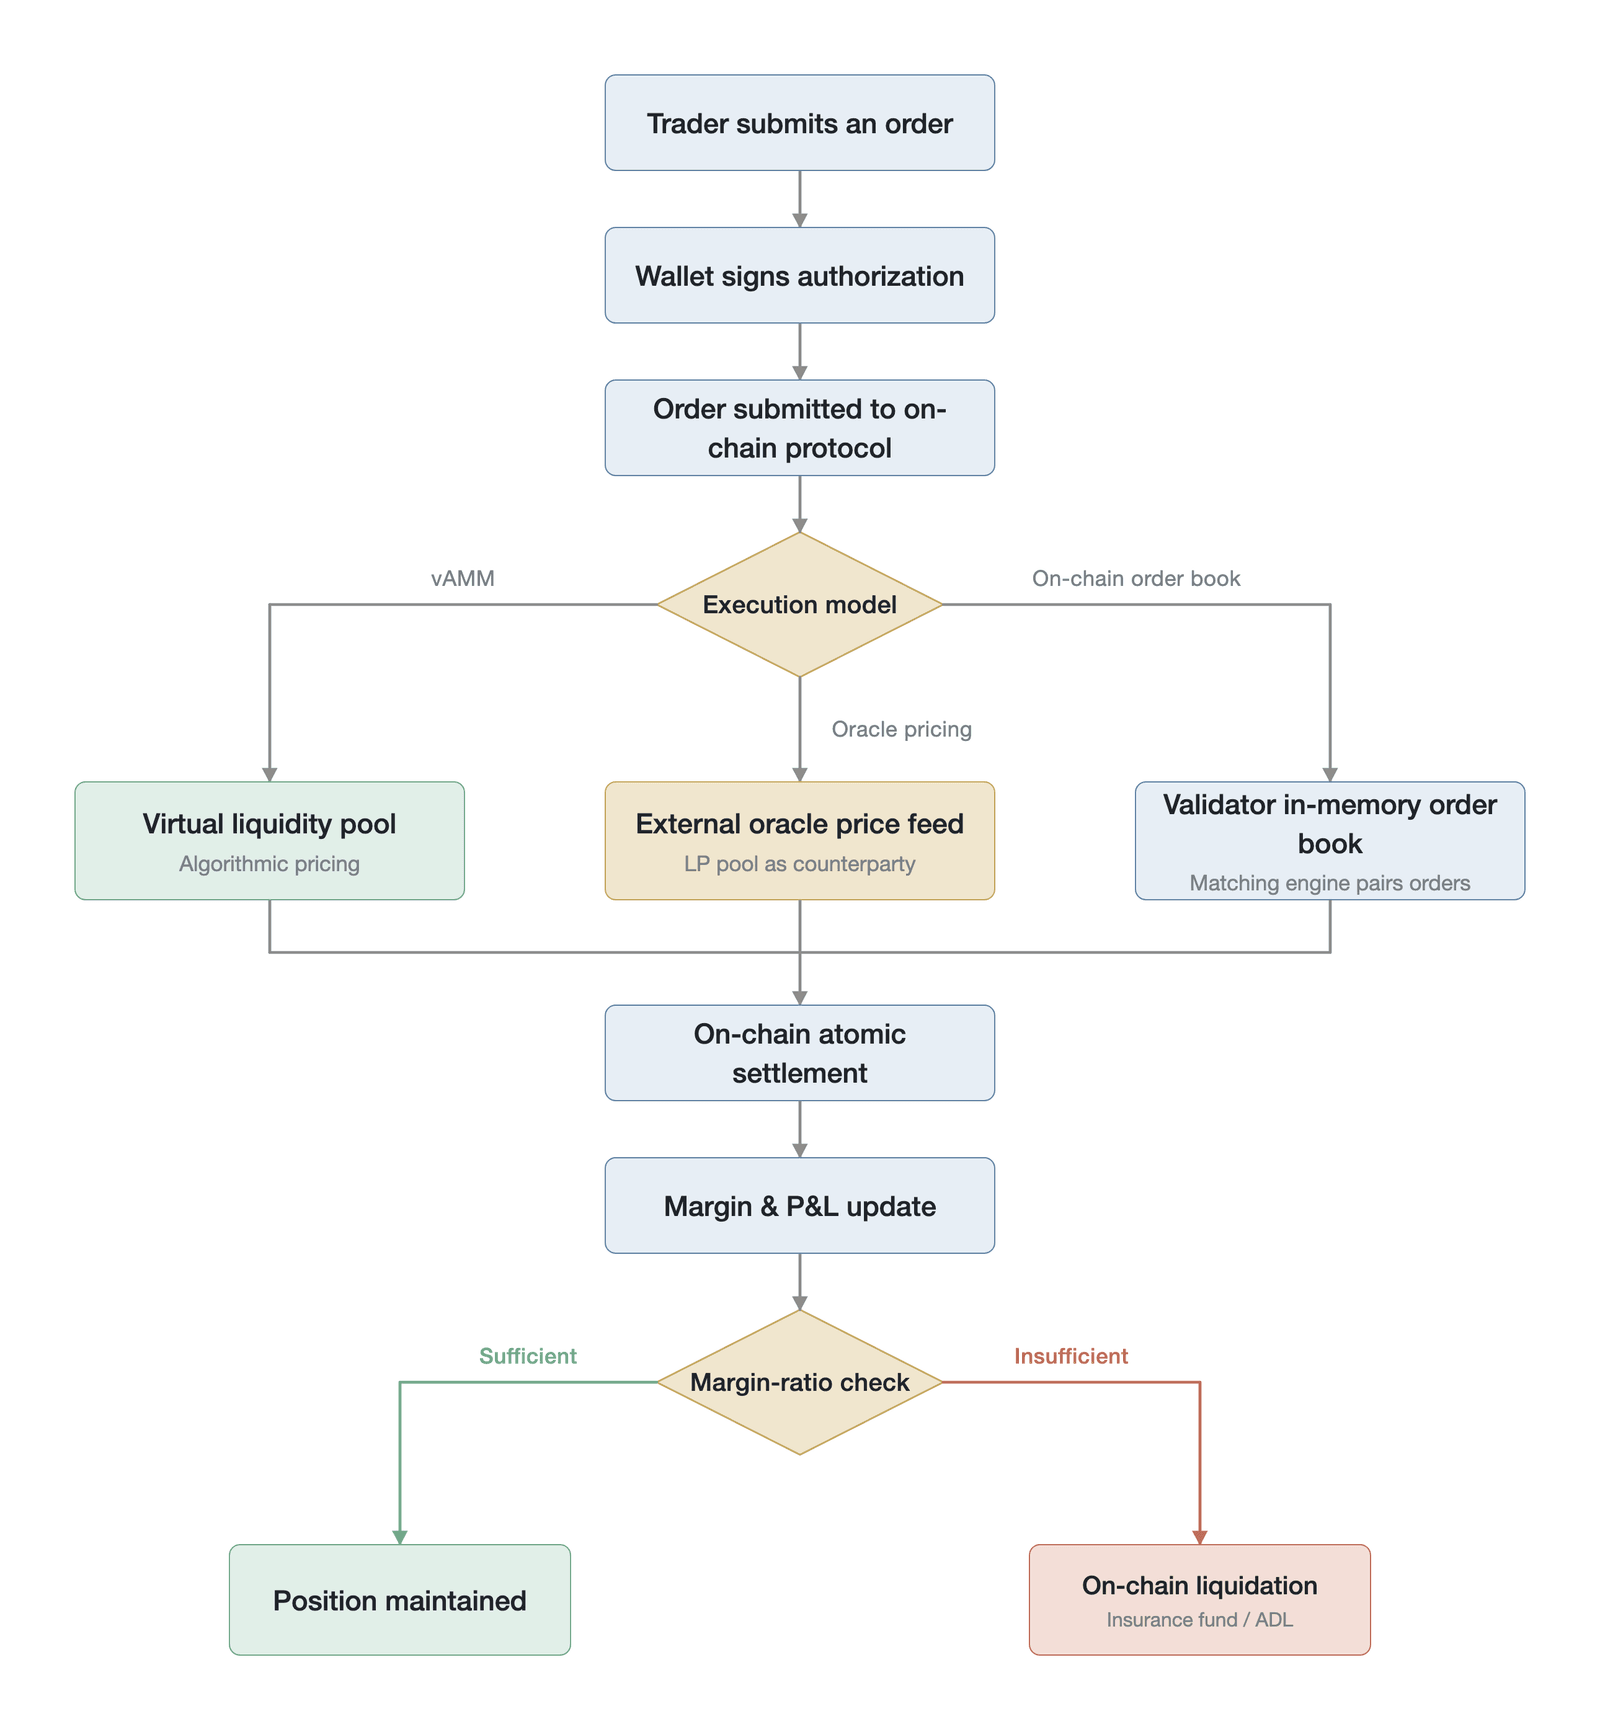
Figure 5-9. The on-chain perpetual futures trading flow (a schematic of the self-custody and atomic-settlement flow, not empirical data; Data source: protocol-architecture analysis based on the dYdX Foundation [28] and Nansen Research [29])
This elimination of risk, however, is not without cost; it essentially transforms institution-level systemic risk into user-level operational risk and protocol-level technical risk. Self-custody requires the user to assume full responsibility for protecting the private keys. Once a private key is lost or stolen, the assets face irreversible loss, and no centralized institution can provide a recovery service. Moreover, self-custody now faces tightening regulatory constraints: the EU's Transfer of Funds Regulation (TFR) requires crypto-asset service providers to apply additional identity verification to transfers involving unhosted wallets, and the FATF Travel Rule likewise extends compliance requirements to self-custody users, which may in practice limit the convenience with which self-custody users interact with regulated services. In addition, when interacting with a smart contract, a user must authorize the contract to operate on the assets in the wallet. If the user inadvertently authorizes a malicious smart contract, or if a legitimate smart contract contains a vulnerability, an attacker can still drain the user's assets.
Against the backdrop of increasingly frequent cross-chain trading, cross-chain bridge contracts have become a new locus of concentrated systemic risk. To move assets between different blockchain networks, a user must lock the assets in a bridge contract on the source chain and mint an equivalent amount of wrapped assets on the destination chain. This mechanism makes bridge contracts high-value attack targets. As noted earlier, the cumulative losses from cross-chain bridge hacks have exceeded $2.5 billion, about 40% of the total value stolen across Web3 [11]; this shows that although on-chain trading eliminates the custody risk of a single exchange, the complexity of cross-chain infrastructure introduces smart-contract-vulnerability risk that is more insidious and far more destructive.
5.4.2 A comparison of three execution models
To achieve efficient derivatives trading in a decentralized environment, on-chain perpetual futures protocols have evolved three main execution models. Each makes a different trade-off among performance, decentralization, and transparency, and each exposes particular risk characteristics in actual operation.
The virtual automated market maker (vAMM) model is the archetypal design of early on-chain perpetual futures. This model borrows the constant-product formula of the automated market maker from spot markets, but the pool contains no real reserve assets; instead, it uses an algorithm to simulate liquidity depth and determine prices. After depositing collateral, users take long and short positions against one another in the virtual pool. The advantage of this design lies in its high degree of decentralization and its permissionless nature: anyone can create a new trading pair based on the algorithm. A vAMM, however, relies entirely on internal-algorithm pricing, and when the market experiences an extreme one-sided move, the virtual pool's price readily depegs severely from the external spot price. The first version of Perpetual Protocol once generated large amounts of bad debt because of price depegging, ultimately facing bankruptcy risk [30]. The specific consequences of depegging for traders include immediate unrealized losses for position holders at the moment of depegging, unreasonable forced liquidations triggered by a mark price that deviates from the true price, and funding rates that spike to abnormal levels because of an extreme imbalance in the long-short ratio.
The oracle-pricing model takes an entirely different approach. It abandons the internal price-discovery mechanism and instead relies on the spot prices of mainstream exchanges provided by an external oracle as the execution price. In this model, liquidity providers (LPs) pool their funds into a global liquidity pool that serves as the unified counterparty for all traders. Traders can enjoy a zero-slippage trading experience because the price is determined entirely by the external oracle. This design, however, introduces fundamental oracle risk and LP-loss risk. Oracle risk can be systematically divided into four categories: manipulation risk, in which an attacker manipulates the price of the underlying asset in an illiquid external spot market and exploits the feed lag to perform risk-free arbitrage on the on-chain protocol; feed-latency risk, in which the oracle network's update frequency cannot fully match instantaneous market movements, creating a pricing window under extreme volatility; upstream data-source dependency risk, in which the oracle's aggregated price sources are concentrated in a few centralized exchanges, so that an interruption or error in the upstream data source transmits directly to on-chain pricing; and operator conflict-of-interest risk, in which, when the protocol's validators also serve as oracle nodes, the combination of pricing power and settlement power can create an incentive for self-dealing. In September 2022 and July 2025, leading oracle-pricing protocols such as GMX suffered repeated price-manipulation and reentrancy attacks of this kind, causing losses ranging from several million to tens of millions of dollars [31] [32].
The on-chain order-book model represents the latest direction in on-chain derivatives trading. This model seeks to rebuild on the blockchain the time-tested central limit order book (CLOB) mechanism of traditional financial markets. Early hybrid architectures placed order matching on off-chain centralized servers and submitted only the final fund settlement to the chain, trading this for higher throughput. But this compromise sacrificed the transparency and censorship resistance of the matching process. A new generation of on-chain order-book protocols instead builds a dedicated app-chain that embeds the matching engine, margin checks, and liquidation logic entirely within the blockchain's consensus layer. This model can deliver performance close to that of a centralized exchange while preserving deterministic trade ordering and full on-chain transparency.
Notably, the three models differ structurally in the design of their funding-rate mechanisms: the vAMM's funding rate is implicit in the curve shift of the virtual pool and is not calculated independently; the oracle-pricing model's funding rate is usually calculated explicitly on the basis of the long-short position ratio; and the on-chain order-book model's funding-rate calculation is closer to that of a centralized exchange, based on the deviation between the contract price and the mark price. These differences directly affect each model's contribution of the funding rate to the efficiency of price anchoring. The relative positions of the three models within the trilemma are shown in Figure 5-10.
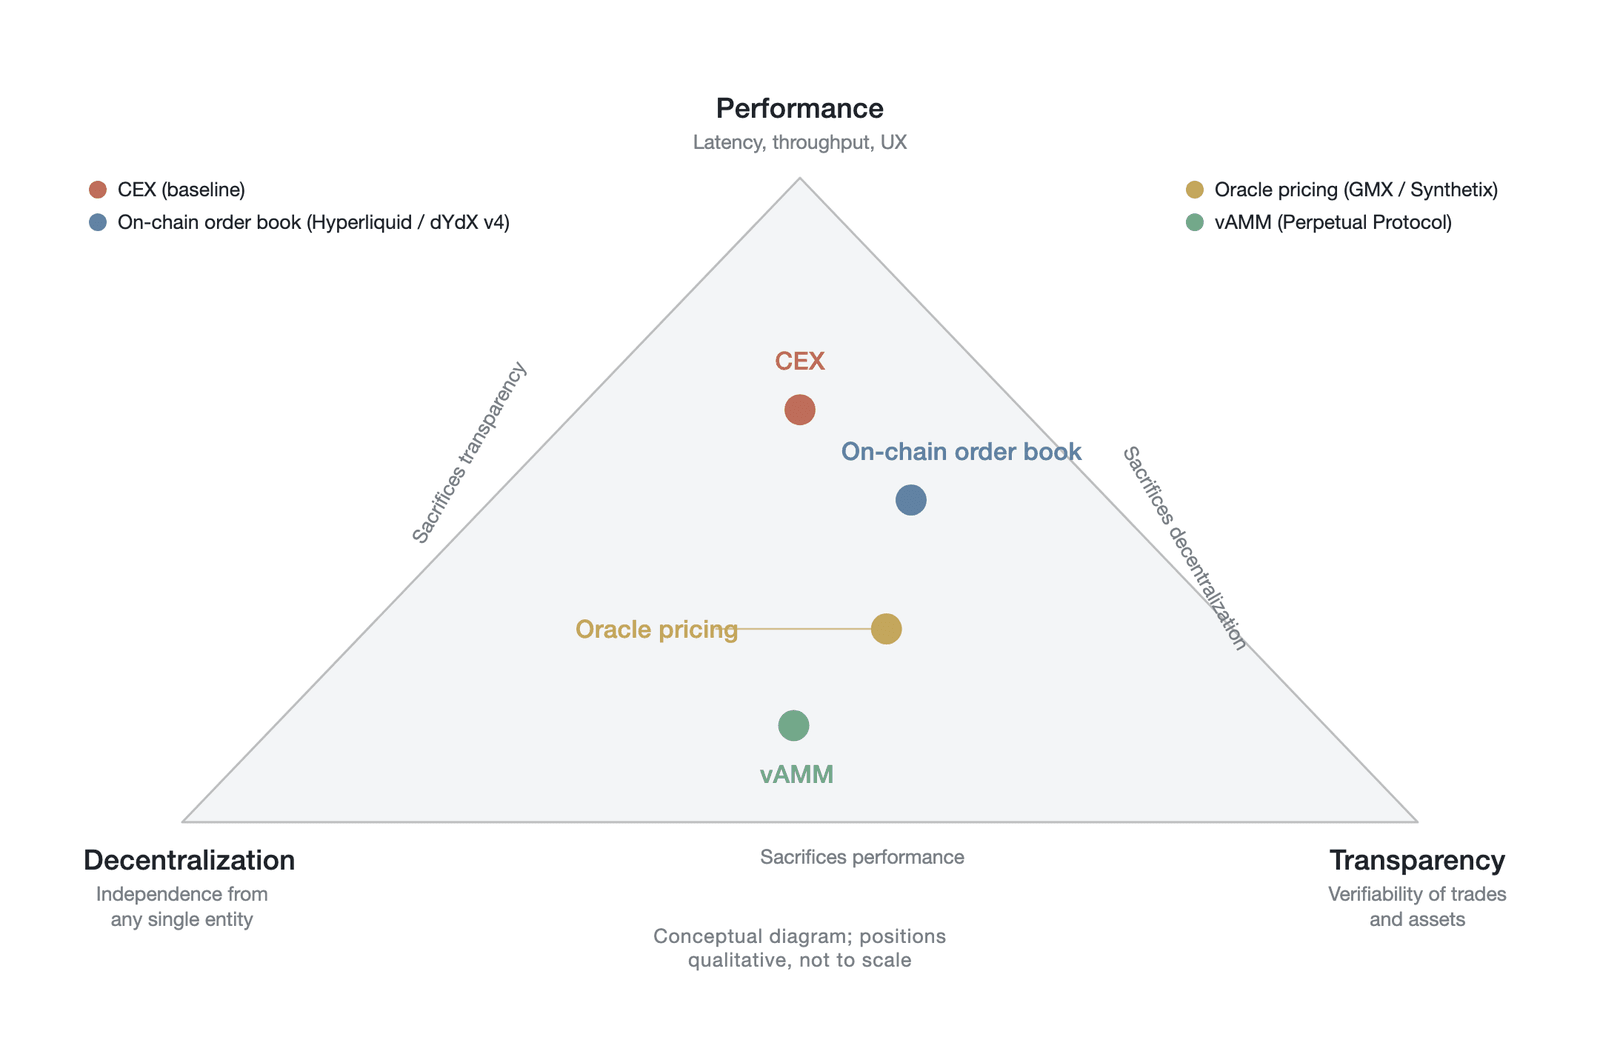
Figure 5-10. A comparison of the positions of three DEX execution models within the trilemma (conceptual schematic; qualitative positions, not measured coordinates; placements reflect the author's judgment, not empirical data; Data source: Nansen Research [29])
As the figure shows, the chosen points of the three models form an evolutionary path extending from the decentralization vertex toward the performance vertex: the vAMM is closest to the decentralization and transparency vertices but farthest from the performance vertex; the oracle-pricing model occupies the middle ground, trading dependence on external infrastructure for higher capital efficiency; and the on-chain order-book model advances performance substantially through an app-chain architecture but moves correspondingly away from the decentralization vertex. This path reveals the core evolutionary logic of on-chain derivatives-trading execution models: while preserving on-chain transparency, they trade a gradual concession in decentralization for a performance experience approaching that of a centralized exchange.
5.4.3 App-chain architecture and validator centralization
As on-chain trading's demands for low latency and high throughput keep rising, the performance bottleneck of general-purpose blockchains has become increasingly apparent. To break through this limit, leading decentralized exchanges have begun migrating to an app-chain architecture. An app-chain is an independent blockchain tailored to a specific decentralized application, and its core idea is to bind the underlying consensus mechanism tightly to the upper-layer application logic.
In a hybrid architecture, a decentralized exchange is usually deployed on a general-purpose blockchain such as Ethereum or its layer-2 network. Although this architecture can share the underlying network's vast validator set and high degree of security, a general-purpose network must accommodate the execution of all kinds of smart contracts and cannot provide the deterministic low latency required for high-frequency trading. Moreover, a hybrid architecture relies on centralized infrastructure such as Amazon Web Services for off-chain matching, which not only introduces single-point-of-failure risk but also leaves the trade-ordering process without cryptographic verifiability [28].
By contrast, an app-chain architecture achieves full-stack integrated control from the consensus layer to the application layer. In the case of a decentralized exchange that adopts an app-chain architecture, it usually customizes a Byzantine fault-tolerant (BFT) consensus algorithm optimized specifically for the throughput of financial messages. Under this architecture, order submission, cancellation, and matching, along with margin liquidation, all take place under the protection of on-chain consensus. Validator nodes are responsible not only for packaging blocks but also for running the order-book state machine directly in memory, ensuring that the execution order of every trade is network-wide consistent and tamper-proof. This deep customization allows an app-chain to achieve sub-second block-confirmation times and a throughput capacity of hundreds of thousands of orders per second (here, throughput refers to message throughput—the processing rate of messages such as order submissions and cancellations—and actual fill throughput is typically far lower than message throughput) [33] [34].
The core difference between the hybrid architecture and the app-chain architecture lies in where the components sit and in the corresponding trust assumptions. In a hybrid architecture, the matching engine runs on an off-chain centralized server and only final settlement is submitted to the chain, so users must trust the fairness of the off-chain components; in an app-chain architecture, the matching, margin checks, and liquidation logic are all embedded in the blockchain's consensus layer, and trade ordering is jointly determined by the validator set. This difference gives the two architectures different performance boundaries in latency, throughput, transparency, and censorship resistance (Figure 5-11), and the fundamental difference in their trust assumptions is that the former's trust rests on "whether the off-chain platform is fair," while the latter's shifts to "whether the validator set is honest."
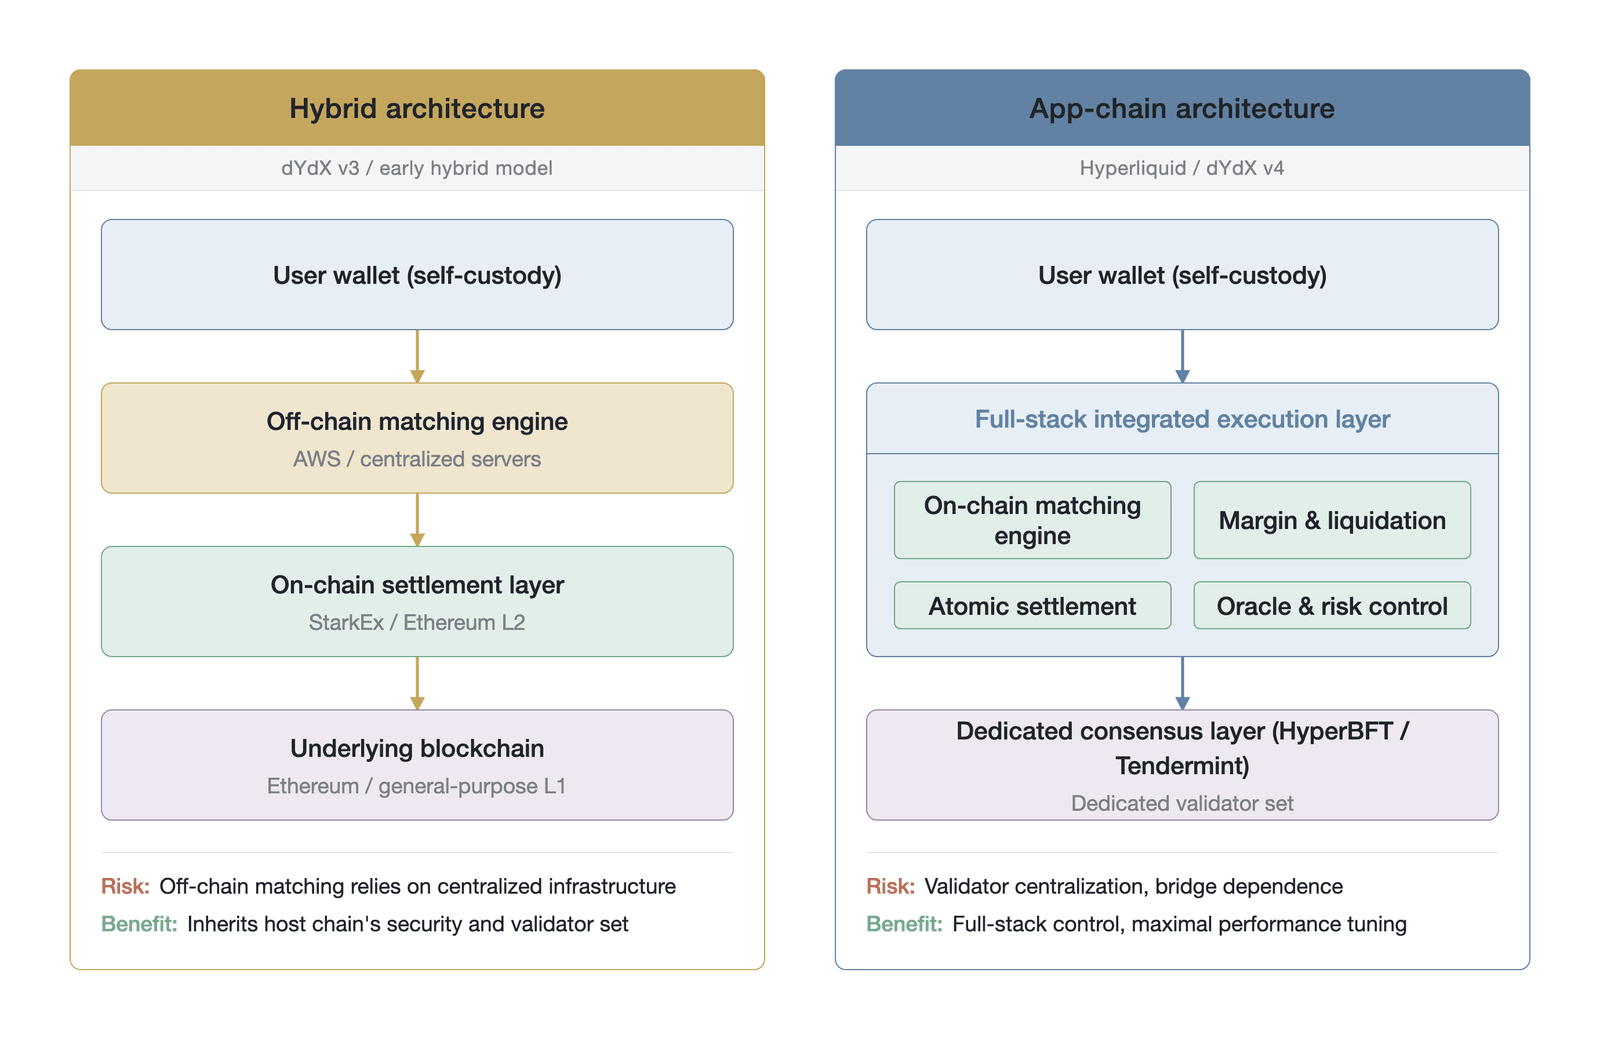
Figure 5-11. An architectural comparison of a hybrid DEX and an app-chain (conceptual architectural comparison, not empirical data; Data source: dYdX Foundation [28])
While gaining high performance, however, the app-chain architecture faces the significant cost of validator centralization. To maintain an extremely high network-synchronization speed, an app-chain can usually accommodate only a limited number of validator nodes. For example, in early 2025 Hyperliquid maintained network consensus with only about 16 validator nodes (later expanded to about 24), and the staked tokens were highly concentrated in the hands of early investors and the team [12] [35]. Beyond centralization risk at the governance level, the infrastructure concentration of validators also constitutes a significant operational risk: if most validators run on the same cloud provider or in data centers in the same geographic region, a single data-center failure or network partition can cause the network to lose liveness. Solana's multiple network-wide outages between 2021 and 2023 provide a precedent: during a network outage, all unsettled perpetual futures positions face the risk of not being liquidated, and the combination of extreme market conditions and network downtime can cause large-scale depletion of the insurance fund. This highly concentrated validator structure significantly weakens the blockchain's censorship resistance and its decentralized trust assumptions. When a few validators hold absolute control of the network, they can not only determine the ordering of trades but even change the protocol's core rules through a consensus upgrade. This concentration of power can cause an app-chain, under extreme conditions, to exhibit the arbitrary characteristics of a centralized institution, thereby departing from the original intent of decentralized finance.
5.4.4 Architecture audit and verifiability rating
Objectively assessing the security and degree of decentralization of an app-chain architecture requires a fact-based verifiability-rating framework. This framework does not rely on subjective scoring; instead, it performs a structured analysis by examining, for each dimension of the system, whether it is on-chain queryable, auditable, and under user control. Taking Hyperliquid, the current volume leader, as an example (other app-chain architectures such as dYdX v4 face similar trade-offs), one can conduct a deep audit of its architecture along four core dimensions.
On the dimension of custody and asset safety, this app-chain exhibits relatively high verifiability. Users' account balances are fully recorded in the on-chain state, and anyone can independently verify the authenticity of their assets by running a full node, without relying on financial statements the platform provides [36]. The platform does not hold users' private keys, and asset transfers require authorization by the user's cryptographic signature. On the withdrawal path, however, the system carries a partially restricted risk. Because this app-chain is an independent network, cross-chain asset transfers depend heavily on a cross-chain bridge contract controlled by a validator multisig. Although the bridge-contract code is publicly auditable, its security is ultimately anchored to the honesty of the validator set.
On the dimension of trade execution and matching, this system achieves fully on-chain execution of order matching. Unlike a hybrid model that relies on centralized servers, its consensus mechanism ensures deterministic trade ordering, and all matching logic runs openly in the validator nodes. The system's low latency and high throughput have been validated in actual operation. Hyperliquid's core node code long remained closed-source and was only gradually opened after sustained scrutiny from the community [37]. In addition, on preventing MEV, the system currently lacks an independent third-party audit, and the fairness of trade ordering still largely depends on trust in the validators.
On the dimension of clearing and risk management, the system's margin checks and liquidation-engine logic both execute on-chain, and their trigger conditions and execution processes are fully public and queryable. The insurance fund's balance is likewise displayed transparently on-chain, and the rules of the auto-deleveraging mechanism are hard-coded into the protocol. The system's oracle price-feed mechanism, however, involves a significant compromise. In pursuit of the highest update speed, the system does not use a decentralized third-party oracle network but instead has its own validator set directly maintain the price oracle. Although this design reduces latency, it also gives validators both pricing power and settlement power, which can trigger serious conflicts of interest and manipulation risk under extreme conditions.
Combining the audit results across these four dimensions, this app-chain achieves relatively high on-chain verifiability in custody and trade execution, carries latent conflict-of-interest concerns in clearing and risk management because of the compromise of a self-built oracle, and, in governance and emergency response, exposes discretionary risk arising from validator centralization (Figure 5-12).
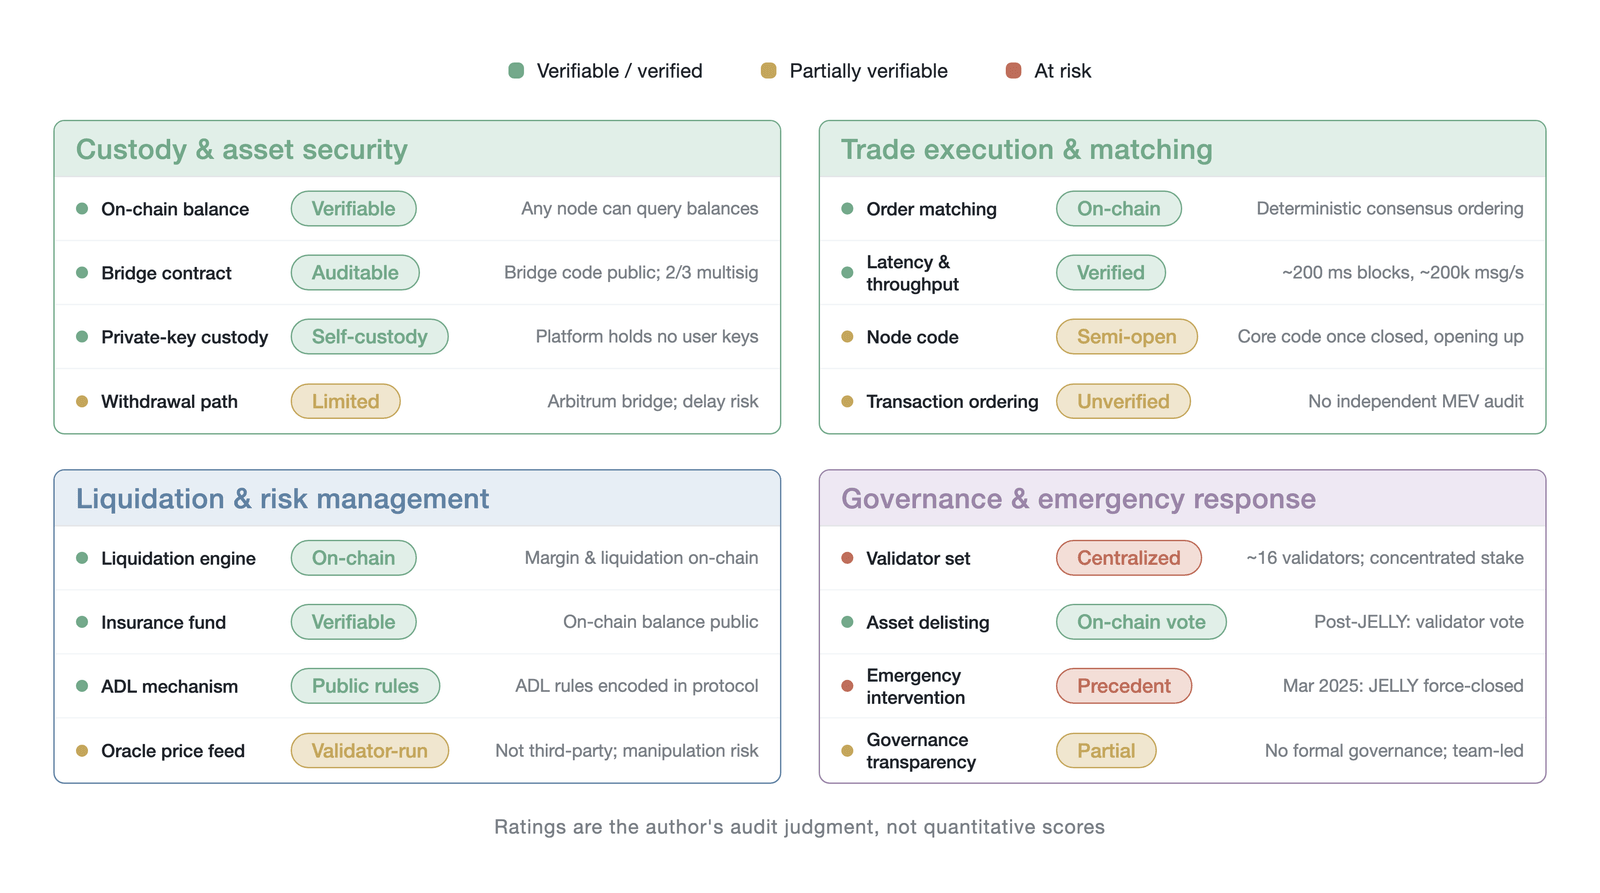
Figure 5-12. The verifiability-rating matrix from a four-dimensional architecture audit of the app-chain (the author's four-dimensional structured rating; ratings reflect the author's audit judgment and are ordinal, not quantitative scores, and not empirical data; the figure of about 16 validators reflects the genesis count as of early 2025, later expanded to about 24 [12][35]; the JELLY incident resolution [38][39]; the roughly 200,000 per second figure is message throughput—orders, cancellations, and similar messages, not fills—on a vendor basis [33][34]; architecture [28]; OneKey Blog is a secondary review [37])
On the dimension of governance and emergency response, this app-chain exposes the most obvious centralization risk. The validator set is limited in number and its stake is highly concentrated, so the system's governance lacks broad community participation. In responding to sudden events, this centralized structure grants validators extensive discretion.
The JELLY incident of March 2025 is an in-depth case of this governance risk [38] [39]. A trader opened a large short position in the low-liquidity token JELLY on Hyperliquid and then sharply pushed up the token's price in the external spot market. Because JELLY's spot liquidity was extremely thin, a small amount of capital could significantly move the oracle price feed, causing the Hyperliquid liquidity provider vault (HLP), as it passively absorbed the liquidated short, to face a peak unrealized loss of about $12 million (with exposure at one point reaching about $230 million); because the position was ultimately liquidated at the very low price of $0.0095, the HLP actually booked a small profit. This incident first exposed the fundamental risk of listing perpetual futures on low-liquidity tokens: when the oracle price feed can be manipulated with a small amount of capital, the leverage effect of perpetual futures amplifies the manipulation gains many times over.
The validator set's response to this crisis raised deeper questions of governance legitimacy. The validators rapidly reached consensus, decided to forcibly delist JELLY, and forcibly closed all related positions at a price of $0.0095, while the oracle quote at the time was about $0.50 (the on-chain delisting-vote mechanism was introduced only after this incident, and the handling at the time was in fact a rapid coordination among validators). The exercise of this price-setting power was in essence a product of off-chain coordination, and its basis of legitimacy was neither the automatic execution of code nor sufficient community deliberation. The Hyper Foundation subsequently promised to compensate affected users, but this compensation mechanism was itself an off-chain promise outside the protocol rather than a deterministic guarantee at the smart-contract level.
Viewed from the dimension of legal risk, the validators' unilateral forced liquidation at a price far below the market price could constitute market manipulation or a breach of fiduciary duty. The CFTC's enforcement precedent against Ooki DAO has shown that decentralized governance does not exempt participants from legal liability, and the narrative that "code is law" is fragile in the face of regulatory enforcement.
The implications of the JELLY incident for this chapter's theoretical framework are multidimensional. On the verifiability ladder, Hyperliquid has L3-level verifiability in normal operation, but the validators' governance override in a moment of crisis effectively downgraded it to L1, with the final enforcement of the rules depending on the discretion of a few rather than the determinism of code. Within the trilemma, the incident revealed a latent third dimension between decentralization and performance: when a crisis arrives, a limited validator set is forced to tilt toward centralized decision-making, sacrificing the predictability of the rules for the sake of protecting the system's solvency. The community's reaction to the incident also displayed a marked framing-effect split: some users viewed the intervention as a "responsible emergency response," while others viewed it as a "fundamental betrayal of the commitment to decentralization," and this narrative contest directly affected the market's repricing of trust in the protocol.
5.4.5 The on-chain risk waterfall
Sections 5.2.3 and 5.3.4 analyzed, respectively, the legally mandated default waterfall of the traditional central counterparty and the self-attested risk waterfall of the centralized exchange. The former manages systemic risk through a statutory, multi-layered loss-absorption mechanism whose parameters are public and subject to regulatory review; the latter mimics this structure in form but differs fundamentally along three key dimensions—transparency, legal constraint, and user protection.
Building on the experience of both models, on-chain perpetual futures protocols have constructed a distinctive on-chain risk waterfall, but the waterfall structure differs markedly across protocols. In the case of Hyperliquid, its risk waterfall in fact comprises four layers: the first layer is the trader's initial and maintenance margin; the second layer is the backstop liquidation of the HLP—that is, when routine liquidators fail to take over in time, the protocol-operated market-making vault passively absorbs the liquidated position; the third layer is the on-chain insurance fund (about $300 million to $500 million in size as of early 2025); and the fourth layer is auto-deleveraging. dYdX v4's waterfall differs: after margin is exhausted, the position is taken over by an external liquidator network, and if liquidation produces a shortfall loss, it is absorbed by the insurance fund (on the order of tens of millions of dollars in size), with ADL initiated after the insurance fund is exhausted.
The absolute sizes of these insurance funds differ from those of the traditional central counterparty by orders of magnitude. CME's total default resources (including the default fund and the statutory power to levy additional assessments on members) exceed $10 billion, of which the default fund itself is about $3 billion, whereas an on-chain protocol's insurance fund is usually only tens of millions to hundreds of millions of dollars and lacks a mandatory replenishment mechanism. Because of the blockchain's transparency, all margin balances and liquidation thresholds are publicly queryable, and any market participant can monitor the system's overall leverage level. When a user account's margin ratio falls below the maintenance level, the smart contract automatically triggers the liquidation logic. Unlike a centralized exchange, an on-chain protocol usually allows external liquidators to participate in the liquidation process and incentivizes them, through a liquidation discount, to take over high-risk positions in time, thereby using market forces to defuse risk. The reliability of the external liquidator network, however, has its own operational fragility. During "Black Thursday" in March 2020, MakerDAO's liquidation auctions saw the extreme situation of a liquidator winning bids at a price of zero: when a spike in Ethereum gas fees made the cost of a liquidation transaction higher than the gain from the liquidation discount, liquidators chose to withdraw, forming a "liquidator strike" that left the system exposed and unprotected.
The funding source of an on-chain insurance fund is usually a share of the trading fees the protocol collects, and its balance is fully visible on the blockchain [40]. This transparency lets the market assess the protocol's risk-bearing capacity in real time. When a protocol faces an extreme black-swan event and the insurance fund is breached, the auto-deleveraging rules are fully hard-coded into the smart contract. The system ranks accounts according to a preset algorithm, by leverage ratio and profit ratio, and executes deleveraging transparently and deterministically. In addition, in some app-chain architectures, as the JELLY incident in Section 5.4.4 shows, the validator set can also exercise emergency-intervention power through a consensus vote—for example, forcibly halting a market or modifying the settlement price.
The distinctive role the funding rate plays in the risk waterfall deserves separate discussion. The funding rate is in essence a continuously running risk-redistribution mechanism with no counterpart in the traditional central counterparty's default waterfall. Under normal market conditions, the funding rate maintains the anchoring of the contract price to the spot price by transferring payments between longs and shorts. Under extreme conditions, however, the funding rate can produce a positive-feedback effect: when the market rises sharply, the positive funding rate spikes, attracting short sellers to enter to earn the rate; if the uptrend persists, these short sellers are liquidated, further pushing up the price and the funding rate, forming a self-reinforcing loop of "high rate → attracts shorts → trend continues → shorts are liquidated → higher rate." This mechanism means that under extreme conditions the funding rate can turn from a stabilizer into an amplifier, constituting a distinctive risk-transmission channel in the on-chain risk waterfall that differs from traditional finance.
The three market structures display systematic differences across five key dimensions of the risk-management mechanism: the frequency of margin monitoring rises progressively from daily settlement to real-time on-chain checks; liquidation execution evolves from a closed internal engine toward an open external liquidator network; the transparency of the insurance fund moves from periodic audit reports to a real-time-queryable on-chain balance; the ultimate backstop mechanism shifts from statutory member assessments to algorithmically determined auto-deleveraging; and the guarantee of rule enforcement moves from legal constraint to cryptography and consensus. Table 5-2 lays out the comparison across these five dimensions. One evolutionary through-line runs across all dimensions: from the traditional central counterparty to on-chain protocols, margin monitoring moves from discrete periodic settlement to continuous real-time checking, liquidation execution moves from a closed membership system to an open liquidator market, and the insurance fund moves from periodic audit to real-time on-chain querying. This evolution takes gains in transparency and determinism as its benefit and takes declines in the depth of financial resources and the flexibility of crisis response as its cost.
| Dimension of comparison | Traditional CCP | Centralized exchange | On-chain derivatives protocol |
|---|---|---|---|
| Margin monitoring | Daily or intraday settlement | Real-time risk engine | Real-time checks by on-chain smart contracts |
| Liquidation executor | Clearing members | Platform's internal engine | External arbitrageurs or protocol liquidators |
| Insurance fund transparency | Periodic audit reports | Opaque or partially disclosed | On-chain balance queryable in real time |
| Ultimate backstop mechanism | Member assessments | Auto-deleveraging (opaque) | Auto-deleveraging (algorithmically determined) |
| Rule-enforcement guarantee | Legal and regulatory constraints | Platform reputation and internal controls | Cryptography and consensus mechanisms |
Table 5-2. A comparison of risk-management mechanisms across the three structures of derivatives markets (Data source: Harris [3], Paddrik & Zhang [5], CPMI-IOSCO [20])
On the whole, the on-chain risk-waterfall mechanism is markedly superior to the centralized exchange in transparency and the determinism of its rules, but it still falls short of the strictly regulated traditional central counterparty in the depth of financial resources and the flexibility of responding to extreme crises. The on-chain trading model has not eliminated the leverage risk and liquidity risk inherent in derivatives markets; instead, through cryptographically verifiable smart contracts and decentralized consensus, it transforms the management of risk from unverifiable internal operations into publicly auditable algorithmic execution. This transformation grants users greater rights to information and control, but it also demands of them a higher capacity for risk identification, in order to cope with new on-chain systemic risks such as smart-contract vulnerabilities, oracle failure, and validator consensus collusion.
5.5 Cross-architecture risk isomorphism
Many of the new problems of on-chain finance are, at a deeper level, the recurrence of old problems from traditional finance in a new technical environment. Recognizing this isomorphism helps strip away the technical shell to see the essence of a problem and to draw on traditional finance's two centuries of experience in solving it. At the same time, the on-chain versions of these new forms exhibit fundamental differences in speed, scale, and transmission mechanism, requiring market participants to reassess the boundaries of risk. This section analyzes, in turn, four core isomorphic mappings and characterizes the complete path of cross-modal risk transmission.
5.5.1 Adverse selection and impermanent loss
Adverse selection is the core dilemma facing market makers; in essence, a market maker is always trading against counterparties who hold more information than it does, and so it continuously incurs losses. Glosten and Milgrom (1985) [41] proved that under information asymmetry, even a risk-neutral market maker still posts a positive bid-ask spread, because the spread is the rational compensation for adverse-selection risk. In a traditional order-book market, the market maker manages this risk by adjusting the width of its quotes: when the share of informed traders rises, the spread widens to cover the higher adverse-selection cost; when market information is relatively uniform, competitive pressure forces the spread to narrow. Harris (2003) [3] treats adverse selection as the core issue of market-maker economics, noting that a market maker's profit comes from the liquidity demand of uninformed traders while its losses come from the informational advantage of informed traders.
In an automated market maker, the impermanent loss that liquidity providers face is essentially the on-chain version of the adverse-selection cost. When an asset's true price moves, arbitrageurs—acting as informed traders—use the pricing formula to trade against the liquidity pool until the price inside the pool aligns with the external market. In this process, arbitrageurs extract value while liquidity providers bear the loss. Milionis et al. (2022) [42] proposed the loss-versus-rebalancing (LVR) model, which rigorously proves that impermanent loss can be quantified as the cost to liquidity providers of being exploited by arbitrageurs for providing stale prices. The model's central conclusion is that the instantaneous —the loss rate per unit time, with dimensions of value per unit time—is proportional to the square of the underlying asset's price volatility, , and to the marginal liquidity at the price, ; this form closely resembles the gamma-risk structure in Black-Scholes option pricing and applies to all constant function market makers (CFMMs). It should be noted that Black-Scholes assumes continuous hedging and constant volatility, whereas AMM rebalancing is constrained by the discreteness of block time, and under extreme volatility, price jumps within a block interval cause actual LVR losses to deviate substantially from the predictions of the continuous-time model. Whether in a traditional order book or an automated market maker, the underlying mechanism by which liquidity providers are systematically drained of value by the better-informed party is exactly the same; only the outward form changes, from passive fills against active quotes to active arbitrage against passive liquidity. The strategy spaces of the two structures do differ importantly: a traditional order-book market maker can adjust the width and depth of its quotes in real time in response to information events, whereas an AMM liquidity provider is bound by the mathematical structure of the pool and can only passively accept the new asset ratio when the price moves. This asymmetry implies that the adverse-selection cost in an AMM may be systematically higher in magnitude than in an active market-making environment. This isomorphism means that the theoretical tools and practical strategies developed in traditional finance to address adverse selection can, with appropriate adjustment, be applied directly to the risk management of on-chain liquidity provision. Chapter 19 will systematically analyze this continuum from the perspective of the "toxic flow spectrum."
5.5.2 Margin cascades and liquidation cascades
The positive feedback loop of leveraged systems is known in traditional finance as the price accelerator. Harris (2003) [3] notes that under a margin regime, a sharp market decline triggers margin calls, and if a trader cannot top up in time, the position is forcibly liquidated, generating fresh selling pressure that causes further declines and more forced liquidations, forming a self-reinforcing positive feedback loop. The 1929 stock market crash is the classic case of this mechanism: the widely used margin loans of the time triggered a wave of large-scale forced liquidations as the market fell, turning a market correction into a systemic collapse. In the nearly one hundred years since, traditional finance has developed a series of buffering mechanisms—including price limits, circuit breakers, and the central counterparty clearing system—to break the positive feedback loop.
The liquidation cascade of perpetual futures markets is the extreme amplification of this old problem in an on-chain environment. Because the market broadly offers extremely high leverage and trades around the clock, chained liquidations can transmit rapidly across platforms via oracles. Ali (2025) [43] conducted a quantitative analysis of the October 2025 crypto market flash crash, finding that under a macroeconomic shock, $19 billion in open interest was wiped out within just 36 hours, the volatility-persistence coefficient was close to 0.90, and the cross-asset contagion intensity was about 20% higher than the spillover effect during the 2018 trade war. Compared with the day-scale transmission of traditional finance, the on-chain version of the liquidation cascade is two orders of magnitude faster ("orders of magnitude" here refers to the cross-market spillover time window: in traditional finance it is measured in days, whereas on-chain liquidation completes cross-platform transmission at the minute scale through oracles and arbitrage mechanisms) and has a distinctive cross-platform transmission mechanism. Moreover, the transparency of the on-chain environment gives the liquidation cascade a behavioral-contagion dimension that does not exist in traditional finance: large liquidation events are fully visible on-chain, propagate in real time through block explorers and social media, and turn a mechanical liquidation process into a "panic signal" for market participants. Social media compresses the timescale of panic propagation from the hour scale of traditional finance further to the minute scale, and the behavioral-level panic selling and the mechanism-level forced liquidation reinforce each other, potentially making the risk structure of an on-chain liquidation cascade structurally higher than that of a traditional margin cascade. After a large-scale liquidation on one decentralized exchange causes the price to deviate, arbitrageurs quickly transmit the shock to other platforms, triggering broader liquidations. The time buffer that settlement cycles and margin-call notices provide in traditional finance barely exists in an on-chain environment, so the risk-control system must respond within a second-scale time window. Chapter 20 will provide a formal analysis of the full dynamics of the liquidation cascade through the reflexivity triangle model.
5.5.3 Market fragmentation and cross-chain fragmentation
Trading the same asset on multiple exchanges disperses liquidity, increases transaction costs, and makes the price-discovery process more complex. In traditional finance, market fragmentation has long been a core concern of regulators and scholars, its main driver being competition among different trading venues. After the 2005 Regulation National Market System took effect, U.S. equity trading volume was dispersed across more than ten exchanges and dozens of dark pools, and the consolidation of the best bid and offer relied on complex market-data infrastructure.
In on-chain finance, the coexistence of multiple public blockchains has produced cross-chain fragmentation. Liquidity is dispersed across different decentralized exchanges on different chains such as Ethereum, Solana, and Arbitrum, and a user seeking the best price must resort to cross-chain bridges and aggregators, which not only raises transaction costs but also introduces an entirely new security dimension. In a Bank for International Settlements working paper, Shin (2026) [44] points out that the congestion and high-fee structure that public chains create in order to incentivize validators structurally drive user dispersion, making fragmentation an endogenous feature of decentralized economies rather than the result of external competition. An empirical study of Uniswap by Lehar et al. (2023) [45] finds that high-fee pools attract 58% of liquidity supply but execute only 21% of trading volume, indicating that fixed transaction costs produce a systematic stratification of liquidity providers.
Cross-chain fragmentation exposes the system to extremely high security risk. Data from Chainalysis (2022) [46] show that in just the first eight months of 2022, about $2 billion in crypto assets was stolen in 13 separate cross-chain bridge hacks, 69% of the total stolen that year. The cumulative losses from cross-chain bridges have reached the scale of billions of dollars (the DefiLlama data compiled by Chainlink put the figure at more than $2.5 billion) [11]. The failure of a cross-chain bridge not only causes direct fund losses but can also destroy all downstream derivatives positions collateralized by bridged assets: when bridged WETH or WBTC depegs because the bridge contract is breached, all perpetual futures positions using these assets as margin face simultaneous liquidation, forming "collateral-level contagion." The on-chain version of fragmentation is not merely an economic problem of reduced price-discovery efficiency but a technical problem that threatens the security of the entire ecosystem. Traditional finance's fragmentation can be mitigated through regulatory coordination and market-data consolidation, whereas the solution to on-chain fragmentation must address the dual challenge of economic efficiency and technical security at once.
5.5.4 Closing gaps and low-liquidity amplification
Information accumulated during a traditional financial market's closure is usually released at the open in the form of a price gap. To digest overnight information and smooth the price shock, traditional exchanges introduced mechanisms such as the call auction to provide a price-discovery window before formal continuous trading begins. This discrete closure-open rhythm creates a discontinuity in information release, but it also provides market participants a time window to reassess positions and adjust risk-control parameters.
On-chain finance's around-the-clock trading eliminates the discrete closure period, but liquidity displays marked periodic variation across different time windows. Hansen et al. (2024) [47] find that cryptocurrency volatility and volume exhibit systematic intraday and intraweek patterns, and that these patterns strengthen over time, possibly driven by algorithmic trading and futures-market settlement schedules. During Asian hours or on weekends, market liquidity falls significantly, and the impact of large orders is extremely amplified. Makarov and Schoar (2020) [48] document persistent, sizable arbitrage opportunities across cryptocurrency exchanges, with price deviations especially pronounced across national exchanges and widening further during periods of rapid price increase. Research by Mourey et al. (2025) [49] further confirms a "weekend effect" in crypto markets, noting that negative weekend returns and high volatility can even predict weak Monday equity-market performance, and that this effect became more pronounced after the 2022 LUNA collapse.
Because they lack the closure-period shock absorber of traditional finance, the continuous impact of information during low-liquidity windows replaces the concentrated release at the open, raising the market's intrinsic volatility. This poses distinctive challenges for service providers. The risk-control system must respond in real time while the market is running and cannot, like a traditional futures exchange, perform system maintenance and parameter adjustments after the close. Market makers must bear higher inventory risk and widen their spreads during low-liquidity windows, and any system vulnerability can cause an irreversible loss before the operations team can intervene. Chapter 22 will analyze the implications of 24/7 volatility in depth, and Chapter 23 will examine the distinctive mechanism of volatility clustering in a market without shock absorbers.
5.5.5 The cross-modal risk transmission path
The risk transmission between centralized and decentralized architectures forms a tightly coupled cyclical system whose transmission speed far exceeds the cross-market contagion of traditional finance. This transmission path can be characterized precisely in four steps. In the first step, large-scale liquidation on the centralized-exchange side causes a sharp price drop, and highly leveraged positions are forcibly liquidated, generating concentrated selling pressure. In the second step, the oracle network collects the centralized exchange's price data and passes it to the mark-price system of the on-chain decentralized exchange, so that the on-chain price reflects the centralized market's decline almost synchronously. In the third step, the update of the decentralized exchange's mark price triggers on-chain liquidations, and the liquidation flow hits the liquidity pool or order book, further depressing the on-chain price. In the fourth step, arbitrageurs buy low on the decentralized exchange and sell on the centralized exchange, adding to the centralized exchange's selling pressure and causing the price to fall further, thereby completing one positive-feedback cycle. This theoretical arbitrage loop, however, can be blocked in extreme conditions by a key execution friction: a centralized exchange may freeze withdrawals during a crisis. As an "emergency circuit breaker," a withdrawal freeze has a double-edged effect: while it stops risk from transmitting from the centralized market to the chain, it also stops users from moving assets to the safe option of self-custody, and it can cause a persistent cross-venue price divergence, because arbitrageurs cannot execute the cross-platform convergence trade.
It should be noted that the four-step linear cycle above is a simplified model. Actual cross-modal transmission is a nonlinear network structure containing multiple feedback loops operating in parallel (such as the funding-rate feedback, the liquidity-withdrawal feedback, and the collateral-value feedback). These loops may behave as negative feedback (self-stabilizing) under normal market conditions, but under certain conditions—such as when multiple loops switch to positive feedback simultaneously—they can produce a resonance effect that amplifies systemic risk far beyond the predictions of a linear model.
Moreover, cross-modal transmission is not confined to an internal loop within crypto markets. Macro-financial factors such as the U.S. dollar liquidity cycle constitute an important external trigger for systemic shocks in crypto markets. The macro backdrop of FTX's collapse was the repricing of global risk assets caused by the Federal Reserve's aggressive rate hikes in 2022; a tightening of dollar liquidity transmitted to the crypto-derivatives market through common holders (institutional investors holding both traditional risk assets and crypto assets), triggering deleveraging and selling. This bidirectional macro-crypto transmission means that a systemic-risk assessment of perpetual futures markets cannot be confined to the crypto ecosystem alone but must also incorporate global macro-liquidity conditions.
This transmission process is amplified by three key factors. The immediacy of the oracle keeps prices in the centralized and decentralized markets nearly synchronous, eliminating the cross-market risk buffer that settlement delay provides in traditional finance. Around-the-clock trading means transmission can occur at any time, including the low-liquidity hours of the early morning, making the shock effect more severe. High leverage ensures that every price drop can trigger fresh liquidations, accelerating the positive feedback loop.
Naifar and Makni (2025) [50] provide empirical evidence of cross-modal contagion in their analysis of the FTX collapse. The study finds that after the extreme event, Bitcoin's outward directional connectedness jumped from 67.00 to 82.21, and the intra-group spillover among DeFi tokens likewise strengthened significantly, with Uniswap's risk reception doubling from 14.89 to 30.92. These data indicate that shocks in the centralized market transmit efficiently to the decentralized ecosystem through oracles and arbitrage mechanisms, and that the two modes are tightly linked at the macro-risk level by the same underlying price. Each platform's risk-control system can set parameters only from a local perspective and cannot assess the systemic risk level of the whole market, and this information asymmetry constitutes a systemic-risk hazard in the current perpetual futures market.
The four isomorphic mappings above share a common feature: the underlying economic mechanism remains unchanged, but the on-chain environment introduces fundamental differences in transmission speed, scale amplification, and security dimension. Adverse selection changes from passive fills against active quotes to active arbitrage against passive liquidity; the margin cascade accelerates from day-scale transmission to the minute scale; market fragmentation expands from an economic-efficiency problem to a technical-security problem; and the closing gap changes from a discrete release at the open to a continuous impact during low-liquidity windows. Table 5-3 lays out these four mappings and their shared underlying mechanisms, and the fourth column marks where each is analyzed in depth in later chapters. As the table shows, the third column of each mapping—the "core isomorphic mechanism"—points to the same underlying logic: whether adverse selection or the margin cascade, the driving mechanisms of information asymmetry and leverage amplification are essentially the same across different technical environments; only the transmission speed and scope of impact change by orders of magnitude because of the characteristics of the on-chain environment.
| Old problem in traditional finance | New form in on-chain finance | Core isomorphic mechanism | Deeper analysis in later chapters |
|---|---|---|---|
| Adverse selection: market makers face informed traders | Impermanent loss: AMM liquidity providers face arbitrageurs | Liquidity providers are systematically drained of value by the better-informed party | Chapter 19 |
| Margin cascade: margin calls trigger forced liquidations | Liquidation cascade: high leverage triggers chained liquidations that propagate across platforms via oracles | Self-reinforcing positive feedback in leveraged systems; two orders of magnitude faster on-chain | Chapters 20 and 22 |
| Market fragmentation: the same asset trades on multiple exchanges | Cross-chain fragmentation: liquidity is dispersed across chains and cross-chain bridges are weakly secured | Dispersed liquidity reduces price-discovery efficiency; on-chain adds a security dimension | Chapter 14 |
| Closing gap: information accumulated during the closure is released at the open | Low-liquidity amplification: in 24/7 continuous trading, shocks are amplified in the early morning and on weekends | A timing mismatch between information release and liquidity supply | Chapters 22 and 23 |
Table 5-3. The isomorphic mapping between traditional finance's old problems and on-chain finance's new forms (Data source: Harris [3], Milionis et al. [42], Ali [43])
Figure 5-13 presents these four isomorphic mappings in a three-column comparison.
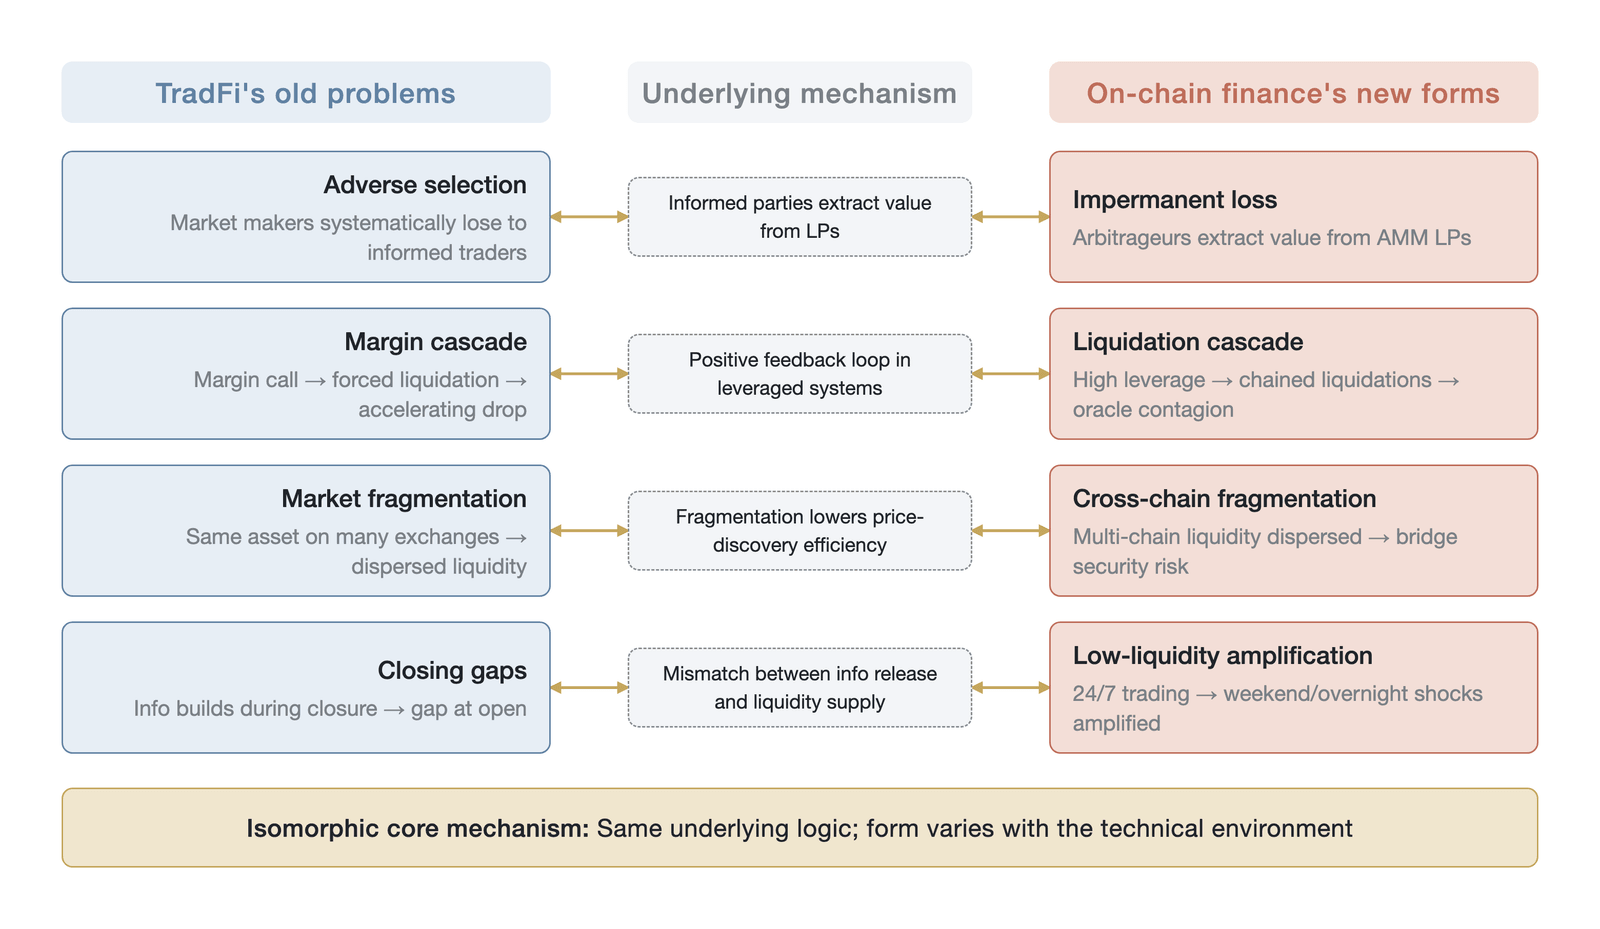
Figure 5-13. The isomorphic mapping between the old problems of traditional finance and their new forms in on-chain finance (conceptual comparison synthesized by the author, not empirical data; Data source: Harris [3])
The four steps of this transmission cycle—liquidation on the centralized exchange triggering a price drop, the oracle transmitting the price on-chain, on-chain liquidation generating fresh selling pressure, and arbitrageurs transmitting the shock back to the centralized market—form a closed positive-feedback loop, and three factors, the immediacy of the oracle, around-the-clock trading, and high leverage, together amplify the transmission efficiency of this loop (Figure 5-14).
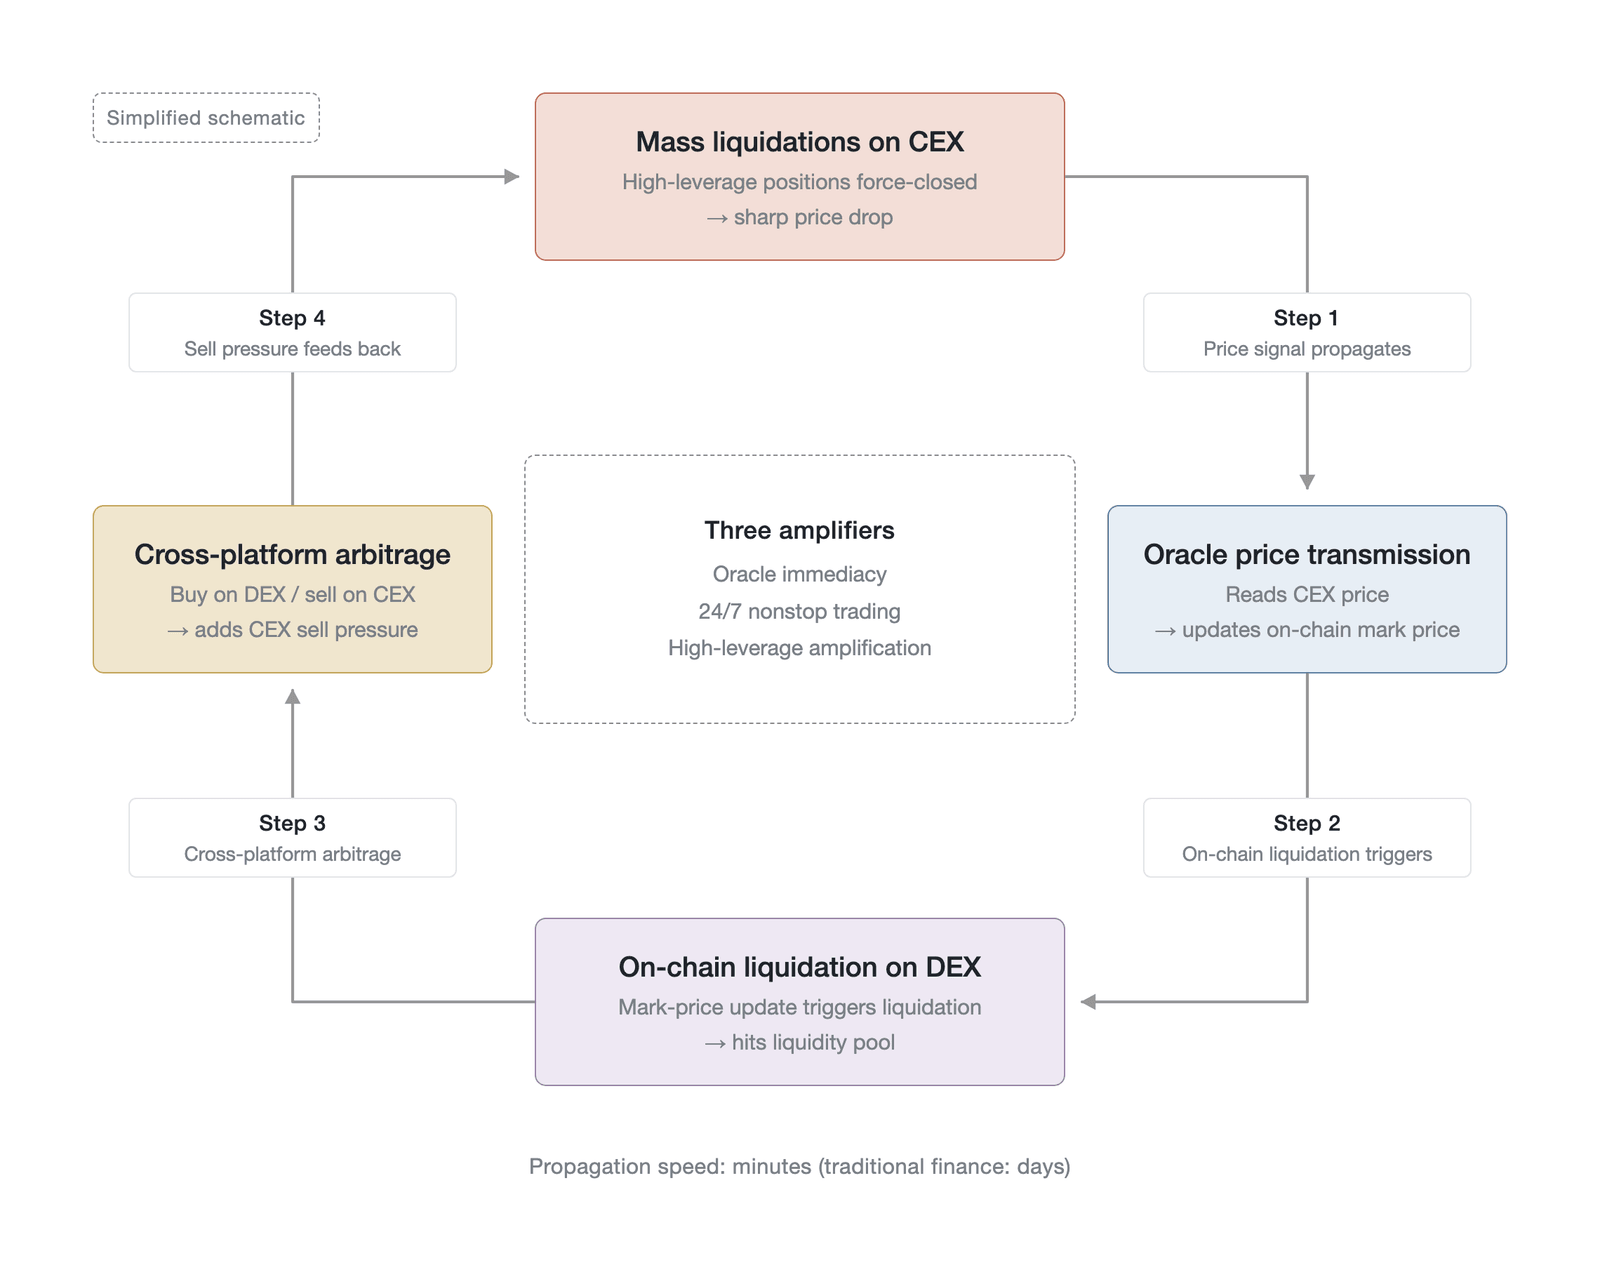
Figure 5-14. The four-step cyclical path of cross-modal risk transmission (a schematic of the cross-modal transmission mechanism, not empirical data; a simplified model—the actual structure is a nonlinear multi-loop network, as detailed in the text; the connectedness values from [50] appear in the text; Data source: Naifar and Makni [50])
5.6 Effects on market microstructure
Differences in service-provider architecture ultimately transmit systematically to the core dimensions of market microstructure. Four dimensions—price-discovery efficiency, the mode of liquidity supply, the structure of transaction costs, and the distribution of systemic risk—together determine the operating quality of a market. This section builds, for each dimension, a causal chain of "architecture choice affects microstructure," identifying the core variables and transmission paths; detailed quantitative analysis will follow in the corresponding later chapters.
5.6.1 The reconstruction of price discovery
Price discovery is the process by which a market aggregates dispersed information about an asset's fundamental value into a single price. In centralized exchanges and on-chain central limit order books, price forms through the bidding contest between buyers and sellers, following the traditional supply-and-demand-driven pattern. Market makers' quoting behavior, the distribution of limit orders, and the impact of market orders together determine the path of price formation. In a decentralized exchange that relies on oracle pricing, by contrast, the platform outsources pricing entirely, becoming a price taker rather than a price discoverer. Research by Chen et al. (2024) [51] shows that in oracle-based decentralized exchanges, traders tend to react to external price sources rather than contribute new price information through their own trading. This design may cause price-discovery lag, but it also avoids the price distortion that would arise from insufficient in-house liquidity. A comparative study by Barbon and Ranaldo (2024) [52] finds that decentralized exchanges may offer more competitive execution costs on large trades, but the presence of gas fees creates persistent arbitrage opportunities that interfere with the efficiency of price discovery.
In perpetual futures markets, the funding rate constitutes a distinctive dimension of price discovery. The funding rate is not only the mechanism that maintains the anchoring of the contract price to the spot price; it is itself a key indicator of market sentiment and of the balance of long and short forces. Differences in settlement frequency across service providers directly affect the speed of price convergence: centralized exchanges usually settle every 8 hours, whereas some app-chains achieve hourly or even more frequent settlement, and a higher settlement frequency means faster price convergence and smaller basis fluctuations. Specifically, under an 8-hour settlement cycle, the basis can accumulate to a significant level within the settlement interval, offering basis arbitrageurs an ample window to operate; hourly settlement compresses this window, reducing basis fluctuation but also raising the sensitivity of arbitrage strategies to latency; and continuous settlement (such as the per-block settlement achieved by some app-chains) compresses, in theory, the basis-arbitrage space to the block-interval level, rendering traditional funding-rate arbitrage strategies economically more marginal. Differences in the funding rate across platforms create cross-platform arbitrage opportunities that objectively promote the convergence of the global price, but they also expose arbitrageurs to several entirely different risk frameworks simultaneously—the counterparty risk of the centralized exchange, the smart-contract risk of the on-chain protocol, and the cross-platform settlement-timing risk all act on the arbitrageur's position portfolio at once. Chapters 13 through 15 will systematically develop the analysis of price discovery.
5.6.2 The evolution of liquidity supply
The mode of liquidity supply under different architectures reflects a trade-off between barriers to access and professional risk-management capability. A centralized exchange's liquidity is provided mainly by professional market makers, who use high-frequency algorithms and complex inventory-management models to control risk and can provide extremely deep liquidity, but from highly concentrated sources. Harris (2003) [3] defines a market maker as "a trader who provides immediacy to the market," whose profit comes from the bid-ask spread as compensation for the liquidity demand of uninformed traders. In a centralized exchange, a market maker's barriers to entry include technical infrastructure, capital scale, and a cooperative relationship with the exchange, and these barriers concentrate liquidity supply in the hands of a few professional institutions.
Automated market makers lower the barrier to liquidity supply to the minimum, allowing any asset holder to become a liquidity provider. A passive liquidity provider, however, must bear the full adverse-selection cost, and capital efficiency under the constant-product model is generally low, with a large amount of capital allocated to price ranges that will in fact never be used. Although the concentrated-liquidity design raises capital utilization by several orders of magnitude, it essentially turns passive supply into a position that requires active management, placing higher demands on the professional ability of ordinary users. Research by Milionis et al. (2022) [42] shows that in a concentrated-liquidity environment, the behavior pattern of liquidity providers is closer to that of a traditional market maker than to that of a passive asset holder, and their returns depend on the quality of range selection and rebalancing strategy. On-chain order books, in turn, seek a balance between low barriers and professional risk management, usually combining professional market makers with protocol-level market-making vaults to maintain liquidity, so that professional institutions and ordinary users can participate in liquidity supply in different ways within the same market. Chapter 19 will develop the full analysis of market-making economics.
5.6.3 Structural differences in transaction costs
The structure of transaction costs differs fundamentally across architectures and can be analyzed at three levels: explicit costs, implicit costs, and architecture-specific costs. Explicit costs mainly comprise trading fees and network gas fees. Centralized exchanges usually offer the lowest fees and grant tiered discounts to large traders, whereas a decentralized exchange's explicit costs are affected by the congestion of the underlying network, and gas fees on Ethereum mainnet can make small trades uneconomic, although the development of layer-2 networks and app-chains is significantly lowering this cost.
Implicit costs are often more important than explicit costs. Because of concentrated liquidity, a centralized exchange has relatively small slippage and price impact, and large orders can be executed within a narrower price range. In an automated market maker, slippage constitutes the main implicit cost, its size depending on the ratio of trade size to the depth of the liquidity pool. In addition, different architectures have their own distinctive cost types. A centralized exchange operator has a global view of all order flow and could in theory abuse this information; this cost is hard to observe and quantify but can have a systematic effect on users' actual execution quality. On-chain markets, by contrast, face MEV costs. Adams et al. (2024) [53] find that when trading volatile assets, the probability of encountering adversarial slippage is 80% higher than when trading mature assets, and MEV-extraction behavior such as sandwich attacks constitutes a significant implicit cost for on-chain traders. Wu et al. (2025) [54] tracked 19 months of CEX-DEX arbitrage activity and found that just 19 major searchers extracted $233.8 million in value through more than 7.2 million arbitrage events, with the top three searchers accounting for three-quarters of the total value extracted, indicating a highly concentrated trend in MEV extraction. An app-chain architecture, by imposing order-ordering rules at the consensus level, can reduce certain types of MEV from the base layer to some extent—a structural advantage that general-purpose-chain decentralized exchanges struggle to achieve. Although a precise cross-venue cost comparison is limited by data availability and the continual change in market conditions, order-of-magnitude estimates offer a reference: for a $1 million BTC-PERP trade, the total transaction cost (fees plus slippage) at a leading centralized exchange such as Binance is about 2 to 4 basis points; at an on-chain order book such as Hyperliquid, about 3 to 6 basis points; and the explicit cost (fees plus price-impact fee) of an oracle-pricing model such as GMX, about 6 to 10 basis points, though its zero-slippage feature may make it competitive on very large trades. These values fluctuate with market liquidity and volatility, but the order-of-magnitude differences reflect the structural differences in execution efficiency across architectures.
5.6.4 The distribution of systemic risk
Systemic risk takes markedly different distributional forms across architectures, and this difference directly affects the design of regulatory strategy and risk-management frameworks. The risk of the centralized-exchange model is highly concentrated in a few entities. Dell'Erba (2025) [55] points out that the crypto-derivatives market is replicating the "too big to fail" (TBTF) structure of traditional finance, with a few leading exchanges concentrating the vast majority of trading volume and user assets. In traditional finance, however, the TBTF problem is accompanied by an implicit government guarantee: systemically important institutions can obtain central bank liquidity support and fiscal bailouts in a crisis, whereas centralized entities in crypto markets enjoy no safety net, and FTX's actual collapse proves that they are in essence "too big and will fail." This distinction means that the systemic consequences of concentration in crypto markets may be more severe than in traditional finance. Similar concentration risk is also forming at the on-chain-protocol level: if a leading protocol such as Hyperliquid dominates most of the trading volume of the on-chain perpetual futures market, its failure would not only cause direct user losses but could also destroy the market's trust in the entire on-chain derivatives model, producing an ecosystem-contagion effect far beyond the scope of a single protocol. FTX's collapse is an extreme expression of concentration risk: the failure of a single institution directly caused enormous fund losses and triggered a broad crisis of industry trust. Research by Jalan and Matkovskyy (2023) [56] argues that the FTX episode was in essence a failure of corporate governance and regulation rather than a defect of crypto assets themselves, and that the systemic risk of crypto markets actually peaked in 2021 because of China's regulatory tightening.
The on-chain model disperses risk across multiple independent protocols, and the failure of a single protocol usually does not directly cause the system to collapse. The composability of decentralized finance, however, constitutes an efficient channel for risk contagion. A report by the Financial Stability Board (2023) [40] emphasizes that the mutual nesting and dependence among protocols allow the risk of one protocol to transmit rapidly to the entire ecosystem, its main vulnerabilities being operational fragility, liquidity and maturity mismatch, leverage, and interconnectedness. In the Terra/LUNA episode, the depegging of the algorithmic stablecoin triggered a downward spiral that caused chained liquidations across multiple lending protocols, with a lasting negative impact on the entire decentralized-finance ecosystem. The cross-modal contagion mechanism (as described in Section 5.5.5) further links the centralized and decentralized markets tightly, together forming a complex and fragile risk network. The Financial Stability Board (2023) [40] also notes that although the 2022 crypto-market turmoil and FTX's collapse had a limited impact on the traditional financial system, spillover effects could strengthen significantly in the future as the ties between the two systems deepen. Chapter 20 will provide a formal analysis of cross-dimensional contagion through the reflexivity triangle model, and Chapter 25 will build a comprehensive evaluation framework for market quality.
5.7 Chapter summary
From traditional finance to centralized exchanges and then to on-chain protocols, the evolution of the service-provider ecosystem is not a linear process of progress but a continuous transformation of the risk surface. Each new architecture, while dissolving the core risks of its predecessor, necessarily introduces a set of new risks of a different nature. Understanding this dynamic is the prerequisite for making a rational service-provider choice.
The five theoretical tools proposed in this chapter provide a systematic analytical framework for this understanding. The risk substitution theorem shows that no zero-risk architecture exists, only a choice among types of risk, and that the criterion for the choice is not which architecture is absolutely safer but which risk is more manageable and more hedgeable for a particular user. The service provider's trilemma reveals the inherent conflict among performance, transparency, and decentralization that cannot all be had at once; any service provider can only choose its own position within the triangle, and although frontier technologies such as zero-knowledge proofs are trying to expand the area of the triangle, they cannot eliminate the constraint of the triangle itself. The concept of the bundling tax reveals the hidden cost of a centralized exchange's efficiency: while enjoying ultra-fast trading and a convenient experience, users pay the price of opacity, conflict of interest, and single points of failure—which forms, with the trust tax that traditional finance pays to achieve functional separation (discussed in Chapter 1), the two ends of the same trade-off. The verifiability ladder makes trust cost concrete: the five-level standard from fully unverifiable to fully verifiable shows that every increase in verifiability comes at the cost of a higher cost of technical understanding. And the old-problems-in-new-forms perspective reminds us that many of on-chain finance's challenges are essentially the technical recurrence of traditional finance's old problems: adverse selection, the margin cascade, and market fragmentation appear in the on-chain environment as impermanent loss, the liquidation cascade, and cross-chain fragmentation, and although their transmission speed and scale change fundamentally, the underlying mechanisms remain isomorphic.
The purpose of these theoretical tools is not to judge which service provider is superior but to give market participants a framework for rational choice grounded in understanding rather than faith. A mature trader should combine multiple service providers according to personal risk preference, technical ability, and trading needs, so as to achieve the best balance of risk and return. For users with lower risk tolerance and limited technical ability, a regulated centralized exchange may be the more reasonable starting point; for users who pursue asset self-sovereignty and possess the ability to understand the technology, on-chain protocols offer a transparency and verifiability that a traditional architecture cannot achieve.
This chapter has conducted a static analysis of the current service-provider ecosystem. One trend worth watching is that the boundary between the centralized and decentralized models is blurring: some centralized exchanges are beginning to migrate the settlement layer on-chain to improve transparency, while some on-chain protocols are moving closer to centralized platforms at the user-experience layer to lower the barrier to use. Chapter 6 will shift from static analysis to dynamic analysis, examining how the three paradigms evolve through competition, how price-discovery power shifts among different architectures, and whether this convergence trend will produce a hybrid model combining the strengths of both or instead create new systemic risks.
References
[1] CoinDesk. (2023, June 26). FTX bankruptcy team says the exchange owed customers \$8.7B. CoinDesk. https://www.coindesk.com/policy/2023/06/26/ftx-bankruptcy-team-says-the-exchange-owed-customers-87b
[2] Reuters. (2022, November 17). Bankrupt FTX's new CEO outlines fund abuses, 'complete failure' of corporate control. Reuters. https://www.reuters.com/technology/new-ftx-ceo-slams-complete-failure-corporate-control-2022-11-17/
[3] Harris, L. (2003). Trading and exchanges: Market microstructure for practitioners. Oxford University Press.
[4] CoinGecko. (2025). State of crypto perpetuals market 2024. https://assets.coingecko.com/reports/2025/CoinGecko-State-of-Crypto-Perpetuals-Market.pdf
[5] Paddrik, M., & Zhang, S. (2020). Central counterparty default waterfalls and systemic loss (OFR Working Paper No. 20-04). Office of Financial Research. https://www.financialresearch.gov/working-papers/files/OFRwp-20-04_central-counterparty-default-waterfalls-and-systemic-loss.pdf
[6] Dell'Erba, M. (2024). Crypto-trading platforms as exchanges. Michigan State Law Review, 2024(1). https://papers.ssrn.com/sol3/papers.cfm?abstract_id=4405361 https://doi.org/10.2139/ssrn.4405361
[7] Yadav, Y. (2023). The centralization paradox in cryptocurrency markets. Washington University Law Review, 100, 1725. https://wustllawreview.org/2023/08/09/the-centralization-paradox-in-cryptocurrency-markets/
[8] Three Sigma. (2025, January 1). 2024 most exploited DeFi vulnerabilities. Three Sigma. https://threesigma.xyz/blog/exploit/2024-defi-exploits-top-vulnerabilities
[9] Wilson Center. (2025, March 31). The Bybit heist: What happened & what now? Wilson Center. https://www.wilsoncenter.org/article/bybit-heist-what-happened-what-now
[10] European Securities and Markets Authority. (2025, July 1). Maximal extractable value: Implications for crypto markets (ESMA50-481369926-29744). https://www.esma.europa.eu/sites/default/files/2025-07/ESMA50-481369926-29744_Maximal_Extractable_Value_Implications_for_crypto_markets.pdf
[11] Chainlink. (2025, June 6). Seven key cross-chain bridge vulnerabilities explained. Chainlink Education Hub. https://chain.link/education-hub/cross-chain-bridge-vulnerabilities
[12] The Block. (2025, January 8). Hyperliquid responds to community concerns over validator issues. The Block. https://www.theblock.co/post/333559/hyperliquid-responds-to-community-concerns-over-validator-issues
[13] Buterin, V. (2017, December 31). On sharding blockchains (the scalability trilemma). Sharding FAQ. https://vitalik.eth.limo/general/2017/12/31/sharding_faq.html
[14] Vidal-Tomas, D. (2025). Centralized exchanges & proof-of-solvency: The guardians of trust. Journal of International Financial Markets, Institutions and Money, 103. https://www.sciencedirect.com/science/article/pii/S1042443125000733
[15] CME Group. (2025). CME Group reports record average daily volume for 2024. https://www.cmegroup.com/media-room/press-releases/2026/1/08/cme_group_internationalaveragedailyvolumereachesrecord84millionc.html
[16] Federal Reserve History. (2013). Banking Act of 1933. https://www.federalreservehistory.org/essays/glass-steagall-act
[17] Brown, S. J., & Steenbeek, O. W. (2001). Doubling: Nick Leeson's trading strategy. Pacific-Basin Finance Journal, 9(2), 83-99. https://doi.org/10.1016/s0927-538x(01)00004-x
[18] Congressional Research Service. (2013). The MF Global bankruptcy, missing customer funds, and proposals for reform (Report R42091). https://www.congress.gov/crs-product/R42091
[19] Financial Stability Board. (2022). Derivatives markets and central counterparties. https://www.fsb.org/work-of-the-fsb/market-and-institutional-resilience/derivatives-markets-and-central-counterparties/
[20] Committee on Payment and Settlement Systems & Technical Committee of the International Organization of Securities Commissions. (2012). Principles for financial market infrastructures. Bank for International Settlements. https://www.bis.org/cpmi/info_pfmi.htm
[21] Bell, S., & Holden, H. (2018). Two defaults at CCPs, 10 years apart. BIS Quarterly Review, December 2018, 75-76. https://www.bis.org/publ/qtrpdf/r_qt1812x.htm
[22] Investment Company Institute, Securities Industry and Financial Markets Association, & The Depository Trust & Clearing Corporation. (2024). T+1 after action report. https://www.ici.org/news-release/24-t1-after-action-report-release
[23] The Depository Trust & Clearing Corporation. (2021). DTCC's Project ION platform moves to development phase following successful pilot with industry. https://www.dtcc.com/news/2021/september/15/dtccs-project-ion-platform-moves-to-development-phase-following-successful-pilot-with-industry
[24] European Parliament. (2023). Regulation 2023/1114 on markets in crypto-assets. Official Journal of the European Union.
[25] CoinGecko. (2026, February 26). Is the future of crypto perpetual? The meteoric rise of perp DEXs. https://www.coingecko.com/learn/rise-of-perpetuals-and-perp-dexs
[26] Binance Square. (2026, March 4). Perpetual DEX 2025-2026: From "CEX alternative" to core infrastructure. https://www.binance.com/en/square/post/297934520960097
[27] Cointelegraph. (2025, February 24). Bybit suffers \$1.5 billion hack - the biggest crypto heist in history. https://cointelegraph.com/news/bybit-suffers-1-5-billion-hack-biggest-crypto-heist-history
[28] dYdX Foundation. (2023, November 1). v4 technical architecture overview. https://www.dydx.xyz/blog/v4-technical-architecture-overview
[29] Nansen Research. (2023, March 15). Examination of decentralized perpetual designs. https://research.nansen.ai/articles/examination-of-decentralized-perpetual-designs
[30] Optimism Governance. (2022, July 19). Perpetual Protocol: Optimism governance's first failure. https://gov.optimism.io/t/perpetual-protocol-optimism-governances-first-failure/3029
[31] Cointelegraph. (2022, September 18). Decentralized exchange GMX suffers \$565K price manipulation exploit. https://cointelegraph.com/news/decentralized-exchange-gmx-suffers-565k-price-manipulation-exploit
[32] Resonance Security. (2025, July 9). How the GMX exchange was hacked for \$42 million [full analysis]. https://www.resonance.security/blog-posts/how-the-gmx-exchange-was-hacked-for-42-million-full-analysis
[33] Presto Research. (2024, November 7). Hyperliquid: The HYPE Begins. https://www.prestolabs.io/research/hyperliquid-the-hype-begins
[34] Yin, M., Malkhi, D., Reiter, M. K., Gueta, G. G., & Abraham, I. (2019). HotStuff: BFT Consensus with Linearity and Responsiveness. Proceedings of the 2019 ACM Symposium on Principles of Distributed Computing, 347-356.
[35] CoinDesk. (2025, January 8). HYPE Slumps 15%, HyperLiquid Responds to Scrutiny Over Lack of Decentralization. CoinDesk. https://www.coindesk.com/business/2025/01/08/hyper-liquid-responds-to-scrutiny-over-lack-of-decentralization-hype-slumps-15
[36] CryptoPotato. (2025, December 22). Hyperliquid Denies \$362M Risk Claims, Says Platform Is Fully Solvent. https://cryptopotato.com/hyperliquid-denies-362m-risk-claims-says-platform-is-fully-solvent/
[37] OneKey Blog. (2026, January 26). Hyperliquid Architecture Explained: Security & Decentralization. https://onekey.so/blog/ecosystem/hyperliquid-architecture-explained-security-decentralization-19137c/
[38] CoinDesk. (2025, March 26). HyperLiquid Delists JELLY After Vault Squeezed in \$13M Tussle. https://www.coindesk.com/markets/2025/03/26/hyperliquid-delists-jellyjelly-after-vault-squeezed-in-usd13m-tussle
[39] Binance Square. (2025, March 27). Hyperliquid Loses \$13.5M in JELLY Exploit: Key Details and AMM Risks. https://www.binance.com/en/square/post/22139574223130
[40] Financial Stability Board. (2023). The financial stability risks of decentralised finance. https://www.fsb.org/2023/02/the-financial-stability-risks-of-decentralised-finance/
[41] Glosten, L. R., & Milgrom, P. R. (1985). Bid, ask and transaction prices in a specialist market with heterogeneously informed traders. Journal of Financial Economics, 14(1), 71-100. https://doi.org/10.1016/0304-405x(85)90044-3
[42] Milionis, J., Moallemi, C. C., Roughgarden, T., & Zhang, A. L. (2022). Automated market making and loss-versus-rebalancing. arXiv preprint arXiv:2208.06046. https://doi.org/10.48550/arXiv.2208.06046
[43] Ali, Z. (2025). Anatomy of the Oct 10-11, 2025 crypto liquidation cascade: Macroeconomic triggers, market microstructure, and systemic risk lessons. SSRN. https://ssrn.com/abstract=5611392
[44] Bank for International Settlements. (2026, March 5). Tokenomics and blockchain fragmentation (BIS Working Papers No. 1335). https://www.bis.org/publ/work1335.pdf
[45] Lehar, A., Parlour, C. A., & Zoican, M. (2023). Fragmentation and optimal liquidity supply on decentralized exchanges. arXiv preprint arXiv:2307.13772. https://doi.org/10.48550/arXiv.2307.13772
[46] Chainalysis. (2022). Vulnerabilities in cross-chain bridge protocols emerge as top security risk. https://www.chainalysis.com/blog/cross-chain-bridge-hacks-2022/
[47] Hansen, P. R., Kim, C., & Kimbrough, W. (2024). Periodicity in cryptocurrency volatility and liquidity. Journal of Financial Econometrics, 22(1), 224-251. https://doi.org/10.1093/jjfinec/nbac034
[48] Makarov, I., & Schoar, A. (2020). Trading and arbitrage in cryptocurrency markets. Journal of Financial Economics, 135(2), 293-319. https://doi.org/10.1016/j.jfineco.2019.07.001
[49] Mourey, M., Shahrour, M. H., & Soiman, F. (2025). A crypto-stock weekend effect: Predicting Monday stock returns using weekend cryptocurrency returns. SSRN. https://ssrn.com/abstract=5382090 https://doi.org/10.2139/ssrn.5382090
[50] Naifar, N., & Makni, M. S. (2025). Dynamics of cryptocurrencies, defi tokens, and tech stocks: Lessons from the FTX collapse. International Journal of Financial Studies, 13(3), 169. https://doi.org/10.3390/ijfs13030169
[51] Chen, E., Ma, M., & Nie, Z. (2024). Exploring the impact: How decentralized exchange designs shape traders' behavior on perpetual future contracts. arXiv preprint arXiv:2402.03953. https://doi.org/10.48550/arXiv.2402.03953
[52] Barbon, A., & Ranaldo, A. (2024). On the quality of cryptocurrency markets: Centralized versus decentralized exchanges. arXiv preprint arXiv:2112.07386. https://doi.org/10.48550/arXiv.2112.07386
[53] Adams, A., Chan, B. Y., Markovich, S., & Wan, X. (2024). Don't let MEV slip: The costs of swapping on the Uniswap protocol. arXiv preprint arXiv:2309.13648. https://doi.org/10.48550/arXiv.2309.13648
[54] Wu, F., Sui, D., Thiery, T., & Pai, M. (2025). Measuring CEX-DEX extracted value and searcher profitability: The darkest of the MEV dark forest. arXiv preprint arXiv:2507.13023. https://doi.org/10.48550/arXiv.2507.13023
[55] Dell'Erba, M. (2025). Crypto-derivatives. University of Illinois Law Review, 2025(5), 1613.
[56] Jalan, A., & Matkovskyy, R. (2023). Systemic risks in the cryptocurrency market: Evidence from the FTX collapse. Finance Research Letters, 53, 103670. https://doi.org/10.2139/ssrn.4364121