A single 10x-leveraged long position in ETH perpetual futures traverses markedly different execution paths on a centralized exchange (CEX), a general-purpose public-chain decentralized exchange (DEX), and an application-chain DEX. On a centralized exchange, the order is matched within 500 milliseconds at fees as low as 0.02%, yet the margin is held in the exchange's centralized wallet; what the user holds is merely a claim recorded in a database, the order-sequencing process is entirely opaque to outsiders, and the 2022 collapse of FTX—which exposed a customer-fund shortfall of roughly $8.7 billion—revealed the systemic risk inherent in this custodial structure [1]. On a general-purpose public-chain DEX built on Ethereum, the user retains sovereignty over assets through a self-custodial wallet, but trading intent is exposed in the public mempool, where a sandwich attack can convert 0.3% of slippage into profit for maximal extractable value (MEV) searchers [2], so the price of asset sovereignty is an implicit transparency tax. On an application-chain DEX, the user obtains sub-second matching and near-zero slippage while retaining on-chain self-custody, yet the underlying network may be maintained by only a dozen or so validator nodes, and the risk of validator collusion becomes a new trust assumption.
These three execution paths epitomize the structural transformation now under way in crypto derivatives markets, which grew rapidly in 2025. CEX perpetual futures volume reached approximately $86.2 trillion, up 47.4% year over year [3]. The more striking change, however, occurred in decentralized markets: DEX perpetual futures volume grew 346% year over year in 2025, reaching approximately $6.7 trillion [3]. The ratio of DEX to CEX perpetual futures volume climbed from 2.1% in early 2023 to 11.7% by November 2025—roughly one DEX trade for every nine CEX trades at that ratio [4]. Within this shift, application-chain DEXs led by Hyperliquid at one point captured roughly 60% of the on-chain perpetual futures market, with annualized volume rivaling that of established CEXs such as Coinbase [5].
These figures reflect a deep transformation in the market's fundamental structure. The migration of volume from CEXs to DEXs is not merely a reallocation of market share; it signals that the market's basic rules are being redefined. How prices form, how participants compete, how risk is distributed, and how fairness is defined are all undergoing fundamental change. Drawing on the market-microstructure methodology of Harris (2003) [6], this chapter builds an analytical framework that dissects how each structure shapes the economic activity and power relations within it, rather than simply judging which is superior.
This chapter argues that the evolution of market structure is not a linear replacement of CEXs by DEXs but a paradigm shift in the mode of competition. The object of competition migrates from latency to information and then to mechanism, and each migration redefines who wins and who loses. Beginning with the micro-level trade lifecycle, the chapter advances a competition-mode migration thesis, examines the rise of strategic MEV in depth, explores the price-discovery migration hypothesis, analyzes the evolution of risk distribution, and finally considers the convergence and endgame of the three paradigms.
6.1 The trade lifecycle
The execution path of a trade—from order submission through matching to final settlement—is far more than a technical distinction. It fundamentally determines how information flows, how power is allocated, and how costs arise. Chapter 5 performed a static dissection of the internal components and risks of the three architectures from the service provider's perspective; this section shifts the vantage point, tracing a trade's complete journey through the three architectures from the trade's own point of view. This complementary perspective reveals the sharply different trade-offs that centralized exchanges, general-purpose public-chain DEXs, and application-chain DEXs make among performance, transparency, security, and cost, providing a solid factual basis for the competition-mode analysis in Section 6.2.
Figure 6-1 compares the essential differences among the three paradigms across four stages: order submission, matching, settlement, and asset custody.
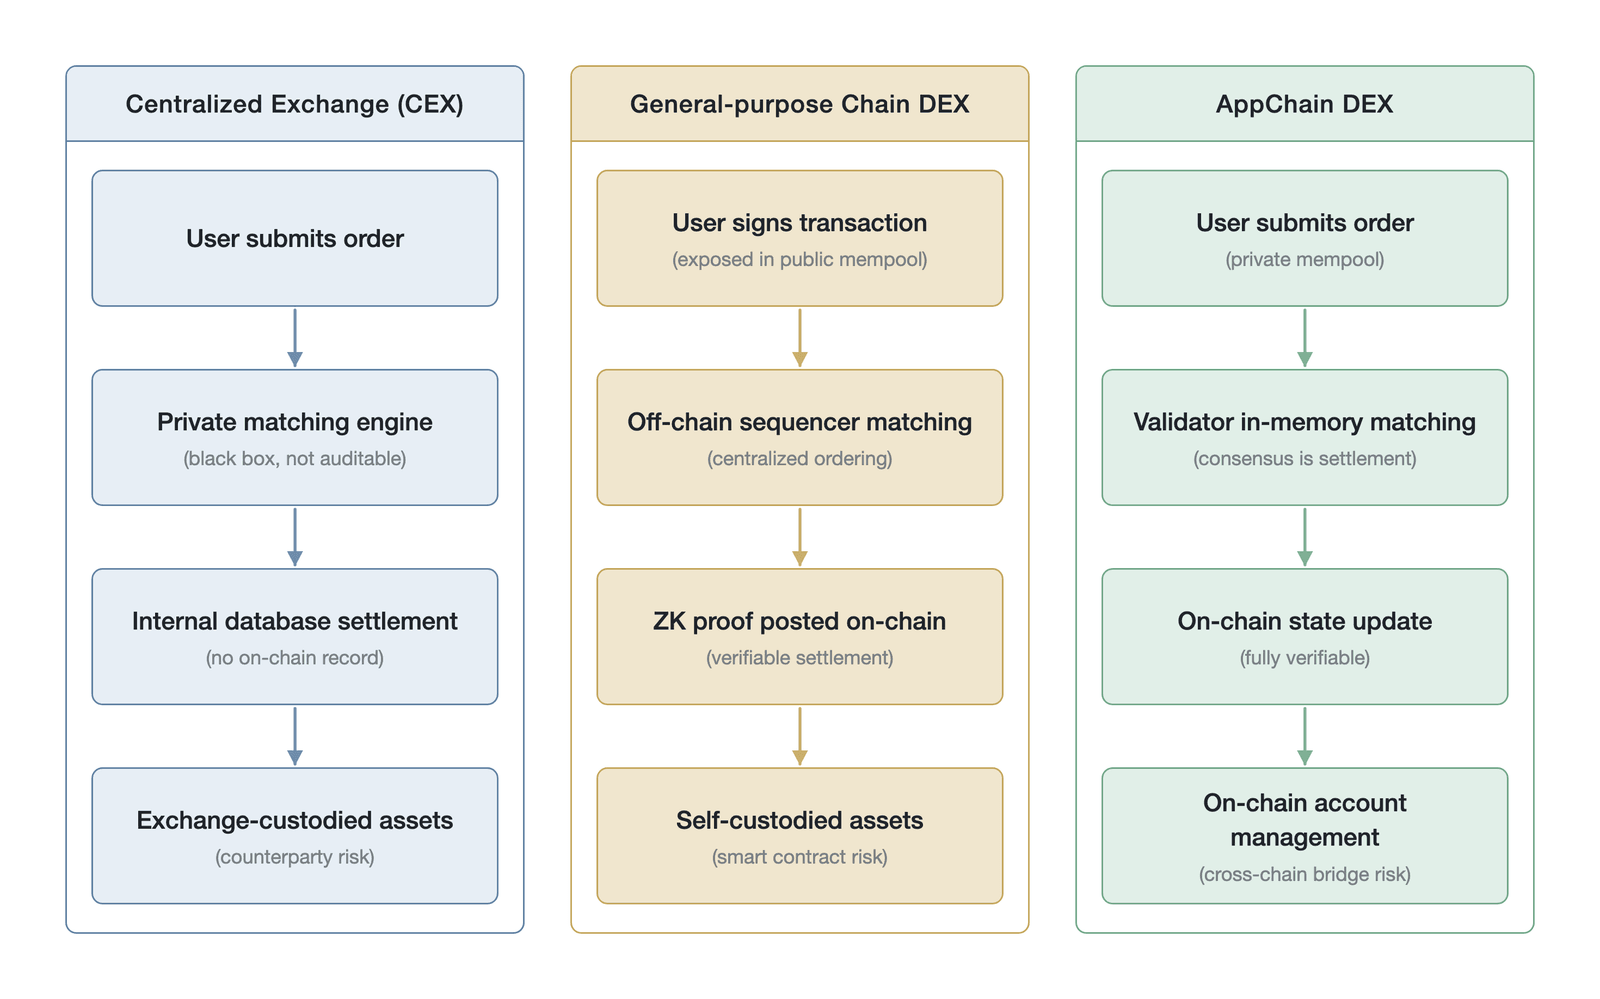
Figure 6-1. Comparison of the trade execution flow across the three perpetual futures market-structure paradigms (a conceptual process comparison, not empirical data; drawn by the author, based on Harris [6])
6.1.1 Centralized exchanges
A centralized exchange is operated by a single entity whose private, centralized servers maintain the order book, match trades, and custody user assets. A user's trading records are merely entries in an internal database, interacting with the blockchain only at deposit and withdrawal. The core advantage of this architecture is high performance: the internal latency of top-tier matching engines has reached the sub-millisecond and even sub-100-microsecond range, while end-to-end response latency from API submission to confirmation is typically between 1 and 10 milliseconds, with throughput exceeding a million orders per second—a level no on-chain solution can currently match.
Order submission stage. A user submits a limit order or market order to the exchange's private servers through an API or web front end. From that moment, the trade enters an execution environment entirely opaque to the outside world. The user cannot verify which internal systems the order passes through before matching, cannot confirm whether sequencing strictly follows price-time priority, and cannot know whether the exchange itself or its affiliates enjoy some privilege in the order flow. This opacity is the structural root of information asymmetry in CEX markets. The exchange holds real-time order-flow data for all users, data of extremely high value for anticipating short-term price movements. This informational advantage creates structural room for potential unfairness. The flow of benefits between FTX and its affiliated trading firm, Alameda Research, is an extreme manifestation of this structural risk [1].
Matching stage. The high-performance matching engine scans the order book at microsecond speed, pairing buy orders with market makers' sell orders under price-time priority. It is here that the core game of the CEX paradigm—the adverse-selection game—unfolds. Market makers sustain market liquidity by quoting on both the bid and ask sides, earning their profit from the bid-ask spread. Their greatest risk, however, is being exploited by better-informed traders: when the market is about to move directionally, informed traders quickly hit the stale quotes that market makers have not yet updated, inflicting losses on the market makers.
Facing adverse-selection risk, market makers have two basic responses. The first is to widen the bid-ask spread, compensating for expected adverse-selection losses with a higher margin, though this reduces the competitiveness of their quotes. The second strategy has come to dominate in practice: increase speed, updating or withdrawing stale quotes faster than informed traders can act. This logic of speed as survival has driven a continuous arms race around infrastructure latency. Institutions with colocation services place their servers in the same physical space as the exchange's data center to minimize network latency; some deploy custom hardware such as field-programmable gate arrays (FPGAs) to accelerate trading logic at the physical layer, or use microwave communication networks in pursuit of a microsecond-level speed edge. This latency race, which has run for decades in traditional financial markets, is now replicated in full in crypto CEXs. As a result, market-making profits are highly concentrated among a handful of institutions with top-tier infrastructure, such as Wintermute, Jump Trading, and Cumberland.
The CEX fee structure further reinforces this competitive landscape. The mainstream maker-taker model rebates fees to makers who provide liquidity and charges higher fees to takers who consume it. Institutional market makers, as the primary makers, enjoy fee discounts or even negative fees, whereas retail traders, as takers, pay higher transaction costs. Seen this way, the fee structure is itself an institutionalized cost-transfer mechanism, shifting the implicit cost of sustaining liquidity from market makers onto ordinary traders.
Settlement stage. Once matching succeeds, settlement completes instantly on the exchange's internal ledger. This is essentially just an update of database account balances, involving no blockchain operation. Although extremely fast and cheap, what the user holds is not a genuine on-chain asset but a liability the exchange owes the user. The safety of assets depends entirely on the exchange's solvency and operational integrity. The 2022 collapse of FTX exposed a customer-fund shortfall of roughly $8.7 billion (per the debtors' estimate and the August 2024 court restitution order) [1][53], and the $1.5 billion security incident suffered by Bybit in February 2025 [7] both plainly reveal the systemic risk embedded in this centralized custodial structure. Notably, these two events belong to entirely different categories of operational risk: FTX was a governance and fraud failure, whereas the Bybit incident was a supply-chain attack in which the attacker—attributed to the Lazarus Group—manipulated the signing-ceremony interface of the Safe{Wallet} front end to induce multisig holders to sign a malicious transaction. This UI-layer attack vector is not unique to CEXs; any system relying on multisig approval—including DEX treasury management, cross-chain-bridge operator multisigs, and application-chain governance wallets—faces the same class of risk. In enjoying peak performance, the user in effect entrusts the entire security of their assets to an unauditable third party.
Risk management. The liquidation engine monitors the margin level of every account in real time. When the mark price (typically computed as the index price across multiple exchanges plus a funding-rate basis smoothed by an exponential moving average, or EMA) drives an account's margin ratio below the maintenance-margin requirement, the system automatically triggers forced liquidation. This mark-price methodology differs fundamentally from the oracle-based mark price used in DEXs, a design difference analyzed further in the discussion of oracle manipulation in Section 6.3.2. If a shortfall arises during liquidation—that is, if the liquidation proceeds are insufficient to cover the loss—the loss is borne by the exchange's insurance fund. Should the insurance fund be exhausted in extreme conditions, the remaining loss is allocated by rule to traders on the profitable side through an auto-deleveraging mechanism. The entire risk-control process, from margin calculation through liquidation execution to the use of the insurance fund, runs inside a black box that outsiders cannot independently audit. Users can neither verify the fairness of liquidation prices nor confirm the true size and use of the insurance fund.
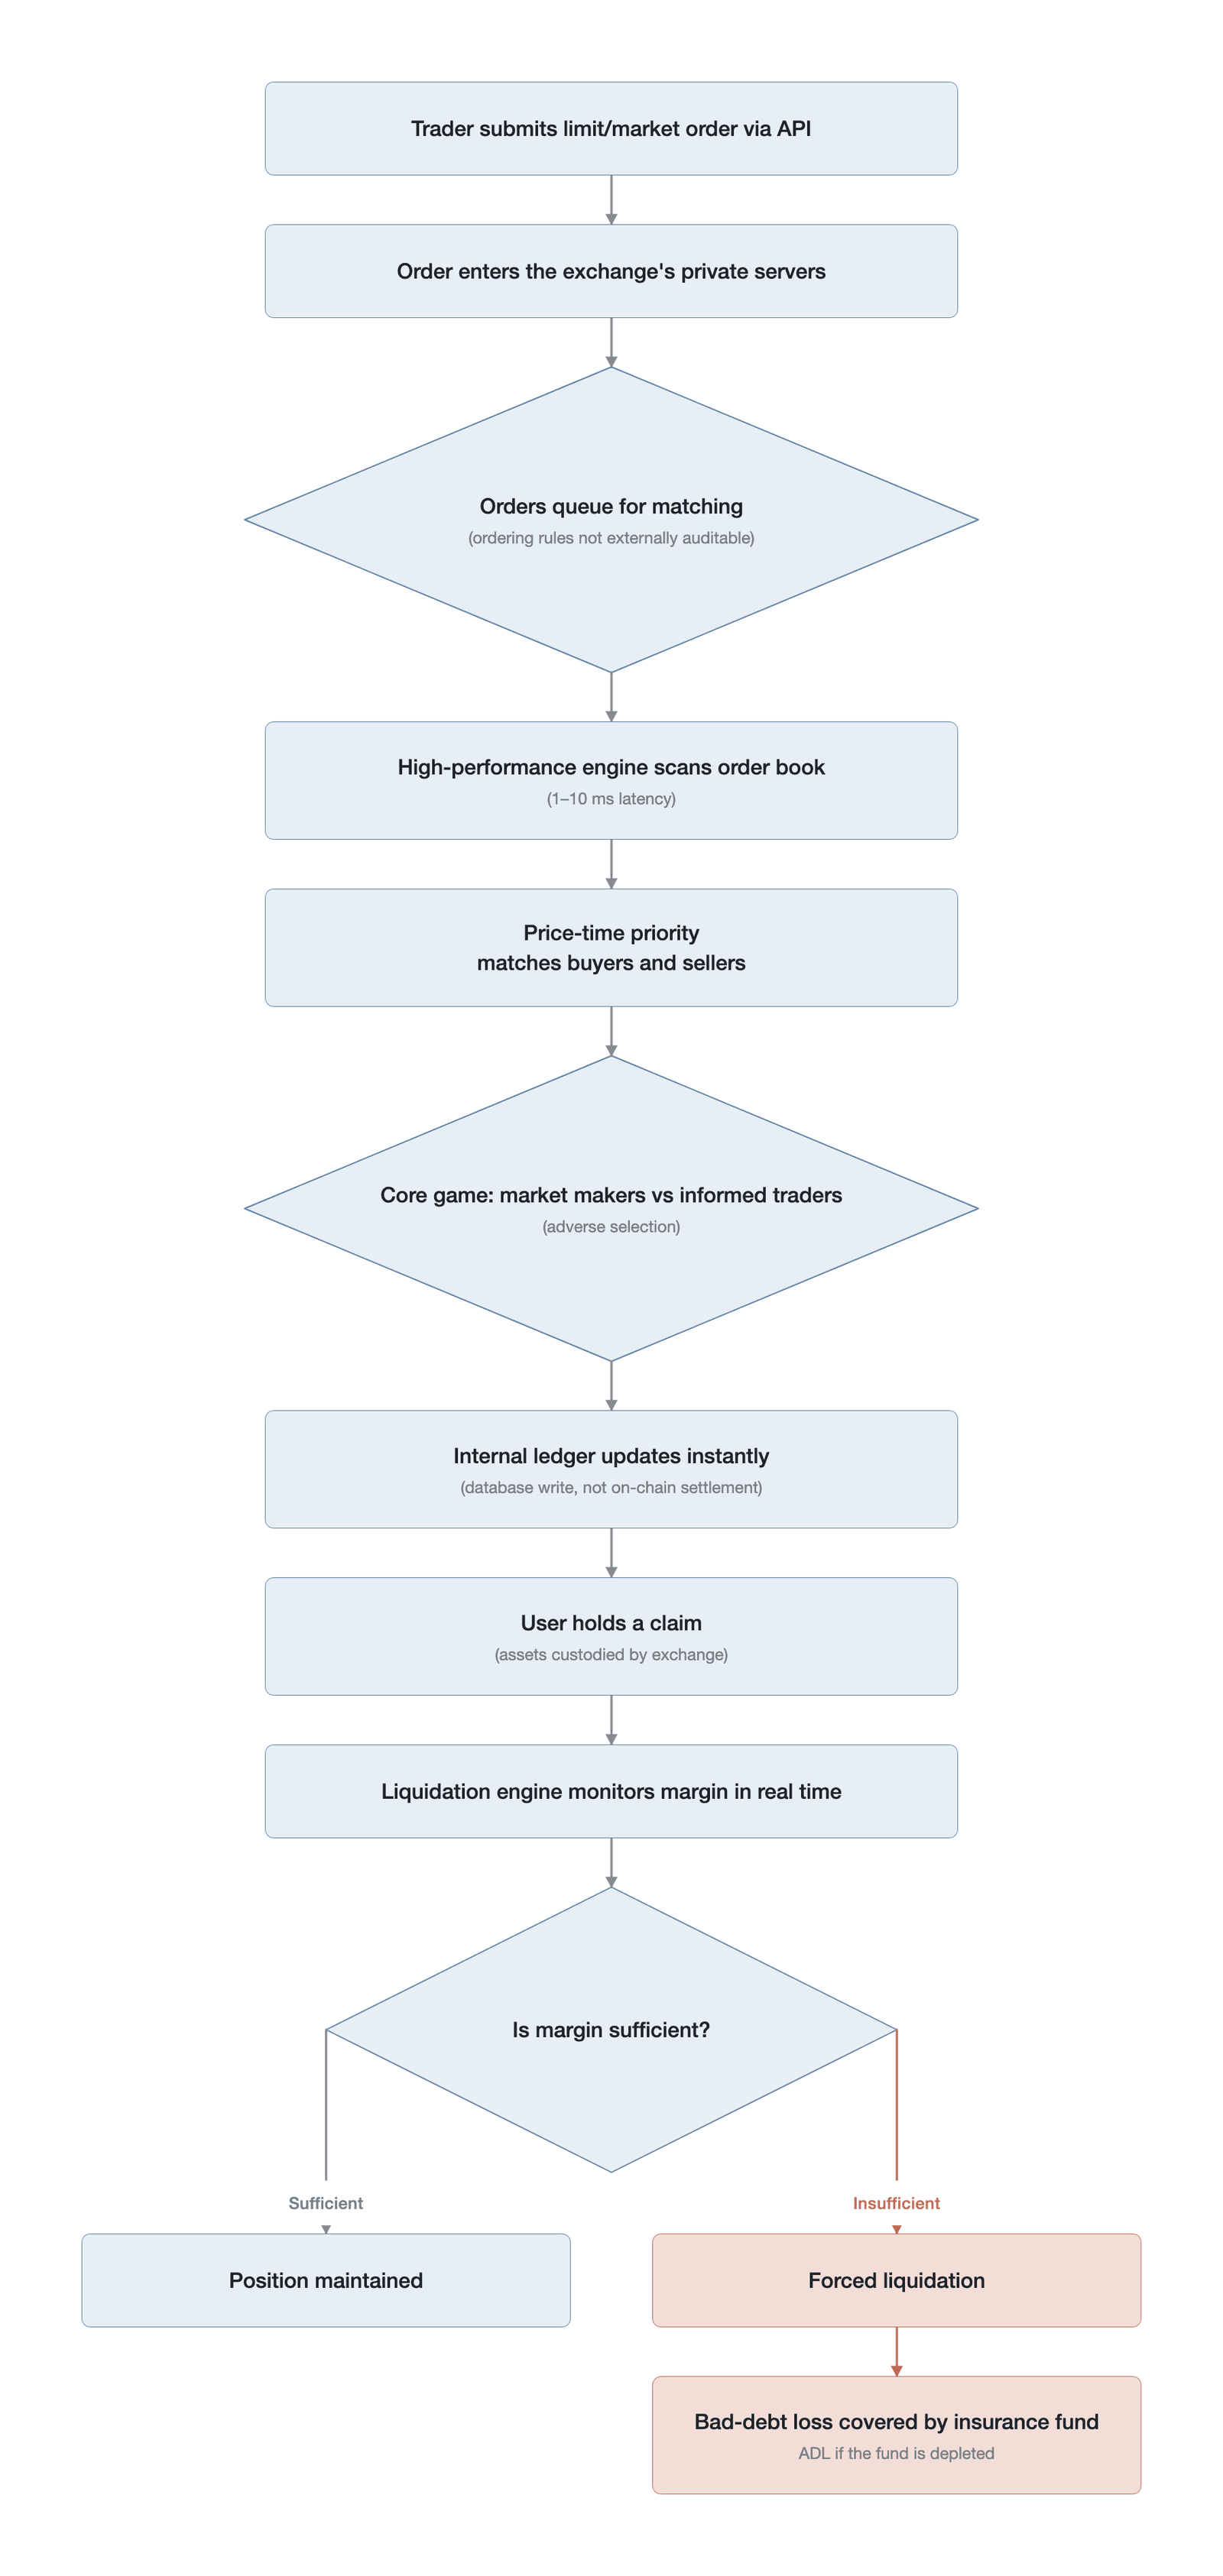
Figure 6-2. The trade lifecycle on a centralized exchange (from order submission to settlement and risk control, completed entirely within the exchange's private servers; a mechanism-process schematic in which the 1-to-10-millisecond figure refers to end-to-end response latency, not empirical data; drawn by the author, based on Harris [6])
6.1.2 General-purpose public-chain DEXs
A general-purpose public-chain DEX deploys its core settlement logic on a public blockchain while executing some functions—such as order-book maintenance and matching—off-chain. This hybrid model of off-chain matching, on-chain settlement seeks a balance between the security of the blockchain and the performance of trading. Representative general-purpose public-chain DEXs today include GMX v2 and Vertex on Arbitrum. Notably, the early architecture typified by dYdX v3 (built on StarkEx) has undergone a major transformation: dYdX v4 migrated to a standalone application chain based on the Cosmos SDK at the end of 2023 and, under this chapter's taxonomy, now falls within the application-chain DEX category—a migration that is itself strong evidence for the competition-mode migration thesis in Section 6.2. Its typical architecture is based on ZK-Rollup technology, with an off-chain sequencer handling high-speed matching and on-chain smart contracts handling final state verification and asset custody.
Order submission stage. A user cryptographically signs the trade with a self-custodial wallet. Before the trading intent is finally confirmed and packed into a block, it is typically exposed in the public mempool. The public mempool is the cornerstone of blockchain transparency: it ensures that all pending transactions are visible to every participant in the network, safeguarding the system's auditability. Yet this same transparency makes pending transactions highly vulnerable to MEV extraction. MEV searchers continuously scan the mempool with specialized algorithms, and once they spot a large order, they extract value from it through a variety of strategies.
The most common forms of MEV attack include the following. Front-running: after detecting a large buy order, the searcher buys ahead of it at a lower price and sells for a profit once the large order pushes the price up. The sandwich attack: the searcher inserts a buy and a sell transaction, respectively, before and after the target transaction, capturing a risk-free profit from the target's price impact. And liquidation sniping: the searcher monitors the margin status of on-chain positions and, when liquidation conditions are about to trigger, front-runs the liquidation to capture the reward the protocol offers. The common feature of these attacks is that they all rely on the trading-intent information exposed by the public mempool.
The MEV value chain and the multi-tier auction. The competitive relationship in a general-purpose public-chain DEX is fundamentally different from that in a CEX. In a CEX, the core game plays out between market makers and informed traders and centers on the asymmetry of price information. In a general-purpose public-chain DEX, the core game plays out between active MEV searchers and passive ordinary traders and centers on the speed and strategic depth with which public information is exploited.
MEV extraction forms a layered value chain. Ordinary traders are the source of value; their trading intent is exposed in the mempool. MEV searchers capture arbitrage opportunities through algorithmic scanning and send carefully constructed arbitrage bundles, together with a bribe fee, to block builders. Block builders select the profit-maximizing combination from the bundles submitted by many searchers, assemble a complete block, and submit it to validators. Validators select the highest-bidding block to propose and confirm. The total cost of this multi-tier auction is ultimately borne by ordinary traders, while the profit is distributed among searchers, builders, and validators according to the equilibrium of the game.
In a thematic report released in July 2025, the European Securities and Markets Authority (ESMA) noted that MEV searchers typically pay the vast majority of their revenue—roughly 85% to 93%—to block proposers, making the right to order transactions an extremely scarce resource [2]. ESMA further noted that MEV poses a potential threat to market fairness and investor protection, marking the problem's formal entry into the field of view of global financial regulators. This judgment bears a deep structural resemblance to traditional financial markets' regulatory concerns about high-frequency trading; both involve the systematic exploitation of an informational advantage and the fairness issues that result.
Matching and settlement stage. Orders are sent to an off-chain sequencer for matching. The sequencer packages a batch of matched trades, generates a zero-knowledge proof (such as a ZK-STARK), and submits it to a smart contract on the Ethereum mainnet for verification. The core advantage of this design is that it guarantees the correctness of settlement at the mathematical level: even if the sequencer tries to forge trade results or tamper with account balances, the on-chain zero-knowledge-proof verification mechanism can detect and reject the invalid state transition. Users need not trust the sequencer's honesty—only the correctness of the mathematics.
Nevertheless, the centralization of the sequencer itself remains a risk worth attention. A sequencer outage means the entire exchange halts, and users cannot execute any trades or adjust positions during that time. On top of this, the sequencer could in theory selectively delay or reject transactions, though such behavior can be detected after the fact. To mitigate this risk, most Layer-2 designs include a forced-exit mechanism that lets users withdraw assets directly through the mainnet contract when the sequencer fails, ensuring assets cannot be permanently locked.
Risk management. In sharp contrast to the black-box risk control of a CEX, the liquidation logic of a general-purpose public-chain DEX is hard-coded into on-chain smart contracts. Anyone can monitor the margin status of on-chain accounts and, when liquidation conditions trigger, call the contract function to perform the liquidation and capture the reward the protocol offers. This permissionless, open liquidation market greatly enhances the system's overall stability, because liquidation no longer depends on the risk-control capacity of a single entity but is maintained jointly by participants across the entire network. Yet this mechanism brings both benefit and risk: in extreme conditions, all participants can see in real time which positions are about to be liquidated, which can produce a liquidation cascade—a large number of liquidations triggering at once, further depressing the price, triggering still more liquidations, and forming a vicious cycle. In addition, code vulnerabilities in the smart contracts themselves are a risk source that cannot be ignored; once a contract is attacked, losses can be catastrophic and hard to reverse.
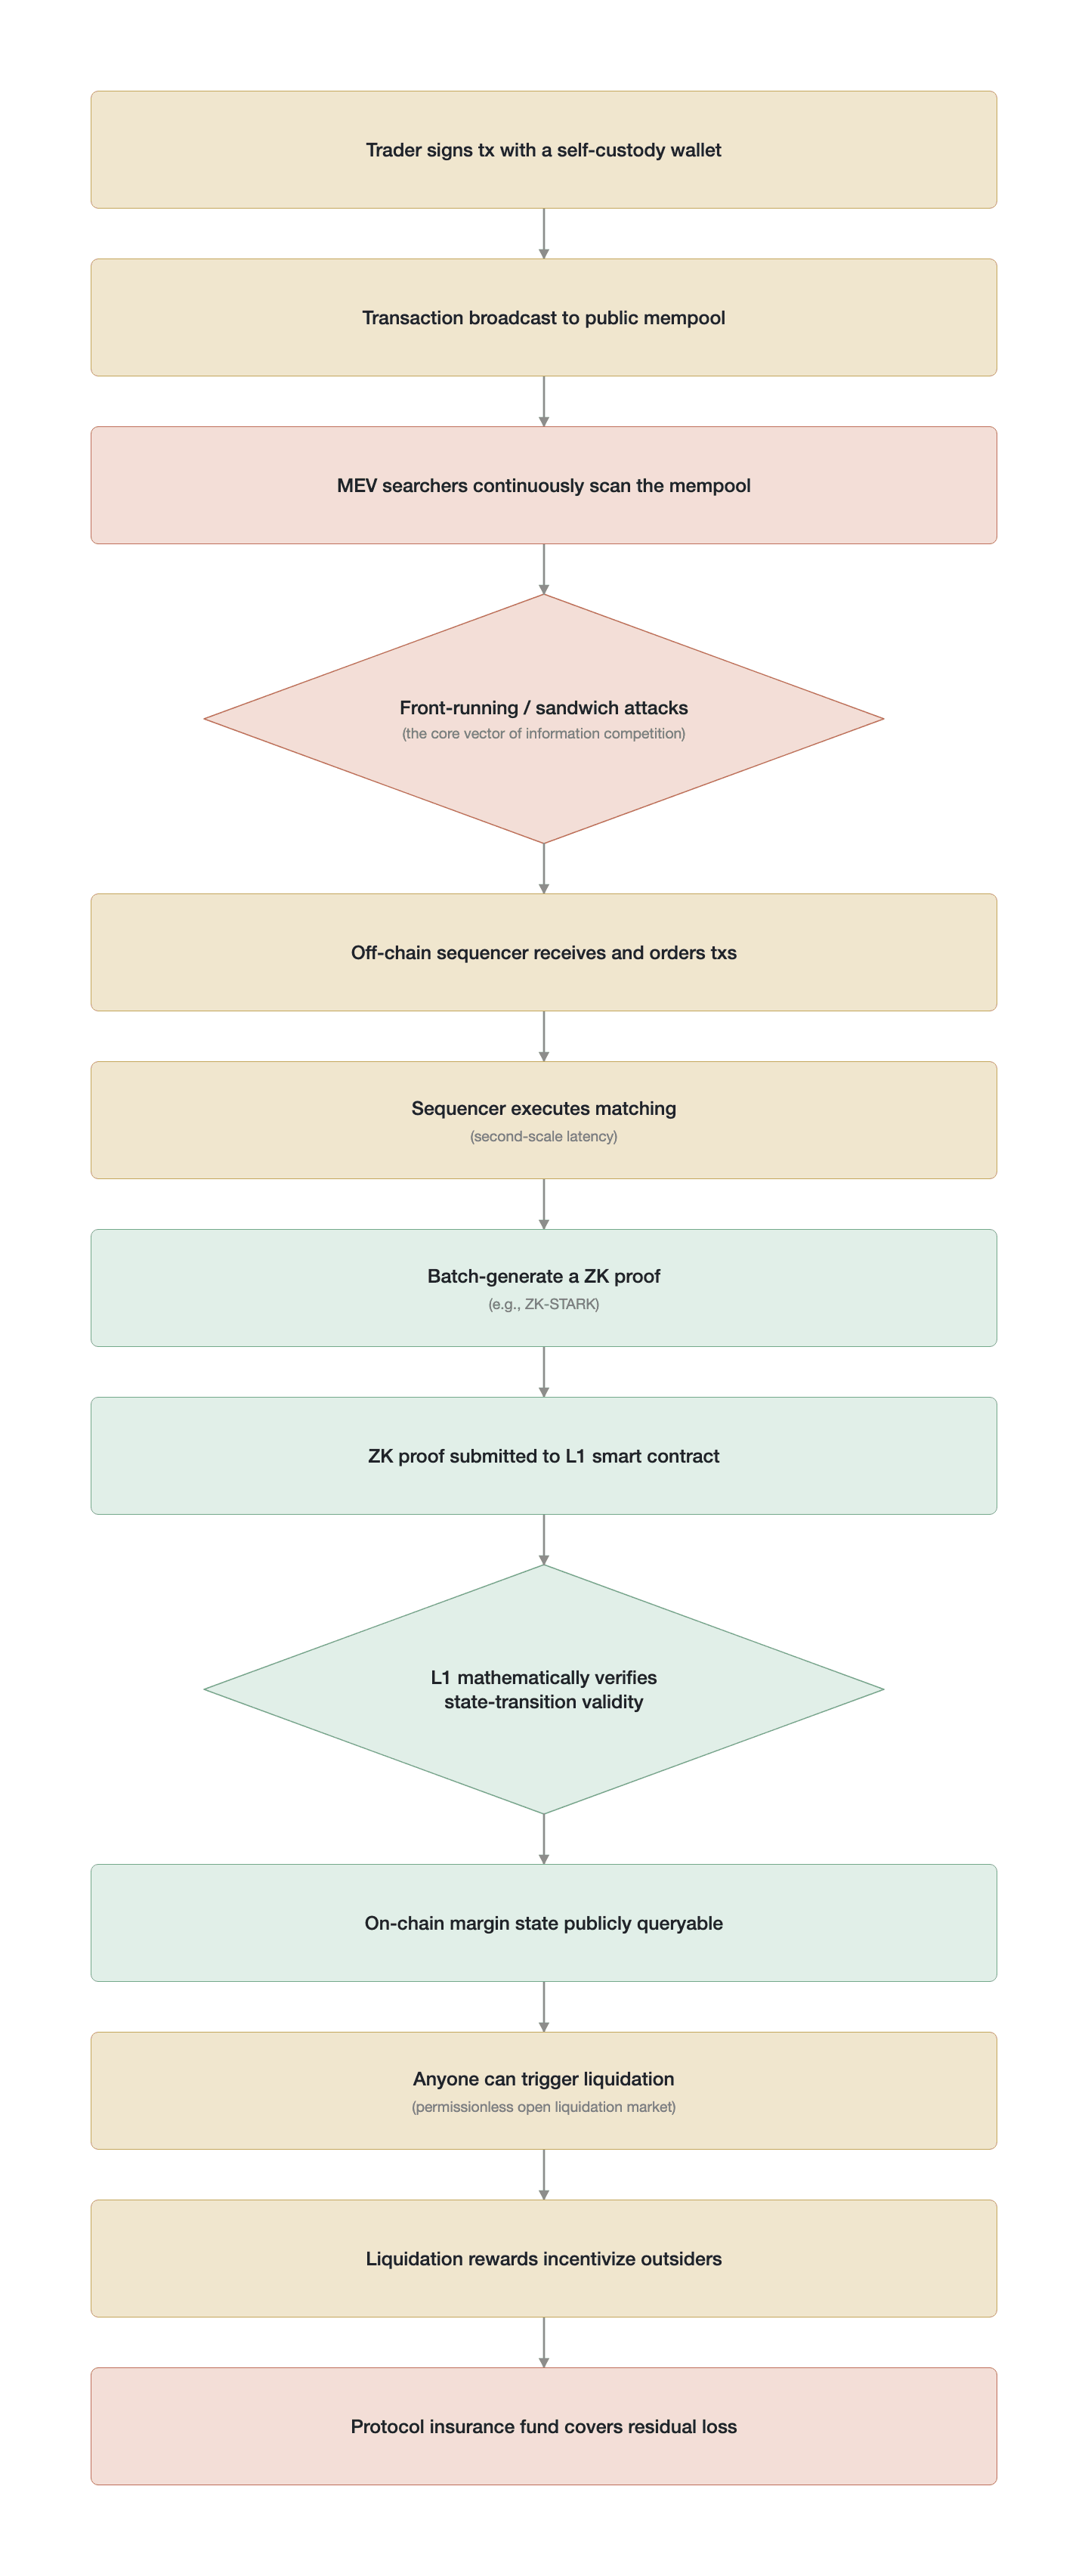
Figure 6-3. The hybrid execution path of a general-purpose public-chain DEX (after the trade is exposed in the public mempool, it is matched by an off-chain sequencer and finally settled on the mainnet via a ZK proof; a conceptual process schematic, not empirical data; drawn by the author, based on ESMA [2] and Harris [6])
6.1.3 Application-chain DEXs
The application-chain DEX represents a third direction in the evolution of market structure. It builds the entire exchange—order book, matching engine, settlement, and risk management—as an independent, sovereign blockchain deeply optimized for trading. For application-chain protocols typified by dYdX Chain (built on the Cosmos SDK) and Hyperliquid, the core idea is this: the architecture of a general-purpose public chain cannot provide sufficient performance or room for customization for high-frequency trading, so a dedicated chain must be purpose-built for the exchange [5].
Full-stack control and extreme performance optimization. Unlike a general-purpose public-chain DEX, which deploys smart contracts only at the application layer, an application-chain team holds full-stack control, spanning the application layer (exchange logic), the consensus layer (the validator network), the network layer (node communication), and the data layer (state storage). This full-stack control creates room for high-performance optimization. In a traditional blockchain architecture, a transaction must pass through several steps—mempool broadcast, block packing, and consensus confirmation—before it can finalize. In an application chain, these steps are deeply integrated and optimized: the order book is maintained directly in validators' memory, and matching logic is embedded in the consensus process itself. Take Hyperliquid's HyperBFT consensus protocol: matching and confirmation complete in the same step, achieving sub-second confirmation latency and giving users an experience close to that of a CEX. The operational risk of Byzantine fault-tolerant (BFT) consensus, however, cannot be ignored: when the leader node goes offline, the protocol must perform a view change (leader rotation), during which no blocks are produced and no transactions are confirmed. For a perpetual futures exchange, a consensus interruption of several seconds amid volatile conditions can prevent users from adjusting margin or closing positions, thereby triggering passive liquidation.
Order submission and matching stage. A user's signed order is sent directly to validator nodes and enters a private mempool. In sharp contrast to the public mempool of a general-purpose public-chain DEX, trading intent in a private mempool is not broadcast network-wide and is visible only to the validator currently responsible for producing the block. This design structurally and substantially weakens external searchers' sandwich attacks and front-running, because searchers can hardly scan pending transactions, making these traditional forms of MEV technically very difficult. The private mempool does not eliminate MEV, however; it concentrates MEV-extraction capability, moving it from a group of openly competing searchers to the leader validator currently responsible for producing the block, creating a monopolistic window for MEV extraction. In the absence of verifiable ordering rules—such as first-in-first-out (FIFO) ordering enforced by a ZK proof—a validator can freely order transactions during its leader round, and the covert nature of this MEV behavior makes it harder to detect and quantify than MEV in a public mempool.
In an application chain, validators play a dual role: they are participants in consensus (voting to confirm blocks) and operators of the matching engine (maintaining the order book in memory and executing matching). After orders are matched at high speed in a validator's memory, the result is proposed to other validators as part of a block for consensus confirmation. Here, consensus is settlement: once a block receives confirming signatures from enough validators, the trade completes matching and settlement simultaneously, with no need to wait for the additional on-chain verification step required by a general-purpose public-chain DEX.
New trust assumptions and validator MEV. Even as the application-chain architecture eliminates one class of risk, it introduces a new trust assumption. Because validators control the right to order transactions, they can in theory perform self-preferential ordering—for example, inserting their own buy order ahead of a user's large buy order, or delaying the processing of certain transactions. This validator MEV is more covert than MEV in a public mempool, because it occurs inside a validator's internal systems and is hard for outsiders to detect and quantify in real time.
The degree of decentralization of the validator network and the cost of misbehaving therefore become key variables for the system's fairness. If validators are numerous enough and broadly distributed geographically and in their interests, the payoff to a single validator from misbehaving will be far smaller than the cost of having its staked tokens slashed, forming an effective economic deterrent. But some application chains had very few validators in their early stages. Hyperliquid had only 16 validators early on [5]. Although Ethereum has roughly 1 million validator nodes, large staking pools such as Lido control about 28% of the staked share, so the number of effective independent operators is far below the nominal node count. A more appropriate comparative metric is the Nakamoto coefficient—the minimum number of independent entities needed to control 33% or 51% of the staking weight—rather than the raw node count. Even so, Hyperliquid's validator set remains far inferior to Ethereum's on this metric. This limited validator set makes the possibility of node collusion a hidden danger that cannot be ignored. Although the staking-slashing mechanism provides economic-level security, if a small number of validators control the majority of the network's staking weight, the potential payoff from collusion may exceed the cost of slashing, weakening the system's security assumptions.
Risk management and on-chain governance. An application chain's core risk-control mechanisms—liquidation parameters (such as the maintenance-margin ratio and the liquidation-penalty rate) and the rules governing use of the insurance fund—are determined by on-chain governance. This means all rules are public and transparent, and any participant can know in advance under what conditions which risk-control action will trigger. This predictability is a major improvement over the black-box risk control of a CEX.
Governance itself, however, is also a complex arena of play. Large token holders can, through their votes, profoundly influence protocol parameters that bear on the interests of all traders. For example, adjusting the liquidation-penalty rate directly affects the incentives of liquidators and the losses of those being liquidated; adjusting the insurance fund's replenishment mechanism affects the profit distribution of all LPs. Where governance power is highly concentrated, the interests of a few large holders may take priority over those of the community as a whole. In addition, depositing assets into an application chain usually requires a cross-chain bridge, and the security of cross-chain bridges has historically been among the more fragile links in DeFi. According to public tallies from the DeFiLlama and Rekt databases (data as of 2025, with figures varying by how cross-chain bridges are defined and how incidents are classified), cross-chain-bridge attacks caused more than $2.5 billion in asset losses between 2021 and 2025 (the larger individual incidents include Ronin at roughly $625 million, Wormhole at roughly $320 million, and Nomad at roughly $190 million) [8]; and for an application-chain DEX, nearly all user funds must be deposited through the bridge, making the bridge the single largest attack surface. Before a user's assets enter the application chain, they must bear the smart-contract risk and relay-node risk of the bridging process.
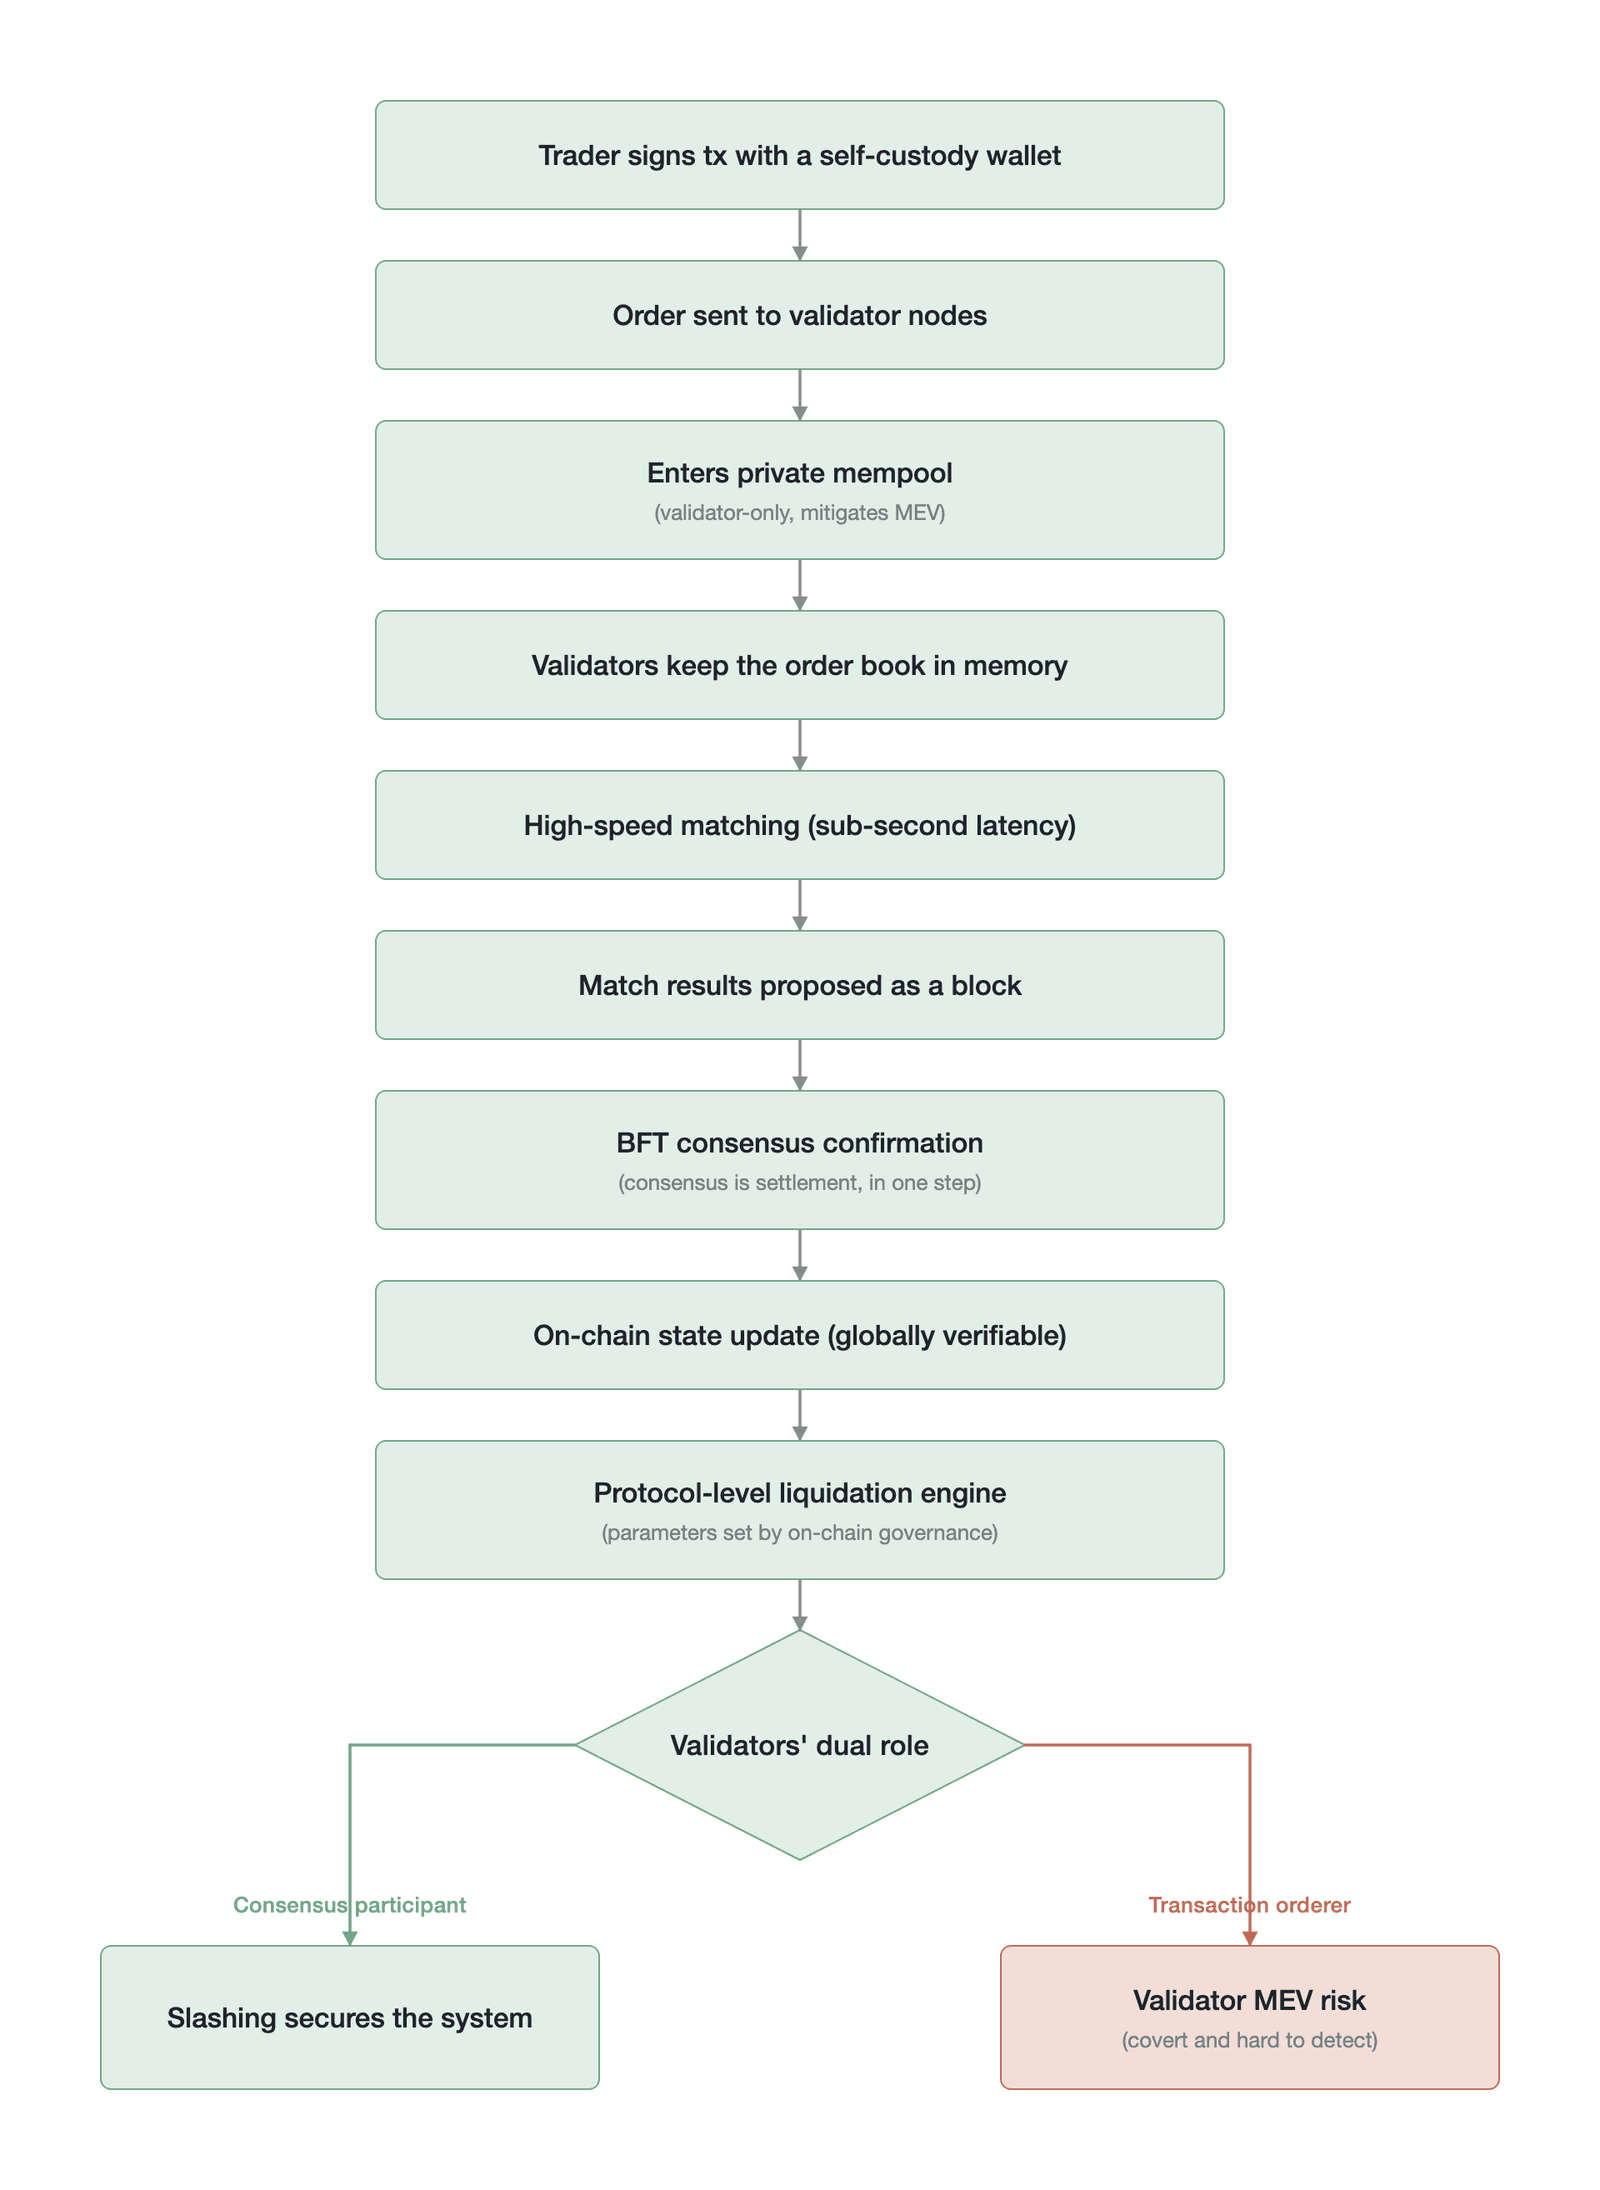
Figure 6-4. The integrated trade flow of an application-chain DEX (orders enter validator memory for matching through a private mempool, and consensus and settlement complete in the same step; a conceptual process schematic, not empirical data; drawn by the author, based on Coinage Media [5] and Eco.com [9])
6.1.4 Structural comparison
Having traced the complete trade lifecycle, the table below systematically compares the essential differences of the three paradigms at their key junctures along eight dimensions: order visibility, matching mechanism, settlement path, asset custody, the core game, opacity risk, risk-control transparency, and the liquidation mechanism. These differences are not a simple ranking of which is better but structural trade-offs made under different constraints.
| Dimension | Centralized exchange | General-purpose public-chain DEX | Application-chain DEX |
|---|---|---|---|
| Order visibility | Visible only to the exchange; inside a black box | Present in the public mempool; globally visible | Present in the private mempool; visible only to validators |
| Matching mechanism | Centralized high-performance engine (internal sub-millisecond; end-to-end 1–10 ms) | Off-chain sequencer matching (sub-second); settlement finality depends on L1 (seconds to minutes) | In-memory matching by validators (sub-second latency) |
| Settlement path | Internal database-ledger update; no on-chain operation | ZK proof submitted to the mainnet for verification | Consensus and settlement merged into one |
| Asset custody | Centralized exchange custody; the user holds a claim | Self-custodial wallet; managed by smart contracts | On-chain self-custody; depositing relies on a cross-chain bridge |
| Core game | Market makers vs. informed traders (adverse selection) | MEV searchers vs. ordinary users (information exploitation) | Mechanism exploiters vs. protocol LPs (the mechanism game) |
| Primary opacity risk | The exchange uses its informational advantage for self-preferential treatment | MEV extraction is public, but ordinary users cannot escape it | Validator MEV is covert and hard for outsiders to detect |
| Risk-control transparency | Fully opaque; not externally auditable | Smart contracts are public; anyone can verify | On-chain governance sets parameters; rules are transparent |
| Liquidation mechanism | Executed internally by the exchange; the insurance fund is opaque | Permissionless, open liquidation market | Protocol-level liquidation engine; parameters are adjustable |
Table 6-1. Structural comparison of the trade lifecycle across the three paradigms (Data source: compiled by the author)
The comparison in Table 6-1 reveals a deep structural insight: each of the three paradigms selects a different resting point within the impossible triangle of performance, transparency, and decentralization. The centralized exchange chooses high performance, sacrificing transparency and control over assets, and its core game centers on latency. The general-purpose public-chain DEX chooses absolute transparency and decentralization, accepting a compromise in performance and the affliction of MEV, and its core game centers on information exploitation. The application-chain DEX tries to find an optimum between performance and transparency through a customized architecture, but it introduces new trust assumptions, and its core game centers on understanding and exploiting protocol mechanisms.
Market structure also systematically shapes trader behavior at the micro level. For example, on oracle-priced DEXs, a mechanically lower slippage and adverse-selection risk on the long side [11] has given rise to a systematic long bias [10], showing that different pricing mechanisms, fee structures, and risk-management rules regularly incentivize or suppress specific types of trading behavior—a shaping effect detailed in Section 6.4.4.
Each structural choice creates a different form of competition and gives rise to a different dimension of unfairness. In a CEX, unfairness manifests in the capital threshold of hardware and in the exchange's informational privilege; in a general-purpose public-chain DEX, it manifests in the systematic extraction of value from ordinary users by MEV searchers; in an application-chain DEX, it manifests in validators' implicit informational advantage and the possibility that protocol mechanisms are strategically exploited. Section 6.2 systematically analyzes how these forms of competition migrate as market structure evolves, and what that migration means for market participants and regulators.
6.2 The competition-mode migration thesis
In Chapter 5, we performed a static dissection of the three service-provider architectures, analyzing how their internal components operate and how risk is distributed in each. Markets, however, are not static structures but arenas of intense, real-time competition. Different market structures create not only different risks but also fundamentally different modes of competition. Across this evolution, the focus of competition, its weapons, its battlegrounds, and the very definition of fairness all undergo a profound migration.
This section advances the competition-mode migration thesis, arguing that the evolution of market structure is not a simple, linear replacement of centralized exchanges by decentralized exchanges but a paradigm shift in the focus of competition. In this shift, the object of the game migrates from traditional latency (whose hardware is faster) to information in general-purpose public-chain DEXs (who can exploit transparent data faster) and finally evolves, in application-chain DEXs, into a contest over mechanism (who understands the protocol's rules more deeply). Each migration redefines who wins, who loses, and what fairness means.
6.2.1 Latency competition in CEXs
As described in Section 6.1.1, the core game market makers face in a CEX is adverse selection [11][12]; their main response is to increase speed rather than widen spreads, which drives an arms race around microsecond-level latency waged with colocation and custom hardware as weapons [6].
Budish, Cramton, and Shim (2015) argued at the theoretical level that the design of the continuous limit order book inevitably produces mechanical arbitrage opportunities; competition does not eliminate these opportunities but merely raises the speed threshold needed to capture them [13]. The empirical data of Aquilina, Budish, and O'Neill (2022) further show that the most common latency-arbitrage races in traditional markets last only 5 to 10 microseconds [14]. In digital-asset markets, high-frequency trading firms likewise pursue double-digit-microsecond tick-to-trade performance [15]. The pattern of latency competition that ran for decades in traditional finance is replicated in full in crypto CEXs [16].
The consequences of latency competition are multidimensional. First, it greatly raises the barrier to market entry, and market-making profits are highly concentrated among a handful of institutions with top-tier infrastructure. Second, as described in Section 6.1.1, the maker-taker fee model, as an institutionalized cost-transfer mechanism, further entrenches the advantage of leading institutions [17]. Finally, the CEX architecture inherently contains structural information asymmetry: the exchange holds the order-flow data of all users, while the entire matching process runs in a black box that outsiders cannot audit; the flow of benefits between FTX and Alameda Research is precisely an extreme manifestation of this structural unfairness [1]. Under the CEX competition paradigm, the exchange's own informational advantage is an absolute structural unfairness that transcends hardware capital.
6.2.2 Information competition in general-purpose public-chain DEXs
As DeFi matured, DEXs on general-purpose public chains set out to eliminate the CEX black-box problem through thoroughgoing transparency. On DEXs built on public chains such as Ethereum, every trading intent is exposed in the public mempool before it is finally confirmed and packed into a block. This fundamental architectural change migrated the focus of competition from latency to information exploitation. The transparency paradox discussed in Chapter 1 is fully displayed here: transparency removes the privilege of centralized institutions, but it also enables technically capable participants to extract value systematically from ordinary users.
At this stage, MEV became the primary vehicle of information competition. The public mempool makes all pending transactions visible to everyone, so competition is no longer about whose hardware is faster but about who can analyze and exploit this public information faster and more precisely. The three basic forms of MEV (front-running, the sandwich attack, and liquidation sniping) and their layered value chain and multi-tier auction structure were detailed in Section 6.1.2 and are not repeated here; the total cost of this multi-tier auction is ultimately borne by ordinary traders, while the profit is distributed among searchers, builders, and validators.
MEV has a broad impact on the integrity of DeFi markets, and its negative externalities have drawn close attention from regulators [2]. The actual data show that the scale of this information competition is enormous. For example, daily MEV extraction on the Ethereum mainnet has long stayed on the order of hundreds of thousands of dollars; and over the 30 days from late 2025 to early 2026, MEV profit extracted on Ethereum reached nearly $24 million [18]. In addition, sandwich attacks targeting private transaction pools occur frequently and cause significant user losses [19].
Under the information-competition mode, the market's definition of fairness changed. The threshold of competition shifted from hardware-capital investment to algorithmic and technical capability. MEV searchers' profit comes from their ability to process public information faster and more intelligently than ordinary users. Although technically anyone can run a searcher node and compete, in practice this capability is likewise highly concentrated among a handful of institutions with top-tier algorithm teams.
Everyone can see, but only the fastest and smartest can exploit—this is precisely the economic embodiment of the transparency paradox. While enjoying self-custody of assets and on-chain verifiability, ordinary users are forced to pay an implicit transparency tax. The MEV figures above (over $500,000 per day on Ethereum) reflect total MEV extraction across the entire Ethereum ecosystem, spanning spot DEX swaps, lending liquidations, and many other scenarios. The effective transparency tax that perpetual futures traders actually bear must be assessed independently and varies significantly across different Layer-2 environments.
6.2.3 Mechanism competition in application-chain DEXs
To solve the performance bottleneck and severe MEV problems of general-purpose public chains, the application-chain architecture emerged. Application-chain DEXs typified by Hyperliquid deeply integrate order-book maintenance, the matching engine, and the consensus mechanism by building an independent blockchain purpose-optimized for trading. More importantly, they typically adopt a private-mempool design, so that a user's trading intent is not exposed on the public network before it is formally packed into a block.
This architectural change effectively suppresses traditional atomic MEV (such as front-running and sandwich attacks), because searchers lose the ability to observe pending transactions in advance. Competition, however, does not disappear; it evolves toward a deeper and more covert level. Notably, although the mempool is private, an application chain's API exposes real-time order-book state at low latency, so sophisticated traders who colocate servers near validators can conduct statistical MEV—informed trading based on observable order-flow patterns. This to some extent reintroduces, at the application-chain level, a shadow of latency competition. On this basis, a deeper mechanism competition emerges. In this mode, the focus of competition is no longer hardware latency, nor is it simply scanning the mempool, but rather a deep understanding and strategic exploitation of the protocol's own economic mechanisms. This is precisely the concretization, at the market-structure level, of the mechanism parasitism phenomenon defined in Chapter 4.
In mechanism competition, attackers or advanced traders no longer seek to extract tiny value at the millisecond scale or within a single block; instead, they turn to complex, cross-cycle, cross-market games. This section formally defines this as strategic MEV. Unlike atomic MEV, which relies on reordering transactions, the core features of strategic MEV are its non-atomicity, its cross-cycle nature, and its compound exploitation of the protocol's inherent economic vulnerabilities (such as liquidation thresholds, insurance-fund design, and leverage limits).
A series of events on Hyperliquid in March 2025 provides a textbook empirical case of this new mode of competition. On March 12, a whale trader known as 0xf3F built a long position of more than $300 million in ETH with 50x leverage on Hyperliquid. When the position generated a large unrealized profit, the trader did not choose to close it on the open market but instead began strategically withdrawing margin from the account. This maneuver artificially raised the position's liquidation price until it finally triggered the protocol's forced liquidation [20].
The logic behind this strategic self-liquidation is a precise economic calculation. Fifty-times leverage corresponds to a 2% initial-margin ratio, meaning a $300 million notional position requires only about $6 million of initial margin. The trader realized that closing such a huge position directly on the order book would incur enormous slippage losses; estimated from the position's size and the order-book depth at the time, the market-impact cost of a normal close was far higher than the liquidation penalty the protocol specified. In this way, the trader successfully locked in more than $1.86 million in profit while transferring the enormous market-impact cost of closing the position onto the protocol's liquidity providers. In Hyperliquid's liquidation cascade, a liquidated position is first taken on by backstop liquidators attempting to close it on the open market; if that fails within the time window, the position is transferred to the Hyperliquidity Provider (HLP) vault as the taker of last resort. In this incident, because the position was too large, the intermediate liquidation mechanisms failed to absorb it effectively, and the HLP vault was forced to take on the entire remaining position as the de facto central counterparty, ultimately bearing roughly $4 million in slippage losses [20].
Just two weeks later, on March 26, Hyperliquid suffered the mechanically more complex JELLY attack—three coordinated attackers used mutually hedged, huge long and short positions to induce forced liquidation, forcing the HLP vault to take on a low-liquidity position and ultimately eliciting the team's highly controversial centralized delisting and forced-liquidation intervention (the case is detailed in Section 6.3.2) [20].
These events profoundly reveal the essence of mechanism competition: the weapon of competition has shifted from engineering (code and hardware) to economics and game theory. Every on-chain operation by the attacker complies with the protocol's rules, and the profit comes from understanding the economic implications of those rules far more deeply than the protocol's designers do. This is a paradigm shift from who is faster to who thinks more deeply. In the application-chain era, the definition of fairness evolves further: the cognitive threshold becomes the new barrier to entry, and protocol liquidity providers and ordinary users who do not understand the deeper implications of the mechanisms become the ultimate bearers of this mechanism tax.
6.2.4 A unified comparison of the competition modes
To understand more clearly the essential differences among these three competition modes, we can construct a systematic comparison matrix. As described in Section 6.1.4 (and in Chapter 5), the three paradigms each select a different trade-off within the impossible triangle. The table below systematically compares the three competition modes along six dimensions: the focus of competition, core weapons, principal participants, the battleground, the definition of fairness, and the manifestation of unfairness.
| Dimension | CEX latency competition | General-purpose public-chain DEX information competition | Application-chain DEX mechanism competition |
|---|---|---|---|
| Focus of competition | Hardware latency (microsecond matching speed) | Information exploitation (trading intent in the public mempool) | Mechanism understanding (strategic exploitation of the protocol's economic rules) |
| Core weapons | Colocation, custom FPGA hardware, microwave communication networks | MEV search algorithms, block-building optimization, gas-bidding strategies | Cross-cycle position building, exploitation of the liquidation mechanism, cross-market manipulation |
| Principal participants | High-frequency market makers (Wintermute, Jump Trading, etc.) | MEV searchers, block builders | Strategic traders, protocol-mechanism researchers |
| Battleground | Physical distance inside the exchange's data center | The public mempool and block-space auctions | The protocol's liquidation engine, insurance fund, and oracle mechanism |
| Definition of fairness | Capital threshold: who can invest more hardware capital | Technical threshold: who has superior algorithmic capability | Cognitive threshold: who understands protocol economics more deeply |
| Manifestation of unfairness | Hardware-capital barriers plus the exchange's informational privilege | Systematic value extraction from ordinary users by MEV searchers | Validators' implicit ordering power plus the transfer of losses to protocol LPs by strategic MEV |
Table 6-2. A unified comparison matrix of the three competition modes (Data source: compiled by the author)
As Table 6-2 shows, the focus of competition—from physical latency in the CEX, to information exploitation in the general-purpose public-chain DEX, to mechanism understanding in the application-chain DEX—displays a progressive abstraction from hardware engineering to algorithmic technology and then to economic cognition. Corresponding to this is a migration in the definition of fairness: unfairness in the CEX is determined mainly by hardware-capital investment, in the general-purpose public-chain DEX by algorithmic capability, and in the application-chain DEX by the depth of one's understanding of protocol economics. The migration of the competition mode not only changes the rules of the game but also profoundly reshapes the role and situation of each class of market participant. A role that occupies a central position in the CEX paradigm may be marginalized in the on-chain paradigm, and vice versa. From the perspective of six core participants—retail traders, institutional market makers, high-frequency traders, MEV searchers, validators/nodes, and protocol governors—Table 6-3 analyzes the changing opportunities, challenges, and game positions each role faces across the three paradigms.
| Participant role | CEX paradigm (latency competition) | General-purpose public-chain DEX paradigm (information competition) | Application-chain DEX paradigm (mechanism competition) |
|---|---|---|---|
| Retail traders | Enjoy the best experience and lowest latency but bear very high custodial risk and the information-asymmetry risk of the black box, passively accepting market makers' spreads. | Gain self-custody of assets and global transparency but must bear the cost of MEV extraction (the transparency tax), gas-fee volatility, and smart-contract risk. | Gain a near-CEX experience and the advantage of self-custody but face cross-chain-bridge risk. MEV extraction is partly mitigated by protocol design, but they may bear an implicit mechanism tax. |
| Institutional market makers | Hold a central position, earning spreads by providing liquidity. Must invest heavily in low-latency infrastructure to counter adverse selection and enjoy fee subsidies. | Role is weakened (replaced by algorithms under the AMM model). Under the order-book model, they face intense competition from MEV searchers and must adapt to high on-chain latency. | Role revives. They return to the center under a high-performance order book, may gain an informational advantage by running validator nodes, and face competition from protocol-native market-making mechanisms. |
| High-frequency traders | A traditional area of advantage; they gain a millisecond edge through hardware and network investment and execute latency-arbitrage and statistical-arbitrage strategies. | Advantage is greatly diminished; on-chain second-level latency renders traditional HFT strategies ineffective, but some can transform into professional MEV searchers. | Becomes a new arena. Sub-second latency makes some strategies viable again, and running a validator node may become the colocation of the application-chain era. |
| MEV searchers | Do not exist; information asymmetry and ordering privilege are sealed inside the exchange's black box. | A core role; they continuously scan the public mempool and drive a complex multi-tier auction market. | Role is constrained; the private mempool limits traditional scanning strategies. But strategic MEV targeting protocol-mechanism vulnerabilities becomes a new, higher-order form of play. |
| Validators/nodes | Not applicable (centralized servers). | An indirect role; as consensus maintainers of the underlying chain, they capture most of the risk-free MEV revenue through mechanisms such as proposer-builder separation. | A core role, simultaneously bearing the triple duties of consensus confirmation, order matching, and transaction ordering. They hold the ultimate informational advantage but face the constraint of staking slashing. |
| Protocol governors | Not applicable; decision-making power rests entirely with corporate management. | Participate through the DAO and governance tokens, usually facing the dilemma of low retail participation and decision-making dominated by large holders. | On-chain governance is decisive. Validators and large token holders wield significant influence over core mechanisms such as liquidation parameters, determining the protocol's economic security. |
Table 6-3. The game matrix of six core participants across the three paradigms (Data source: constructed by the author)
Table 6-3 reveals a noteworthy pattern in the evolution of roles: institutional market makers hold a central position in the CEX, are weakened in the general-purpose public-chain DEX, and regain a central position in the application-chain DEX; MEV searchers, in turn, go from nonexistent in the CEX to a core role in the general-purpose public-chain DEX, and then to being structurally constrained in the application-chain DEX while pivoting to higher-order strategic MEV. Accompanying this, the transmission path of information asymmetry also evolves from the closed form of the CEX, through the transparent form of the general-purpose public-chain DEX, to the semi-transparent form of the application-chain DEX (see Figure 6-5).
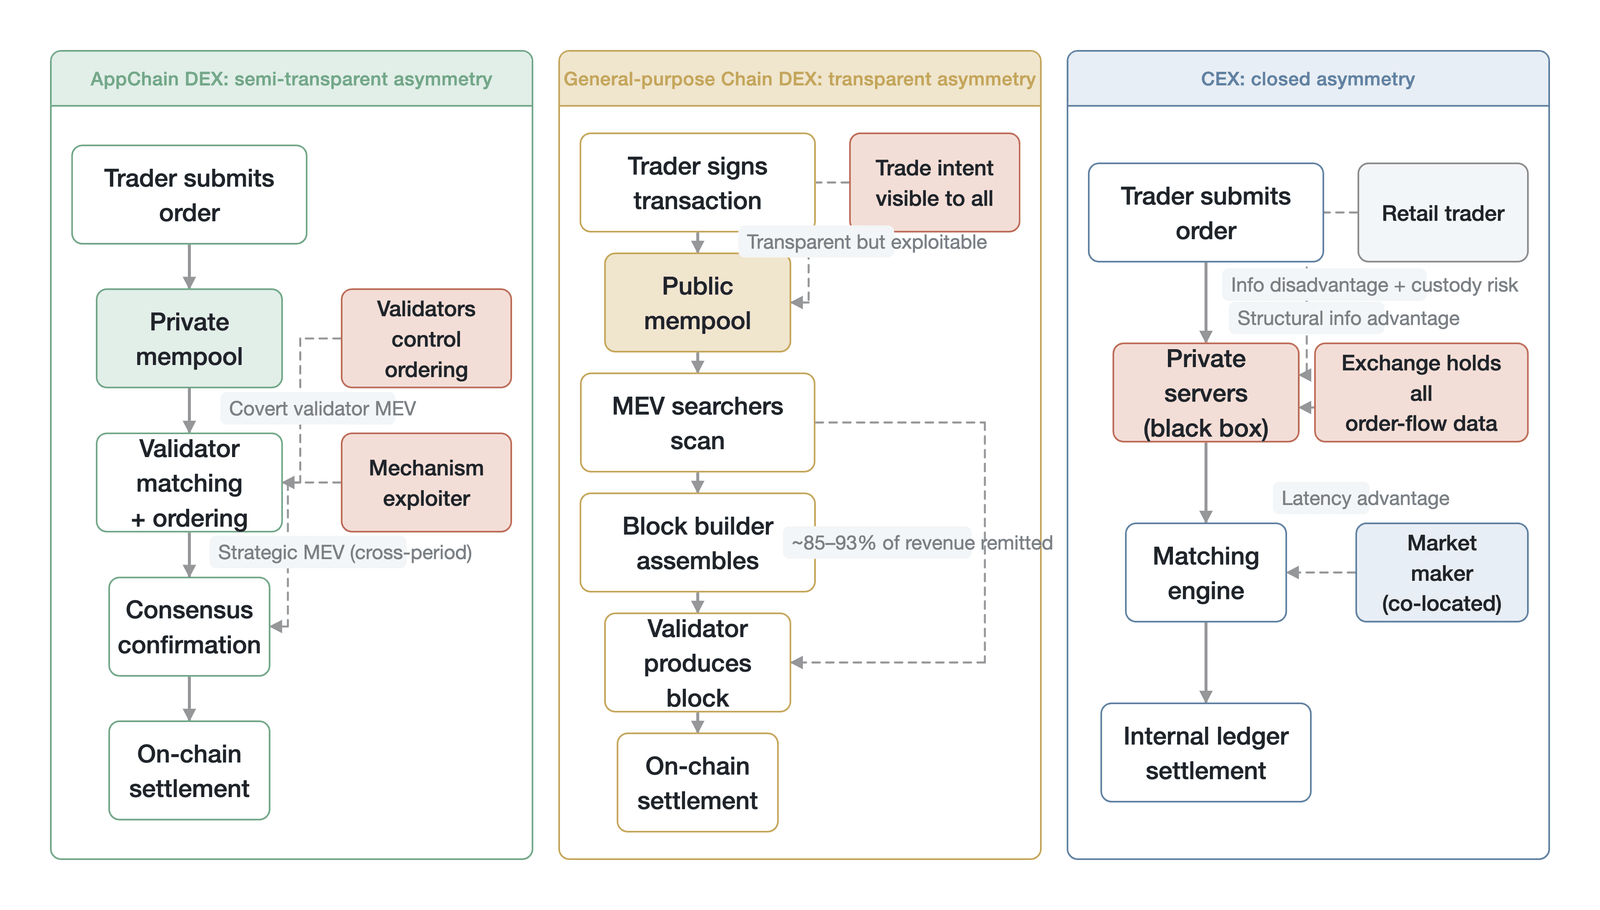
Figure 6-5. The transmission path of information asymmetry across the three paradigms (from the CEX black box to the general-purpose public chain's public mempool and then to the application chain's private mempool plus validator matching, the way an informational advantage is obtained changes fundamentally; a conceptual mechanism schematic, not empirical data; the roughly 85%–93% of revenue remitted follows ESMA [2]; drawn by the author, additionally based on Harris [6])
6.2.5 The drivers of competition-mode migration
Figure 6-6 decomposes the three migrations of the competition mode into three stages and labels the core driver of each: the diminishing returns of latency competition, the revaluation of transparency after the FTX collapse, and the application chain's recombination of performance and transparency within the impossible triangle.
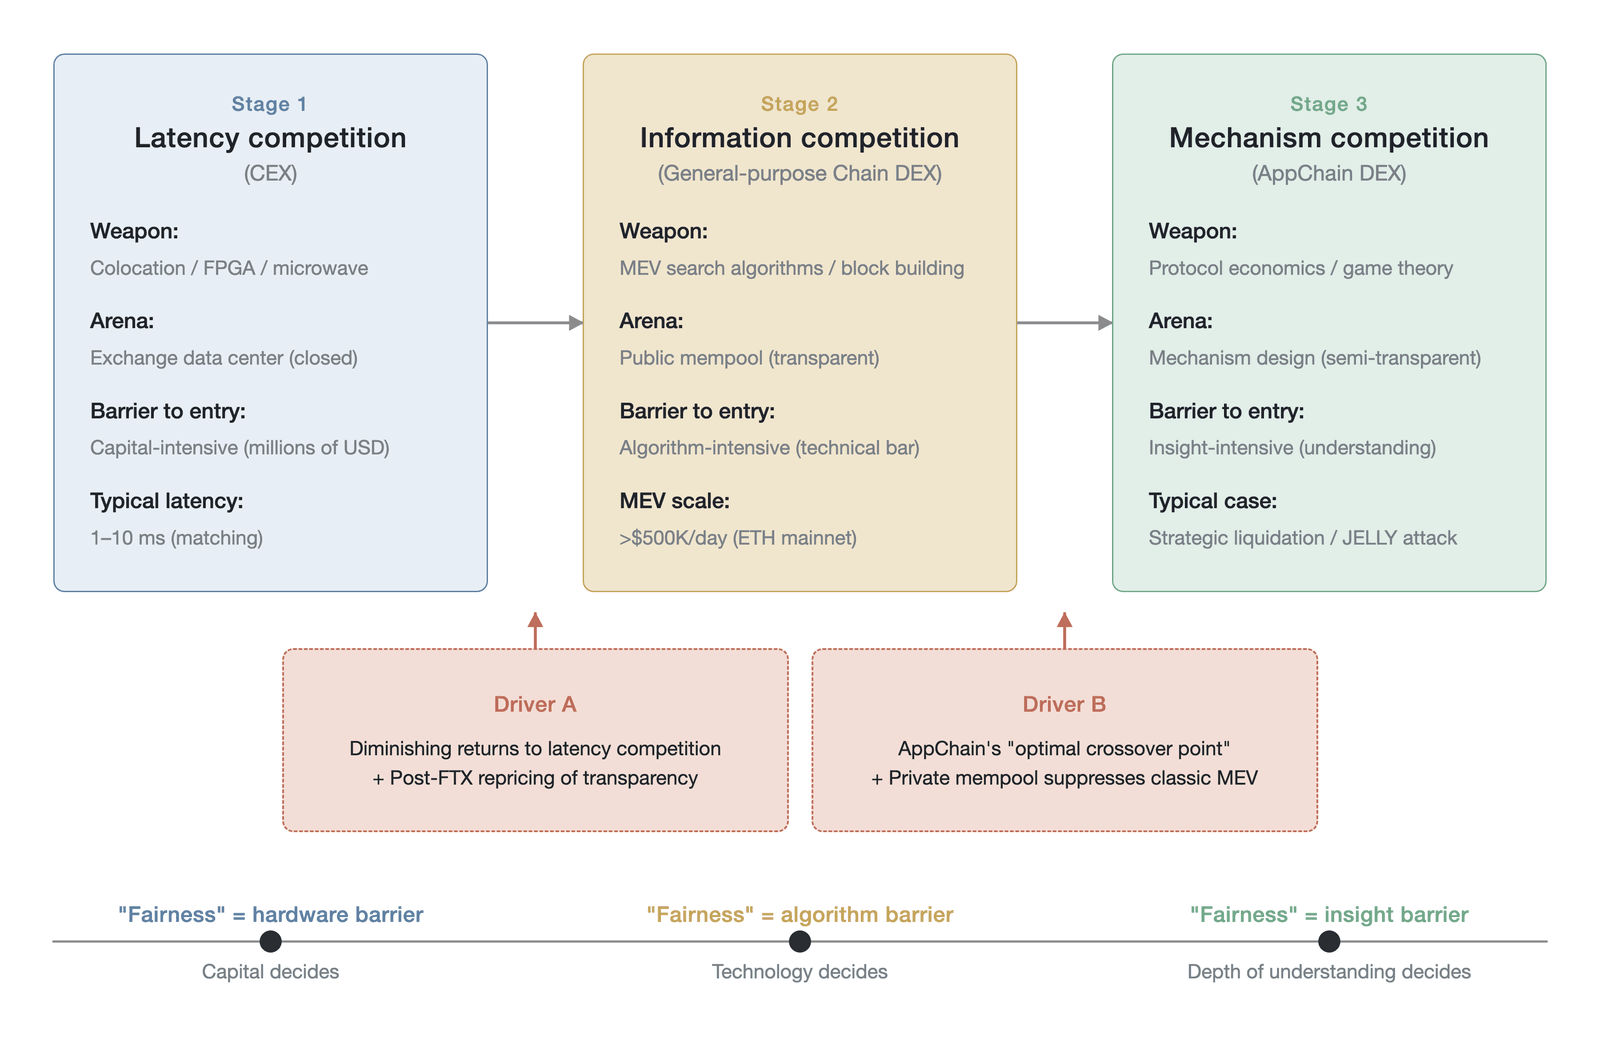
Figure 6-6. The three-stage migration of the competition mode (a mechanism-evolution schematic, not empirical data; the daily MEV figure of over $500,000 follows EigenPhi [18], on the late-2025-to-early-2026 basis; drawn by the author, based on Budish, Cramton, and Shim [13] and ESMA [2])
As Figure 6-6 shows, each migration corresponds to the economic return of the prior competition mode approaching zero: the diminishing marginal returns of latency competition in CEXs pushed capital toward on-chain information competition, while the high cost and poor user experience of MEV extraction on general-purpose public chains in turn drove the market toward the mechanism competition of application chains.
The starting point of the migration is the diminishing returns of latency competition. In CEXs, the arms race around microsecond latency has approached physical limits. To gain even a one-microsecond speed advantage, an institution must invest exponentially growing capital (for example, laying a straighter microwave link or developing more advanced FPGA chips), yet the excess profit such marginal investment can bring is rapidly approaching zero. This has become a zero-sum arms race in which participants keep investing merely to maintain their existing competitive position rather than to create new economic value [13]. When traditional hardware competition ceases to be economically attractive, capital and technical talent naturally turn to areas of competition with higher returns.
Even as the returns to latency competition diminished, the 2022 collapse of FTX triggered a fundamental reappraisal of transparency. After this event, market participants' valuation of verifiability rose sharply. Institutional investors and advanced retail traders came to realize that the high efficiency of CEXs was built on one-sided trust and an extremely high single-point-of-failure risk. They became increasingly willing to pay a certain efficiency cost for the ability to independently verify asset safety and trade execution. This fundamental shift in risk preference became a powerful underlying driver pushing capital and volume to migrate from CEXs to on-chain models. Behavioral finance, however, offers a competing explanation: availability bias and narrative contagion may lead participants to systematically overestimate the probability of similar events after a salient catastrophe, causing an excessive flight from all custodial structures. Lo's (2004) adaptive markets hypothesis [21] predicts that such behavioral overreaction may partially reverse as the FTX event fades from collective memory. This means that in assessing the migration trend, one must distinguish its structural component (a genuine rise in demand for verifiability) from its behavioral amplification component (a panic-driven narrative shift), the durability of the latter being uncertain.
Nevertheless, although general-purpose public-chain DEXs offer transparency, their high gas fees, second-level confirmation latency, and large-scale MEV extraction make them ill-suited to carry high-frequency perpetual futures trading. It is against this backdrop that application chains try to find a more commercially viable optimal intersection within the impossible triangle. Through a customized consensus mechanism and in-memory matching, application chains achieve sub-second latency, meeting the performance needs of the vast majority (roughly 95%) of trading strategies; through a private mempool, they structurally suppress the worst atomic MEV; and at the same time they still preserve the baseline of self-custody of assets and on-chain verifiability of core logic. This performance plus transparency combination explains why an application chain like Hyperliquid could grow rapidly in 2025 and at one point capture roughly 60% of the on-chain perpetual futures market.
In sum, the migration of the competition mode from latency to information and then to mechanism is an evolutionary process driven jointly by technical bottlenecks, risk events, and economic incentives. In the sections that follow, we examine the highest expression of this mechanism competition—strategic MEV—and analyze how the dominance of price discovery shifts over the course of this evolution.
6.3 Strategic MEV
MEV has been a core issue throughout the development of decentralized finance. Early MEV mainly took the form of technical arbitrage, such as sandwich attacks based on transaction ordering or simple cross-DEX arbitrage. As complex financial derivatives such as perpetual futures have become widespread on-chain, however, the form of MEV is undergoing a profound evolution. This section elevates strategic MEV from an observation in the competition-mode discussion of Section 6.2 to a formally defined conceptual category; it systematically argues how strategic MEV differs in nature from traditional atomic MEV, analyzes its three typical forms in the perpetual futures setting, and explores paths for defending against it at the mechanism-design level and for institutionalizing MEV. This concept is the concretization, at the market-structure level, of the mechanism parasitism theory of Chapter 4.
6.3.1 Atomic MEV and strategic MEV
To understand the essence of strategic MEV, one must be clear about how it differs from traditional atomic MEV. This difference lies not only in the mode of execution but, more deeply, in the economic logic and risk characteristics behind it. The difference between the two is a leap in kind, not a gradual change in degree.
Traditional atomic MEV relies mainly on a structural feature of blockchains' decentralized architecture: the absence of a unified, tamper-proof transaction timestamp. "Decentralization means there is no pipeline that creates a single queue, nor any natural time-based ordering of transactions as in traditional finance" [2]. On smart-contract platforms such as Ethereum, miners or validators (and, with the introduction of MEV-Boost, block builders) hold the privilege of deciding the order of transactions within a block. Searchers monitor the public mempool, identify profitable trading intent, and compete for block space by submitting transaction bundles that include a higher priority fee. The core feature of this MEV is its atomicity: the entire operation (such as the front transaction, the target transaction, and the back transaction) is executed within a single atomic transaction in the same block. If any link fails, the entire transaction is rolled back, and the extractor bears no execution risk, paying only a small gas fee [2][22].
By contrast, strategic MEV is no longer confined to micro-level transaction ordering within a single block; it extends to the macro level of economic gamesmanship. Extractors of strategic MEV exploit not only information in the mempool but also, more deeply, the structural design features of DeFi protocols (especially perpetual futures protocols) in their margin models, liquidation engines, or oracle mechanisms. This MEV is often a continuous operation spanning multiple blocks or even several days, requiring the extractor to commit substantial capital and bear real market-execution risk [23]. This book gives the following formal definition of strategic MEV:
Strategic MEV: Unlike atomic MEV, which relies on reordering transactions within a single block, the core features of strategic MEV are its non-atomic, cross-cycle, cross-domain, compound attacks. It involves an attacker, over a longer time horizon, exploiting a protocol's inherent economic mechanisms (leverage, liquidation thresholds, insurance-fund design) and market structure (order-book transparency, cross-market liquidity imbalances) to construct, through a series of seemingly independent operations, a final high-value profit or loss-avoidance scenario. The goal of strategic MEV is typically not to extract value from a single transaction but to actively plan and trigger a larger market event, or to externalize a personally incurred loss onto the entire protocol system.
The two differ in nature across several key dimensions. In terms of the information source and profit basis, the profit of atomic MEV comes from the pending transactions of other users in the public mempool; in essence, it exploits users' slippage tolerance. The profit of strategic MEV, however, comes from the protocol's systemic design—especially the insurance fund or the liquidity providers' capital pool—as the extractor, by actively planning a market event (such as manipulating the price of a low-liquidity asset), forces the protocol to execute operations under rules unfavorable to it, thereby achieving a value transfer. In the conceptual framework of Chapter 4, atomic MEV corresponds to the behavioral pattern of the economic bot, whereas strategic MEV is the market-structure version of mechanism parasitism: the attacker does not violate the rules but understands the economic implications of the rules more deeply than their designers do.
This difference extends further to the dimensions of risk characteristics and capital requirements. Atomic MEV is risk-free arbitrage; the extractor uses the atomicity of smart contracts to guarantee an all-or-nothing execution result. Strategic MEV, by contrast, is a risky investment with directional exposure; the extractor must build a real position, faces the market risk of price movements, and often needs to deploy millions or even hundreds of millions of dollars to drive the market price or exhaust the protocol's liquidity. Correspondingly, the party that bears the loss changes fundamentally: the victim of atomic MEV is usually a single attacked trader, whose loss is local and quantifiable; the loss caused by strategic MEV is often socialized, with the protocol's insurance-fund loss ultimately borne by all liquidity providers and possibly even spreading, through the auto-deleveraging mechanism, to all profitable traders. This socialization of losses makes strategic MEV far more destructive to the protocol ecosystem than atomic MEV.
A direct consequence of these differences is that the suite of technical defensive tools already developed against atomic MEV—such as private transaction pools (Flashbots Protect), the proposer-builder-separation (PBS) mechanism, and order-flow auctions—is nearly useless against strategic MEV [2]. These mechanisms protect ordinary users by hiding trading intent or redistributing MEV profit, but strategic MEV exploits the protocol's economic rules themselves rather than information asymmetry or transaction ordering. Defending against strategic MEV must return to the starting point of mechanism design—achieved by refining margin requirements, optimizing liquidation logic, and strengthening system resilience.
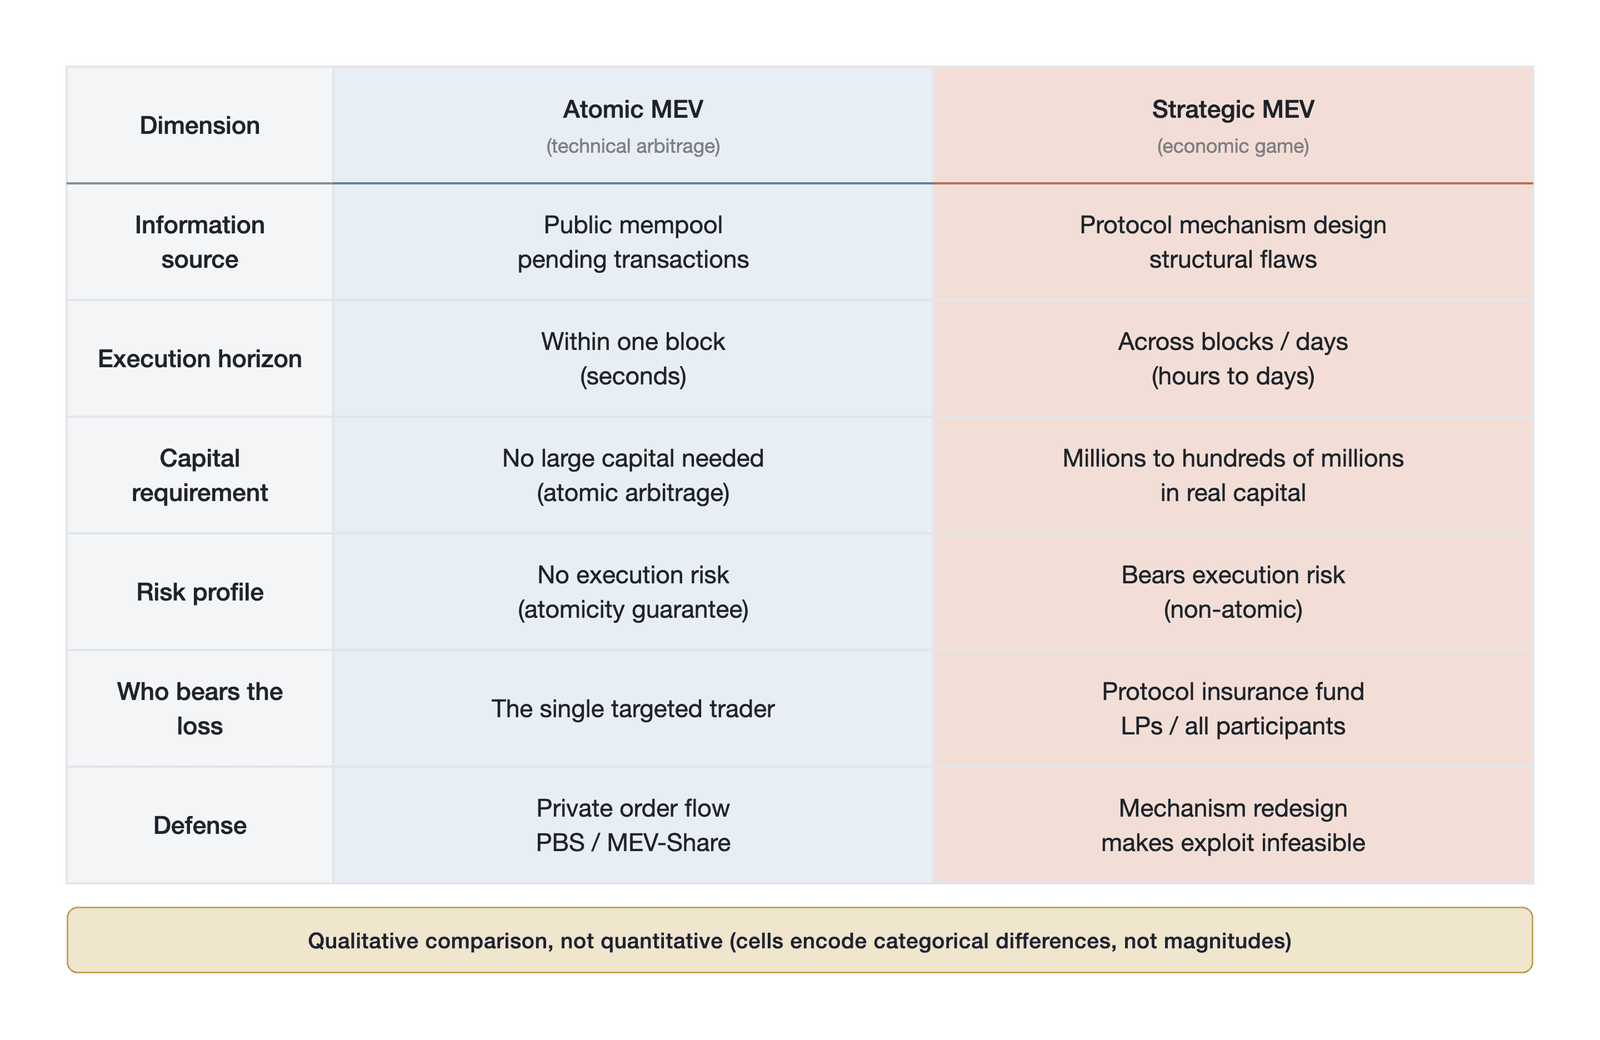
Figure 6-7. A multidimensional comparison of atomic MEV and strategic MEV (a conceptual comparison matrix along qualitative dimensions, with no empirical data; Data source: ESMA [2]; Daian et al. [22]; Gramlich et al. [23])
As Figure 6-7 shows, the two types of MEV display a leap in kind across six dimensions—information source, execution cycle, capital requirement, risk characteristics, the party bearing the loss, and defensive means (the six-dimensional comparison is detailed in the figure). Between the two, multi-block MEV is drawing researchers' attention as an intermediate form: block builders may coordinate strategies across consecutive blocks, and under the PBS framework, where the top two or three builders produce over 90% of Ethereum's blocks, this concentration may give rise to new strategic vectors unforeseen by traditional PBS design. In short, this leap from risk-free technical arbitrage to risky economic gamesmanship means that existing technical-layer defensive tools are nearly useless against strategic MEV, and the focus of defense must shift to the protocol's mechanism-design layer.
6.3.2 Typical forms
Because of their high-leverage nature and complex liquidation mechanisms, perpetual futures markets have become a high-risk domain for strategic MEV. The presence of leverage multiplies the precision and destructive power of an attack: under 50x leverage, the initial-margin ratio is only 2%, meaning an adverse price move on the order of 2% is enough to bring a position close to liquidation, which creates an extremely low cost threshold for a carefully planned attack. Several leading on-chain perpetual futures platforms have recently suffered such attacks, exposing deep vulnerabilities in protocol design. In the perpetual futures setting, strategic MEV mainly takes three typical forms. The three forms below each exploit, in different ways, a compound of the economic vulnerabilities described earlier (liquidation thresholds, insurance-fund design, and leverage limits); the relationship is many-to-many rather than one-to-one.
In strategic self-liquidation, the attacker exploits the passive-takeover mechanism of the protocol's liquidation engine, transferring the market-impact cost of closing its own huge position onto the protocol's insurance fund or liquidity providers. Its economic logic can be stated succinctly: when the slippage cost of a normal close exceeds the penalty incurred from being liquidated, a rational attacker will choose to be liquidated rather than close the position itself, thereby externalizing the difference onto the protocol system.
In March 2025, the JELLY token attack suffered by the decentralized derivatives exchange Hyperliquid was a textbook case of this technique. In this incident, the attacker used three coordinated accounts to carry out a complex market manipulation. One account (0xde9) built a short position of roughly $4.1 million in the JELLY token on Hyperliquid, while two other accounts (0x20e and 0x67f) built a total of roughly $4.05 million in long positions [20]. Through this hedged operation, the attacker controlled both the long and short sides while keeping a market-neutral exposure. Subsequently, as the price of the JELLY token swung violently (partly triggered by the attacker's own spot operations), the margin ratio of the short position fell rapidly, triggering forced liquidation.
Because of the design of Hyperliquid's liquidation mechanism, when a user's position is liquidated, the protocol's HLP vault is forced to take on these huge positions as the central counterparty. JELLY, however, is a low-liquidity meme coin, and its market depth simply could not absorb such a huge closing order. When the HLP vault tried to close these short positions on the market, it produced extremely severe slippage; the peak unrealized loss during the incident once exceeded $10 million, and the widely reported vault loss was roughly $13.5 million (a peak-unrealized-loss figure, not a realized loss; the HLP vault recorded a small profit of about $700,000 after the incident was finally settled) [37]. Facing potential insolvency, the HLP vault simultaneously encountered panic withdrawals by LP participants, a chain of behavior that exhibited classic bank-run dynamics, further intensifying the liquidity crisis and very likely constituting the direct trigger for the team's forced resort to centralized intervention. The Hyperliquid team ultimately took the highly controversial step of centralized intervention, forcibly closing the position at $0.0095 and delisting the token, containing the loss within a certain range; but the incident starkly exposed the systemic risk of the liquidation engine acting as a passive taker [24]. "The same group of people build and control the protocol, operate the HLP pool, issue the HYPE token, and run the validator nodes; for the sake of the network, they decided to delist JELLY and make everyone whole except the attacker"—this incident reveals the structural contradiction that a decentralized exchange, in extreme circumstances, must resort to centralized intervention [24].
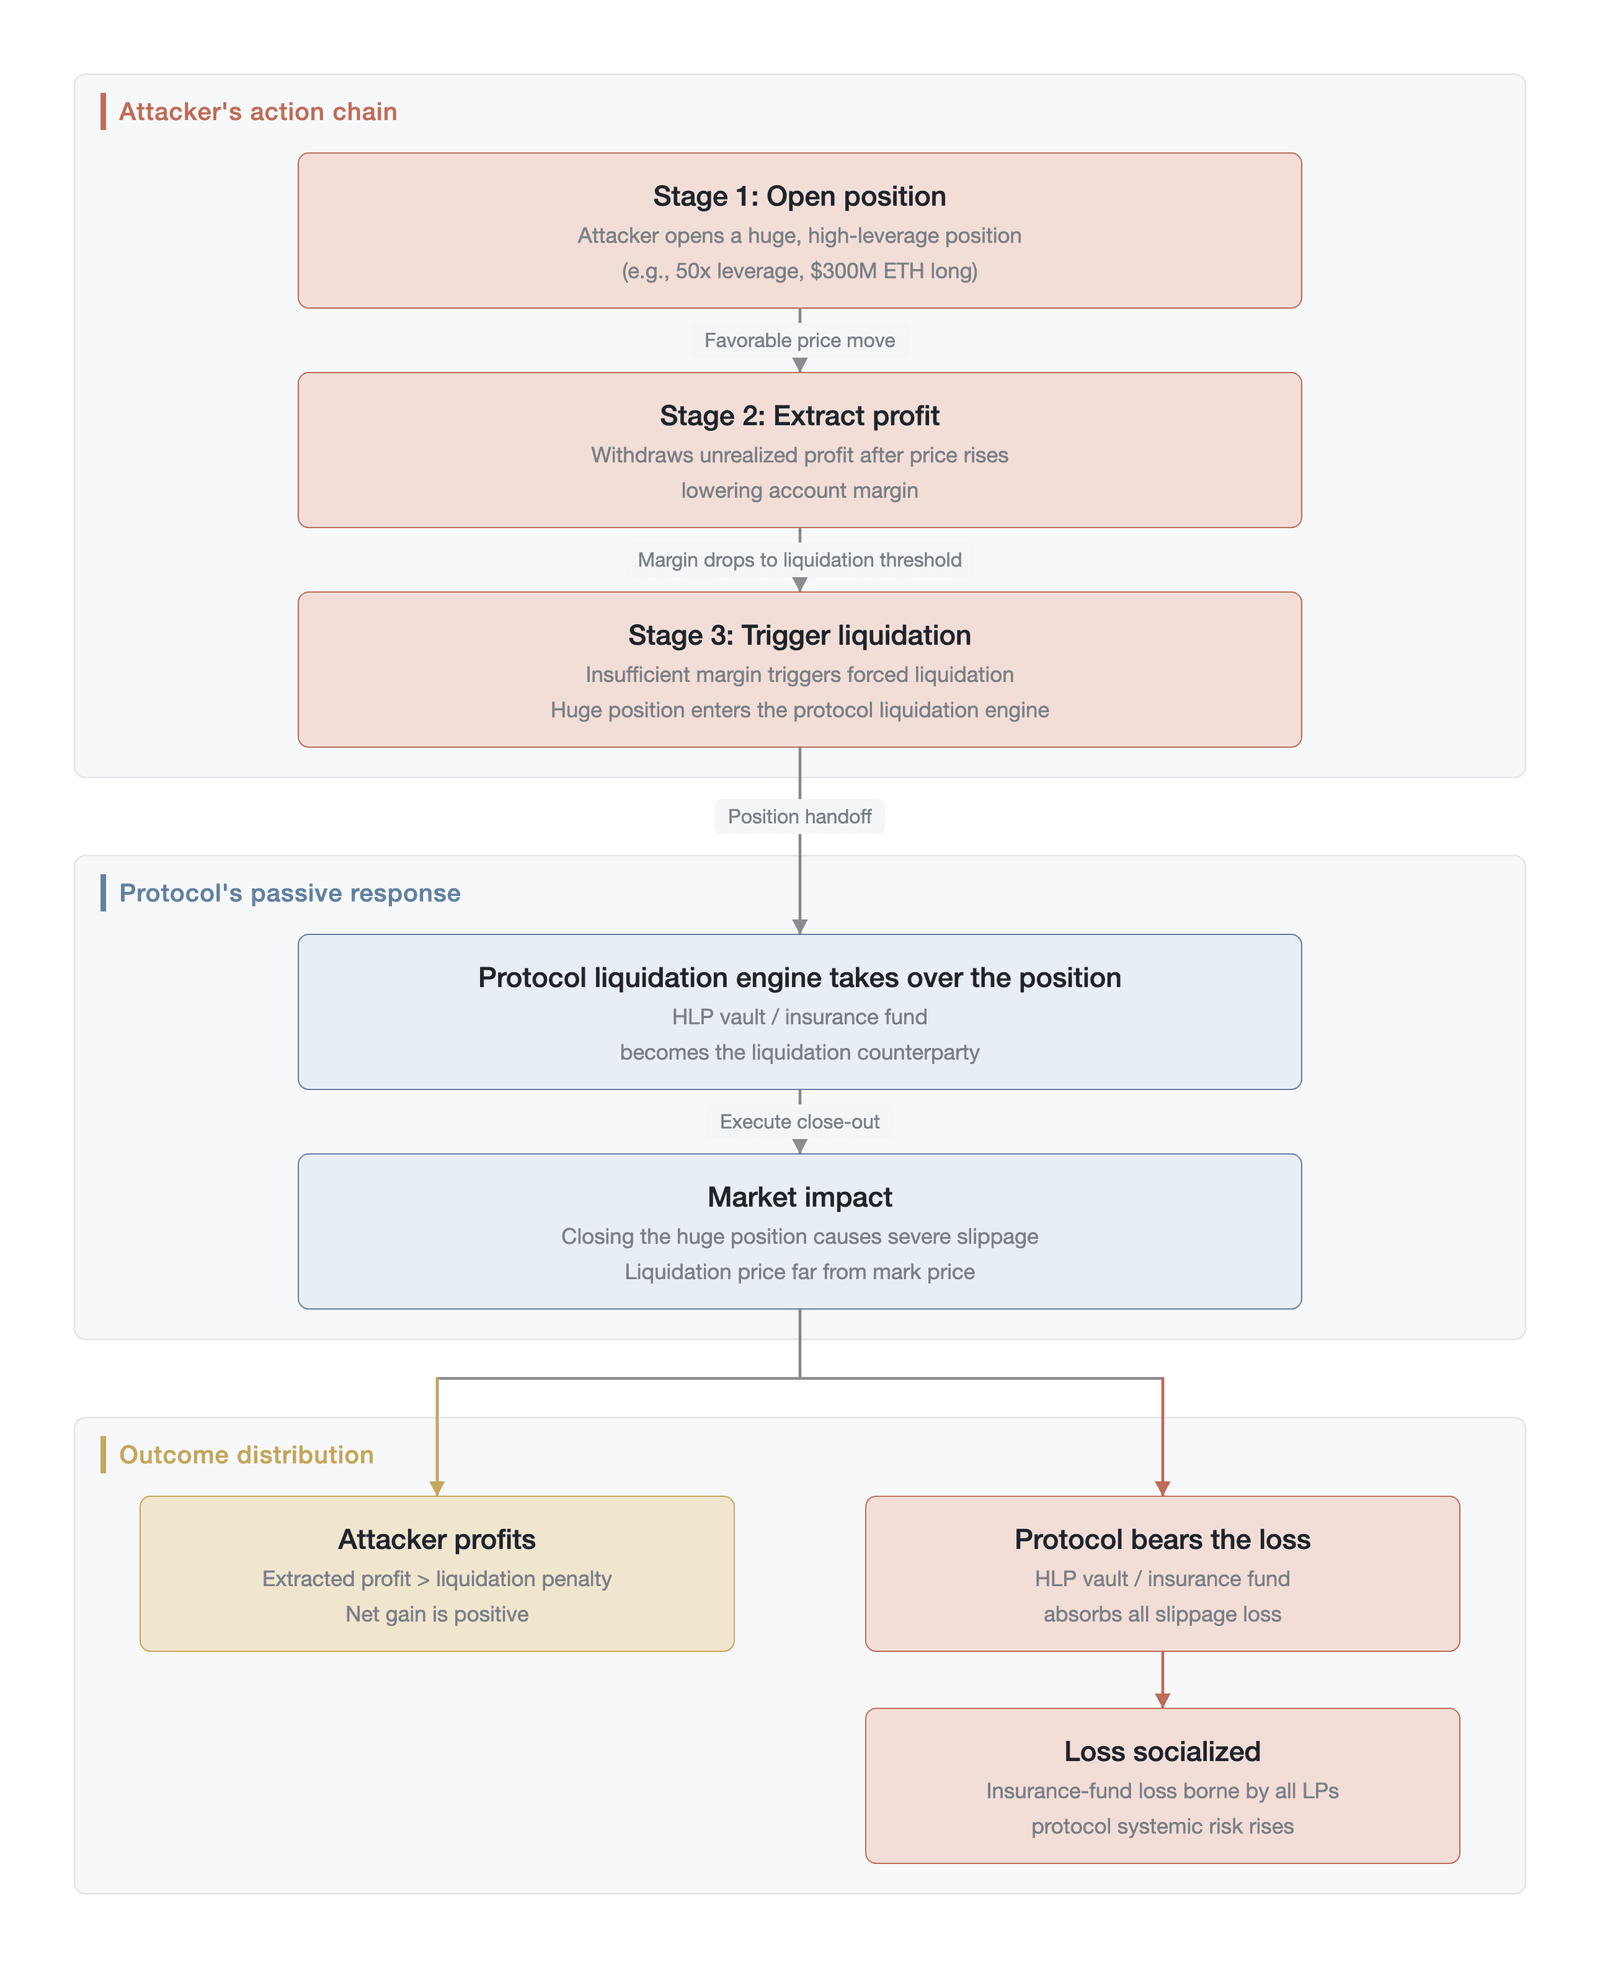
Figure 6-8. The self-liquidation attack flow and value-transfer mechanism in strategic MEV (a mechanism-process schematic, not empirical data; the illustrative $300 million ETH position at 50x leverage refers to the March 2025 whale self-liquidation incident [20]; drawn by the author, based on Arkham Intelligence [20] and Talos [24])
As Figure 6-8 shows, the core logic of the self-liquidation attack is this: the attacker withdraws unrealized profit when the price moves favorably, deliberately renders the account under-margined, and forces the protocol's insurance fund to take on the position under extremely unfavorable conditions, thereby socializing private risk.
The second form of strategic MEV is cross-market liquidation manipulation, which can be seen as an upgraded version of the self-liquidation attack, with the attacker extending the scope of operations from a single platform to multiple markets. The core strategy is this: build a huge position on a perpetual futures platform, then manipulate the underlying asset's price on the spot market (usually a low-liquidity DEX), thereby influencing the oracle price feed on which the perpetual futures platform depends, and finally triggering the liquidation of one's own or others' positions for profit.
The economic essence of this attack is cross-market arbitrage: as long as the cost of manipulating the spot market is lower than the profit obtained from perpetual futures liquidation, the attack is profitable. Because a perpetual futures protocol's oracle typically relies on price data from on-chain DEXs, whose liquidity is often far lower than that of centralized exchanges, the manipulation cost can be kept relatively low. A case in point is the market-manipulation attack Hyperliquid suffered on the POPCAT and HYPE tokens in November 2025: the attacker used only about 3 million USDC to build a buy wall on the spot market, which triggered a chain of liquidations on the perpetual futures market and cost the protocol vault nearly $4.9 million [25]. This kind of cross-market attack means the risk-control measures of a single platform cannot cover the entire attack surface, highlighting the severity of cross-protocol risk transmission in on-chain financial systems.
Compared with the first two forms, insurance-fund arbitrage is the most covert variant of strategic MEV. The attacker carefully constructs a fully hedged portfolio of positions and exploits logical flaws in the protocol's liquidation mechanism to trigger pseudo-liquidations that defraud the protocol of liquidation rewards, thereby systematically extracting value from the insurance fund. Unlike the first two forms, insurance-fund arbitrage often does not trigger violent market swings; instead, it siphons off protocol funds continuously and gradually. Reportedly, the same November 2025 manipulation of the POPCAT and HYPE tokens on Hyperliquid also exhibited the characteristics of insurance-fund arbitrage: through the interplay of hedged positions and the liquidation mechanism, the attacker caused the protocol a loss of roughly $4.9 million [25] (this is a different facet of the same incident described above under cross-market liquidation manipulation, not a second, independent loss), and the protocol became aware of the anomaly only after the incident had persisted for some time.
The three forms above share a profound common feature: every on-chain operation by the attacker complies with the protocol's rules, and the profit comes from the depth of understanding of the rules' economic implications rather than from violating them. On-chain protocol compliance, however, must be clearly distinguished from legality under the law: the CFTC's anti-manipulation framework (Commodity Exchange Act §9(a)(2)) and Article 91 of the EU's Markets in Crypto-Assets (MiCA) Regulation may both apply to coordinated cross-market manipulation strategies, regardless of whether the on-chain transactions are technically valid—a legal dimension explored in Chapter 26. This means that defending against strategic MEV cannot rely on punishing the actor but only on fixing the mechanism vulnerabilities that make the behavior profitable. This marks the transformation of MEV from passive opportunity discovery to active strategy construction, a qualitative change from technical arbitrage to economic gamesmanship.
6.3.3 Defending against strategic MEV
In the face of increasingly frequent strategic MEV, traditional defenses based on technology and cryptography (such as encrypted mempools and batch auctions) prove inadequate, because strategic MEV does not exploit information asymmetry or network latency but the public, transparent economic rules themselves. Defending against strategic MEV must therefore begin with the protocol's mechanism design rather than a mere speed race. The table below systematically compares the defensive means and their effectiveness against the two types of MEV at four levels: the transaction layer, the ordering layer, the profit layer, and the mechanism layer.
| Defense level | Defense against atomic MEV | Defense against strategic MEV |
|---|---|---|
| Transaction layer | Private transaction pools (hide trading intent) | Ineffective (strategic MEV does not depend on single-transaction information) |
| Ordering layer | PBS (separating builders and proposers) | Partly effective (reduces validator MEV but does not affect cross-cycle strategies) |
| Profit layer | MEV-Share (returns part of the profit to users) | Ineffective (strategic MEV profit comes from protocol mechanisms, not transaction ordering) |
| Mechanism layer | Not applicable | The core line of defense: redesigning the liquidation, insurance-fund, and margin mechanisms |
Table 6-4. A comparison of the effectiveness of defenses against the two types of MEV at different levels (Data source: compiled by the author)
As Table 6-4 shows, the mature transaction-, ordering-, and profit-layer defensive tools for atomic MEV are either inapplicable or only partly effective against strategic MEV; only a redesign at the mechanism layer constitutes an effective line of defense, a judgment that directly determines the three core defensive directions below. The first defensive direction is to reshape the margin and dynamic-leverage model. To compete for market share, many perpetual futures platforms early on offered excessive high leverage and lowered initial-margin requirements, which gave strategic MEV ample leverage room. Introducing a dynamic, risk-based margin model (similar to the SPAN margin model of the Chicago Mercantile Exchange in traditional finance) is the core means of addressing this problem. But the SPAN analogy has clear limits for long-tail crypto assets: SPAN presupposes a well-behaved return distribution and deep liquidity for the underlying asset, whereas a meme coin like JELLY may experience volatility exceeding 1,000% within hours, fundamentally violating SPAN's statistical assumptions. Margin requirements must be dynamically linked to an asset's liquidity, historical volatility, and the concentration of a user's positions [24]. Hyperliquid's actual response after the JELLY incident (imposing open-interest caps and sharply reducing the maximum leverage on long-tail assets) took a more direct path than dynamic margining, reflecting that under extreme liquidity conditions, coarse-grained position-size limits may be more operationally feasible than a fine-grained dynamic-margin model. This direction receives a deeper, engineering-oriented discussion in the liquidation-mechanism design of Chapter 11.
Above the margin layer, the design of the liquidation engine itself also needs fundamental optimization. Protocols need to introduce tiered liquidation and auto-deleveraging mechanisms: when market liquidity is insufficient to absorb a huge liquidated position, the system should not forcibly dump it on the market and cause a shortfall, but should instead trigger auto-deleveraging (ADL), forcibly closing counterparty positions against the most profitable traders on the opposite side of the liquidated position [26]. Although this harms the experience of some profitable traders, it protects the protocol's overall solvency. Paired with this is risk isolation of the insurance fund: high-risk assets (such as long-tail tokens) should have a separate isolated-margin pool, so that their liquidation losses are borne only by the liquidity providers participating in that pool, preventing the collapse of a single asset from triggering a systemic spread. Chapter 12 provides a detailed analysis of this from the perspective of insurance-fund governance.
The third level of defense concerns oracle resilience. To defend against oracle manipulation, a protocol must adopt a composite oracle mechanism that is multi-source and time-weighted or median-weighted, reducing the impact of an anomalous swing in any single spot market. At the same time, a price circuit breaker should be introduced: when the on-chain oracle price deviates significantly from the prices of multiple centralized exchanges, or when volatility exceeds a threshold within a short time, the opening and liquidation functions for that trading pair are automatically suspended to await a return to normal. But the circuit breaker itself can also become an attack surface: an attacker can deliberately trigger the circuit breaker during a genuine market crash to freeze the protocol and block the execution of legitimate liquidations, essentially constituting a denial-of-service vector disguised as a safety mechanism. The engineering implementation of these measures is given in concrete form in the clearing and settlement architecture design of Chapter 29.
6.3.4 The path toward institutionalizing MEV
The existence of MEV is an endogenous property of blockchains' decentralized architecture and cannot be eradicated. Although MEV causes wealth transfer and unfair treatment for ordinary users, some forms of MEV (such as cross-market arbitrage and timely liquidations) objectively improve the pricing efficiency and market liquidity of DeFi protocols [2]. The long-term direction of the industry should therefore not be a futile attempt to eradicate MEV but the institutionalization and standardization of MEV, moving it from disordered extraction toward an orderly economic mechanism.
The institutionalization of atomic MEV has begun to show results. In the Ethereum ecosystem, through the proposer-builder-separation mechanism promoted by Flashbots, the process of MEV extraction has been modularized and made market-based. As the most widely adopted implementation of PBS, MEV-Boost currently covers roughly 85% to 95% of Ethereum's block production [2]. Under this system, searchers submit arbitrage bundles to block builders through sealed-bid auctions, and builders assemble them into complete blocks and pass them, via relays, to block proposers. Because of the fierce bidding competition among searchers, the vast majority of the profit MEV generates (roughly 85% to 93%) is ultimately forced to be paid to block proposers (that is, Ethereum's validator nodes) [2]. In addition, the MEV-Share protocol further returns part of the MEV profit to the original traders, while application chains' protocol-layer ordering rules (such as first-in-first-out, FIFO) reduce the room for certain forms of MEV to occur at the architectural level.
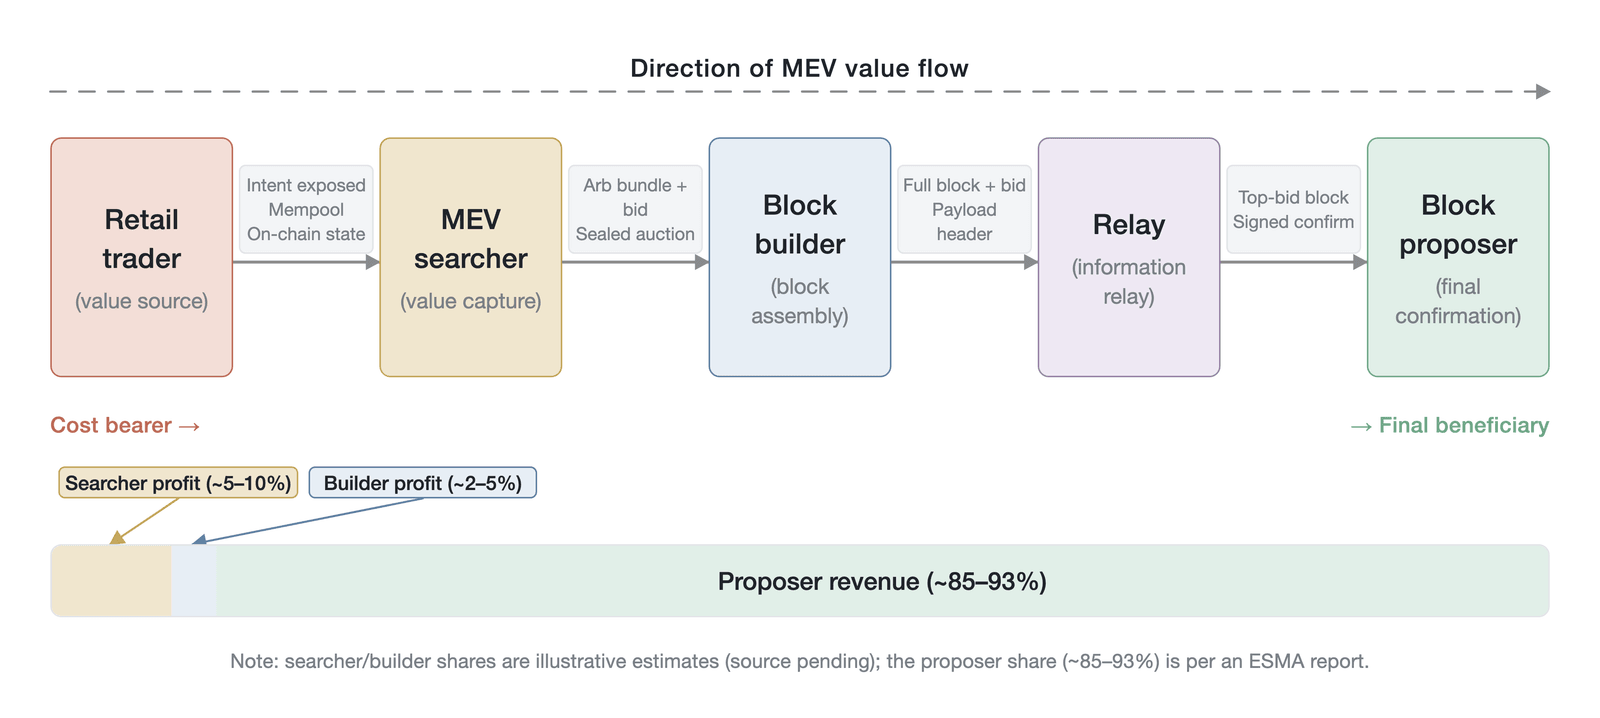
Figure 6-9. The value flow and profit-distribution architecture of the MEV supply chain (a value-distribution schematic, not empirical data; the 85%-to-93% figure for proposers follows ESMA [2], while the searcher and builder shares are the author's estimates; Data source: ESMA [2]; Flashbots Documentation)
As Figure 6-9 shows, value in the MEV supply chain flows out from ordinary traders, is captured by searchers and packaged by builders, and is finally passed, via relays, to block proposers, objectively subsidizing the security-consensus cost of the underlying blockchain. Yet even as the PBS mechanism reduces the risk of validator centralization, it also changes the incentive structure of the block-building market, driving it to evolve toward generating and capturing more MEV, which may increase total MEV and thus cause greater potential harm to ordinary users [27].
The institutionalization of strategic MEV is still in an early, exploratory stage. For application-layer protocols such as perpetual futures, institutionalizing MEV means internalizing, through mechanism design, the value that external extractors would otherwise seize for free, turning it into protocol revenue or user welfare. Concrete directions include: protocol-level position-size limits and a redesign of the liquidation mechanism (making strategic exploitation economically infeasible); governance-driven dynamic parameter adjustment and emergency-response mechanisms (as when Hyperliquid, after the JELLY incident, sharply tightened the leverage ceiling and position limits on long-tail assets); and cross-platform sharing of risk-control information (although this direction still faces enormous coordination challenges in a decentralized environment).
The structural resemblance between institutionalizing MEV and traditional financial regulation. The process of institutionalizing MEV bears a deep structural resemblance to the regulation of high-frequency trading in traditional finance. Both face the same core problem: how, when information competition cannot be eliminated, to make it fairer and more transparent through institutional design. The market-fairness issues MEV raises correspond directly, at the conceptual level, to front-running prohibitions in traditional finance, but the decentralized nature of blockchains makes traditional regulatory enforcement hard to apply directly [2]. Regulators are gradually stepping into this area, exploring how to map traditional finance's principles of best execution and market-manipulation prevention onto the DeFi environment. In its 2023 DeFi policy recommendations, the International Organization of Securities Commissions (IOSCO) already explicitly required responsible persons to identify, disclose, and, where feasible, manage and mitigate the impact of MEV strategies [2]. Yet in a sufficiently decentralized protocol, identifying the responsible person is itself an unresolved enforcement problem, and IOSCO itself acknowledged in its 2023 report that when a protocol is governed by a token-based DAO, its recommended framework may lack a clear enforcement target.
In the long run, the evolution of strategic MEV will force the maturation of on-chain financial infrastructure. Only when protocol design can find a balance between openness and security, and when the value distribution of MEV can reconcile efficiency and fairness, can decentralized derivatives markets truly build institutional-grade trust and achieve larger-scale growth.
The evolution of MEV's forms and the process of its institutionalization directly affect the market's informational efficiency and pricing quality. Large-scale extraction of atomic MEV raises the implicit cost of on-chain trading and lowers informed traders' willingness to express information on-chain, which may suppress the price-discovery function of on-chain markets. Conversely, the effective institutionalization of MEV (reducing searchers' rent-seeking room through mechanisms such as PBS and MEV-Share) helps improve on-chain execution quality and creates conditions for the migration of price discovery from CEXs to on-chain venues. This logic forms an important premise for the discussion of the price-discovery migration hypothesis in the next section.
6.4 The price-discovery migration hypothesis
Market structure determines not only the distribution of risk and the mode of competition; its more far-reaching influence lies in reshaping the pricing power over assets. In the perpetual futures ecosystem, price discovery—the process by which new information is incorporated into asset prices—is a core topic of market-microstructure research. This section advances the price-discovery migration hypothesis: there is a structural trend indicating that the dominance of price discovery is gradually shifting from centralized exchanges to application-chain decentralized exchanges. This trend is not an incidental fluctuation in liquidity but a systematic change driven by deep economic forces. In theory, once this migration reaches a critical mass, the network effects of liquidity may render it irreversible. As Section 6.4.3 will argue, however, the current market evidence is not yet sufficient to confirm that the migration has crossed an irreversible critical point, and the analysis in this section should be regarded as a research hypothesis awaiting empirical testing.
6.4.1 Structural drivers
The trend of price discovery migrating from CEXs to on-chain venues does not stem from an ideological call but is driven by three mutually reinforcing structural forces. Before analyzing these drivers, one important confounding variable deserves attention: the 346% year-over-year growth in DEX perpetual futures volume must be read against the CEX growth rate of 29% and against the macro environment of the same period (the Federal Reserve's rate-cutting cycle, the approval of spot Bitcoin ETFs, and a general recovery in risk appetite). DEX volume may have a higher beta to risk-appetite sentiment, because in a bull market new retail traders disproportionately enter through DeFi channels. Part of the growth may therefore reflect a cyclical rising-tide effect rather than a purely structural advantage. Acknowledging this confounding variable, the following three structural forces remain identifiable.
The most fundamental of these forces is the trust premium of verifiable liquidity. In the black-box architecture of a CEX, the depth of the order book cannot be independently verified by outsiders. This opacity not only masks potential wash trading but, in extreme market conditions, also deprives participants of confidence in the authenticity of liquidity. The collapse of FTX (see Section 6.1.1) became a landmark event, and market participants came to grasp the fundamental gap between paper liquidity and real liquidity [28]. By contrast, every resting order on an on-chain central limit order book is a genuine on-chain commitment that anyone can independently audit cryptographically. As institutional investors and high-frequency trading firms increasingly value the verifiability of liquidity, this transparent liquidity acquires a significant trust premium. This premium is continuously pushing capital to migrate from CEXs to on-chain architectures. As the left panel of Figure 6-10 shows, the ratio of DEX to CEX perpetual futures volume climbed from 2.1% in the first quarter of 2023 to 11.7% in November 2025, with the trust crisis after the FTX collapse markedly accelerating this trend.
On top of the trust premium, the efficiency gains of protocol-level market making constitute the second driver of the migration. Traditional CEX market making relies heavily on a few professional institutions with top-tier infrastructure (such as Wintermute, Jump Trading, and Cumberland), and this high entry threshold leads to market-making profits being monopolized by a handful of institutions. Application-chain DEXs, however, are breaking this monopoly through protocol-level innovation. Take Hyperliquid's HIP-3 mechanism and its HLP vault: market making shifts from the privilege of a few institutions to an open, protocol-driven public service. Any capital holder can participate in market making by injecting funds into the HLP vault, and the protocol automatically manages quoting strategies and risk exposure. This architecture attracts broader capital participation in liquidity provision and significantly increases order-book depth. Data made public by the Hyperliquid team in early 2026 show that the cumulative resting-order depth of its Bitcoin perpetual futures at certain price levels has approached twice that of Binance, with bid-ask spreads comparable to those of top-tier CEXs [29]. Note, however, that these data come from a self-report by an interested party; the potential bias and the need for independent cross-validation are detailed in Section 6.4.3. More fundamentally, assessing liquidity quality requires distinguishing resilient depth from fragile depth: orders provided by independent, profit-driven market makers are usually actively replenished after being filled, constituting resilient depth; whereas the liquidity provided by the HLP vault—a single, concentrated, protocol-driven LP—may freeze or be withdrawn under stress as participants panic-withdraw, constituting fragile depth. The JELLY incident already demonstrated the structural fragility of HLP's concentrated liquidity provision. This efficiency gain directly strengthens the on-chain market's ability to absorb large orders and reflect new information, which is precisely the core function of price discovery.
The on-chain migration of traditional financial institutions has further accelerated this process. Professional trading firms are moving their technical capabilities and capital from CEXs to on-chain markets. Market makers and proprietary trading firms from Wall Street have already begun deploying strategies on-chain [30]. For example, Jump Trading invested in Firedancer, a high-performance validator client for Solana, while Cumberland became a core data provider for the Pyth oracle network. These moves reflect deep institutional conviction in the price-discovery potential of on-chain markets. The inflow of institutional capital brings not only deeper liquidity but, more importantly, more efficient information processing: professional market makers possess sophisticated pricing models and risk-management systems, and their participation directly improves the speed and accuracy with which on-chain markets incorporate new information into prices. As the right panel of Figure 6-10 shows, annual DEX perpetual futures volume grew from roughly $0.3 trillion in 2022 to roughly $6.7 trillion in 2025, a compound annual growth rate exceeding 180%, with accelerating institutional participation an important driver of this growth.
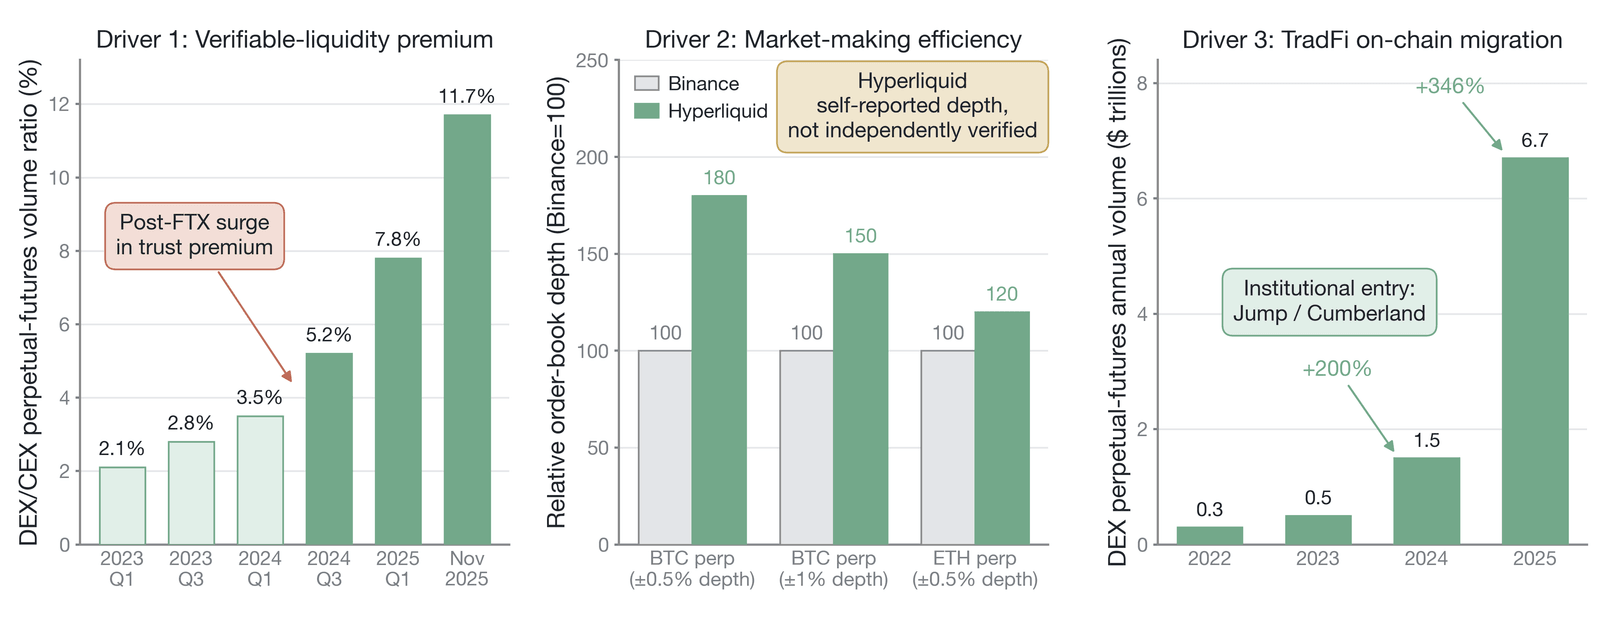
Figure 6-10. The three structural drivers of the price-discovery migration and the current evidence (the left panel shows the ratio of DEX to CEX perpetual futures volume, through November 2025 [4]; the middle panel shows Hyperliquid's self-reported resting-order depth [29], for a specific price level and time window, not cross-validated against independent data sources such as Kaiko and Amberdata; the right panel shows annual DEX perpetual futures volume [3], with +200% and +346% on a year-over-year basis; Data source: CoinGecko [4], DeFiLlama, The Block [3], and Hyperliquid team public data [29])
The three panels of Figure 6-10 together sketch the current progress of the price-discovery migration across three dimensions: market share, liquidity depth, and absolute scale. As the next subsection will argue, however, these data are not yet sufficient to prove that the migration has crossed an irreversible critical mass.
6.4.2 Critical mass and network effects
The liquidity of financial markets has powerful, self-reinforcing network effects. As classic theory in financial economics reveals, liquidity attracts liquidity. In perpetual futures markets, this network effect manifests as a clear positive feedback loop: deeper liquidity leads to narrower bid-ask spreads; narrower spreads attract more traders; the gathering of traders brings more order flow; abundant order flow further attracts more market makers; and the increase in market makers in turn provides deeper liquidity (see Figure 6-11).
This mechanism means that if the liquidity of application-chain DEXs can persistently surpass that of CEXs on certain core assets, this positive feedback loop may make the migration of price discovery irreversible. For once a certain critical mass is crossed, any effort to pull liquidity back to the traditional architecture must overcome the same enormous network-effect barrier. This closely resembles the competitive dynamics among exchanges in traditional finance: once an exchange gains an overwhelming liquidity advantage in a particular asset class, competitors find it nearly impossible to reclaim market share in that asset.
Assessing the current state of the migration, however, demands extreme rigor. Empirical research shows that the current crypto market still exhibits a clear two-tiered structure: CEXs remain dominant in price discovery, with a price-integration measure about 61% higher than that of DEXs [31]. The specific methodology behind this figure (information share, the Gonzalo-Granger decomposition, or another price-discovery measure), the sample period, and the range of assets analyzed all significantly affect the estimate. Such estimates are highly sensitive to the sampling frequency and the lead-lag specification, and given the rapid change in DEX market share, even recent research may already be partly outdated. New information is reflected in prices at the CEX first and only then transmitted to DEXs through the funding rate and arbitrage mechanisms. This finding shows that although the direction of the migration trend is clear, and it has already completed the stage-transition from impossible to observable, it remains a considerable distance from the irreversible critical mass.
Figure 6-11 assesses the current state of the price-discovery migration across five key dimensions: liquidity depth (for some assets, such as BTC perpetual futures, this has approached or even surpassed the CEX) is the dimension closest to critical mass, whereas on the price-discovery-contribution (information-share) dimension, the CEX is still about 61% higher, the strongest evidence that the migration is incomplete; trading-volume share, institutional participation, and the persistence of liquidity after incentives are withdrawn are the key variables that will determine whether the migration can move from observable to irreversible.
6.4.3 A cautious reading of the current evidence
Regarding the price-discovery migration hypothesis, we must maintain a cautious scholarly stance and recognize several key limitations in the current market evidence.
Potential bias in data sources. Some of the prominent data currently supporting the migration hypothesis (such as order-book-depth comparisons at specific price levels) come from public statements by application-chain team members or from reports by interested parties. Although these data have reference value, they carry an inherent conflict of interest. For example, the depth data made public by the Hyperliquid team selected the price levels and time windows most favorable to itself and may not reflect true conditions across all hours and all market states. These data need to be cross-validated through independent academic research and third-party microstructure data (from professional data providers such as Kaiko and Amberdata).
Snapshot versus norm. A depth snapshot at a single point in time or under a specific market environment cannot represent the market's persistent norm. Liquidity may temporarily surpass the CEX in certain periods (such as the peak of protocol token incentives, the anticipation phase of an airdrop, or when market sentiment is extremely optimistic) but may fall back significantly after incentives end or sentiment shifts. Assessing the true progress of the migration requires examining the retention rate of liquidity after a complete market cycle (including bull markets, bear markets, and extreme volatility events). "Incentives are highly effective at attracting volume but ineffective at retaining risk. Fee rebates and points programs can rapidly mobilize activity, but they do not by themselves generate durable open interest. Risk does not stay where it is subsidized; it stays where it is safely held." [32]
Depth does not equal price-discovery quality. Order-book depth is only one dimension of market quality. The quality of price discovery depends more on informational efficiency (the speed and accuracy with which new information is incorporated into prices) and on market resilience (the speed at which prices recover after being hit by a large order). A market with an extremely deep order book but slow information transmission may have lower price-discovery quality than a shallower market that reacts to information far more quickly. These multidimensional assessments require more precise microstructure tools—such as the Hasbrouck information share [33] and the Gonzalo-Granger permanent-transitory decomposition—for empirical testing, which is taken up in Chapters 13 through 15.
The role of seigniorage in liquidity formation. The perpetual futures DEX market is at a critical juncture in the transition from subsidy-driven to market-structure-driven [32]. The year 2025 is the first in which multiple perpetual futures DEXs began to pass this test at scale. Yet the liquidity of many emerging platforms still relies heavily on token-inflation incentives (seigniorage). Only when the main source of on-chain liquidity substantively shifts from token incentives to genuine trading demand and sustainable market-making profits can this migration of price discovery be considered truly sustainable.
Conclusion: The directional judgment of the migration hypothesis is well-founded, but it is currently still at the stage of a trend that is identifiable but not yet irreversible. Chapters 13 through 15 will use more precise microstructure tools to assess this judgment.
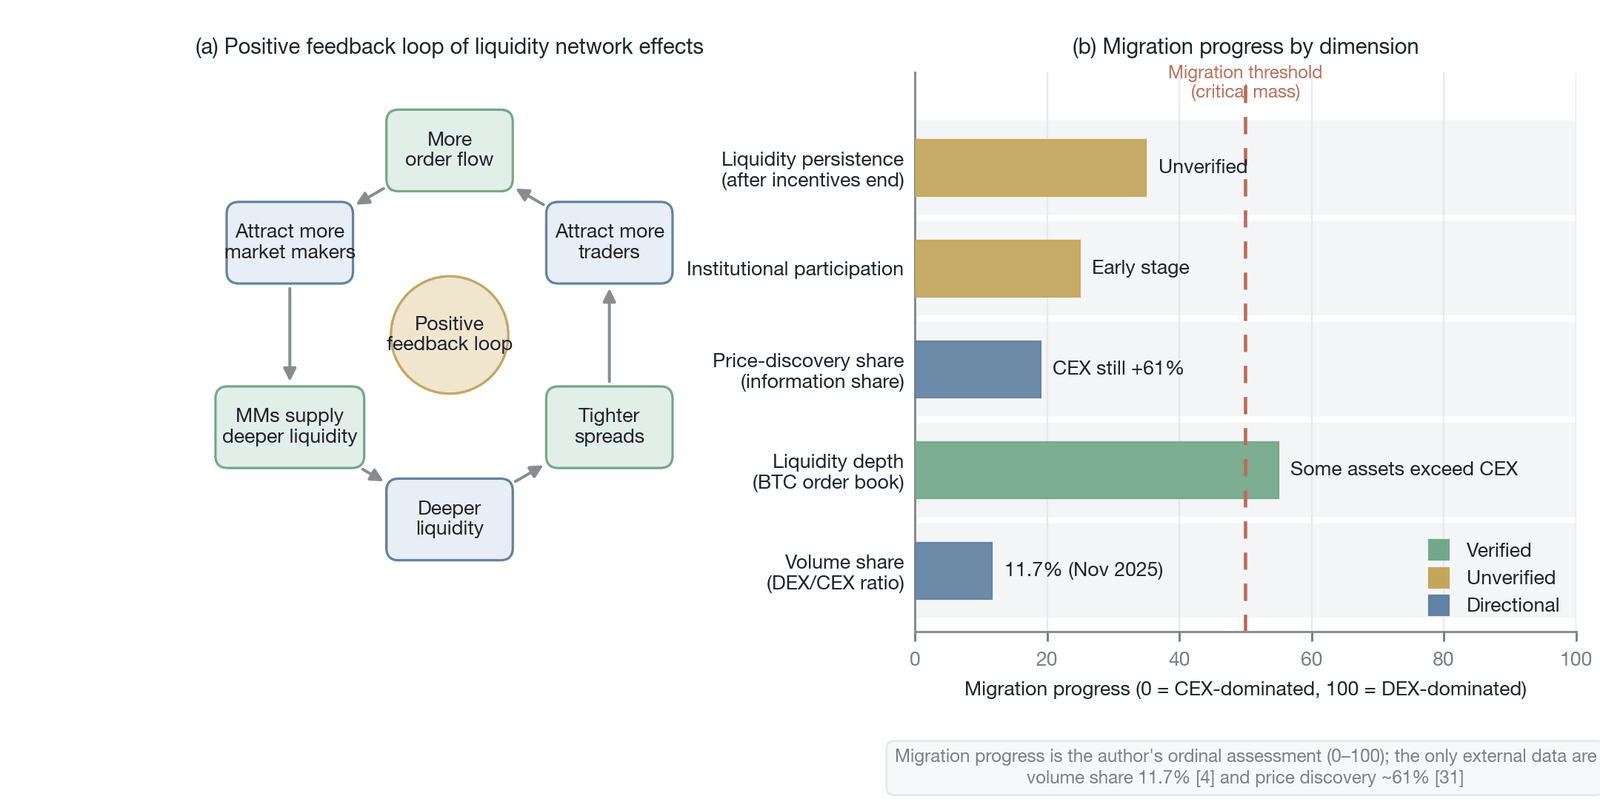
Figure 6-11. The positive feedback loop of liquidity network effects and the current-state assessment of the price-discovery migration (a positive-feedback-loop schematic overlaid with the author's migration scores, where 0 to 100 is the author's composite assessment, not a single quantitative metric; the only external empirical data are the 11.7% volume share, November 2025 [4], and the CEX price-information share being about 61% higher [31]; Data source: CoinGecko [4], Zhivkov [31], and Hyperliquid public data [29])
6.4.4 The shaping of trader behavior
The migration of price discovery is not merely a reallocation of macro market share; at the micro level it profoundly shapes traders' behavioral patterns. Market structure is by no means a passive backdrop to trading behavior but an active shaper of it. Understanding this has a decisive influence on assessing the quality of price discovery under different architectures.
Empirical research on the behavioral differences between CEX and DEX traders reveals the concrete impact of this shaping effect [10]. That study systematically compared the behavioral differences of traders on CEXs and DEXs and found a striking phenomenon: on CEXs, traders' behavioral patterns are closer to those of traditional financial markets, showing a relatively balanced response to price signals in both directions—roughly symmetric sensitivity to good news and bad news. On oracle-priced DEXs, however, uninformed traders respond significantly more strongly to positive news than to negative news, producing a systematic long bias.
The root of this behavioral difference lies in the design of the underlying mechanism. Oracle-pricing models (such as the virtual automated market maker, or vAMM, and oracle-based synthetic assets) structurally reduce the slippage and adverse-selection risk a trader faces when building a long position. When a trader goes long on an oracle-priced DEX, the execution price is determined directly by the external price the oracle provides and is not constrained by local order-book depth, so a large long order does not push up the execution price the way it would in a traditional central limit order book. This mechanical asymmetry regularly incentivizes going long and suppresses going short.
To present these behavioral differences systematically, Table 6-5 compares the behavior of CEX traders and oracle-priced DEX traders across four key dimensions and traces the mechanism root behind each difference.
| Behavioral dimension | CEX traders | Oracle-priced DEX traders | Mechanism root of the behavioral difference |
|---|---|---|---|
| Response to positive news | Moderately increase long positions | Significantly increase long positions | Oracle pricing lowers long-side slippage |
| Response to negative news | Moderately increase short positions | Relatively muted response | Shorting still faces liquidity constraints |
| Leverage propensity | Fairly evenly distributed | Skewed toward higher leverage | Low slippage encourages more aggressive positions |
| Holding period | Relatively short (mostly intraday) | Relatively long | Lagging oracle-price updates may systematically depress the deviation between the mark price and the index price, thereby lowering the absolute value of the funding rate and the cost of holding a position (a hypothetical explanation, awaiting further empirical testing) |
Table 6-5. Behavioral differences between CEX and oracle-priced DEX traders and their mechanism roots (Data source: compiled by the author based on Chen, Ma, and Nie [10])
Table 6-5 shows that these behavioral differences are not random but correspond systematically to the underlying pricing mechanism—the structural weakening of long-side slippage under oracle pricing simultaneously incentivizes a long bias, higher leverage, and longer holding periods across all four dimensions. Beyond the mechanistic explanation, a behavioral perspective offers a complementary understanding: the amplifying effect of social media (narrative contagion in Crypto Twitter and Telegram groups) creates a powerful long-direction herding effect that superimposes on and reinforces the structural incentives of oracle pricing. This systematic long bias has reflexive implications: deviation from the CEX funding rate creates a predictable arbitrage flow, and the arbitrage flow itself becomes a source of distortion in the cross-CEX-DEX price signal. This finding shows that different pricing mechanisms, fee structures, and risk-management rules regularly incentivize or suppress specific types of trading behavior, thereby systematically affecting the direction and efficiency of price discovery; it also provides the macro background for the deeper discussion of order-book microstructure and mechanism design in later chapters (Chapters 7 and 8): every adjustment of a protocol parameter is not merely optimizing system performance but redefining the game matrix of market participants and thereby shaping the price-discovery characteristics of the entire market.
6.5 The evolution of risk distribution
The evolution of market structure has changed not only the mode of competition and the pricing mechanism but also, fundamentally, the distribution of systemic risk. In assessing the migration from centralized to decentralized architectures, a common error is to seek a simple binary conclusion: Is on-chain safer than a centralized exchange? This way of framing the question is itself flawed, because it presupposes that risk can be compared along a single dimension. This section advances the risk visibility-manageability proposition, arguing that the evolution from CEXs to on-chain architectures is essentially not a simple increase or decrease in the total quantity of risk but a structural transformation in the character of risk—from invisible but occasionally explosive to continuously visible but manageable. This framework is a dynamic extension of the risk substitution theorem of Chapter 5 and is of a piece with the concept of risk-surface transformation advanced in Chapter 1.
6.5.1 The risk visibility-manageability proposition
A core axiom in the theory of financial risk management is this: risk that cannot be observed and measured cannot be effectively managed. This axiom runs through the entire body of risk-management knowledge, from the Basel Accords to modern portfolio theory. On this basis, we advance the risk visibility-manageability proposition.
Proposition: The visibility of risk is a necessary but not sufficient condition for its manageability. Invisible risk cannot be accurately quantified and therefore cannot be effectively hedged or managed ex ante; it can only be dealt with passively, after the fact, when a crisis erupts. Yet visibility alone does not guarantee manageability; the effective management of risk also depends on adequate loss-absorption capacity, appropriate circuit-breaker mechanisms, and a tiered liquidation system.
Corollary: The evolution from CEXs to on-chain architectures marks a substantial improvement in the visibility of systemic risk. This does not mean the absolute level of risk falls; rather, it means the nature of risk changes fundamentally, from tail-risk events that are unmanageable but occasionally require enduring catastrophic consequences [34] to a normalized challenge that is manageable but requires the continuous investment of resources for monitoring and protection. The JELLY incident provides an important boundary-condition test of this proposition: the attack was fully visible on-chain in real time, and the community completed a diagnosis of the attack vector within hours—visibility did indeed accelerate identification of the problem. Yet the protocol could not manage this risk through automated mechanisms and ultimately still required centralized intervention (unilateral delisting and forced liquidation), which at the operational level is equivalent to the CEX behavior this chapter criticizes. This shows that, above visibility, the manageability of risk may still depend on residual centralized power, a tension especially pronounced in application chains with limited decentralization.
Under the CEX paradigm, risk exhibits the characteristics of low-frequency, invisible, and occasionally catastrophic. In day-to-day operations, the user experience is usually extremely smooth: trades execute fast, the interface is friendly, and customer service responds promptly. Risk is hidden inside the black box of centralized servers, and the safety of a user's assets rests entirely on one-sided trust in the exchange's solvency and internal governance. Yet once this invisible risk accumulates to a critical point, it often erupts in an extremely destructive way. The customer-fund losses caused by the FTX collapse and its bankruptcy proceedings, which lasted more than two years (see Section 6.1.1) [28]; the $1.5 billion security incident suffered by Bybit in February 2025 [35]; and the loss of roughly 850,000 BTC by Mt. Gox in 2014 (on the basis of the bankruptcy-trustee / civil-rehabilitation proceedings) [54], with its legal-recovery process stretching over nearly a decade, are all textbook cases of this pattern. Their common feature is that, before the disaster, external market participants had almost no warning, and the social cost was extremely high.
By contrast, risk under an on-chain architecture exhibits the characteristics of high-frequency, visible, and manageable. In a general-purpose public-chain or application-chain DEX, the MEV game plays out in real time in the public mempool, the logic and potential vulnerabilities of smart contracts are open to all auditors, and every parameter and trigger condition of the liquidation process is clearly queryable on-chain. Users and institutions can intuitively see these risks every day. Precisely because of this continuous visibility, market participants can build real-time monitoring systems, early-warning mechanisms, and hedging strategies. Take the JELLY attack Hyperliquid suffered in March 2025: the attacker exploited a design flaw in the liquidation mechanism, and the protocol vault consequently faced a peak unrealized loss of roughly $13.5 million (not a realized loss; the HLP vault recorded a small profit after final settlement—see the detailed analysis of this incident in Section 6.3.2); but the protocol-level response completed within hours: the token was delisted, positions were settled at the mark price, and parameters were tightened [36]. This pattern of rapid exposure, rapid repair stands in sharp contrast to the CEX pattern of long concealment, sudden collapse.
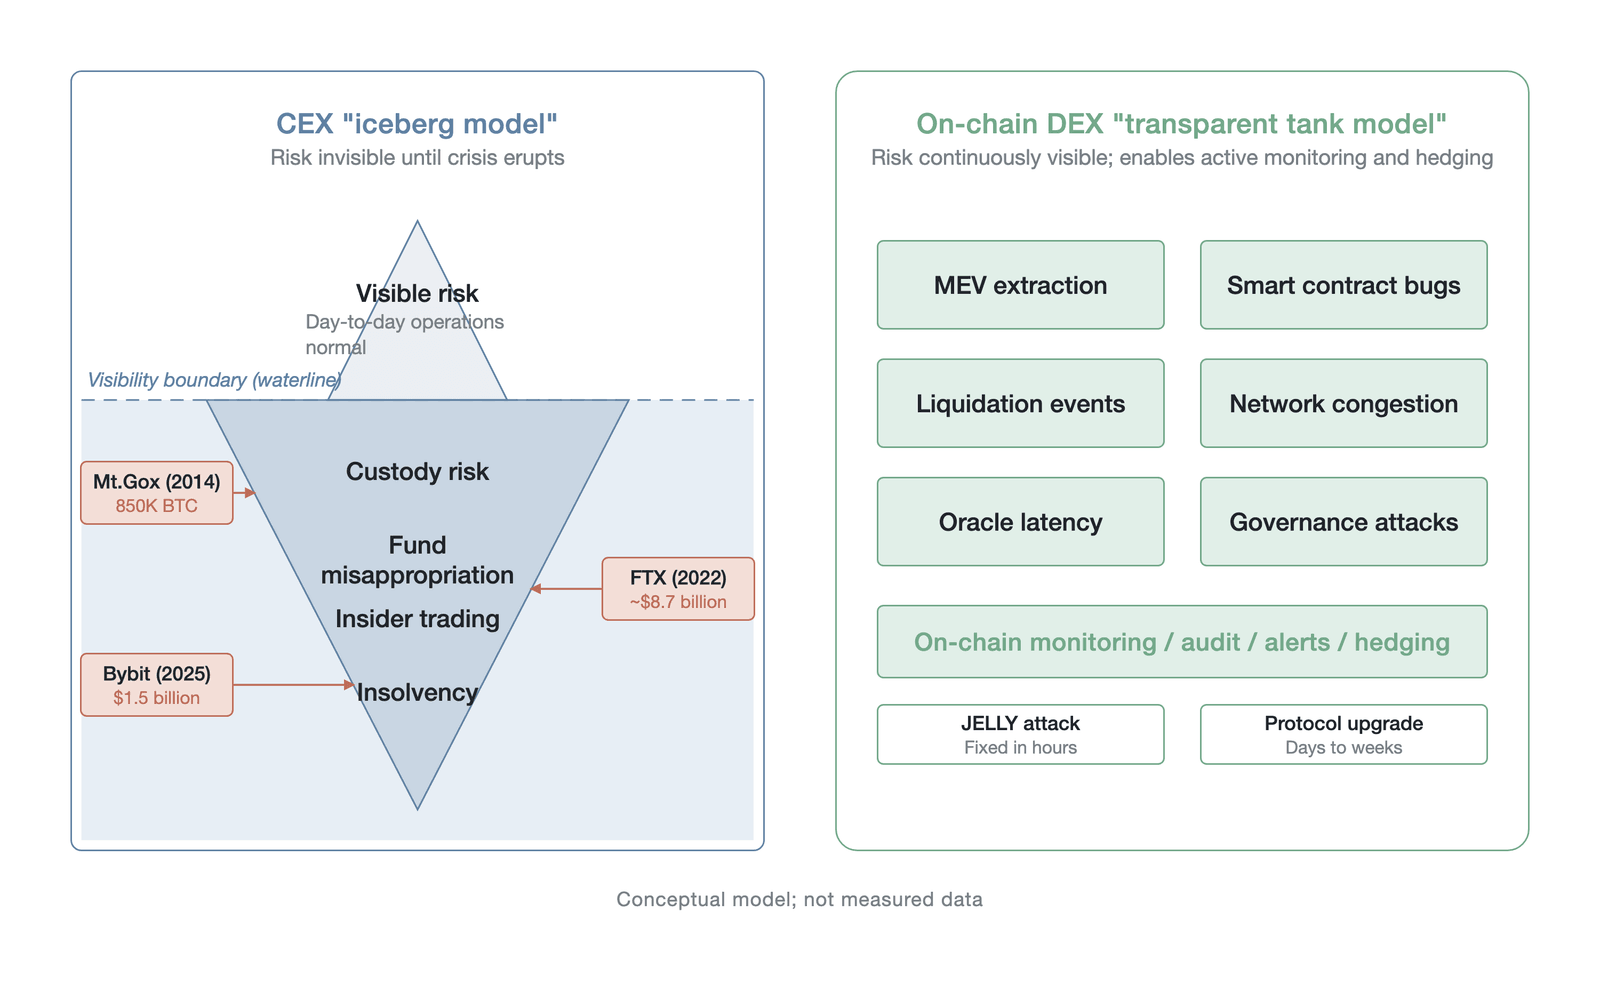
Figure 6-12. A visualization of the risk visibility-manageability proposition (a CEX's tail risks—custodial risk, misappropriation of funds, insolvency—are invisible in daily operation until a crisis erupts; on-chain DEX risk types—MEV extraction, smart-contract vulnerabilities, liquidation events—are continuously visible, supporting active monitoring and hedging; a conceptual-model schematic, not empirical data; the roughly $8.7 billion FTX figure is on the debtors' customer-shortfall / August 2024 court restitution-order basis, Bybit's $1.5 billion [7], and JELLY's within-hours repair [36]; drawn by the author)
In assessing the merits of these two patterns, the lessons of financial history repeatedly prove a profound truth: invisible risk is not absent risk; it means only that when it erupts, the system will be utterly unprepared. One root of the 2008 global financial crisis was precisely that complex structured financial products hid the risk of subprime loans within multiple layers of securitization, leaving regulators and market participants unable to accurately assess the true scale of systemic risk. The collapse of FTX is the crypto market's version of the same lesson. Therefore, the systemic destructive power of a tail-risk event far exceeds the economic cost of sustaining continuous security investment. The evolution of risk toward a visible state is a necessary condition for a market's maturation.
6.5.2 Statistical properties of risk
To characterize this evolution more precisely, we need to systematically compare the statistical properties of risk across the three service-provider architectures. This is not only a dynamic extension of the risk substitution theorem of Chapter 5 but also a concretization of the concept of risk-surface transformation of Chapter 1, providing an analytical framework for quantitatively assessing market quality.
| Dimension | Centralized exchange | General-purpose public-chain DEX | Application-chain DEX |
|---|---|---|---|
| Frequency of risk events | Low (roughly five catastrophic events with single losses exceeding $1 billion between 2022 and 2025, including FTX and Bybit; the total is significantly higher if bankruptcies such as Celsius, BlockFi, and Voyager and mid-sized security incidents are included) | High (per EigenPhi data, daily MEV extraction on Ethereum exceeds $500,000 [18]) | Medium (in 2025, Hyperliquid experienced three strategic attacks on the order of tens of millions of dollars) |
| Single-shock magnitude | Extremely high (FTX roughly $8.7 billion, on the debtors' customer-shortfall basis [1]; Bybit $1.5 billion [35]) | Low to medium (a single MEV extraction is usually thousands to tens of thousands of dollars; a contract-vulnerability attack can reach millions) | Medium (the three 2025 incidents were roughly $4 million, $13.5 million, and $4.9 million, respectively [20][37][25]) |
| Ex ante predictability | Extremely low (operates inside a black box; not externally observable) | High (on-chain data and the mempool are globally traceable) | Medium to high (traceable on-chain, but strategic attacks have a degree of covertness) |
| Crisis-recovery path | Lengthy legal and bankruptcy proceedings (FTX about 2 years, Mt. Gox about 10 years) | Smart-contract repair and deployment (on the order of days to weeks) | Governance votes and protocol-level emergency upgrades (Hyperliquid's JELLY incident about 6 hours [36]) |
Table 6-6. A comparison of the statistical properties of risk across the three paradigms (Data source: compiled by the author based on [1][18][20][25][35][36][37])
The comparison in Table 6-6 presents a clear frequency-versus-shock-magnitude trade-off: the CEX has the lowest frequency of risk events but the highest single-shock magnitude (on the order of billions of dollars), whereas on-chain architectures have more frequent risk events but relatively controllable single losses (on the order of millions to tens of millions of dollars). The difference in the crisis-recovery path is especially striking: CEX bankruptcy recovery is measured in years, while on-chain protocol repair is measured in hours to weeks—an order-of-magnitude gap that directly corroborates the core assertion of the risk visibility-manageability proposition. Looking at the distribution of specific risk types, the three paradigms present markedly different profiles, echoing the risk substitution theorem of Chapter 5: rather than eliminating risk, different architectures substitute one form of risk for another.
Beyond the macro trade-off between frequency and shock magnitude, the three paradigms also present markedly different profiles in the distribution of specific risk types. From seven core risk categories—custodial/counterparty risk, smart-contract risk, MEV/information leakage, liquidation/shortfall, economic security, cross-chain bridges, and regulation/compliance—Table 6-7 compares, one by one, the degree of exposure and the manifestation of each risk in the three architectures.
| Risk type | CEX paradigm | General-purpose public-chain DEX paradigm | Application-chain DEX paradigm |
|---|---|---|---|
| Custodial/counterparty | Extremely high: assets are custodied by the exchange, facing theft, misappropriation, and bankruptcy risk | Extremely low: self-custodial wallet, managed by smart contracts | Low: on-chain account management, but the cross-chain bridge is the weak link |
| Smart contract | None: no on-chain smart contracts involved | High: contract vulnerabilities can cause fund losses | Medium: core logic embedded at the protocol layer, with a smaller attack surface |
| MEV/information leakage | Implicit: information asymmetry exists inside the exchange | Explicit and high: the public mempool exposes trading intent | Controllable: the private mempool mitigates traditional MEV, but validator MEV is a new risk |
| Liquidation/shortfall | Socialized sharing by the insurance fund; in extreme cases, transferred via ADL | Managed by the protocol insurance fund; the liquidation process is public and transparent | Managed by the protocol insurance fund; governance can adjust liquidation parameters |
| Economic security | None: does not depend on a token-economic model | Low: inherits the economic security of the underlying blockchain | Medium to high: relies on its own token's market capitalization to maintain network security |
| Cross-chain bridge | None: no cross-chain operations involved | Low: the official L2-to-L1 bridge has relatively strong security guarantees | Medium to high: assets must pass through a cross-chain bridge to enter the application chain |
| Regulation/compliance | High: a regulated entity, facing license revocation and asset freezes | Medium: decentralization raises the difficulty of enforcement, but the front end can be regulated | Medium: between a CEX and a pure DEX, with an as-yet-unclear regulatory status |
Table 6-7. A comparison of the distribution of seven core risks across the three architectures (Data source: compiled by the author)
Table 6-7 clearly displays the concrete paths of risk substitution: the CEX's custodial/counterparty risk is largely eliminated in on-chain architectures, but it is replaced by smart-contract risk and cross-chain-bridge risk; the implicit information asymmetry of the CEX turns into explicit MEV extraction in the general-purpose public-chain DEX and then evolves into the more covert validator MEV in the application-chain DEX. No architecture achieves the absolute elimination of risk; what differs is only the form of risk exposure and the degree to which it is manageable.
Figure 6-13 integrates Tables 6-6 and 6-7 into four complementary visual perspectives: (a) a frequency-versus-shock-magnitude scatter plot, (b) a radar chart of the seven risk types, (c) a comparison of recovery-path times, and (d) a visibility-manageability quadrant chart, intuitively presenting the overall direction of risk evolving from low-frequency, high-shock, unmanageable to high-frequency, low-shock, manageable. Here, the order-of-magnitude gap between recovery paths measured in years (CEX: FTX about 2 years, Mt. Gox about 10 years) and those measured in hours to weeks (on-chain: JELLY about 6 hours) is the most intuitive corroboration of the risk visibility-manageability proposition.
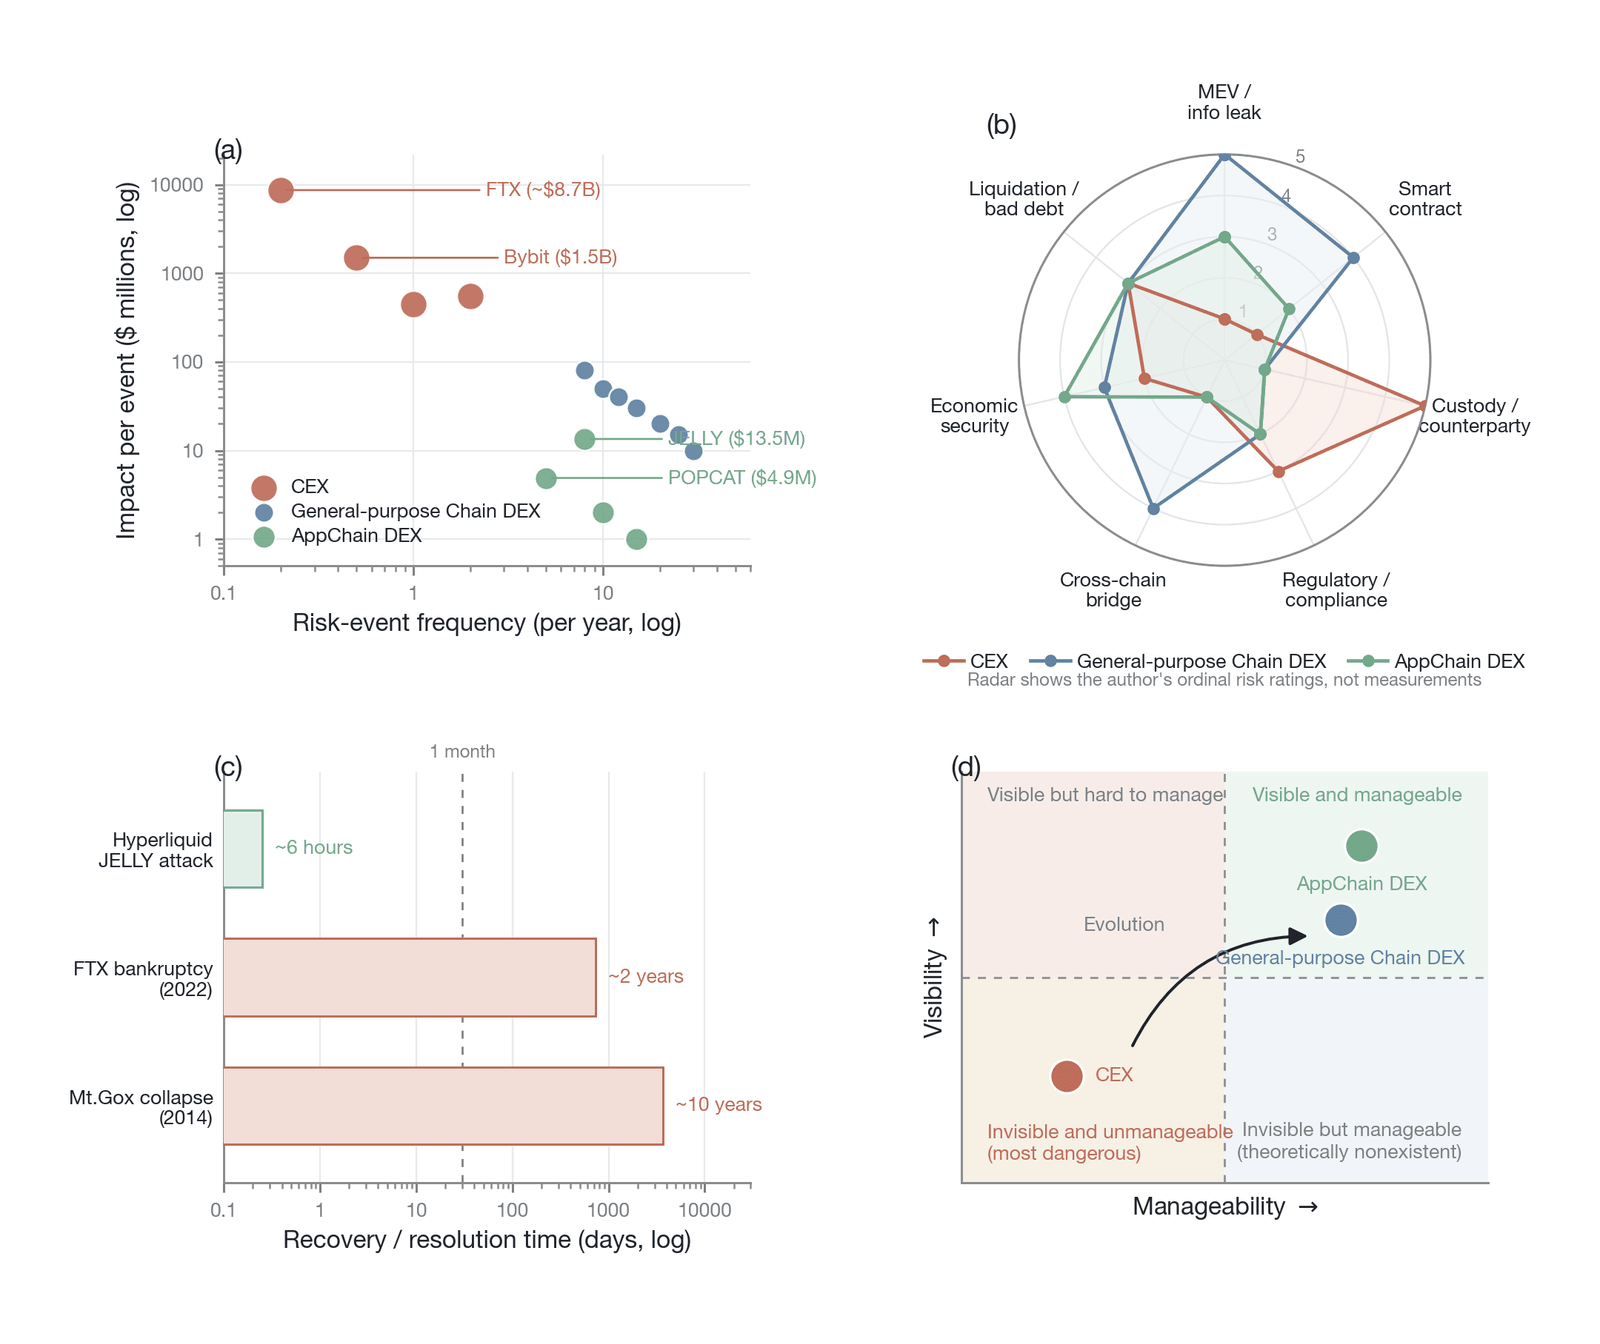
Figure 6-13. The evolution of risk distribution across the three paradigms: a frequency-versus-shock-magnitude scatter plot, a radar chart of the seven risk types, a comparison of recovery-path times, and a visibility-manageability quadrant chart (panels a and c use public event data, sourced event by event: FTX roughly $8.7 billion, on the debtors' customer-shortfall / restitution-order basis; Bybit $1.5 billion [7]; POPCAT roughly $4.9 million [25]; JELLY roughly $13.5 million, peak unrealized loss [37], recovered within hours [36]; panels b and d use the author's ordinal risk ratings, not quantitative measurements; Data source: public event records, 2014 to 2025; the DEX/CEX volume ratio additionally follows CoinGecko [4])
6.5.3 Cross-paradigm risk transmission
Although the three paradigms differ significantly in architectural design and risk distribution, they are not systems that operate in isolation. In the current crypto ecosystem, they are tightly connected by the price of the same underlying asset, constituting a complex financial system of communicating vessels. While this interconnection improves overall market efficiency (eliminating price gaps through cross-market arbitrage), it also creates a lethal path for cross-paradigm risk transmission. Beyond the oracle-mediated price-transmission channel detailed below, the stablecoin liquidity channel constitutes another equally critical but more covert cross-paradigm transmission path. DEX perpetual futures use USDT and USDC as their principal collateral, and the credit basis of these stablecoins derives from off-chain fiat reserves and short-term Treasury portfolios. In a macro-stress scenario (as demonstrated by the USDC depeg event triggered by the collapse of Silicon Valley Bank in March 2023), transmission occurs not through the oracle price but through the collateral layer itself: a stablecoin confidence crisis would simultaneously impair the collateral quality of all three paradigms, triggering correlated liquidations. This channel bypasses all oracle-based circuit-breaker designs and constitutes one of the hardest-to-defend systemic risks in the current market structure.
In extreme market volatility, this transmission usually completes within minutes, and its typical cyclical path is shown in Figure 6-14. Because CEXs aggregate large numbers of highly leveraged retail traders, when the market suffers a sudden shock, the CEX is the first to trigger large-scale forced liquidations, causing prices to fall sharply. This negative feedback loop of forced liquidation → price decline → more liquidations is precisely the crypto-market realization of the loss spiral that Brunnermeier and Pedersen (2009) formalized in Market Liquidity and Funding Liquidity, in which the mutually reinforcing decay of market liquidity and funding liquidity is sharply amplified in a high-leverage environment [38]. Subsequently, the oracle network rapidly transmits the CEX crash price on-chain, triggering a chain of liquidations of highly leveraged DEX positions; on-chain liquidation flow strikes market makers' liquidity pools or order books, causing the DEX price to deviate significantly from the CEX; cross-market arbitrageurs then buy on the lower-priced DEX and sell to hedge on the CEX, transmitting new selling pressure back to the CEX and thereby potentially opening a new round of the negative feedback loop.
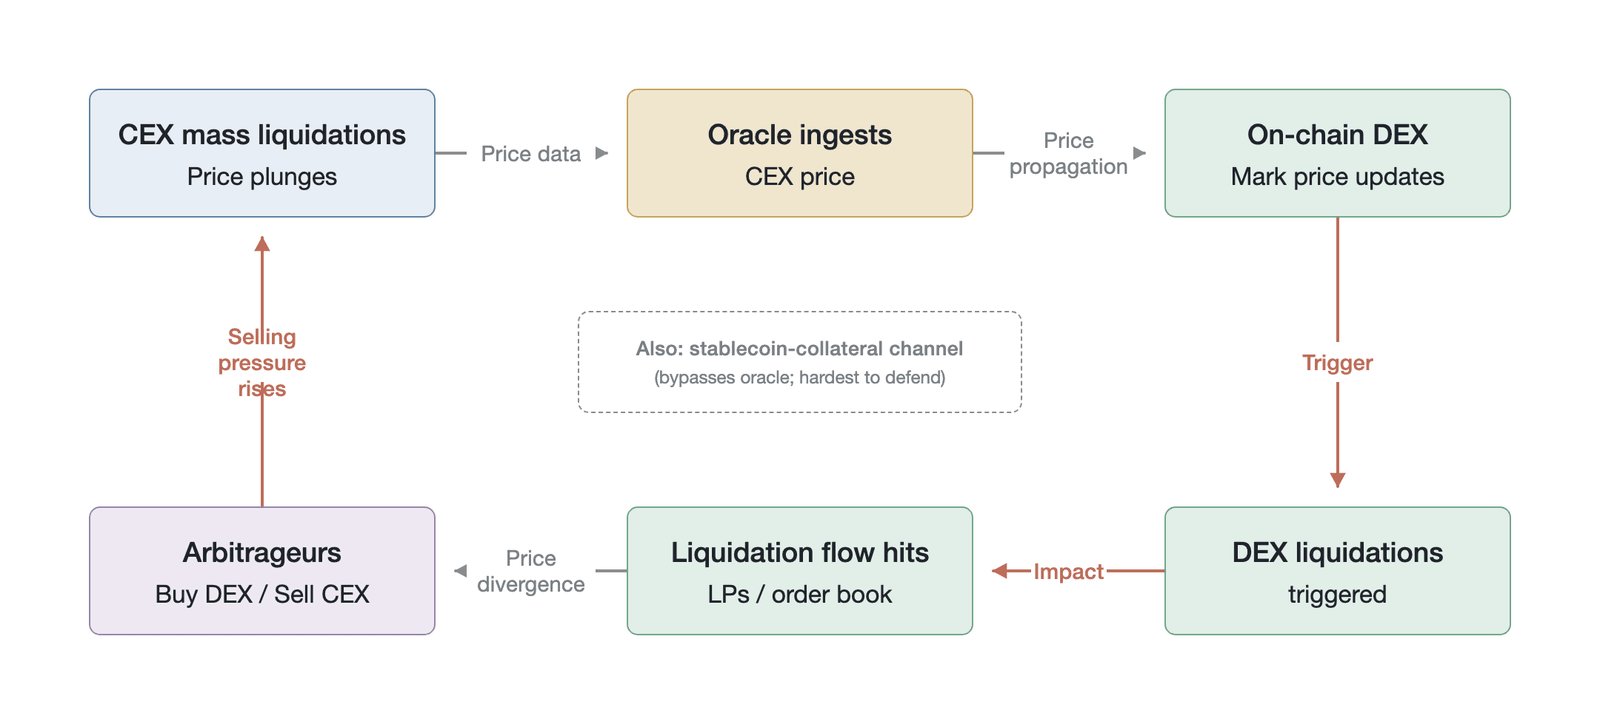
Figure 6-14. The cyclical path of cross-paradigm risk transmission (the price shock triggered by CEX liquidations is transmitted on-chain to DEXs via the oracle, triggering a chain of liquidations, and arbitrageurs' cross-market operations feed selling pressure back to the CEX; a conceptual-cycle schematic, the oracle-mediated channel, not empirical data; drawn by the author, based on FTI Consulting [39])
There are two key amplifiers in this transmission mechanism. The immediacy of the oracle is one. In traditional finance, the settlement delay between different markets often serves as a buffer—for example, the daily settlement mechanism of futures markets gives participants a time window to adjust positions. In the crypto market, however, oracle networks differ fundamentally in architecture: Chainlink uses a push-based heartbeat-plus-deviation-threshold model (updating automatically when the price moves more than, say, 0.5% or after N minutes), while Pyth uses a pull-based model (consumers request the latest price on demand). This difference has different effects on the speed of cross-paradigm transmission; a pull-based oracle may in fact amplify the transmission effect, because liquidators actively pull the latest, most unfavorable price to trigger liquidations and capture rewards. Regardless of the model, oracles typically reflect price changes at second-level frequency, eliminating the settlement buffer of traditional finance, so that a price crash on the CEX side can be transmitted within seconds to all on-chain protocols relying on that oracle, triggering synchronized chain liquidations. Superimposed on the immediacy of the oracle is the blind spot of each platform's local perspective: whether it is a CEX's liquidation engine or a DEX's protocol parameters, their risk-control mechanisms can only make decisions based on local data from their own platform, and no single platform can assess the systemic leverage level of the entire market. A CEX's risk-control system cannot know how large a leveraged position the same batch of traders holds on an on-chain DEX, and vice versa. This locally reasonable but globally inadequate parameter setting (such as the liquidation-penalty rate, the maintenance-margin ratio, and the auto-deleveraging trigger conditions) is extremely fragile in the face of a cross-market resonant shock.
The crypto-market flash crash of October 2025 provides a vivid empirical illustration of this transmission mechanism. According to FTI Consulting's analysis, Bitcoin fell roughly 14% within hours, and the visible notional value of forced liquidations across CEXs and DEXs exceeded $19 billion within about 24 hours. The wave of CEX-side liquidations erupted first, and the on-chain DEX liquidation wave followed close behind, with the lag between them only a few minutes, during which the price deviation of major oracles at one point reached over 1% [39]. High leverage, shrinking order-book depth, the brief failure of oracles, and cross-platform auto-deleveraging mechanisms together constituted a severe liquidity crisis. In that event, the liquidation engines of multiple platforms triggered large-scale forced liquidations within the same time window, while each platform's risk-control system saw only its own internal risk exposure and could not assess the systemic leverage level of the entire market. This cross-paradigm risk transmission is the most severe systemic challenge facing today's perpetual futures market and a core problem that future regulatory frameworks and protocol engineering must confront head-on. Chapter 20 provides a formal analysis of this cross-paradigm transmission from the liquidity perspective, and Chapter 22 from the volatility perspective.
6.6 The paradigm endgame
After a systematic dissection of the competition modes, MEV forms, and risk distribution of the three paradigms—centralized exchanges, general-purpose public-chain decentralized exchanges, and application-chain DEXs—a core macro question must be addressed: Where are these three paradigms headed? Does the evolution of market structure necessarily follow the one-way, linear logic of decentralization replacing centralization, or will it display a more complex dynamic pattern?
The analysis in this section shows that the three paradigms will not converge on an endgame of one model rules them all; instead, they will coexist over the long term amid competition and converge on one another through mutual borrowing. The key uncertainty is where the terminal state of this convergence will land, and whether advances at the technological frontier can effectively expand the area of the impossible triangle and thereby redefine the boundary of what is possible for market structure. At the same time, two fundamental unresolved problems—the effectiveness boundary of decentralization and the dual effect of transparency in a high-leverage environment—will continue to shape the evolutionary direction of the next generation of market structure.
6.6.1 Coexistence and the competitive landscape
Although decentralized exchanges have grown rapidly over the past few years, the market data clearly reveal a multipolar coexistence rather than a simple relationship of replacement. Over the full year of 2025, the top ten perpetual futures exchanges (spanning both CEXs and DEXs) handled as much as $92.9 trillion in volume, up 64.6% year over year [40]. Within this volume growth, DEX perpetual futures volume surged 346% to a record high of $6.7 trillion, and the ratio of DEX to CEX perpetual futures volume climbed further to 11.7% (for the starting point and trajectory of this ratio, see this chapter's introduction and Section 6.4) [40]. This does not mean, however, that CEXs are being comprehensively replaced; in absolute terms, CEXs still hold roughly 85% or more of market share.
This coexistence pattern arises because the three paradigms each occupy an irreplaceable niche. The centralized exchange remains the venue of choice for extremely latency-sensitive high-frequency market-making strategies, for retail investors with limited technical ability, and for institutional capital that depends on deep fiat on- and off-ramps. Through millisecond-level matching engines and internal-ledger settlement, CEXs offer the highest capital efficiency and liquidity depth achievable under current technical conditions. General-purpose public-chain DEXs (such as protocols deployed on Ethereum or its general-purpose Layer-2s), although unable to rival CEXs in performance, satisfy DeFi-native strategies with a strong demand for composability; on these platforms, perpetual futures can interact seamlessly with lending protocols and yield aggregators to form complex structured products. Application-chain DEXs (such as Hyperliquid) and the neighboring application-specific ZK-Rollups that anchor finality to Ethereum's settlement layer (such as Lighter, which strictly speaking does not have independent consensus—see Section 6.6.3) are opening a new battlefield that balances performance and verifiability. By building a dedicated Layer-1 blockchain, Hyperliquid achieved sub-second trade confirmation and throughput of roughly 200,000 orders per second, and in 2025, with $2.9 trillion in annual volume, leapt to become the world's seventh-largest perpetual futures exchange, even surpassing established CEXs such as Coinbase International [40].
From four dimensions—core user base, core advantage, market share, and representative platforms—Table 6-8 summarizes the niche each of the three paradigms occupies. This comparison helps explain why a simple replacement thesis cannot describe the market's true state, because each paradigm serves different user needs and trading scenarios, and its core advantage cannot yet be fully replicated by the others under current technical conditions.
| Dimension | CEX | General-purpose public-chain DEX | Application-chain DEX |
|---|---|---|---|
| Core user base | High-frequency market makers, retail, institutions | DeFi-native strategists | Mainstream traders, institutions |
| Core advantage | Low latency, fiat channels, liquidity depth | Composability, permissionless innovation | The optimal intersection of performance and verifiability |
| 2025 market share | Roughly 85%+ | Roughly 3%–4% (perpetual futures) | Roughly 8%–9% (perpetual futures) |
| Representative platforms | Binance, OKX, Bybit | GMX, Synthetix | Hyperliquid, Lighter |
Table 6-8. The core niche differences among the three paradigms (Data source: compiled by the author)
Table 6-8 shows that the market-share distribution of the three paradigms corresponds closely to the size and capital volume of their core user bases. The criterion distinguishing a general-purpose public-chain DEX from an application-chain DEX in the classification above is whether the platform has an independent blockchain and consensus mechanism; for example, after dYdX v4 migrated from a general-purpose public chain (v3 on StarkEx) to an independent Cosmos-based application chain, it was reclassified from the former to the latter. In addition, the volume metric may be inflated by wash trading or incentive-driven exchanges, and open interest (OI) is a more robust indicator of genuine risk-bearing and price-discovery contribution; but because the availability of DEX OI data is limited, volume remains the primary comparison dimension here. The market may ultimately consolidate to one or two dominant platforms in each segment [41]. This means the future competitive landscape may evolve into a bipolar competition between the top CEX and the top application-chain DEX, while general-purpose public-chain DEXs continue to play their distinctive role in the composability niche. The coexistence of the three paradigms may constitute a long-term equilibrium of market structure, but this judgment must be treated with caution: the current coexistence may be sustained in part by user habits, platform lock-in effects, and switching costs, which makes it closer to a focal equilibrium sustained by behavioral inertia than to a Nash equilibrium in the strict sense. Should a major CEX regulatory crackdown occur, a technological breakthrough eliminate the application chain's performance advantage, or the liquidity network effect of one paradigm break through a critical point, the current tripolar coexistence could be disrupted.
6.6.2 Convergence dynamics
The evolution of market structure is not a static standoff but a dynamic process of mutual borrowing and fusion. The fundamental driver of this convergence is precisely the competitive compression of the trust tax that we examined in Chapter 1 (Section 1.4.3, the layered hybrid of the three trust paradigms) and Chapter 3 (the institutional convergence thesis). To attract and retain liquidity, both CEXs and DEXs strive to make up for their own structural shortcomings, moving toward a middle ground of lower trust tax and higher verifiability.
The trend of CEXs moving closer to on-chain models accelerated markedly after the FTX collapse. To rebuild market trust, mainstream CEXs widely introduced cryptography-based proof of reserves, seeking to add a layer of verifiability outside their opaque internal ledgers. After the FTX event, proof of reserves (PoR) became standard practice for leading CEXs, but current PoR implementations have several known limitations: most are point-in-time snapshots rather than continuous audits, usually cover only the asset side without liability information, and cannot prevent window dressing—that is, an exchange temporarily borrowing assets before the snapshot to meet the proof requirement. The analysis of Vidal-Tomas (2025) further points out that in the absence of independent audit verification, the information content of PoR may be far lower than the market expects [42]. A deeper transformation is reflected in the evolution of asset-custody models: between 2024 and 2025, Binance actively promoted its keyless, seedless, multi-chain-supporting Web3 self-custodial wallet, allowing users to seamlessly access CEX liquidity while retaining control over their assets [43]. Institutional-grade custody services (such as Coinbase Prime) are exploring hybrid-custody and on-chain-settlement mechanisms, seeking to move toward the transparency axis within the impossible triangle. The essence of these moves is that CEXs, without giving up their performance advantage, are actively absorbing the verifiability elements of the on-chain ecosystem.
At the same time, DEXs are moving closer to institutional structure. As the scale of on-chain trading has grown and regulatory scrutiny has intensified, the fully permissionless ideal is giving way to an orderly open market. Protocols such as dYdX have begun implementing geo-fencing at the front end to restrict access by users from sanctioned regions [44]. In February 2026, Hyperliquid formally established a policy center, marking the beginning of leading on-chain protocols' active participation in exploring and shaping compliance frameworks [45]. Whether front-end geo-fencing is legally sufficient to avoid jurisdiction, however, remains fundamentally in doubt: the position of the SEC and the CFTC is that a protocol remains within their jurisdiction as long as users can access it through a VPN or by interacting directly with the smart contract. The CFTC's 2023 enforcement action against Ooki DAO established an important precedent: a DAO can be held legally liable as an unincorporated association. More subtly, the ability Hyperliquid demonstrated in the JELLY incident to unilaterally delist an asset and force liquidation can itself be cited by regulators as evidence that the protocol has centralized control and therefore needs to register. These legal issues are analyzed in depth in Chapter 26. At the on-chain-monitoring level, tools such as AMLBot have already extended to the Hyperliquid blockchain, providing the protocol with anti-money-laundering capabilities. At the protocol layer, DEXs have also begun introducing stricter position-size limits and governance of risk-control parameters, evolving from fully permissionless toward an orderly open market to prevent systemic collapse under extreme market conditions.
This two-way convergence is not merely a fusion of technology and products but a deep blending of two ecosystem cultures. The CEX ecosystem, originating in traditional finance, emphasizes efficiency, liquidity, and top-down innovation, presenting a pyramidal participant structure; the DEX ecosystem, originating in the crypto community, prizes transparency, asset sovereignty, and bottom-up evolution, presenting a flatter participant structure. As traditional financial institutions participate deeply in on-chain market making (Jump Trading invested in Firedancer, a Solana validator client, and Cumberland became a data provider for the Pyth oracle) and CEXs continuously absorb on-chain elements, the boundary between the two is blurring.
Both are moving toward a middle ground of lower trust tax plus higher verifiability. The driver of convergence is the competitive compression of the trust tax (Chapters 1 and 3). The ultimate result may be a hybrid model, in which different trust paradigms are chosen at different functional layers—precisely the layered hybrid predicted in Section 1.4.3, for which Chapter 28 will design a target architecture.
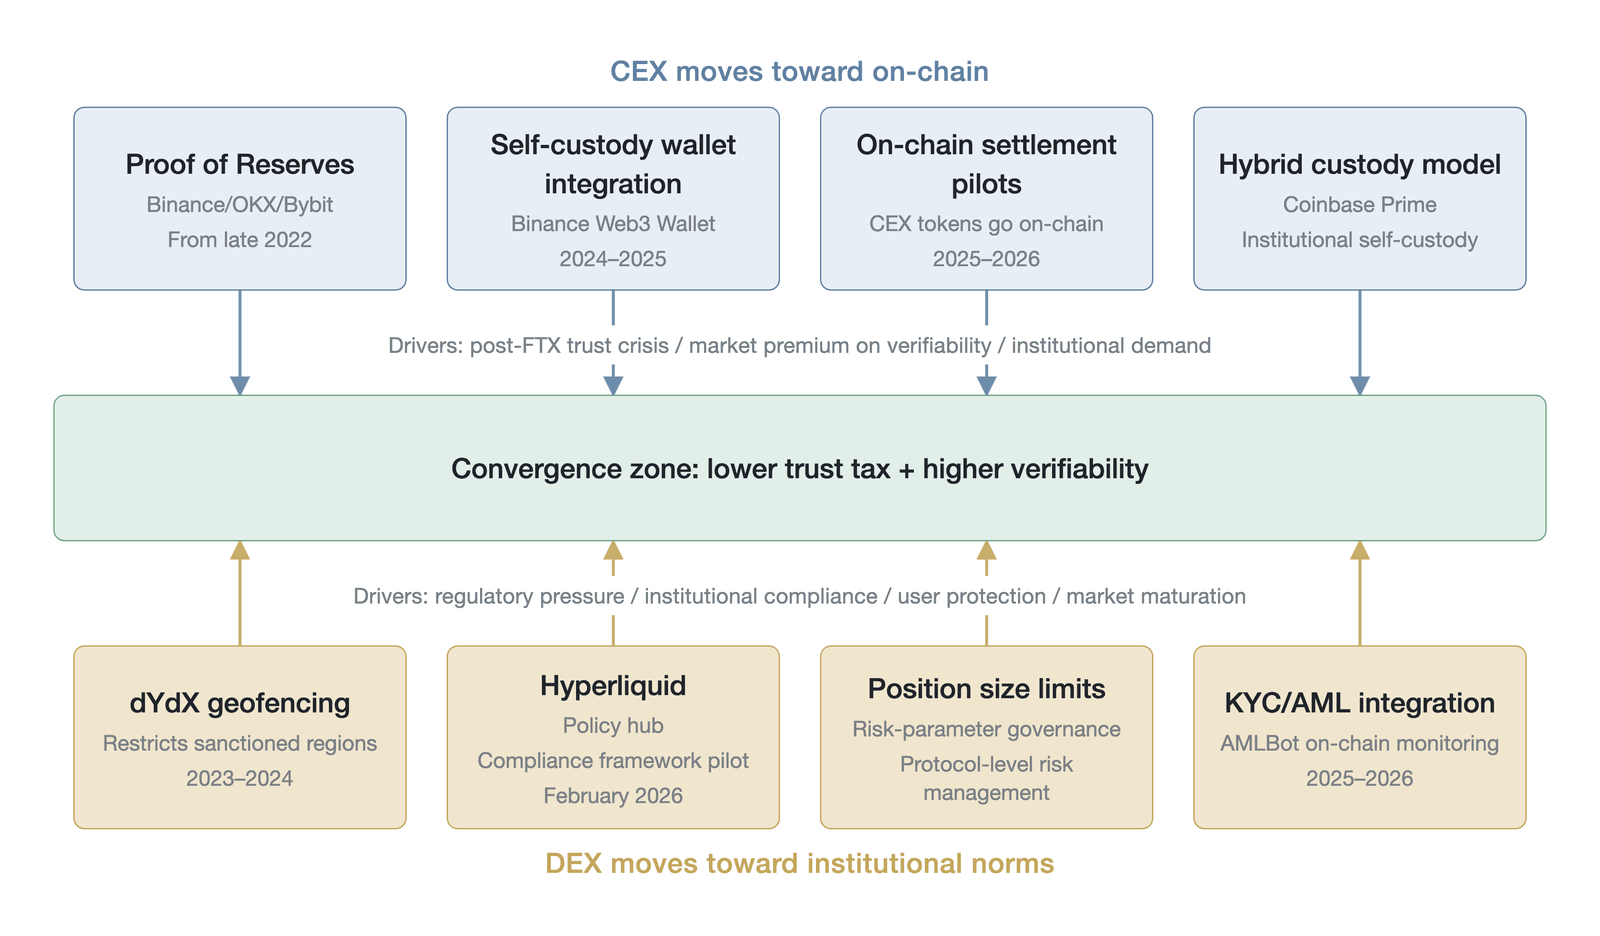
Figure 6-15. The two-way convergence trend of the CEX and DEX ecosystems (a conceptual convergence timeline, with event points through 2024 to 2026, not empirical data; Data source: Binance [43], AInvest [45], and dYdX Terms of Use [44])
Figure 6-15 presents the concrete paths of this two-way movement: the upper half shows the four paths by which CEXs move toward on-chain verifiability—through proof of reserves, self-custodial wallets, and the like—while the lower half shows the four paths by which DEXs move toward institutional compliance—through geo-fencing, policy centers, and the like—with the two sets of paths meeting in the middle ground of lower trust tax and higher verifiability. This convergence trend indicates that the next generation of market structure may no longer be a simple either-or choice between CEX and DEX but a layered hybrid architecture that chooses different trust paradigms at different functional layers.
6.6.3 Expanding the impossible triangle
In Section 5.1.3 of Chapter 5, we examined the impossible triangle that constrains the architectural design of an exchange: performance, transparency/verifiability, and decentralization. The traditional view holds that a system can choose only two of these three dimensions and must sacrifice the third. Technological progress, however, is attempting to expand the area of the triangle, so that dimensions that once had to be sacrificed can be achieved simultaneously at a higher level. Four frontier technologies are currently reshaping this boundary.
Zero-knowledge proofs are the most transformative of these technologies. ZK allows one party to prove to another the correctness of a computation without revealing its details. In the exchange context, this means fully verifiable matching and liquidation can be achieved while keeping trading strategies private and on-chain data costs extremely low. ZK essentially creates a new dimension on the transparency axis—verifiable but not transparent—breaking a combination that was impossible in the traditional triangle. Its scope of application is expanding from proof of reserves to verifiable off-chain computation and cross-chain communication, providing a mathematical-grade guarantee for enhancing privacy and interoperability. The zero-knowledge-proof (ZKP) market is projected to expand from $1.535 billion in 2025 to $7.586 billion in 2033, at a compound annual growth rate of 22.1% [46].
Intent-based trading represents a fundamental shift in the execution paradigm. Under this architecture, users no longer submit specific trading instructions but express high-level execution goals, and a network of professional solvers competitively finds the optimal execution path [47]. This paradigm shifts the complexity of execution from the user side to professional nodes and has already been validated in the automated market maker (AMM) spot-swap scenario through protocols such as UniswapX and CoW Protocol, effectively reducing slippage and the negative impact of MEV. The migration of the intent-based architecture to the perpetual futures scenario, however, faces additional complexity: perpetual futures involve state-dependent operations such as margin management, the position lifecycle, and funding-rate settlement, which are hard to reduce to stateless intent expressions. When handling the opening, adjustment, and closing of a leveraged position, a solver must assess margin adequacy and liquidation risk in real time, a complexity far exceeding the single-path optimization of a spot swap. Intent-based trading in the perpetual futures domain is therefore more likely to be applied first to peripheral links such as order routing and cross-platform optimal execution, rather than replacing the core order-book matching logic. In essence, this technology raises system efficiency on the performance axis through fine-grained division of labor, but its boundary of applicability in the derivatives scenario still awaits testing in practice.
Modular blockchains, by separating data availability, the consensus mechanism, and the execution layer into different specialized networks (such as Celestia or EigenDA), allow application-chain DEXs to outsource some core functions to specialized underlying infrastructure. This architecture enables a protocol to achieve performance far beyond that of a monolithic blockchain without sacrificing underlying security, raising the system's overall security on the decentralization axis through specialized division of labor.
The proliferation of account abstraction narrows the gap between on-chain and CEX at the user-experience level. With the integration of EIP-7702 in Ethereum's Pectra upgrade in May 2025, the adoption of smart-contract wallets accelerated markedly [48]. Account abstraction greatly lowers the threshold for on-chain interaction, allowing users to use features such as gasless transactions, social recovery, and batch operations. Without sacrificing the core principle of self-custody, it brings the on-chain experience remarkably close to that of a CEX, thereby narrowing the gap on the performance/convenience dimension.
Table 6-9 systematically summarizes the four technologies above along the impossible-triangle dimension they expand, their core mechanism, and their representative applications. It shows that the four technologies do not each exert force in isolation on a single dimension; rather, each pushes outward along a different axis of the impossible triangle, and their fusion in real projects is redefining the boundary of what is possible for market structure.
| Frontier technology | Dimension expanded | Core mechanism | Representative application |
|---|---|---|---|
| Zero-knowledge proofs | Transparency/verifiability | A new dimension of verifiable but not transparent | Lighter ZK-Rollup, proof of reserves |
| Intent-based trading | Performance | User-solver division of labor, reducing MEV | UniswapX, CoW Protocol |
| Modular blockchains | Decentralization | Separation and specialization of DA/consensus/execution | Celestia, EigenDA |
| Account abstraction | Performance/convenience | Smart-contract wallets, approaching the CEX experience | EIP-7702, Safe |
Table 6-9. The mechanisms by which four frontier technologies expand the dimensions of the impossible triangle (Data source: compiled by the author)
As Table 6-9 shows, the four technologies each push outward along a different axis of the impossible triangle: zero-knowledge proofs create the new possibility of verifiable but without exposing details on the transparency axis; intent-based trading and account abstraction raise execution efficiency and user experience along the performance axis; and modular blockchains strengthen underlying security along the decentralization axis through specialized division of labor. These technologies do not work in isolation but present a fusion trend in real projects, and Lighter's case is a representative practice of this fusion. Lighter's rise in 2025 is a representative case of these frontier technologies reshaping market structure. As an application-specific ZK-Rollup built on Ethereum, Lighter, with $1.3 trillion in annual volume, joined the ranks of the world's tenth-largest perpetual futures exchange in 2025 and completed a $68 million financing round at a $1.5 billion valuation in November 2025 [40][49]. This figure, however, warrants the same scrutiny applied to Hyperliquid's depth data in Section 6.4.3: as a zero-fee protocol, Lighter faces a major concern about volume inflated by wash trading and incentive-driven trading, and zero fees may attract large amounts of high-frequency noise trading rather than genuine price-discovery flow. The subsidy-driven versus market-structure-driven analytical framework advanced in Section 6.4.3 applies equally here: under a zero-fee model, whether volume can be sustained after a business-model transition (the introduction of fees) is a key test of its market-structure significance. Its core innovation lies in a custom proving engine that can generate execution proofs for hundreds of thousands of transactions in parallel and compress them, through multi-layer aggregation, into a single batch proof submitted to the Ethereum mainnet for verification, achieving an effective combination of high-speed off-chain order-book matching and mathematical-grade on-chain security. User assets are always custodied by an Ethereum smart contract, and an escape hatch mechanism guarantees that in extreme situations users can withdraw assets directly on Layer-1. The verification a ZK proof provides is retroactive: it confirms already-executed transactions rather than preventing sequencer misbehavior in real time; during proof generation and L1 confirmation, the system in fact operates under the same trust assumptions as a centralized sequencer. Although the escape hatch, through forced L1 withdrawal, provides an ultimate safety guarantee, in practice it may take hours to days to complete. In contrast to application chains that rely on their own small validator networks (such as Hyperliquid), Lighter anchors ultimate security to Ethereum's settlement layer, and its combination of zero fees, non-custody, and verifiable matching demonstrates how ZK technology can redefine the boundaries of a decentralized exchange.
These four technologies and the Lighter case together show that the impossible triangle is not fixed; its area can be expanded by technological progress, so that dimensions that once had to be sacrificed can be achieved simultaneously at a higher level. The triangle does not disappear, but its area grows—and that is the meaning of technological progress.
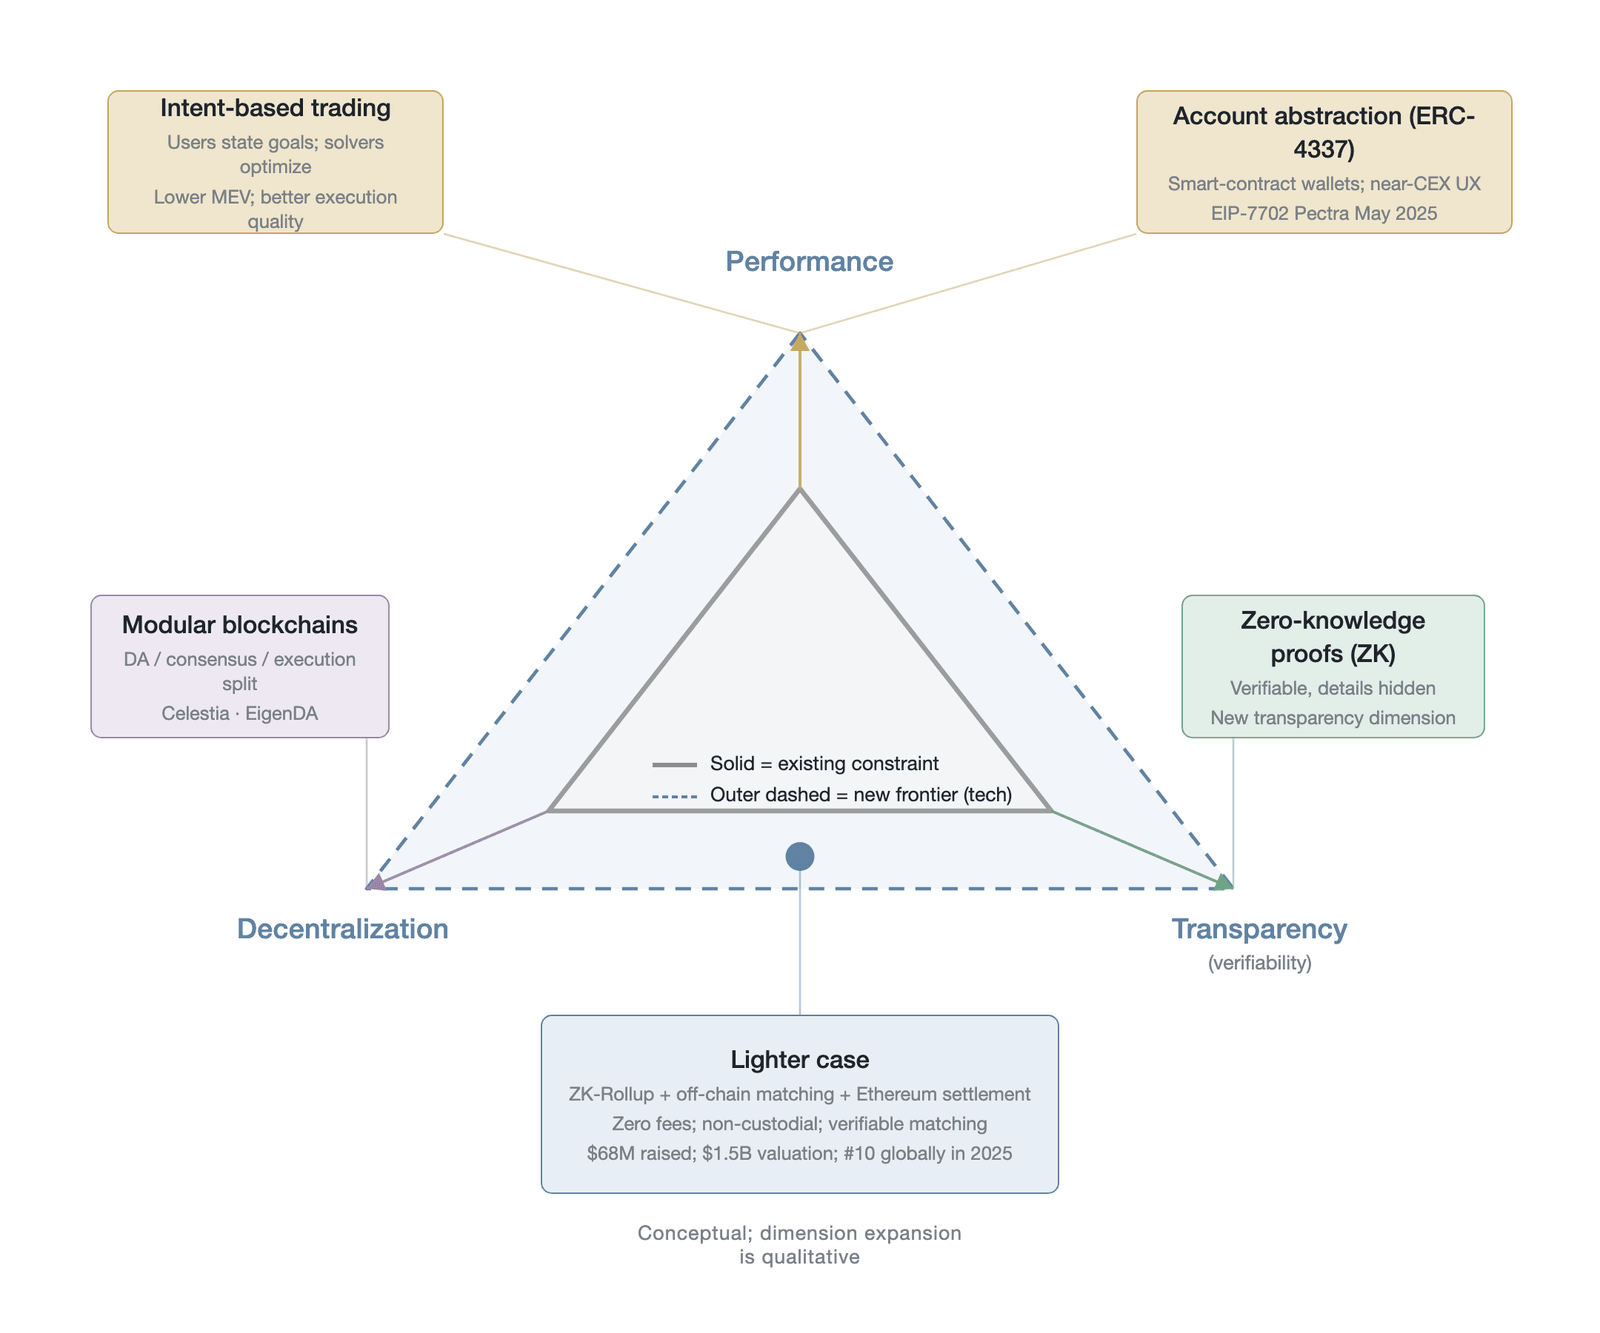
Figure 6-16. The mechanisms by which four frontier technologies expand the impossible triangle, with the Lighter case (a conceptual schematic, with dimension expansion represented qualitatively, not empirical data; Lighter's $68 million financing and $1.5 billion valuation [49] and its position as the world's tenth-largest perpetual futures exchange in 2025 [40][49] are both marked with sources; drawn by the author, based on Grand View Research [46], Paradigm [47], and CoinDesk [49])
Figure 6-16 integrates the analysis above into a unified visual framework: the inner triangle represents the existing constraints under current technical conditions, and the outer dashed triangle represents the new boundary that technological progress can push out; Lighter, as a fusion of ZK-Rollup, high-speed off-chain matching, and Ethereum settlement, is marked as the practical case closest to the outer boundary at present, validating the practical feasibility of technological fusion expanding the impossible triangle.
6.6.4 Open problems
Although technological progress keeps expanding the boundary of the possible, the evolution of the next generation of market structure still faces two fundamental unresolved problems, whose solutions will define the ultimate form of the perpetual futures market.
On the problem of the effectiveness boundary of decentralization, an application chain pursuing high performance inevitably must compromise on the scale of its validator network. Take Hyperliquid: although it achieved rapid growth in 2025 (users grew from 300,000 to 1.4 million, and annual volume reached $2.9 trillion), its number of validators remained at just 16 to 24 for a long time [50][51]. By early 2026, the number of validators had increased to 24; compared with Ethereum's hundreds of thousands of validating nodes, this is still a highly concentrated consensus network [9]. This concentration has raised persistent community concern about censorship resistance and the potential risk of collusion.
Decentralization is not a black-and-white binary state but a continuous variable. This raises a profound question of governance philosophy: How much decentralization is enough? The answer often depends on the specific application scenario and the user's risk preference. There is a fundamental physical tension between the scale of the validator network and system performance: more validators mean higher security and censorship resistance but inevitably lead to increased consensus latency, while fewer validators can provide a CEX-comparable sub-second experience but introduce a stronger trust assumption. How to find that dynamic effectiveness boundary between performance and decentralization is a challenge every application chain must confront over the long term. The regulatory dimension of this problem is explored further in Chapter 26.
Parallel to the decentralization-boundary problem, the second problem is the trilemma of tension among transparency, leverage, and security, which is the ultimate extension, at the market-structure level, of the transparency-fragility paradox examined in Section 4.4.3 of Chapter 4. In on-chain perpetual futures markets, a fully transparent order book, leverage ratios as high as 50x to 100x, and algorithmic high-frequency execution together constitute an extremely fragile complex system. Application chains have mitigated traditional atomic MEV through protocol design, but the fully transparent liquidation price instead gives rise to strategic MEV, a deeper form of attack, as analyzed in detail in Section 6.3.
The three strategic attacks that occurred consecutively on Hyperliquid from March to November 2025—the whale's self-liquidation after building a roughly $300 million ETH long position at 50x leverage, the JELLY token attack, and the November cross-market price manipulation—provide the most vivid footnote to this tension (the loss magnitudes and mechanisms of the three incidents are detailed in Section 6.3.2).
These events lay bare the trilemma of tension among transparency, high leverage, and system security. Under the combination of transparency plus high leverage, the liquidation levels and liquidity depth of all participants are fully visible to attackers, making precise sniping possible and giving rise to strategic liquidation attacks. Under the combination of high leverage plus security, the system must possess extremely strong anti-manipulation capability and a deep insurance fund; otherwise, shortfall risk will inevitably be socialized, transferred through auto-deleveraging or vault losses onto innocent liquidity providers. And the more fundamental question is whether 50x to 100x leverage matches the actual loss-absorption capacity of an on-chain protocol. The maximum leverage of traditional futures markets (such as CME and Eurex) is constrained by clearinghouse margin requirements based on decades of volatility data, backed by a mutualized default fund and an explicit central-counterparty guarantee. That on-chain perpetual futures protocols offer equal or even higher leverage in the absence of comparable loss-absorption capacity (both the size of the insurance fund and the depth of the HLP vault being far smaller than a traditional CCP's default fund) makes the reasonableness of their risk pricing questionable. Under the combination of transparency plus security, the most counterintuitive insight emerges: in a high-leverage financial game, full transparency may not be net positive. To protect system security, some form of selective opacity (for example, using ZK technology to achieve verifiable but without exposing the liquidation threshold) may be safer than unprotected full transparency. Traditional finance already has mature precedents for such calibrated transparency: when the TRACE (Trade Reporting and Compliance Engine) system in the U.S. corporate bond market introduced post-trade transparency, it imposed delayed reporting on large trades to protect institutional investors (Bessembinder, Maxwell, and Venkataraman, 2006 [52]); the EU's MiFID II framework likewise provides transparency waivers for large trades. These experiences show that selective opacity is not a new invention of the crypto market but a well-tested institutional arrangement in financial-market design.
This insight connects the strategic-MEV analysis of Section 6.3, the ZK-technology discussion of Section 6.6.3, and the embedded-compliance design of Chapter 30 into a complete logical chain. Defending against strategic MEV cannot rely solely on increasing matching speed (this is the mental inertia of latency competition) but must involve a fundamental restructuring at the mechanism-design level, which also lays the theoretical foundation for the book's later discussions of the liquidation mechanism (Chapter 11), insurance-fund governance (Chapter 12), and strategic-MEV-immune clearing and settlement architecture design (Chapter 29).
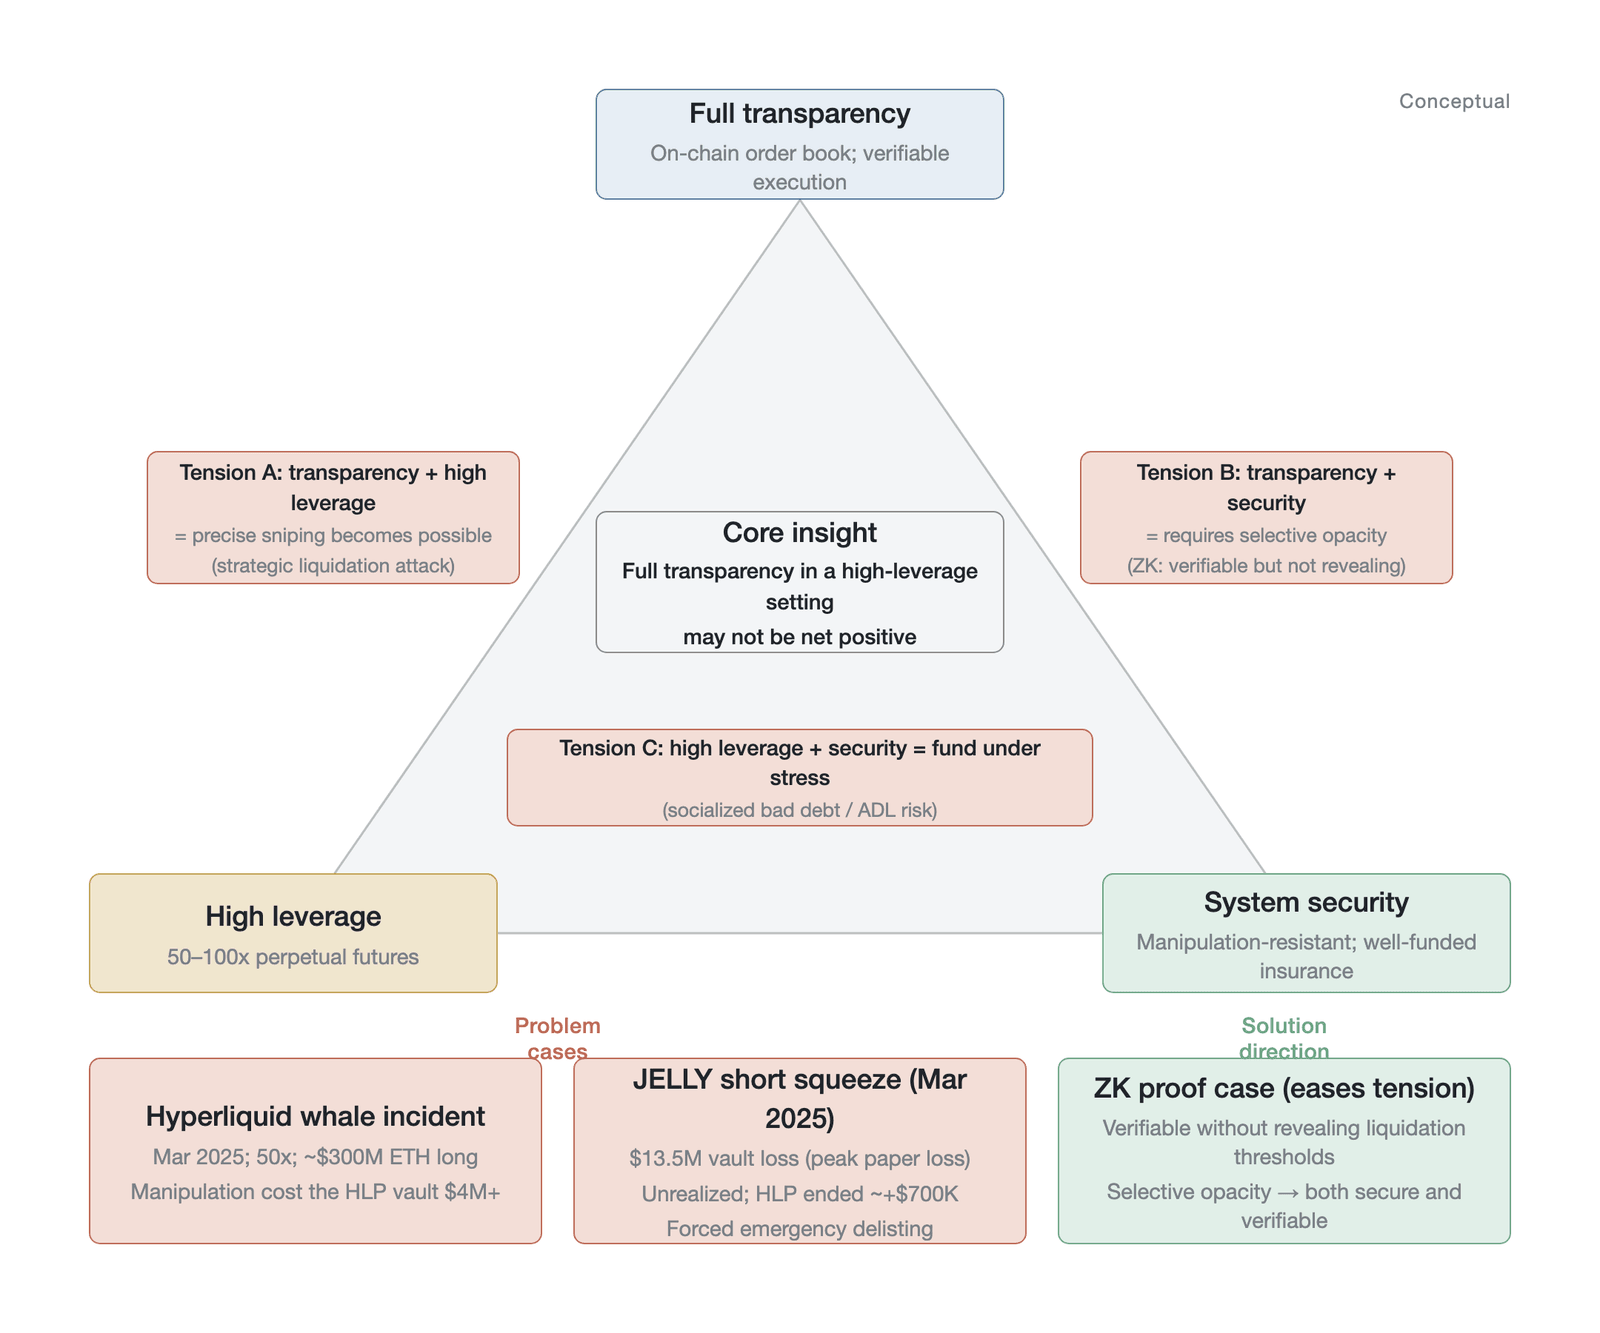
Figure 6-17. The inherent tension among transparency, high leverage, and system security (a conceptual-triangle schematic, with vertex positions representing qualitative tension relationships, not empirical coordinates; the roughly $13.5 million for JELLY is a peak unrealized loss, not a realized loss, with the HLP vault ultimately recording a small profit of about $700,000 [37]; the whale roughly $300 million, HLP roughly $4 million [20], and 50x to 100x leverage are all non-empirical data; Data source: Halborn [25], CoinDesk [37], and Arkham Intelligence [20])
Figure 6-17 visualizes this trilemma of tension as a triangular structure, whose three edges correspond to three sets of constraint relationships: the combination of transparency and high leverage gives rise to precise liquidation sniping (edge A), the combination of high leverage and security requires a deep insurance-fund reserve (edge C), and the combination of transparency and security points to the counterintuitive conclusion that in a high-leverage environment selective opacity may be preferable to full transparency (edge B). The bottom of the figure contrasts the three real 2025 attack cases with the technical logic of ZK proofs as a potential solution path, connecting the problem diagnosis and the engineering solution into a complete logical chain.
6.7 Chapter summary
This chapter concludes Part II, The Ecosystem: The Trading Ecosystem of Perpetual Futures. Chapter 4 mapped six classes of participants and advanced the transparency-fragility paradox; Chapter 5, through a static dissection of the three architectures, advanced the risk substitution theorem; and this chapter pushes the perspective toward dynamic evolution, answering the question of how different structures compete and converge. The chapter established four core theoretical contributions. The competition-mode migration thesis argues that the evolution of market structure is not a simple case of decentralization replacing centralization but a paradigm shift in the focus of competition—from the latency competition of CEXs, to the information competition of general-purpose public-chain DEXs, to the mechanism competition of application-chain DEXs—with each migration driven by the diminishing economic returns of the previous mode. The definition of strategic MEV elevates MEV from within-block technical arbitrage to a cross-cycle, cross-market economic game, pointing out that its defense can rely only on mechanism redesign, not a speed race. The price-discovery migration hypothesis holds that three structural drivers—the trust premium of verifiable liquidity, the efficiency gains of protocol-level market making, and the on-chain migration of institutions—are shifting pricing power toward application-chain DEXs, and that once the liquidity network effect crosses a critical mass, this migration may become irreversible. The risk visibility-manageability proposition holds that, from CEXs to on-chain venues, risk shifts from invisible but occasionally catastrophically explosive to continuously visible but manageable, with visibility a necessary precondition for risk management.
After completing this macro analysis of the competition among the three architectures, one key question remains unresolved: How does a macro structural advantage translate into micro trade execution? How do orders express traders' intent, how does the order book aggregate information and form prices, and how do differences in matching rules affect market liquidity? Part III—beginning with the anatomy of the order (Chapter 7), the microdynamics of the order book (Chapter 8), and Hyperliquid's architectural innovations (Chapter 9)—establishes the micro foundations for the subsequent quantitative analysis of price discovery, arbitrage, and liquidity.
References
[1] Reuters. (2022, November 11). FTX collapse: How the crypto exchange lost billions. Reuters. https://www.reuters.com/technology/ftx-crypto/
[2] European Securities and Markets Authority. (2025). "Maximal Extractable Value Implications for crypto markets." https://www.esma.europa.eu/sites/default/files/2025-07/ESMA50-481369926-29744_Maximal_Extractable_Value_Implications_for_crypto_markets.pdf
[3] CoinGecko. (2026). "2025 Annual Crypto Industry Report." https://www.coingecko.com/research/publications/2025-annual-crypto-report
[4] CoinGecko Research. (2025). "DEX to CEX Volume Ratios Reach New Highs in 2025." https://www.coingecko.com/research/publications/dex-to-cex-ratio
[5] Coinage Media. (2026). "How Hyperliquid Is Looking to Maintain Its Lead Among Perp DEXes." https://www.coinage.media/2026/how-hyperliquid-is-looking-to-maintain-its-lead-among-perp-dexes
[6] Harris, L. (2003). Trading and exchanges: Market microstructure for practitioners. Oxford University Press.
[7] Crawley, J. (2025, February 21). Bybit suffers \$1.5 billion security breach in largest crypto hack. CoinDesk. https://www.coindesk.com/business/2025/02/21/bybit-suffers-1-5-billion-security-breach/
[8] DeFiLlama & Rekt. (2025). Cross-chain bridge exploits leaderboard [Database]. DeFiLlama (https://defillama.com/hacks) and Rekt News (https://rekt.news/leaderboard/). Data as of 2025; the statistical basis varies with how cross-chain bridges are defined and how incidents are classified.
[9] Eco.com. (2026). What is Hyperliquid? The High-Performance DEX Explained. https://eco.com/support/en/articles/11972709-what-is-hyperliquid-the-high-performance-dex-explained
[10] Chen, E., Ma, Y., & Nie, Z. (2024). Perpetual future contracts in centralized and decentralized exchanges: Mechanism and traders' behavior. Electronic Markets, 34(1). https://doi.org/10.1007/s12525-024-00715-1
[11] Glosten, L. R., & Milgrom, P. R. (1985). Bid, ask and transaction prices in a specialist market with heterogeneously informed traders. Journal of Financial Economics, 14(1), 71–100. https://doi.org/10.1016/0304-405X(85)90044-3
[12] Kyle, A. S. (1985). Continuous auctions and insider trading. Econometrica, 53(6), 1315–1335. https://doi.org/10.2307/1913210
[13] Budish, E., Cramton, P., & Shim, J. (2015). The high-frequency trading arms race: Frequent batch auctions as a market design response. The Quarterly Journal of Economics, 130(4), 1547–1621. https://doi.org/10.1093/qje/qjv027
[14] Aquilina, M., Budish, E., & O'Neill, P. (2022). Quantifying the high-frequency trading arms race. The Quarterly Journal of Economics, 137(1), 493–564. https://doi.org/10.3386/w29011
[15] Amazon Web Services. (2025). Optimize tick-to-trade latency for digital assets exchanges and trading platforms on AWS.
[16] O'Hara, M. (2015). High frequency market microstructure. Journal of Financial Economics, 116(2), 257–270. https://doi.org/10.1016/j.jfineco.2015.01.003
[17] Foucault, T., Kadan, O., & Kandel, E. (2013). Liquidity cycles and make/take fees in electronic markets. The Journal of Finance, 68(1), 299–341. https://doi.org/10.1111/j.1540-6261.2012.01801.x
[18] CryptoSlate. (2026). Crypto privacy has turned into an economic crisis as MEV bots burn over 50% of gas fees. (Citing EigenPhi data for Dec 2025 - Jan 2026).
[19] Mancino, D., & Rezzoli, D. (2025). Sandwiched and silent: Behavioral adaptation and private channel exploitation in Ethereum MEV. arXiv preprint arXiv:2512.17602.
[20] Arkham Intelligence. (2025, March 12). Hyperliquid Whale Passes \$4M Loss to HLP Vault.
[21] Lo, A. W. (2004). The adaptive markets hypothesis: Market efficiency from an evolutionary perspective. The Journal of Portfolio Management, 30(5), 15–29. https://doi.org/10.3905/jpm.2004.442611
[22] Daian, P., Goldfeder, S., Kell, T., Li, Y., Zhao, Y., Bentov, I., Breidenbach, L., & Juels, A. (2020). Flash boys 2.0: Frontrunning in decentralized exchanges, miner extractable value, and consensus instability. 2020 IEEE Symposium on Security and Privacy (SP), 910–927. https://doi.org/10.1109/sp40000.2020.00040
[23] Gramlich, V., Guggenberger, T., Principato, M., Schellinger, B., & Urbach, N. (2024). A systematic literature review of maximal extractable value. Electronic Markets, 34, 58.
[24] Talos. (2025). \$JELLY's Last Jam: Adventures in Hyperliquid Margin Risk Management. Talos Insights.
[25] Halborn. (2025). Explained: The Hyperliquid Hack (November 2025). https://www.halborn.com/blog/post/explained-the-hyperliquid-hack-november-2025
[26] Obadia, A., Salles, A., Sanber, L., Tribble, T., Rao, V., & Juels, A. (2021). Unity is strength: A formalization of cross-domain maximal extractable value. arXiv preprint arXiv:2112.01472. https://doi.org/10.48550/arXiv.2112.01472
[27] Capponi, A., Jia, R., & Wang, Y. (2024). The ordering of blockchain transactions and its impact on market quality. Management Science.
[28] Michaels, D., & Osipovich, A. (2023, October 5). Here's how FTX executives secretly spent \$8 billion in customer money. The Wall Street Journal. https://www.wsj.com/finance/currencies/ftx-customer-money-spending-39439e3c
[29] Hyperliquid Team. (2026). "Order Book Depth Comparison: Hyperliquid vs. Centralized Exchanges." Public data release, January 2026.
[30] Hayward, A. (2022, August 16). Jump Crypto plans new Solana validator client to boost performance, decentralization. Decrypt. https://decrypt.co/107521/jump-crypto-plans-solana-validator-client-boost-performance-decentralization
[31] Zhivkov, P. (2026). The two-tiered structure of cryptocurrency funding rate markets. Mathematics, 14(2), 346. https://doi.org/10.3390/math14020346
[32] Monarq Asset Management. (2026). "Perp DEXs in 2025: The Shift From Subsidies to Market Structure." Medium. https://medium.com/@Monarq_Mgmt/perp-dexs-in-2025-the-shift-from-subsidies-to-market-structure-68a1138f4c10
[33] Hasbrouck, J. (1995). One security, many markets: Determining the contributions to price discovery. The Journal of Finance, 50(4), 1175–1199. https://doi.org/10.1111/j.1540-6261.1995.tb04054.x
[34] Taleb, N. N. (2007). The Black Swan: The Impact of the Highly Improbable. Random House.
[35] CNBC. (2025). "Hackers Steal \$1.5 Billion from Exchange Bybit in Biggest-Ever Crypto Heist." CNBC, February 2025.
[36] BlockEden. (2025). "The JELLY Exploit Exposed Hyperliquid's Centralization." https://blockeden.xyz/forum/t/the-jelly-exploit-exposed-hyperliquids-centralization/406
[37] CoinDesk. (2025). HyperLiquid Delists JELLY After Vault Squeezed in \$13M Tussle. https://www.coindesk.com/markets/2025/03/26/hyperliquid-delists-jellyjelly-after-vault-squeezed-in-usd13m-tussle
[38] Brunnermeier, M. K., & Pedersen, L. H. (2009). Market liquidity and funding liquidity. Review of Financial Studies, 22(6), 2201–2238. https://doi.org/10.1093/rfs/hhn014
[39] FTI Consulting. (2025). "Crypto Crash Oct 2025: Leverage Meets Liquidity." https://www.fticonsulting.com/insights/articles/crypto-crash-october-2025-leverage-met-liquidity
[40] CoinGecko. (2026). Is the Future of Crypto Perpetual? The Meteoric Rise of Perp DEXs. CoinGecko Learn. https://www.coingecko.com/learn/rise-of-perpetuals-and-perp-dexs
[41] Grayscale Research. (2025). DEX Appeal: The Rise of Decentralized Exchanges. https://research.grayscale.com/reports/dex-appeal-the-rise-of-decentralized-exchanges
[42] Vidal-Tomas, D. (2025). Centralized Crypto Exchanges and Proof-of-Solvency. Working Paper.
[43] Binance. (2025). Everything You Need to Know About Our Self-Custody Web3 Wallet. Binance Blog.
[44] dYdX. (2025). Terms of Use & Geo Restrictions. dYdX Help Center.
[45] AInvest. (2026). Hyperliquid's Strategic Expansion in Perpetual Futures Trading. https://www.ainvest.com/news/hyperliquid-strategic-expansion-perpetual-futures-trading-assessing-leverage-token-utility-market-capture-2026-2601/
[46] Grand View Research. (2025). Zero Knowledge Proof Market Size, Share & Trends Analysis Report, 2025-2033.
[47] Paradigm. (2023). Intent-Based Architectures and Their Risks. Paradigm Research.
[48] Alchemy. (2025). What is ERC-4337? The Complete Guide to Account Abstraction.
[49] CoinDesk. (2025). Lighter Raises \$68M at \$1.5B Valuation. https://www.coindesk.com/business/2025/11/04/lighter-raises-68m-at-1-5b-valuation/
[50] The Block. (2025). Hyperliquid responds to community concerns over validator issues. https://www.theblock.co/post/333559/hyperliquid-responds-to-community-concerns-over-validator-issues
[51] Ian Unsworth. (2025). Hyperliquid validator set expansion from 21 to 24. X/Twitter.
[52] Bessembinder, H., Maxwell, W., & Venkataraman, K. (2006). Market transparency, liquidity externalities, and institutional trading costs in corporate bonds. Journal of Financial Economics, 82(2), 251–288. https://doi.org/10.1016/j.jfineco.2005.10.002
[53] CoinDesk. (2023, June 26). FTX bankruptcy team says the exchange owed customers \$8.7B. CoinDesk. https://www.coindesk.com/policy/2023/06/26/ftx-bankruptcy-team-says-the-exchange-owed-customers-87b
[54] Kobayashi, N. (Mt. Gox Civil Rehabilitation Trustee). Announcements regarding the rehabilitation proceedings of MtGox Co., Ltd. Mt. Gox. https://www.mtgox.com/