On October 10, 2025, the cryptocurrency market experienced a flash crash of unprecedented scale. Every extreme market event unfolds along a three-stage chain of preconditions, triggers, and amplification mechanisms: a contraction in global risk appetite and a turn in the monetary policy cycle constituted the preconditions for systemic fragility; specific selling pressure served as the trigger; and defects in the market microstructure supplied the amplification mechanism. According to post-mortem reports from FTI Consulting and Amberdata, more than $9.89 billion in leveraged positions was forcibly liquidated within just 14 hours. This forced-liquidation volume represented roughly 6% to 7% of the total open interest in perpetual futures across the market at the time (approximately $9.89 billion against roughly $146.7 billion in open interest) and exceeded the roughly $8.6 billion liquidated during the May 2021 crash, with about 70% of the damage concentrated within 40 minutes [1] (a clarification is warranted: the $9.89 billion figure refers to the core window of roughly 14 hours under the perpetual-futures forced-liquidation measure; if one measures the evaporation of market-wide leverage and open interest, and includes voluntary position closures and position transfers, the entire deleveraging round reached roughly $19 billion over about a day. The two figures differ because of differences in statistical measure and time window [2]). Yet the fundamental reason this crisis escalated from a routine price correction into a systemic collapse lay not in any single price shock but in the underlying architecture of the market microstructure. Comparing three snapshots of this perpetual futures order book (such as BTC-USDT) — 24 hours before the crisis, at the moment it erupted, and 24 hours afterward — systematically reveals the evolution of the liquidity illusion and of systemic fragility.
Comparing three snapshots of the BTC-USDT perpetual futures order book before and after the crisis makes this process clearly observable. In the 24 hours before the crisis, the order book displayed a textbook equilibrium: depth on both the bid and ask sides was ample and approximately symmetric, the best bid-ask spread was as low as 0.02 basis points, and visible liquidity (defined as the cumulative two-sided resting depth within ±2% of the best bid and ask) reached as high as $103.6 million [1]. Even so, bid-side depth already showed a pronounced "depth cliff" near the dense liquidation zone below the prevailing price, as market makers, foreseeing that this region would generate a toxic flow of liquidation orders, had withdrawn in advance. At 20:50 UTC on October 10, after sustained selling pressure had driven the price to the liquidation threshold, the order book underwent a violent structural change within minutes. At the peak moment of 21:15 UTC, $3.21 billion in positions was forcibly liquidated within 60 seconds (93.5% of it forced selling), visible depth shrank from $103.6 million to just $170,000 (a decline of about 99.8%), and the spread widened from 0.02 basis points to 26.43 basis points (both figures are instantaneous snapshot values rather than time-weighted averages, and the 26.43 basis points was the peak spread recorded at 21:15 UTC) — a widening of roughly 1,321-fold. The market sell orders generated by the liquidation engine and the collective retreat of market makers formed a positive feedback loop of "price decline → liquidations triggered → depth consumed → further price decline" [1]. The post-crisis recovery, by contrast, exhibited pronounced asymmetry: the collapse took less than two hours, whereas restoring liquidity required weeks. A CoinDesk report one month after the crisis showed that order book depth remained far below early-October levels and that market makers had undergone a structural retreat [3].
These three snapshots crystallize the central question of this chapter. Chapter 7 analyzed the single order — the basic vocabulary of the language of trading. The object of this chapter is the order book: the dynamically evolving market microstructure formed by the continuous interaction of millions of orders. The order book does more than perform matching; it is a continuously operating information-aggregation device. The high leverage, liquidation mechanisms, funding rates, and around-the-clock trading environment of perpetual futures leave a distinctive set of "four fingerprints" on the order book. When executing a large perpetual futures long position, the choice between a centralized exchange's continuous matching system and an application-chain-based batch-auction mechanism directly determines whether the microstructure can offer genuine protection under extreme market conditions. Analyzing the structure of the order book is the foundation for understanding this choice.
The chapter proceeds as follows. It first defines the order book as an information machine and proposes a joint diagnostic framework of five signal channels, then traces the dual causes of the depth illusion and the methods for quantifying it. A survey of the five institutional mechanisms unique to perpetual futures shows how each reshapes order book behavior. Turning to topology, the analysis distills a morphological classification of the order book and its mapping to market states, and on that basis proposes the "four fingerprints" framework, which translates those institutional mechanisms into observable, quantifiable diagnostic tools. Introducing the time dimension, it then examines the structural disadvantage in order book resilience. The discussion moves next to the infrastructure layer, tracing the evolution of matching-engine architecture and the institutional innovation of matching mechanisms, and closes by contrasting the information ecosystems of on-chain and off-chain order books.
8.1 The order book as an information machine
Traditional finance textbooks typically define the function of the order book simply as "matching buyers and sellers." This is correct but incomplete. Matching is only the mechanical function of the order book; its deeper and more essential function is information aggregation.
In his classic work Empirical Market Microstructure, Joel Hasbrouck notes that the order book is the most fundamental institutional arrangement in market microstructure and that its design directly determines the efficiency of price discovery, the quality of liquidity, and the fairness of trading [4]. The order book is an information machine: through continuous price competition, it transforms the private information, expectations, and risk preferences dispersed across many participants into a set of publicly observable state variables. These variables carry rich signals about the current state of the market and its near-term future.
In perpetual futures markets, this information aggregation is pushed to an extreme. Because these contracts have no expiry date and are anchored to the spot price through the funding rate, the order book becomes the central arena in which longs and shorts engage in high-frequency competition over the funding rate, liquidation risk, and macroeconomic expectations. Every order submitted, modified, or canceled broadcasts information: a market maker's cancellation may hint that liquidity is about to dry up, while an abnormal buildup of depth on one side may signal that an institution is establishing a large one-directional position. Treating the order book as an information machine is precisely the analytical starting point for understanding perpetual futures microstructure.
8.1.1 The structure and rules of the CLOB
The central limit order book (CLOB) is the core infrastructure of modern electronic trading markets. Whether in traditional stock exchanges or in emerging cryptocurrency derivatives platforms, the CLOB holds a dominant position. Understanding how this information machine operates requires first dissecting its physical structure.
Structurally, the order book consists of two sides: the bid side and the ask side. Each side is strictly sorted by price: bid orders are arranged from high price to low, and ask orders from low price to high. This ordering reflects the core objectives of market participants: buyers wish to buy at the lowest possible price, while sellers wish to sell at the highest possible price.
The gap between the best bid and the best ask is called the bid-ask spread. The spread is the price of liquidity — the minimum cost a trader must pay to obtain immediate execution. In markets with ample liquidity, the spread is typically very narrow, whereas when liquidity dries up or the market becomes highly volatile, it widens rapidly. The size of the spread reflects not only the current state of liquidity but also market makers' expectations of near-term volatility and their risk premium.
The quantity of resting orders accumulated at each price level constitutes the depth at that level. Depth reflects the market's capacity to absorb the impact of large orders without a dramatic price move. As Larry Harris defines it in Trading and Exchanges, the order book is "a dynamic electronic record of all unexecuted limit orders submitted by market participants, displaying the state of market liquidity in real time" [5]. Depth is not merely a static indicator; it also evolves dynamically as participants' expectations change. The distribution of depth is often nonuniform, typically densest near the best bid and ask and thinning progressively as prices move away from the best quotes.
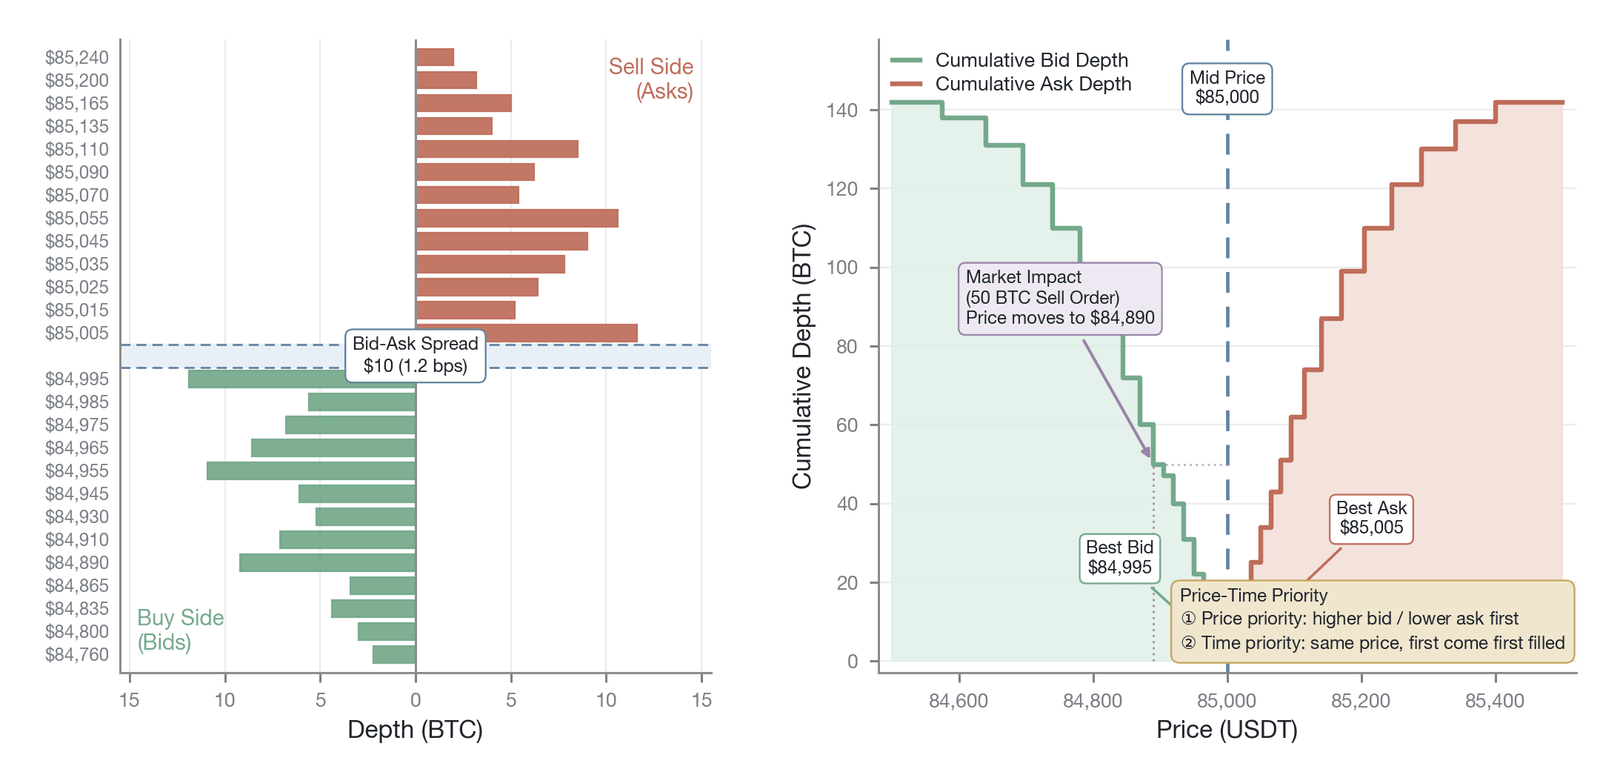
Figure 8-1. Basic structure of the central limit order book and the market impact effect (conceptual structural illustration: the $85,000 mid price, the $10 spread of about 1.2 basis points, and the impact of a 50 BTC sell order down to $84,890 are all illustrative synthetic values, not empirical data; the central limit order book and the price-time priority rule follow Harris 2003 [5])
Order book depth follows an inverted-cone, nonuniform distribution — thick in the middle and thin at both ends. The key insight lies in the cumulative depth curve in the right panel: when order size is small, the slope of the curve is gentle and price impact is limited, but once size exceeds the capacity of the near-touch liquidity, the curve turns sharply upward, and the price slippage induced by each additional unit of size is significantly amplified. This nonlinearity is precisely the microstructural basis for understanding the execution cost of large trades and extreme market events.
With respect to matching priority rules, the vast majority of CLOBs follow the principle of price-time priority, which is key to understanding the microdynamics of the order book. Price priority means that a higher bid receives higher priority among buyers, and a lower ask receives higher priority among sellers. This principle ensures that the market always matches in the direction most favorable to traders. It is the cornerstone of the price discovery mechanism, encouraging participants to offer more competitive quotes and thereby narrowing spreads and improving market efficiency. When prices are equal, time priority applies: the order that reaches the system first receives priority for execution, which is intended to ensure fairness of processing. In the modern high-speed electronic environment, however, time priority has spawned intense speed races and latency arbitrage. High-frequency trading firms invest heavily in optimizing network connectivity and the response speed of matching engines, all to arrive at a given price level a few microseconds ahead of their competitors. This is explored in depth in the later section on the evolution of matching engines. In perpetual futures markets, the widespread use of APIs further intensifies this time-based competition.
With the priority rules in place, consider how a market order consumes the book level by level. When a newly arriving market buy order enters the system, it consumes resting orders starting from the lowest ask, level by level. If the size of the market order exceeds the available depth at the first level, it continues to consume the resting orders at the second level, the third level, and so on, until the order is fully filled or the order book depth is exhausted. The price movement produced by this process is called market impact.
The magnitude of market impact depends on the ratio of order size to available depth. Kyle's (1985) seminal model predicts a linear price impact function, , in which the parameter λ characterizes market depth (depth equals 1/λ; that is, the larger λ is, the shallower and less deep the market, the two being inversely related), so that an order of any size bears a price impact proportional to its size [6]. Subsequent empirical research, however, has systematically revealed the limitations of this linear prediction. Almgren and Chriss (2001) introduced a nonlinear impact function within an optimal-execution framework [7], and Bouchaud, Farmer, and Lillo (2009), analyzing large-scale empirical data, found that the price impact of large orders exhibits pronounced concavity — the so-called square-root law, whereby the magnitude of impact is proportional to the square root of order size rather than to size itself [8]. This implies that although the actual impact of small orders roughly matches the linear prediction of the Kyle model, the impact of large orders grows more slowly as size increases, even as its absolute level still far exceeds a linear extrapolation. In perpetual futures markets, this nonlinear impact effect is especially pronounced. Because of the high leverage present, the impact of a large market order not only consumes liquidity but may also trigger other participants' stop-loss orders or forced liquidations, setting off a chain reaction. This nonlinear price jump induced by liquidity consumption is central to understanding the microstructural mechanics of extreme market events such as flash crashes.
8.1.2 The five signal channels of the order book
If the order book is viewed as an information machine, its various observable parameters constitute the analytical dimensions for extracting market signals. Traditional microstructure analysis often studies the spread or depth in isolation. This chapter systematizes these dimensions into a joint diagnostic framework of five core signal channels (Table 8-1). These five channels do not exist in isolation; together they depict a multidimensional picture of the market.
| Signal channel | Observable variables | Core information conveyed | Correspondence with Chapter 7 |
|---|---|---|---|
| Spread channel | Absolute and relative values of the bid-ask spread | The market's immediate transaction cost; market makers' pricing of adverse-selection risk; a real-time indicator of market "tension." | Corresponds to Section 7.2.4 (the maker-taker game and the economics of the spread). The spread is not only a transaction cost but also compensation to market makers for the risk of information asymmetry. |
| Depth channel | Resting order quantity at each price level and the cumulative depth curve | The market's capacity to absorb impact without a significant price move; the thickness of liquidity. An imbalance in depth between the bid and ask sides (order imbalance) is one of the strong predictors of short-term price movement [9]. | Corresponds to Section 7.2.2 (limit orders as the supply of liquidity). The thickness of depth directly determines the market's capacity to withstand impact. |
| Slope channel | The rate at which depth decays with distance from the mid price | Participants' "confidence distribution" regarding price deviations from the current level; the steeper the slope, the more concentrated liquidity is at the current price. | Reflects the market's expectations of extreme price movements. A steep slope means the market regards a large price deviation as highly improbable. |
| Flow channel | The number of trades and the trading volume per unit of time | The market's "activity" and "urgency"; a high trade rate means the market is reacting intensely to new information. | Corresponds to Section 7.6 (the order-flow information ecosystem). Flow is the most direct manifestation of information entering the market. |
| Dynamics channel | The update frequency and cancellation rate of quotes | Market makers' "tension"; a rising cancellation rate is an early-warning signal that market makers' confidence is declining and that they are preparing to retreat. | Corresponds to Section 7.1.2 (the signal-strength spectrum). A high cancellation rate often foreshadows an imminent sharp market move. |
Table 8-1. The five-signal-channel matrix of the order book as an information machine (Data source: constructed by the author)
These five signal channels are not mutually independent; they exhibit significant cross-correlations. For example, a rise in the quote cancellation rate in the dynamics channel often precedes a widening of the bid-ask spread in the spread channel, while a one-sided contraction of liquidity in the depth channel typically accompanies an intensifying asymmetry in the rate of depth decay in the slope channel. Consequently, jointly monitoring the five channels — for instance, observing an abnormal climb in the cancellation rate even as the spread remains superficially stable — provides far greater diagnostic value than observing any single channel in isolation. This cross-channel joint-analysis framework is precisely the key methodological foundation that elevates the order book from a simple record of quotes into a systemic risk-warning tool.
Figure 8-2 provides a visual mapping of the core observable variables of the five signal channels and their analytical dimensions, showing how they capture market microstructure information from different angles and converge into a comprehensive assessment of the market's overall state, thereby transcending isolated reliance on any single indicator.
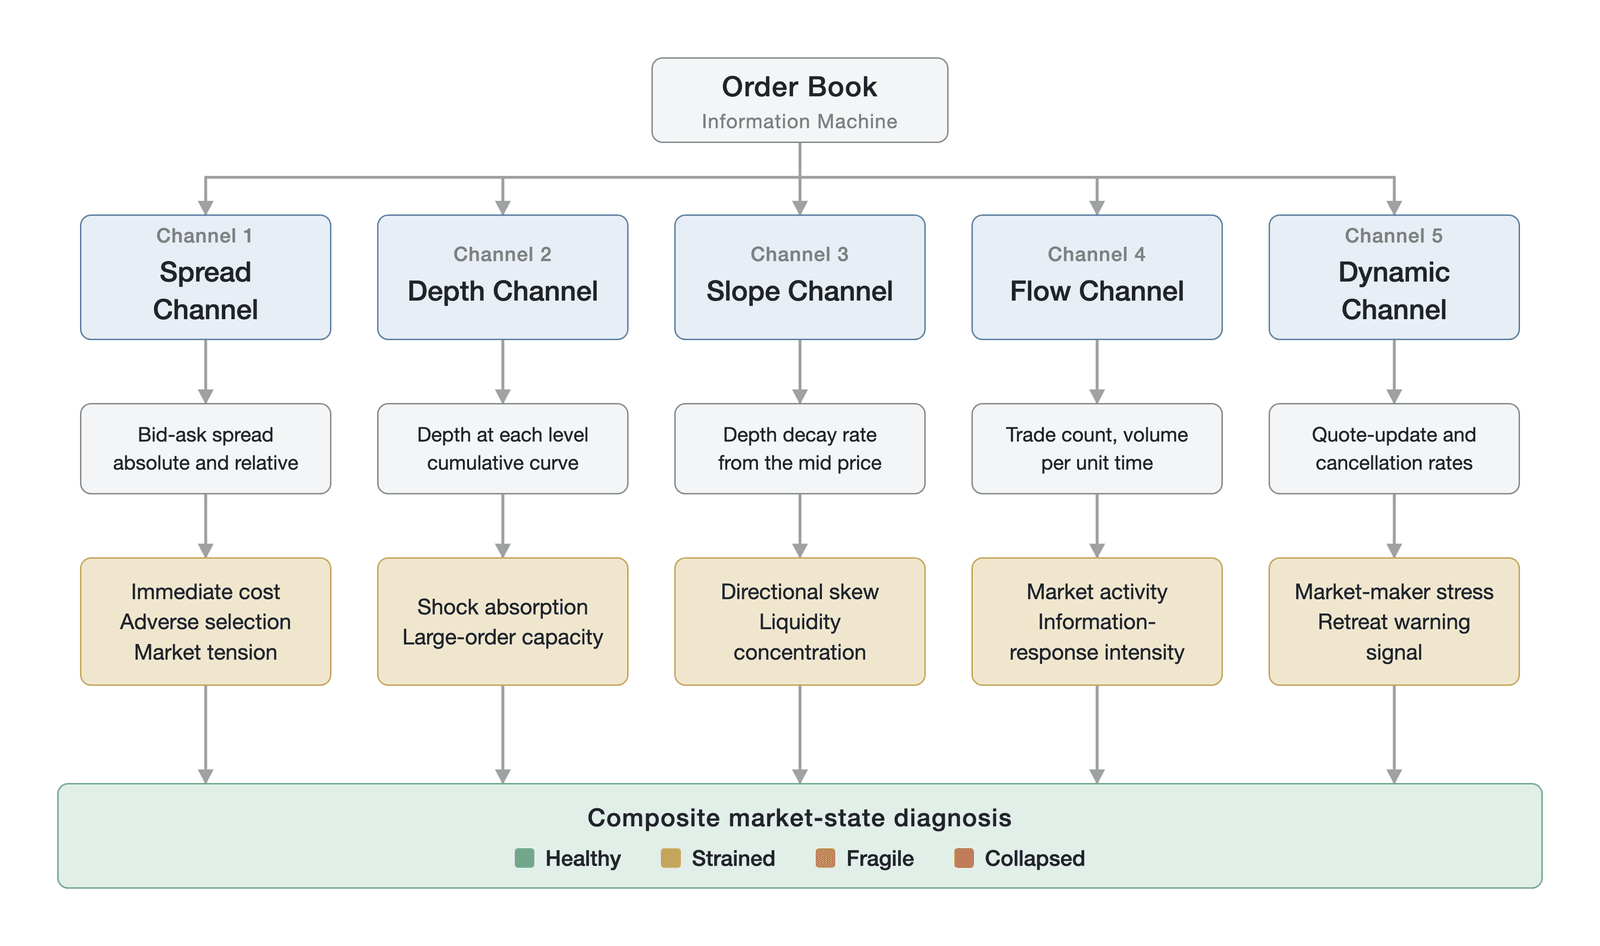
Figure 8-2. The five signal channels of the order book and the integrated diagnostic process (illustration of the integrated diagnostic process across the five signal channels; not empirical data)
The combined patterns across these five channels yield a comprehensive reading of the market state. Analyzing the signals jointly, rather than watching any single indicator in isolation, is what makes systematic diagnosis possible.
For example, in a superficially calm market with a narrow spread and thick depth (channels 1 and 2 healthy) but a sudden surge in the cancellation rate (channel 5 anomalous), the reading is often an early signal that high-frequency market makers have detected toxic order flow and are beginning to retreat. If the slope channel (channel 3) suddenly steepens while the depth channel shows a cliff at a particular price level, this strongly suggests that participants are preparing for a price breakout or a liquidation event. Such subtle structural changes often reveal the market's underlying trajectory earlier than price or volume indicators do.
8.1.3 Signal timeliness and information decay
The signals broadcast by the order book have one key characteristic: their information value decays sharply over time. In perpetual futures markets, this decay is especially rapid.
The depth consumption and price impact caused by a large market order may be filled within seconds — or even hundreds of milliseconds — by high-frequency market makers' quote updates; an abnormal asymmetry in bid and ask depth may return to balance within tens of seconds as arbitrageurs step in. Perpetual futures markets operate around the clock, which means that signals have no cross-day accumulation effect but instead exist in a perpetual cycle of continuous generation and rapid decay. This continuous high-frequency interaction keeps the order book in a dynamic-equilibrium steady state, in which any anomalous signal that deviates from the steady state is quickly smoothed away by market forces.
In the modern crypto market dominated by high-frequency market makers, orders are updated and canceled at extremely high frequency. This extremely short information half-life carries an important methodological implication: the time granularity of any analysis based on order book data must match the half-life of the signal. Using daily or even hourly data to analyze the order book produces a severe mismatch between temporal resolution and signal half-life, causing the analysis to miss almost every meaningful microstructural signal. In the millisecond-scale micro-world, liquidity may have vanished and reformed countless times, and these changes are entirely invisible on minute- or hour-level candlestick charts.
This mismatch in time granularity is precisely why many traditional macro analysts produce inaccurate results in crypto-market analysis. They attempt to explain the market's microdynamics using minute- or even hour-level candlestick charts, overlooking the fact that within these time windows the order book may already have undergone thousands of reconstructions and rebalancings. For instance, a momentary liquidity vacuum triggered by a liquidation may cause the price to plunge and rebound within seconds, leaving only a long lower shadow on the hourly chart. Without descending to the level of tick-by-tick order book data, one cannot understand the true driver of such a price anomaly.
A further distinction is needed: not all price impacts share the same decay characteristics. The microstructure literature decomposes impact into temporary impact (driven by liquidity consumption and market makers' inventory adjustments, which reverts within a relatively short time) and permanent impact (which reflects the incorporation of genuine information into the price and does not revert). In perpetual futures markets, because the liquidation of a leveraged position itself conveys genuine information about market direction (being liquidated means the market's tolerance for positions in that direction has been exhausted), the proportion of permanent impact within total impact may be systematically higher than in traditional spot markets. This distinction has a direct implication for the analysis of signal decay: if an impact is primarily permanent, then waiting for a "reversion" is itself a mistaken expectation.
This explains why, in practice, order book analysis remains the exclusive domain of a small number of professional quantitative institutions. The capacity to acquire, store, and process millisecond-level or tick-by-tick order book snapshot data constitutes a natural technological and informational barrier. This phenomenon confirms the transparency paradox discussed in Chapter 1: although the crypto market is fully public and transparent at the level of data, the sheer volume of data and the rapid decay of information mean that genuine insight remains in the hands of a small number of institutions commanding top-tier computing resources. These institutions can monitor and parse minute changes across the five signal channels in real time, allowing them to act before the market undergoes a structural shift.
8.1.4 From single signals to state diagnosis
By integrating the five signal channels, we can construct an order book state dashboard that divides the market's microstructural state into four typical, continuous phases: healthy, tense, fragile, and collapsed. It formalizes the "three snapshots" of the introduction and previews, at the order-book level, the liquidity-fragility model of Chapter 20. The specific characteristics of each state across the five channels will be mapped in detail in Section 8.4.4 in conjunction with order book morphology. Here we merely outline the core logic: the transition from "healthy" to "collapsed" is not a sudden event but a traceable, continuous process of deterioration, manifested as a gradual widening of the spread, a contraction of depth from symmetric to one-sided thinness, and a rise in the market-maker cancellation rate from steady climbing to full retreat. The flash crash of October 2025 is a textbook case that evolved precisely along this path.
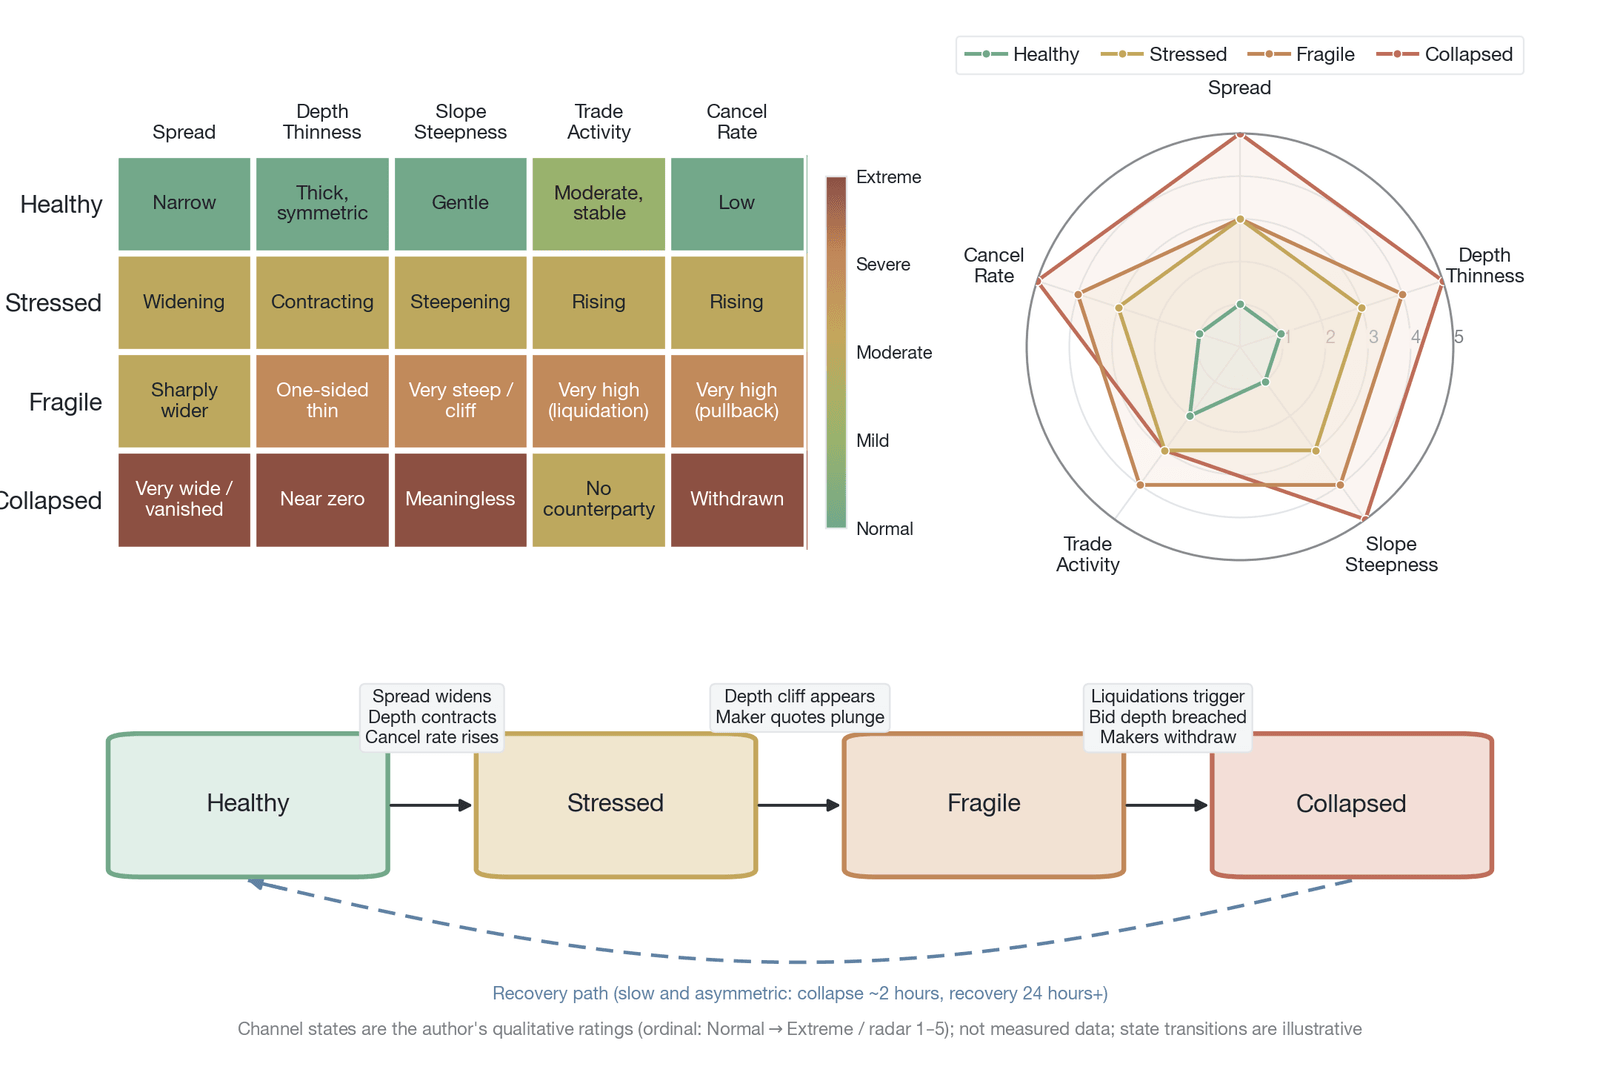
Figure 8-3. The order book state dashboard (the author's state-diagnosis framework: the four states — healthy, tense, fragile, and collapsed — and the 1–5 severity scale are the author's qualitative ordinal ratings, not empirical data; the recovery path of "collapse in about 2 hours / recovery in more than 24 hours" is a representative time scale)
The upper half of Figure 8-3 presents, in matrix form, the typical behavior of the five signal channels across the four states, while the lower half shows the state transitions from healthy to collapsed and the recovery path. The latter is markedly asymmetric: the deterioration path is short and steep, whereas the recovery path is long and gradual. The correspondence between each state's behavior across the five channels and order book morphology is refined in Section 8.4.4.
This diagnostic capability constitutes the core of modern quantitative trading and risk management. By continuously monitoring the order book's state transitions, traders can dynamically adjust their position sizes and leverage, while exchanges can trigger circuit breakers or liquidity-protection mechanisms in advance. Yet even if we could read these signals perfectly, we would still confront a cognitive bias: is the depth we "see" in the order book truly the depth we can "use"? This question leads to the subject of the next section — the depth illusion.
8.2 The depth illusion
In cryptocurrency markets, and especially in perpetual futures trading, one of the most common errors traders make is to equate the resting order quantity visible on the order book with the trading size the market can genuinely absorb. The depth displayed in the order book misleads along two dimensions, and this is no mere technical detail of microstructure: it is the root cause of severe slippage under stress.
A trader who equates visible depth with usable depth may get by in the everyday low-volatility environment, but at the critical moment when the market faces a shock, that trader will often encounter severe slippage. The high-leverage environment, the absence of an expiry date, and the around-the-clock trading mechanism unique to perpetual futures make this depth illusion far more pronounced than in traditional financial markets (such as equity spot markets or traditional futures markets). During the cryptocurrency flash crash of October 2025, post-mortem data showed that within the first few minutes of the price plunge, "the cumulative depth within 5% of the best bid contracted by more than 90%." This figure directly reflects how the depth illusion manifests under extreme stress. Starting from the underlying microstructural logic, this section examines the dual causes of the phenomenon and proposes a set of actionable quantitative methods.
8.2.1 Flickering liquidity and ghost quotes
When we observe the order book of a modern electronic trading platform, what we see is a constantly flickering, rapidly updating matrix of numbers. Beneath this seemingly thriving appearance of liquidity, however, hides a large volume of what is called flickering liquidity. The quotes of high-frequency market makers and algorithmic traders may exist on the order book for less than a second before being automatically canceled and replaced by the system.
These flickering quotes are counted as valid depth in any static snapshot of the order book at a given instant. In actual trading practice, however, when a market order or an aggressive limit order is submitted to the matching engine, network latency and the market maker's extremely fast cancellation often mean that the quote has already been canceled before the matching engine processes the order. In other words, the trader "sees" ample depth on the terminal, but by the time it comes to "use" that depth — to submit an order — it is gone. This phenomenon constitutes the first layer of the depth illusion.
Academics have long attended to this phenomenon, usually calling it ghost liquidity or flickering quotes. In studies of traditional equity markets, ample empirical evidence has shown that flickering liquidity accounts for a considerable share of visible depth. In highly electronic markets such as Nasdaq, for example, the prevalence of high-frequency trading has substantially shortened the average lifespan of orders.
In the cryptocurrency perpetual futures market, this phenomenon is not only fully inherited but further intensified by the specific market environment. Market makers in crypto markets face significantly higher adverse-selection risk. In a detailed analysis of crypto-market microstructure, Tiniç et al. (2023) found that the absence of unified regulation and disclosure mechanisms pushes the share of informed trading far above that of traditional markets [10]. This means that when a market maker's passive quote is filled, there is a very high probability that the counterparty is a trader with an information advantage, exposing the market maker to systematic losses.
To cope with this high adverse-selection risk — compounded by the fast and frequent price movements that the crypto market's around-the-clock trading and high leverage produce — the market maker's defensive strategy is high-frequency quote updating. To avoid being "arbitraged" or "sniped" by informed traders, market makers must update their quotes at extremely high frequency, adjusting orders at the millisecond or even microsecond level in response to price signals from other exchanges, changes in on-chain data, or macroeconomic indicators. This directly makes the lifespan of each quote extremely short. Flickering is therefore not only ubiquitous in perpetual futures markets; its scale and frequency far exceed those of traditional markets, making it central to any assessment of liquidity quality in crypto markets.
8.2.2 Conditional depth
If flickering liquidity is a "physical-layer" illusion produced by the microstructural mechanics of high-frequency trading, then a deeper and more destructive illusion lies in the behavioral logic of liquidity providers. Even when certain quotes are "real" (that is, they remain on the order book long enough not to be mere flickering quotes), the existence of that depth is absolutely premised on the implicit condition that market conditions are normal.
In the central limit order book model, the limit order a market maker submits appears on the surface to be a firm commitment to provide liquidity to the market, but in essence it is only a conditional commitment. The market maker's internal logic can be made concrete:
"As a market maker, I have placed a buy order for 100 ETH at the $2,000 price level, providing liquidity to the market. But note that the effectiveness of this commitment rests on a series of strict implicit preconditions: that the market is currently experiencing no extreme directional volatility, that no signs of an ongoing liquidation cascade have been observed, that prices across the major exchanges show no significant divergence, and — most important — that my own inventory risk remains within the manageable range of my internal risk-control model. If any one of these conditions no longer holds and my risk-control threshold is triggered, my algorithm will automatically cancel this order within milliseconds and withdraw from the market."
This internal logic reveals the essence of order book depth: it is absolutely not an unconditional guarantee but a highly conditional commitment. The sole condition for its persistence is that the market state remain within the stable range the market maker's algorithm can tolerate. Once the market state deteriorates — even at the earliest sign of deterioration — these conditional commitments retreat collectively within an extremely short time. This collective retreat causes the seemingly ample visible depth on the order book to vanish rapidly, forming zones of extreme liquidity scarcity.
The discussion in Chapter 2 of "the cost of abolishing the expiry date" clarifies the special nature of this conditional commitment in perpetual futures. Traditional futures contracts have a definite expiry date, so a market maker's inventory risk naturally converges as expiry approaches. The loss of a risk-termination date for perpetual futures market-making, however, means that when providing quotes the market maker effectively bears an open-ended inventory risk. Lacking a risk-release mechanism along the time dimension, market makers become far more sensitive to market volatility. As a result, the liquidity commitments they make in perpetual futures are far more conditional than in traditional markets. Once the market enters a trending move, or volatility rises sharply, market makers — to avoid an indefinite erosion of inventory value — trigger their retreat mechanism at a very low threshold. This structural fragility, arising from institutional design, constitutes the second layer of the depth illusion and is the core reason liquidity dries up during extreme market conditions.
8.2.3 The three-layer decomposition of depth
Given that the depth illusion objectively exists and carries significant destructive power, how can it be identified and quantified in practice? The ILLIQ indicator proposed by Amihud (2002) measures illiquidity through the ratio of the absolute value of the daily return to the trading value, providing a standardized tool for the macro-level measurement of market depth [11]. That indicator, however, is based on daily-frequency data and cannot capture the depth changes at the micro time scale with which this chapter is concerned. To break the cognitive fallacy that "visible equals usable" and to measure the scale of the depth illusion precisely at the order book level, this chapter proposes a three-layer definitional framework of depth (Table 8-2). This layered quantitative framework helps traders and risk managers form more accurate dynamic expectations of the liquidity actually usable under different market states.
| Depth layer | Conceptual definition | Measurement and calculation method | Reliability and application scenarios |
|---|---|---|---|
| Nominal depth | The total resting order quantity displayed directly in a static snapshot of the order book at a specific point in time. This is the most intuitive depth an ordinary trader sees on the terminal interface. | (where is the resting order quantity at the i-th level, and i ranges over all levels within a set percentage band around the best bid and ask). Typically calculated as the cumulative order size within a certain percentage (such as 1%, 2%, or 5%) of the best bid and ask. | Lowest reliability. It undergoes no filtering and contains a large volume of flickering liquidity and conditional commitments that may be canceled at any time. Suitable only for an extremely stable market environment. |
| Effective depth | The depth that, after removing high-frequency flickering quotes, is genuinely available with high probability for matching and execution under normal market conditions. | Cannot be read directly from a snapshot. It requires high-frequency historical order-flow data to compute the average lifespan of orders and the actual fill rate, from which a discount coefficient X is calibrated. Effective depth = nominal depth × X%. The value of X varies significantly by asset class, exchange type, and market state: based on empirical analysis of multiple historical extreme events, the X value for mainstream assets (such as BTC and ETH) on leading exchanges is typically between 60% and 80%, for mid-cap assets between 40% and 60%, and for less liquid long-tail assets possibly as low as 20% to 40%. It must be emphasized that the ex ante measurement of stress depth faces fundamental difficulties; the above ratios are merely empirical estimates based on historical-event retrospection and should not be applied mechanically to future stress scenarios. | Moderate reliability. It reflects the true cost of liquidity in everyday trading, but its premise remains that market conditions are normal, and it cannot withstand extreme shocks. |
| Stress depth | The depth that actually remains on the order book and is available for execution after market makers retreat collectively when the market faces an extreme shock, volatility spikes, and stress rises sharply. | Can be measured only through ex post retrospective analysis of high-frequency tick-by-tick trade data during historical extreme events (such as flash crashes and liquidation cascades). It measures how much depth truly withstood the test at the moment of crisis. | Highest reliability, but extremely difficult to predict. It is the core indicator for assessing market tail risk and calculating extreme slippage. Stress depth is often only 5% to 15% of nominal depth. |
Table 8-2. The three-layer decomposition framework of depth (Data source: compiled by the author)
Through this three-layer division, the scale of the depth illusion can be quantified precisely: the vast gap between nominal depth and stress depth is its absolute magnitude.
Take the crypto-market flash crash of October 2025. The detailed post-mortem report by FTI Consulting (2025) shows that within the first few minutes of the crisis, the nominal depth within 5% of the best bid appeared to be as high as hundreds of millions of dollars, but as liquidation selling pressure surged in and market makers canceled orders instantly, the stress depth that actually supported execution amounted to less than 10% of the pre-crisis nominal depth [2]. This means the reduction from nominal depth to stress depth exceeded 90%. The larger this gap, the more the market's liquidity was built on a highly conditional foundation, and the worse its actual performance under stress relative to how it appeared on the surface. For institutional investors who rely on algorithms to execute large orders, estimating slippage and market impact on the basis of nominal depth will produce execution costs far in excess of expectations.
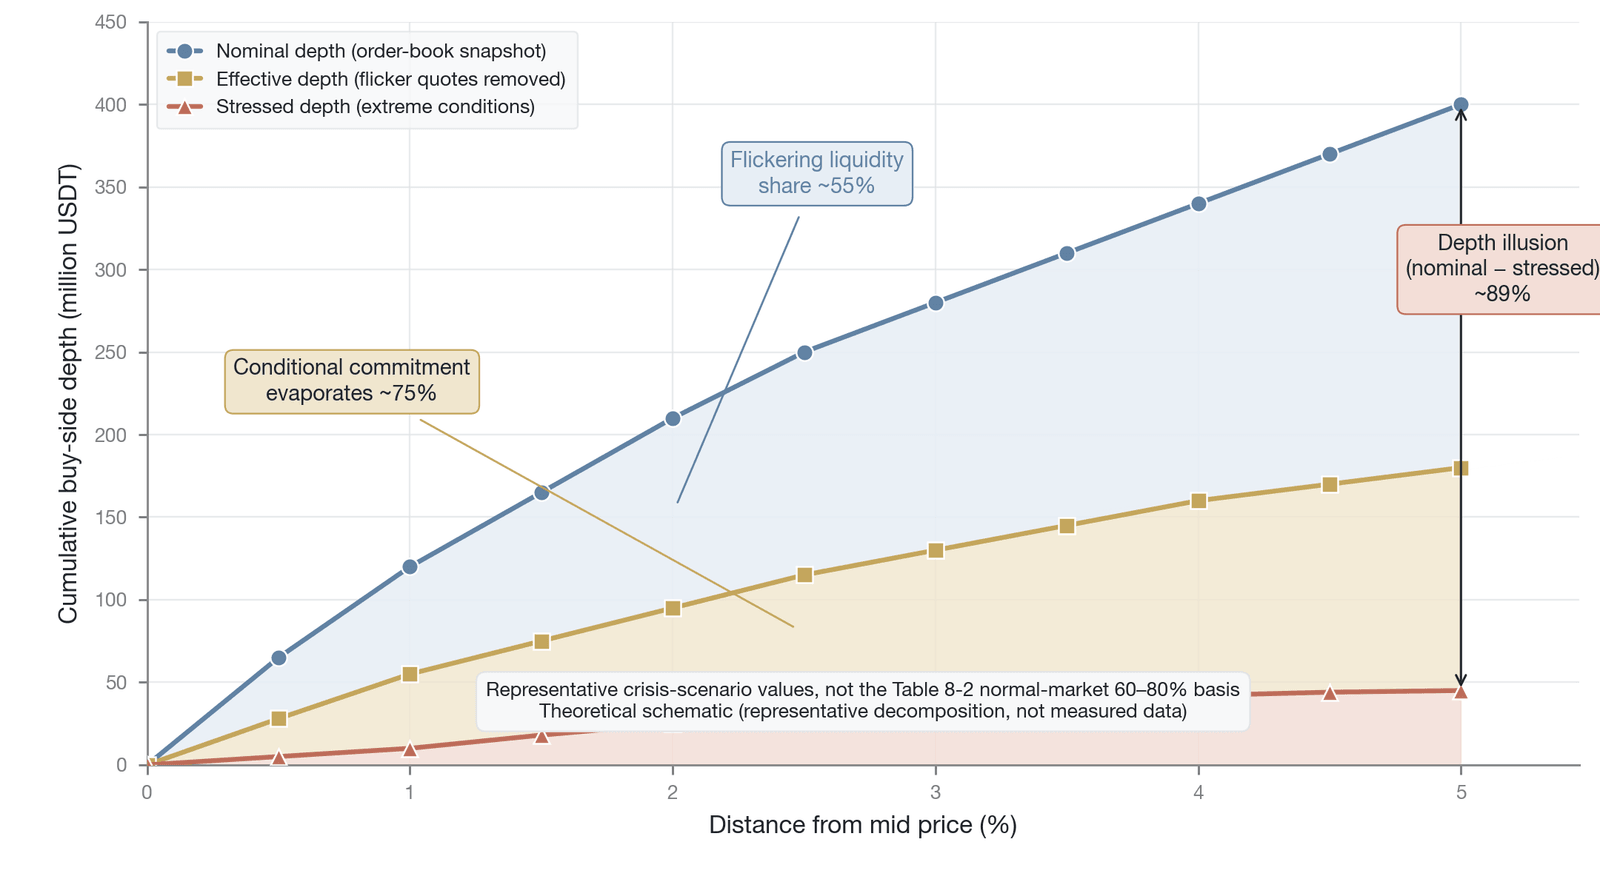
Figure 8-4. A three-layer comparison of nominal depth, effective depth, and stress depth
Note: This figure is a theoretical illustration drawn from the characteristic parameters of the October 2025 flash crash. The flickering, conditional evaporation, and nominal-to-stress depth gap shown are the author's representative decomposition, not empirical data, and are representative values for a crisis scenario rather than the normal-condition measure of Table 8-2 ("effective depth = nominal × 60–80%"); the figure follows FTI Consulting (2025) [2]. Within 5% of the mid price, the reduction from nominal depth to stress depth adopts the same ">90%" measure as Section 8.2 in the main text (the roughly 89% shown is a representative approximation of that reduction), indicating that under extreme market conditions the liquidity a trader can actually rely on is only about one-tenth of the nominal value displayed on the trading terminal. For institutional traders who design large-order execution algorithms, estimating expected slippage on the basis of nominal depth alone will produce execution results that deviate from expectations by an order of magnitude at the moment of crisis.
8.2.4 The amplification mechanisms of the depth illusion
Why is the depth illusion in perpetual futures markets far more severe than in spot markets or in traditional low-leverage markets? The reason is that the underlying design of perpetual futures embeds two core mechanisms that, under stress, together amplify the depth illusion.
The first amplification mechanism is the anticipation of a liquidation cascade and the resulting defensive order cancellation. In the modern crypto market, market makers possess extremely advanced data-analysis capabilities. On decentralized exchanges (DEXs, such as application chains with an on-chain CLOB architecture), they can precisely calculate the liquidation trigger points across different price ranges by analyzing the fully public on-chain position and liquidation data; on centralized exchanges, they rely on sophisticated machine-learning models and historical experience to estimate the location of dense liquidation zones.
As the price gradually approaches these dense liquidation zones, market makers can clearly foresee the characteristics of the future order flow: "If the price reaches this trigger point, the liquidation engine will automatically take over and submit a large volume of forced sell orders to the market. These orders are highly toxic: they are involuntary, entirely insensitive to price (usually issued as market orders), and, because of the multiplier effect of high leverage, potentially far larger than normal orders."
Faced with this highly certain and enormously destructive anticipation of "toxic order flow," a rational market maker will not remain in place as the counterparty to liquidation orders. Market makers therefore adopt a defensive strategy, sharply reducing — or even entirely withdrawing — their bid quotes near the dense liquidation zone in advance. This anticipation-based collective cancellation forms a liquidity vacuum at specific price levels on the order book, which we call a depth cliff. This preemptive retreat makes the already-thinned depth even more fragile, directly amplifying the destructive power of the depth illusion.
The second amplification mechanism is the compounding effect of high leverage and procyclical retreat. High leverage amplifies not only traders' profits and losses but also the inventory risk market makers face. Market makers inevitably accumulate inventory when providing liquidity. When the market moves in one direction — especially a leveraged one-directional move — the opposing positions market makers hold face accelerating losses.
As discussed in Section 8.2.2 regarding "the cost of abolishing the expiry date," perpetual futures lack a delivery date that would force prices to converge and release risk, so market makers bear an open-ended inventory risk. Layered on top of this is the loss acceleration that leverage brings. Unable to judge how long an adverse trend will last, market makers see their tolerance (threshold) for retreat pressed extremely low.
After analyzing the microstructural data of the flash crash, FTI Consulting (2025) confirmed this point: during the crisis, the speed of market makers' retreat reached the millisecond level, and the scale of the retreat was unprecedented [2]. This reveals a dangerous "procyclicality" in market-maker behavior: precisely when the market is highly volatile and most in need of liquidity to absorb the shock and stabilize prices, market makers instead have the strongest incentive — out of the rational motive of risk avoidance — to withdraw liquidity on a large scale. The superposition of this procyclical retreat and the high-leverage environment exposes the depth illusion to its fullest extent at the most critical moment.
Beyond these two rational mechanisms, the reflexive effect of information transparency constitutes a third amplification channel. In cryptocurrency markets, liquidation data are displayed to the entire market in real time through aggregation platforms such as CoinGlass. This transparency aids price discovery and risk assessment in normal times, but during a crisis it produces a counterproductive accelerating effect: when traders observe on social media and data dashboards that liquidation volume is climbing sharply, these publicly visible liquidation data themselves turn into a panic signal, triggering more participants to close positions voluntarily and thereby generating even larger-scale liquidations. This constitutes a reflexive mechanism: the transparent disclosure of liquidation information in turn accelerates the spread of liquidations, making the crisis self-reinforce far faster than in comparable events under an information-opaque environment.
At the same time, during extreme stress events, arbitrageurs — who ought to perform a stabilizing function — may also fail. Under normal market conditions, arbitrageurs push prices back toward equilibrium by capturing cross-market or cross-asset price deviations. Brunnermeier and Pedersen (2009), however, revealed the mechanism of the liquidity spiral: when the market is highly volatile, arbitrageurs themselves face margin calls and are forced to close out their arbitrage positions to meet funding needs [12]. These forced closures not only fail to narrow the price deviation but instead worsen it, and the force that should anchor prices exits the market at precisely the moment it is most needed. In the high-leverage environment of crypto perpetual futures, arbitrageurs' capital constraints are even tighter, so this "stabilizer failure" is correspondingly more common.
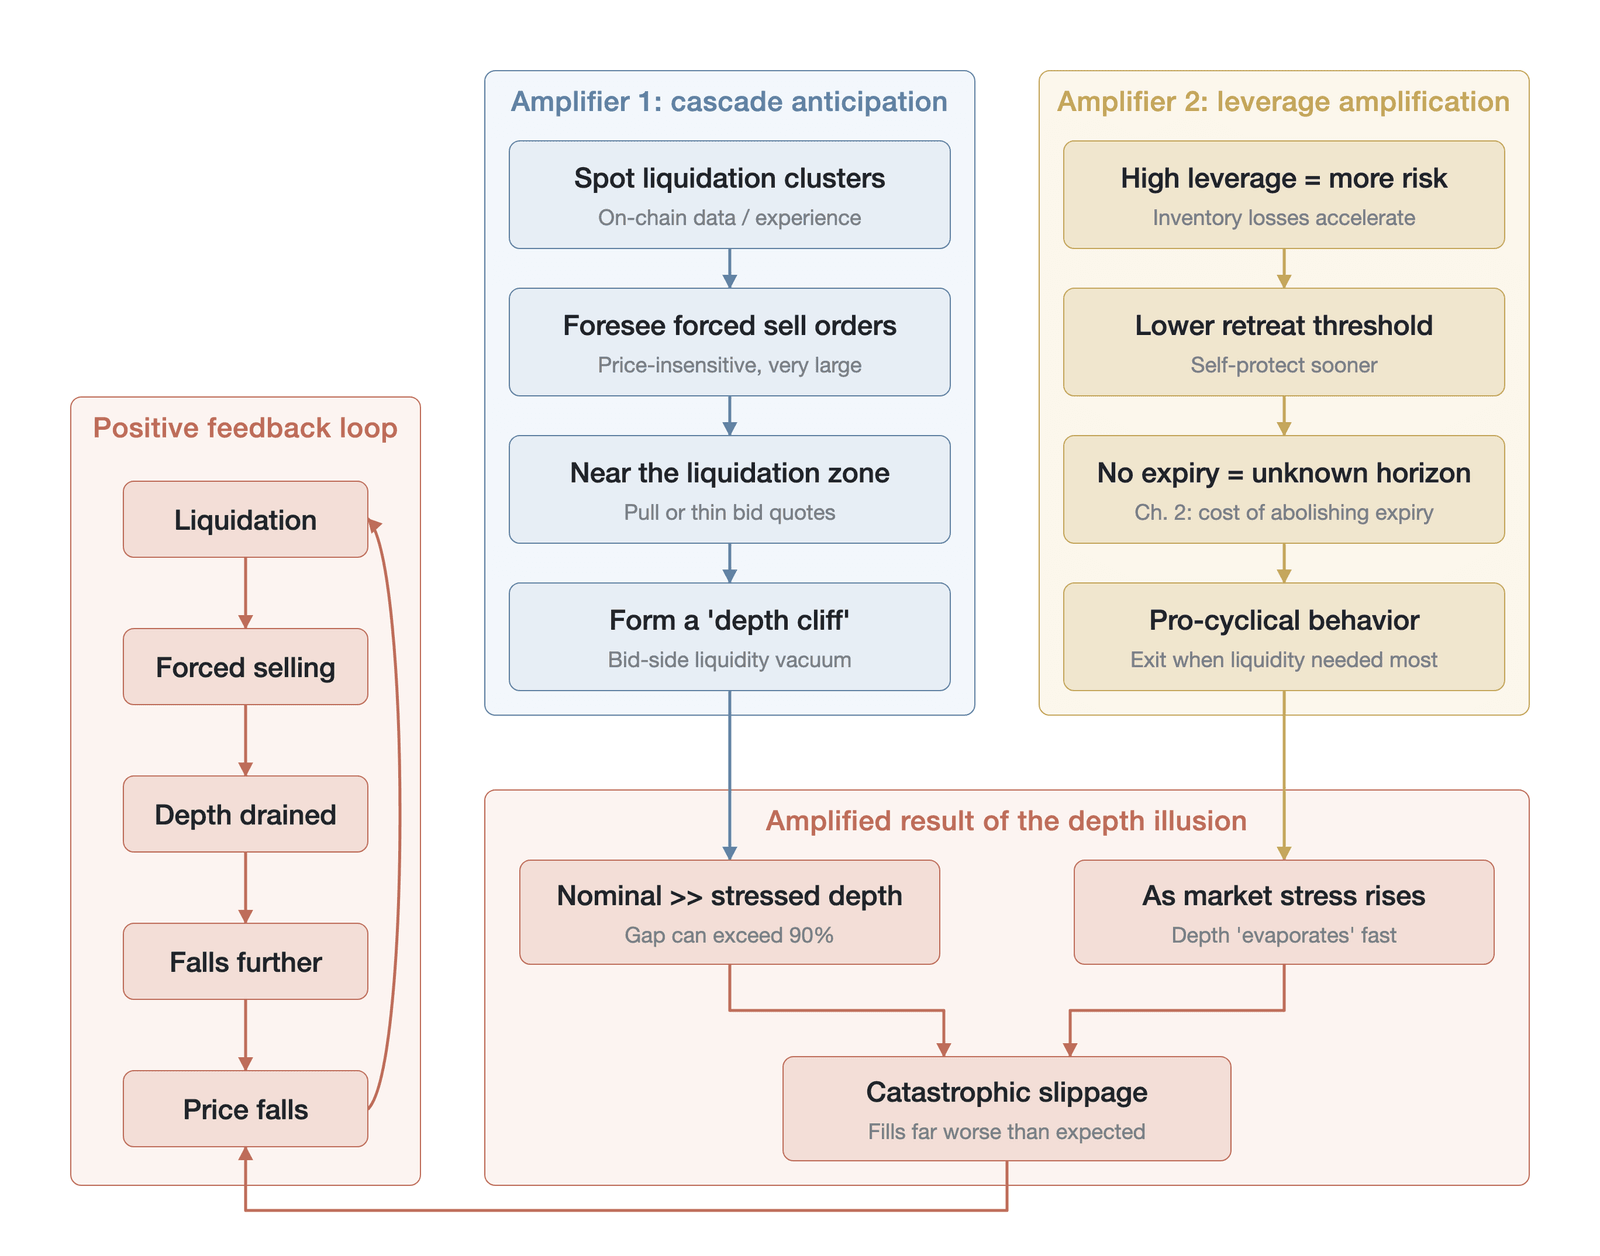
Figure 8-5. The causal chain of the depth-illusion amplification mechanisms (illustration of the mechanism causal chain, not empirical data; this figure focuses on the two rational retreat mechanisms — liquidation-cascade anticipation and high-leverage procyclicality — while the third amplification channel, the reflexivity of information transparency and the arbitrageur liquidity spiral, is discussed in Section 8.2.4 of the main text, the latter following Brunnermeier & Pedersen 2009 [12]; "2009" is the citation year of that study, not the date of the flash crash)
The left side of the figure shows how market makers' defensive cancellation based on liquidation anticipation forms a depth cliff, and the right side shows the procyclical retreat triggered when high leverage and the absence of an expiry date lower the retreat threshold. The nonlinear interaction of the two (anticipatory cancellation drains the depth buffer at key price levels in advance, while procyclical retreat destroys the residual liquidity when volatility spikes) constitutes a "double vacuum" effect, making the actual severity of the liquidity crisis far exceed what either factor alone would predict.
8.2.5 Case study: the Hyperliquid POPCAT phantom order-wall incident
The preceding analysis focused mainly on the depth illusion caused by market makers' unintentional conditional retreat. The POPCAT incident on the decentralized perpetual futures platform Hyperliquid in November 2025, however, shows that the depth illusion can arise not only passively as an endogenous fragility of the market microstructure but can also be actively constructed and weaponized by a trader to manipulate the market price and transfer risk.
Viewed from a legal perspective, this behavioral pattern (first building a position, then placing a large order with no genuine intent to trade in order to induce others to follow, and subsequently canceling the order for profit) constitutes the classic spoofing conduct of traditional securities law. Under Section 747 of the U.S. Dodd-Frank Act, such conduct is explicitly defined as spoofing — that is, submitting a bid or offer "with the intent to cancel before execution." The 2015 Navinder Sarao case established a precedent for the criminal liability of such conduct, with the court finding that his repeated placement and cancellation of large orders in the S&P 500 futures market constituted market manipulation. On an on-chain decentralized exchange, however, legal enforcement against such conduct faces unique challenges: the manipulator uses anonymous wallet addresses, operates across jurisdictions, and the decentralized protocol itself lacks the monitoring and enforcement obligations of a traditional exchange. This enforcement gap leaves on-chain perpetual futures markets facing a more severe institutional deficit in defending against manipulation than traditional markets.
On November 12, 2025, an anonymous trader withdrew about $3 million in USDC from OKX, dispersed it across 19 wallet addresses, and then built a POPCAT long position on Hyperliquid with total exposure of roughly $26 million to $30 million at about 5x leverage. After completing the position, the trader placed a buy limit order of about $20 million at the $0.21 price level. This order formed a bid-side "order wall" on the order book that far exceeded the normal depth level of that market, transmitting a signal of strong buy-side demand to other market participants [13]. Attracted by this surface depth, other traders followed into long positions, further raising the market's leverage level and long-side concentration.
From a microstructural perspective, the core of the incident is that the $20 million order wall was, in essence, an artificially manufactured depth illusion. Unlike the flickering liquidity discussed in Section 8.2.1 and the conditional depth analyzed in Section 8.2.2, this order wall was never intended to be filled from the moment it was submitted; its sole function was to manufacture visible depth in order to induce others to follow. Once long positions had accumulated to a sufficient scale, the manipulator withdrew the order wall. The $20 million of nominal depth dropped to zero in an instant, and the high-leverage long positions held by the follower traders who had relied on this visible depth suddenly faced an order book with a severe shortage of real depth. The POPCAT price fell about 43% within minutes (from about $0.21 to about $0.12), triggering about $63 million in platform-wide liquidations. Because the forced sell orders generated by the liquidations far exceeded the true absorptive capacity of the order book, Hyperliquid's community liquidity pool, HLP, ultimately bore about $4.9 million in bad debt [13].
Within Hyperliquid's risk architecture, HLP plays a dual role: it is both the liquidity provider for everyday market-making and the final risk bearer of the liquidation system. When the liquidation engine forcibly closes a position, if the order book lacks sufficient counterparty quotes, the unmatched exposure is first absorbed by the platform's insurance fund. When the insurance fund is insufficient to cover the entire loss, the remaining bad debt is distributed to HLP's liquidity providers through a socialized-loss mechanism. In the POPCAT incident, the insurance fund was rapidly exhausted, and the $4.9 million in bad debt was ultimately borne jointly by HLP's participants in proportion to their contributions. This transmission path (liquidation engine → insurance fund → HLP socialized allocation) reveals the ultimate destination of risk in a decentralized liquidation system.
From an operational-risk perspective, the incident also exposed multiple defensive deficiencies in Hyperliquid's market monitoring: the dispersed but synchronized position-building across 19 linked wallets (which would typically trigger an alert in the linked-account detection systems of traditional exchanges), the highly concentrated position in a single asset (with total exposure representing a significant share of POPCAT's market-wide open interest), and the $20 million order wall exceeding the normal size distribution. These three anomalies should have triggered, respectively, linked-account, position-concentration, and large-order alerts, yet all failed simultaneously — indicating that decentralized perpetual futures platforms still exhibit a significant institutional lag in the transition from technical architecture to an operational risk-control system.
This incident provides a case of special analytical value for the theoretical framework of the depth illusion. In flickering liquidity and conditional depth, the depth illusion is market makers' spontaneous behavior grounded in their own risk-management logic, intended to protect capital rather than to mislead the market; POPCAT reveals a third form — strategically constructed false depth — in which the manipulator turns the market's default trust in visible depth (the cognitive inertia that "the depth one sees is the depth one can use") into a tool of manipulation. From the perspective of behavioral finance, the $20 million order wall created a strong anchoring effect, causing participants to systematically overestimate the strength of support at that price level and to add leverage accordingly; combined with the availability heuristic (the tendency to rely in decision-making on the most readily available visual information), this explains why followers could gather at large scale in a short time. This strategic depth illusion is especially dangerous in long-tail-asset perpetual markets: the lower the normal depth, the greater the relative illusion a single large order creates and the stronger its distortion of others' decisions. After the incident, Hyperliquid suspended deposits and withdrawals and launched a risk-control review, becoming a textbook case of the institutional-design challenges that decentralized perpetual platforms face in defending against market manipulation.
8.3 The distinctiveness of the perpetual futures order book
Having dissected the depth illusion, we must further recognize that the perpetual futures order book is not a simple replica of the traditional spot order book. It is deeply reshaped by a series of financial rules unique to the underlying design of perpetual futures. The leverage mechanism, the forced-liquidation system, the funding rate that maintains the price anchor, the dual-track price system (mark price and last traded price), and the vast open interest all give rise, at the microstructural level of the order book, to a series of distinctive phenomena that simply do not exist in spot markets.
This section analyzes systematically how these five core mechanisms shape the dynamic behavior of the order book. This analysis deepens our understanding of market microstructure and lays the empirical and logical groundwork for the "four fingerprints of the perpetual futures order book" framework proposed later in this chapter.
8.3.1 The order book transmission mechanism of the liquidation cascade
In perpetual futures markets, the liquidation order is key to understanding the microstructure of extreme markets. It is a highly unusual order type: it is not actively issued by a human trader or a conventional quantitative strategy based on a market judgment but is executed automatically and compulsorily by the exchange's liquidation engine when a user's margin ratio falls below the maintenance-margin requirement.
This compulsory and special origin gives liquidation orders two microstructural characteristics that carry significant systemic risk. The first is absolute price insensitivity: in order to take over and close the position as quickly as possible to prevent the position from going underwater, the liquidation engine typically throws the position into the market as a market order or an extremely aggressive limit order (such as a bankruptcy-price limit order), executing an immediate fill with no price limit and inflicting a direct and enormous shock on the order book's available depth. Accompanying this is the adverse timing of their appearance: liquidation orders never appear in calm conditions; their triggering is necessarily accompanied by a market that has already moved sharply against the liquidated position. The influx of liquidation orders therefore intensifies the market shock and reinforces the existing trend and volatility.
From the standpoint of the micro-transmission path, the positive feedback loop of the liquidation cascade forms a self-reinforcing chain: "initial decline → liquidation of high-leverage positions → price-insensitive market sell orders consume bid-side depth → accelerated price decline → deeper liquidations triggered → procyclical retreat of market makers → liquidity vacuum." In this loop, the collective retreat of market makers plays a key accelerating role, pushing the order book from "thin depth" into a "liquidity vacuum" and thereby amplifying a normal price correction into a systemic liquidity collapse.
The flash crash of October 2025 provides empirical validation of this transmission mechanism. According to the post-mortem report by FTI Consulting (2025), after the structural long position that a large fund had built near $86,000 was triggered for liquidation, the bid-ask spread of the BTC/USDT perpetual futures widened within minutes from less than 10 basis points to the thousand-basis-point range recorded on individual platforms at the peak of the cascade (spread snapshots vary enormously across exchanges and across moments in time; the thousand-basis-point level here is an extreme reading on a thin-book platform at the peak of the collapse, which differs in measure and moment from the 26.43 basis points recorded on a mainstream platform at 21:15 UTC cited earlier), with cumulative forced liquidations reaching $9.89 billion over about 14 hours [2][1]. The complete micro-transmission mechanism of the liquidation cascade on the order book (in particular, how market makers form a defensive depth cliff) is analyzed further in the four-fingerprints framework in Section 8.5.1.
The failure of the existing risk-buffer mechanisms to interrupt the cascade during this crisis deserves scrutiny. Mainstream cryptocurrency exchanges typically deploy three lines of defense: an insurance fund to absorb underwater losses, an auto-deleveraging mechanism that hedges and closes profitable-side positions when the insurance fund is insufficient, and position limits and price-protection mechanisms that constrain extreme behavior. In the October 2025 event, the insurance funds of several exchanges were substantially depleted during the peak of the cascade, and some exchanges triggered their auto-deleveraging programs, but the design parameters of these mechanisms (the size of the insurance fund relative to potential liquidation exposure, the trigger thresholds for auto-deleveraging, and the width of the price-protection band) had never been stress-tested against a synchronized liquidation event of this scale. The existence of the safety net gave market participants a sense of institutional security, but the gap between the safety net's actual carrying capacity and the extreme liquidation pressure is precisely the institutional reason the cascade could not be interrupted.
This transmission mechanism bears a surface resemblance to — but a fundamental mechanistic difference from — the "hot potato effect" described by Kirilenko et al. (2017) in their microstructural analysis of the U.S. equity flash crash of May 2010 [14]. In the 2010 U.S. equity flash crash, the "hot potato" referred to the rapid passing of toxic inventory among high-frequency traders — that is, a position repeatedly changing hands among multiple intermediaries, with each transfer accompanied by a further deterioration in price. In the liquidation cascade of crypto perpetual futures, by contrast, the driving force is not the lateral transfer of positions but their one-directional elimination: the forced market orders generated by the liquidation engine are entirely involuntary, absolutely price-insensitive, one-directional selling. Their distinctive destructive power lies precisely in this complete price insensitivity: they do not "wait" for a reasonable price but execute immediately at any available price, punching directly through all available depth in the order book.
The destructive power of the liquidation cascade spreads further through cross-market contagion paths. Under a unified margin system, the liquidation of a BTC position in an account consumes all the available margin in that account, forcing the trader to simultaneously reduce positions in ETH and other altcoins to free up margin, thereby transmitting the pressure from the BTC market to the entire crypto derivatives market. In addition, liquidation pressure on centralized exchanges spills over to decentralized exchanges through arbitrageurs' cross-platform activity: when the price of BTC perpetual futures on a CEX falls significantly below the DEX quote because of liquidation selling pressure, arbitrageurs execute sell orders on the DEX to capture the spread, replicating the CEX liquidity crisis in the on-chain market. This multilayered contagion network makes the reach of the liquidation cascade extend far beyond the boundary of any single trading pair or single platform.
Figure 8-6 aligns the spread (Panel A), depth (Panel B), and liquidation volume (Panel C) of the October 2025 flash crash along the same time axis.
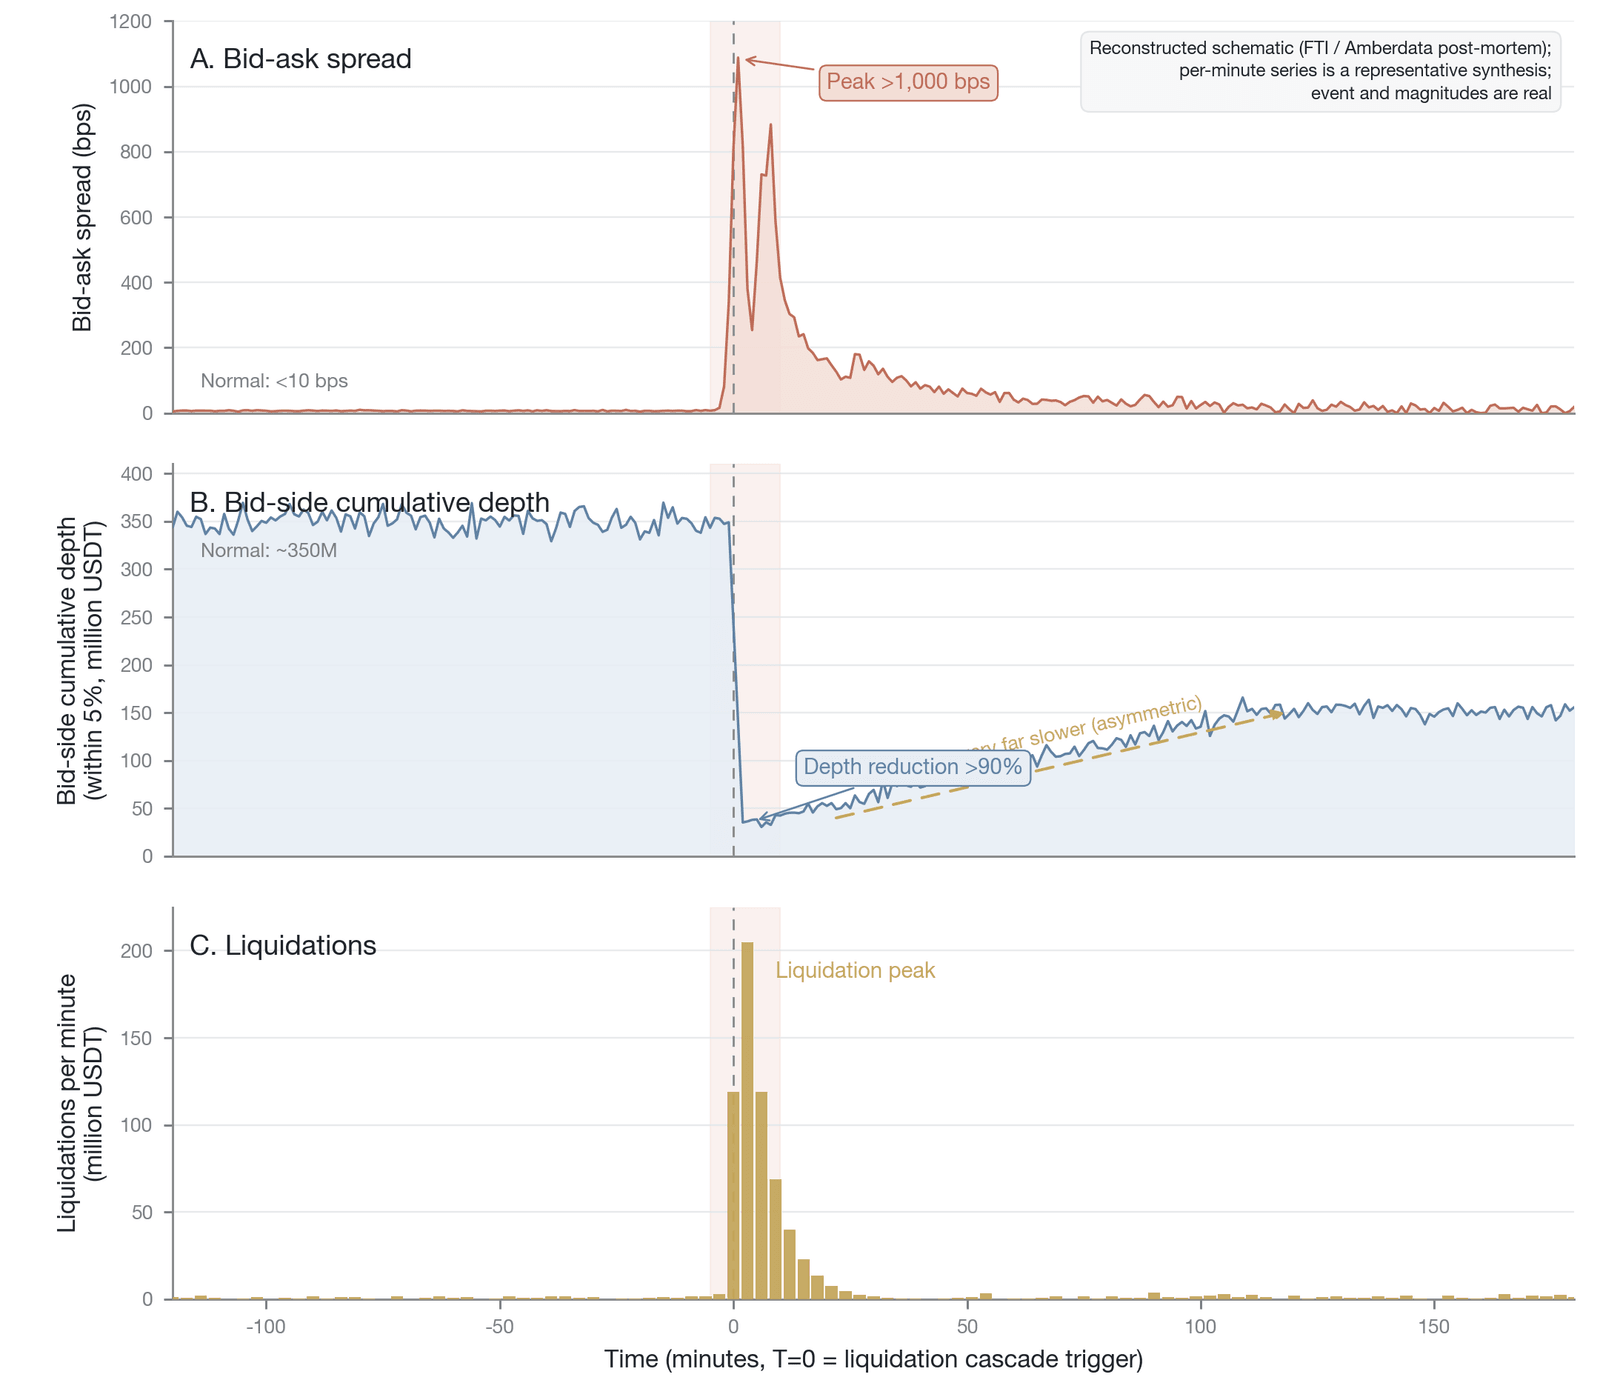
Figure 8-6. The microstructure of the October 2025 flash crash in three panels (a stylized three-panel view of the October 2025 flash crash: the spread peak of >1,000 basis points, bid-side depth of about $350M contracting by >90%, and the liquidation peak of about $200M are representative synthetic values; the event is real, but the minute-by-minute waveform is a post-mortem reconstruction rather than raw empirical measurement; the spread peak is on a thin-book-platform basis, distinct from the 26.43 basis points recorded on a mainstream platform at 21:15 UTC in the main text; following Amberdata 2025 [1] and FTI Consulting 2025 [2])
The temporal alignment of the three panels reveals a key empirical finding: the widening of the spread (Panel A) and the evaporation of depth (Panel B) were almost perfectly synchronized, indicating that the collective retreat of market makers and the influx of liquidation selling pressure were concurrent rather than sequential processes. The depth recovery in Panel B, in turn, exhibits the asymmetry of "rapid collapse, slow repair" (collapse in minutes, recovery over hours or more), which is analyzed further in Section 8.6.
8.3.2 The cyclical influence of the funding rate
The reason perpetual futures can remain "perpetual" without their price drifting far from spot lies, at its core, in the distinctive funding rate mechanism. This mechanism anchors the perpetual futures price to the spot index through a periodic exchange of fees between longs and shorts. Carried out every 8 hours (or every hour on some high-frequency platforms), however, this compulsory settlement introduces a distinctive cyclical imbalance into the order book's microstructure.
When the funding rate is positive and high (which is relatively common in the crypto market's systematic long bias), longs must pay a fee to shorts. For cost-sensitive traders and arbitrage funds, their collective avoidance behavior — briefly closing positions before the settlement moment (such as UTC 00:00, 08:00, and 16:00) and re-establishing them afterward — has a cyclical structural effect on the order book.
In an empirical study of cryptocurrency perpetual futures, Ruan and Streltsov (2022) found that the spot bid-ask spread and trading activity exhibit a U-shaped pattern within the 8-hour funding rate cycle: in the period approaching funding settlement, informed trading and adverse selection rise (more markedly when the absolute value of the funding rate is large), prompting market makers to widen their quoted spreads [15]. This cyclical variation in liquidity, driven by an institutional mechanism, constitutes the empirical basis for the "depth tide" fingerprint in Section 8.5.2.
8.3.3 Order book fragility under high leverage
Leverage is the core attraction of derivatives markets, but from a microstructural perspective it brings both capital efficiency and systemic risk. To understand the fragility of the perpetual futures order book, one must first understand the highly nonlinear mathematical relationship between the leverage multiple and the "liquidation distance" (the percentage margin by which the current price is separated from the price that triggers forced liquidation).
In the most simplified model, the liquidation distance can be approximated as 1/leverage. The actual liquidation-trigger mechanism, however, is far more complex than this simplified formula. First, the existence of the maintenance-margin ratio further shortens the liquidation distance: for an isolated-margin long (entry price , leverage , maintenance-margin ratio , ignoring fees and funding), the exact liquidation distance is , whereas is only a first-order approximation under small (for the short direction the denominator should become ). Taking Binance as an example, the maintenance-margin ratio corresponding to the highest leverage tier for BTCUSDT is about 0.4%; by this approximation, the actual liquidation distance at 100x leverage is not 1% but about 0.6% (the exact expression gives , consistent with the approximation). Note that the formula above does not include opening/closing fees and accumulated funding, both of which would further shorten the actual liquidation distance. Second, liquidation behavior differs fundamentally between isolated-margin and cross-margin modes: under isolated margin, the liquidation distance is determined strictly by the margin of the individual position, whereas under cross margin all available account balance can be used to maintain the position, so the liquidation distance depends on the account-level aggregate risk exposure. In addition, most mainstream exchanges have introduced a tiered margin-ratio system, in which large positions require a higher maintenance-margin ratio than small ones, as well as partial-liquidation mechanisms (reducing position size before full liquidation in an attempt to restore margin adequacy) and auto-deleveraging mechanisms. These institutional-level nuances have a material effect on the actual timing of liquidation triggers and on the transmission speed of the cascade.
This inverse relationship means that as the leverage multiple increases, the margin for error contracts exponentially. For a moderate investor using 2x leverage, the market would need to move about 50% adversely to trigger liquidation, which usually requires an extreme macro black-swan event; at 10x leverage, the liquidation distance shrinks to about 10%, which falls within the range of normal monthly or even weekly volatility in the crypto market.
When the leverage multiple is pushed up to 50x, 100x, or even 125x, however, the situation changes qualitatively. The liquidation distance corresponding to 100x leverage is a mere 1%; at 50x leverage it is only 2%. We define the region where the liquidation distance is less than 2% as the "extreme-risk zone." In a market such as cryptocurrency — where Bitcoin's average daily volatility can reach 3% to 5% (based on the median range of the absolute value of daily BTC/USD returns from 2023 to 2025), and altcoin volatility is higher still — a price movement of 1% to 2% falls within the normal range of the market's everyday volatility.
In the euphoric phase of a bull market, large numbers of retail traders and aggressive capital pour in, using extremely high leverage to build long positions. This produces a microtopological structure with a high degree of systemic risk: the liquidation price lines of a vast number of traders overlap heavily and cluster within a narrow band just 1% to 2% away from the current market price.
This position-distribution feature caused by high leverage is structurally embedded in the fragility of the order book. In such an environment, no macro bad news and no deterioration in fundamentals are needed; the normal fluctuation of order book liquidity, or the ordinary market impact caused by a medium-sized market order, is enough to move the price down by 1%. This tiny 1% drop instantly touches the first dense liquidation cluster, detonating the liquidation-cascade chain reaction described in Section 8.3.1.
Therefore, the extreme fragility that the perpetual futures order book exhibits when facing liquidation pressure is not a technical defect of the matching engine, nor an accidental market failure, but an inevitable product of the institutional design of high leverage, and it directly constrains the order book's resilience under extreme stress.
If 100x leverage means almost certain liquidation under normal volatility, why do so many traders still choose it? The prospect theory of Kahneman and Tversky (1979) offers an explanatory framework [16]: humans exhibit a systematic distortion of probability weighting when evaluating low-probability events, tending to assign excessive subjective weight to low-probability, high-payoff events. The potential payoff under 100x leverage (a 1% price movement leveraging a 100% return on principal) is experienced psychologically as a kind of "lottery ticket," and its extremely asymmetric profit-and-loss structure precisely caters to this bias in the probability-weighting function.
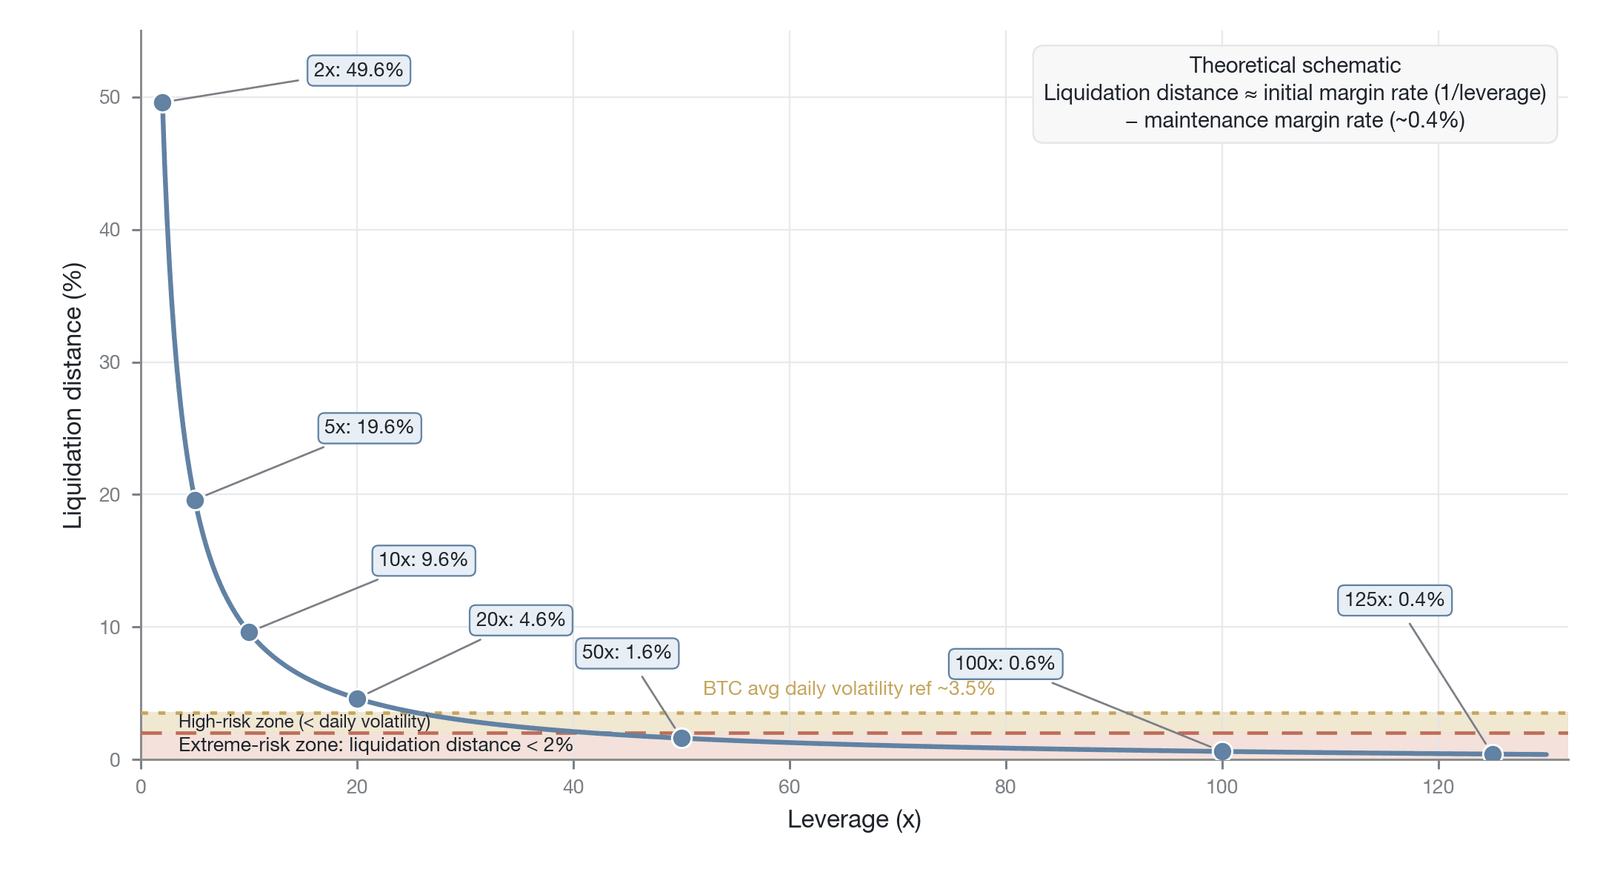
Figure 8-7. The nonlinear relationship between the leverage multiple and the liquidation distance
Note: This figure is a theoretical illustration. The curve is drawn according to "liquidation distance ≈ initial margin ratio (1/leverage) − maintenance-margin ratio (about 0.4%)," consistent with the exact expression in this section, and all labeled points are theoretical calculations, not empirical data. The hyperbola shows that once the leverage multiple exceeds 20x, the liquidation distance enters a steeply declining segment, in which the liquidation distance reduced by each additional unit of leverage is disproportionately amplified. The "extreme-risk zone" in the figure (liquidation distance < 2%) and the BTC average-daily-volatility reference line (about 3.5%, taken from the 3%–5% range in the main text) together delimit an operational dividing line: high-leverage positions falling within this zone can be liquidated under everyday price movements, which mathematically explains why liquidation events cluster and erupt in the high-leverage range. The behavioral explanation for the high-leverage preference follows Kahneman and Tversky (1979) [16]; "1979" is the publication year of prospect theory, not a data point.
8.3.4 The divergence signal between mark price and traded price
In traditional spot markets, the price is singular: the price of the most recent matched trade is the current market price. To prevent market manipulation and unfair liquidations caused by anomalous wicks, however, perpetual futures introduce a dual-track price system: the last traded price and the mark price. These two prices play distinct yet intertwined roles in the order book microstructure.
The last traded price, abbreviated LTP, is the final result of the actual matching of buyers' and sellers' funds on the order book; it reflects the instantaneous supply-demand balance on that specific exchange at the current microsecond. It is directly affected by that exchange's local liquidity depth, the impact of large orders, and market-maker behavior.
The mark price, by contrast, is a synthetic indicator, typically computed from a price index of several leading spot exchanges (such as Binance, Coinbase, and Kraken) plus a funding basis that decays over time. Its core function is to calculate users' unrealized profit and loss and to serve as the sole benchmark price for triggering forced liquidations. The mark price was designed from the outset to filter out short-term anomalous fluctuations on any single exchange's local order book.
The specific construction of the mark price — the weighted or median synthesis of the spot prices of multiple constituent exchanges, the removal of outlier constituents that deviate from the median beyond a threshold, and the exponential-moving-average smoothing of the basis between the perpetual price and the index price, together with the differences across exchanges in algorithm and sampling window — belongs to the domain of price-benchmark governance, which Chapter 14 develops systematically. For the purposes of this chapter, it suffices to grasp the essential point: this multi-source synthesis and smoothing is exactly what lets the mark price screen out short-term anomalies on any single exchange's local book.
Well designed as it is, the mark price mechanism still faces operational risk. The Mango Markets incident of October 2022 provides a cautionary case: the attacker manipulated the oracle quote by artificially pushing up the token price on a constituent exchange with extremely low liquidity, thereby raising the mark price, and on that basis borrowed and withdrew more than $110 million in assets (>$110M, on the CFTC/DOJ/SEC basis) [17]. In addition, under extreme market conditions, the price feeds of constituent exchanges may be delayed by API failures or network congestion, causing the mark price to fail to reflect the true state of the market in time and thereby creating the risk of improper or delayed liquidation.
Under a normal liquidity environment, cross-exchange arbitrageurs quickly eliminate any small spread between the LTP and the mark price, keeping the two closely aligned. Makarov and Schoar (2020) show that cross-exchange price deviations in crypto markets are typically small in normal times but widen significantly during periods of market stress, and that frictions in capital flows are the main reason price deviations persist [18].
A distinction is needed: three layers of price deviation exist in perpetual futures markets. The first layer is the deviation between the traded price and the mark price within the same exchange, which reflects the degree of supply-demand imbalance on that exchange's local order book. The second layer is the deviation of the price of the same contract across different exchanges — the cross-exchange arbitrage opportunity studied by Makarov and Schoar (2020) [18]. The third layer is the basis deviation between the perpetual futures price and the spot price, which is the target the funding rate mechanism seeks to correct. All three layers of deviation are at low levels in a normal market but widen synchronously and reinforce one another during a crisis.
When the market encounters extreme volatility, however, or when a particular exchange's local liquidity faces exhaustion, these two prices diverge significantly.
This divergence is itself a highly valuable microstructural signal. When the LTP falls significantly below (or rises significantly above) the mark price, and the magnitude of the deviation exceeds the normal arbitrage-cost threshold, it clearly indicates that this exchange's local order book is bearing enormous one-directional selling pressure (or buying pressure) and that market makers and arbitrageurs have stopped providing liquidity because the risk is too high or their capital is exhausted. The local liquidity reservoir has dried up and can no longer effectively maintain the anchor between the price and the global macro fair value.
The degree of divergence between the LTP and the mark price can therefore be regarded as a real-time gauge of the pressure borne by the order book. When constructing an advanced trading algorithm or risk-control system, this deviation indicator should be used as a key supplementary signal to the state dashboard (as described in Section 8.1.4). It also demonstrates, conversely, the importance of using the mark price for liquidation: if, at the instant a liquidity drought causes the LTP to plunge, the system were to use the LTP to trigger liquidations, countless positions that were originally safe would be liquidated unjustly, setting off an even more devastating death spiral. The mark price mechanism is a necessary institutional safeguard for high-leverage derivatives markets.
8.3.5 Open interest as a harbinger of latent order flow
Synthesizing the analysis above, we must extend our view from the instantaneous snapshot of the order book to a macro indicator that measures the market's overall stock of leverage — namely open interest, abbreviated OI. OI represents the total value or total quantity of all derivatives contracts that have been matched and executed but not yet closed and settled at a specific moment.
Within the framework of microstructural analysis, open interest is not merely a static size figure; at the analytical level, its essence is a macro reservoir that foreshadows latent future order flow. The logic can be stated briefly as follows: derivatives trading is a zero-sum game, and every contract currently in an open state (whether long or short) will, at some future moment, be closed out through a trade in the opposite direction. The 10 BTC a trader buys to open a long today will ultimately be closed by an opposing trade — whether the holder actively sells or the liquidation engine or auto-deleveraging mechanism closes the position. In a low-leverage traditional market, these future closing order flows are typically dispersed, rational, and price-sensitive. In the high-leverage environment of perpetual futures, however, the situation is entirely different. As noted earlier, a considerable proportion of the vast OI is composed of high-leverage capital. This means that this portion of latent future order flow is highly likely, when the market encounters headwinds, not to appear as gentle limit orders but to be converted into forced market orders executed automatically by the liquidation engine, potentially far larger than normal in scale. The absolute size of OI, the growth slope of OI, the market's long-short position ratio, and the density of leverage distribution across different price ranges inferred from on-chain data therefore constitute the core set of indicators for assessing the potential fragility of the current order book under future stress.
An order book that on the surface has low volatility and symmetric, ample bid-ask depth is misleading in its appearance of "health" if lurking behind it are open interest at a historical high, an extremely skewed long-short ratio (for example, a markedly elevated share of retail long positions), and a large accumulation of high-leverage positions clustered just below the current price. Once a tiny price fluctuation triggers the first round of liquidations, the latent closing pressure embedded in the vast OI rapidly converts into a large-scale one-directional forced-liquidation order flow.
In quantitative analysis, the OI-to-market-cap ratio is widely regarded as a core indicator of the degree of leverage accumulation for a specific asset. When this ratio spikes into the historically high zone, it becomes a highly salient early warning: leverage within the system has reached a historical extreme, and any tiny disturbance may trigger a violent deleveraging process. The introduction of this indicator elevates static order book analysis to the level of dynamic systemic-risk assessment, and it takes on diagnostic value that directly determines the efficacy of the analysis when the superposed effect of the four fingerprints is discussed later.
OI as a measure of leverage accumulation, however, has several inherent limitations. First, the statistical measure of OI includes a large volume of hedged positions (for example, in a delta-neutral strategy both the long and short legs are counted in OI, yet their net directional risk is zero). Second, different exchanges differ in how they compute OI (whether by number of contracts or by dollar value, whether expired-but-unsettled positions are included, and so on), so a simple aggregation across exchanges may result in double counting. A rise in the OI-to-market-cap ratio therefore does not necessarily indicate the accumulation of directional leverage. The net long-short ratio (that is, , the share of the difference between long OI and short OI in total OI) and the estimated leverage ratios computed by third-party data platforms, as complementary indicators, can more precisely reflect the actual degree of directional-risk accumulation in the market.
8.4 Topological features of the order book
The order book is not merely a matching engine but a complex information machine. Cont, Stoikov, and Talreja (2010), through statistical modeling of the limit order book, demonstrated that the order book's shape features (rather than merely the absolute value of depth) have significant predictive power for short-term price movements [19]. The order book therefore possesses not only a "size" that reflects market capacity (that is, depth) but also a "shape" that reflects the market microstructure (that is, topological features). The shape of the order book — including its symmetry, slope, and convexity/concavity — carries rich information about the balance of directional forces and the composition of participants. Combined with the signal channels described earlier, these topological features constitute a mapping from micro-morphology to macro market states.
8.4.1 Symmetry and asymmetry
In analyzing the order book's topological structure, symmetry is one of the most intuitive and important features — the core dimension for quantifying the balance of buying and selling forces. In a fully "healthy" market in a random-walk state, the depth distribution on the two sides of the order book is typically approximately symmetric. This symmetry indicates that market makers and liquidity providers assess the risk of a price move in either direction as balanced, and that the forces of buyers and sellers are roughly equal.
When the market develops a directional preference or expectation, however, the symmetry of the order book breaks. The emergence of asymmetry is a clear signal that a significant change is occurring in the market microstructure. For example, when bid-side depth significantly exceeds ask-side depth, it usually means that buying power is dominant and that the market may face upward pressure. From the market maker's standpoint, however, this asymmetry may carry a different message: buyers may be exhibiting an overly aggressive tendency, while concentrated sell orders not yet revealed may exist at higher price levels above. Conversely, if bid-side depth thins while ask-side depth remains thick, this often indicates that selling power is dominant, or that market makers have become more cautious on the bid side.
In perpetual futures markets, asymmetry carries a special meaning that spot markets lack. Because of high leverage and the forced-liquidation mechanism, order book asymmetry often carries key information about liquidation risk. If bid-side depth suddenly thins sharply at a specific price level below the current price, this very likely means that market makers foresee a large cluster of long-liquidation trigger prices near that level. To avoid becoming the counterparty to toxic order flow in a liquidation cascade, market makers selectively withdraw bid orders in that region. In perpetual futures, therefore, asymmetry is not merely a reflection of directional pressure but an early-warning signal of the market's endogenous fragility.
8.4.2 Slope and convexity/concavity
Beyond symmetry, the slope and the convexity/concavity of the order book are two further key dimensions for describing its topological features. Slope is defined as the rate at which resting depth decays as distance from the mid price increases. It reflects the distribution of liquidity along the price axis and directly determines the market's capacity to absorb the impact of large orders.
A gentle slope means that liquidity is evenly distributed across a relatively wide price range. In this configuration, even a relatively large market order produces only relatively mild price slippage, because the subsequent depth can quickly take over and absorb the impact. Conversely, a steep slope indicates that liquidity is highly concentrated near the mid price. Once the price moves beyond this narrow high-liquidity band, the market rapidly enters a thin liquidity vacuum. In an order book with a steep slope, the market's impact-absorption capacity is significantly reduced, and even a tiny order imbalance can trigger a violent price jump.
Convexity/concavity, in turn, is the rate of change of the slope; it reveals the second-derivative feature of order book depth. A normal order book typically exhibits a "convex" shape — that is, depth decays at a decreasing rate as the price deviates from the mid price, with the decline in depth becoming gentler the farther out one goes. When the order book exhibits a "concave" feature, however — that is, depth drops sharply at a specific price level and then recovers only slowly in a farther price range — this usually means that some "structural obstacle" exists in the market microstructure.
In the context of perpetual futures, this structural obstacle that gives the order book a concave shape is, in the vast majority of cases, the dense liquidation-price zone. Market makers' strategic retreat carves a distinct "pit" into the depth curve. Anomalous changes in convexity/concavity — especially the emergence of a concave feature — are therefore an important topological indicator for identifying the accumulation of liquidation risk and assessing the market's extreme fragility.
8.4.3 Order book morphology
By combining topological features such as symmetry, slope, and convexity/concavity, we can classify the complex shapes of the order book into five typical morphologies. These five morphologies form a continuous spectrum reflecting the market's different phases, from extreme calm to extreme panic.
At one end of the spectrum is the "thick book" morphology, the typical representation of the market in its healthiest state: order book depth is ample, the two sides are highly symmetric, the slope is gentle and exhibits normal convexity, the market has an extremely strong impact-absorption capacity, volatility is at a low level, and market makers' willingness to supply liquidity is abundant.
When market activity declines, the order book often evolves into the "thin book" morphology, in which overall depth is limited but symmetry is still fairly well preserved. It typically appears during low-activity periods such as weekends, holidays, or the late night of a particular time zone; although depth is shallow, the absence of pronounced one-directional pressure keeps the market in a relatively balanced state.
Further deterioration presents as the "skewed book" morphology: when the market develops directional pressure or when market makers engage in one-sided risk avoidance, the order book exhibits pronounced asymmetry — deep on one side, shallow on the other. This is common in trending markets or when the price gradually approaches an important support or resistance level.
More extreme still is the "cliff book" morphology unique to perpetual futures markets: below (or above) a specific price level, depth drops abruptly, forming a distinct "cliff." This is direct microstructural evidence of the existence of a dense liquidation zone, marking that leverage accumulation has reached a statistically high level and that market makers are engaged in a defensive withdrawal of liquidity.
At the other end of the spectrum is the "vacuum book" morphology, the hallmark of severe liquidity exhaustion: bid- or ask-side depth has fallen to nearly zero, and market makers have withdrawn entirely from the order book. It typically appears at the peak moment of an extreme crisis event, such as when a liquidation cascade is in full swing, at which point the market has lost any meaningful pricing capacity.
Figure 8-8 arranges the five morphologies along a continuous spectrum from maximum resilience to complete fragility. This arrangement reveals a structural regularity: the progression from "thick book" to "vacuum book" is not a random jump but an ordered degradation — depth contracts, symmetry breaks, and the slope shifts from gentle to steep until it ruptures — with each phase containing the precursor signals of deterioration into the next.
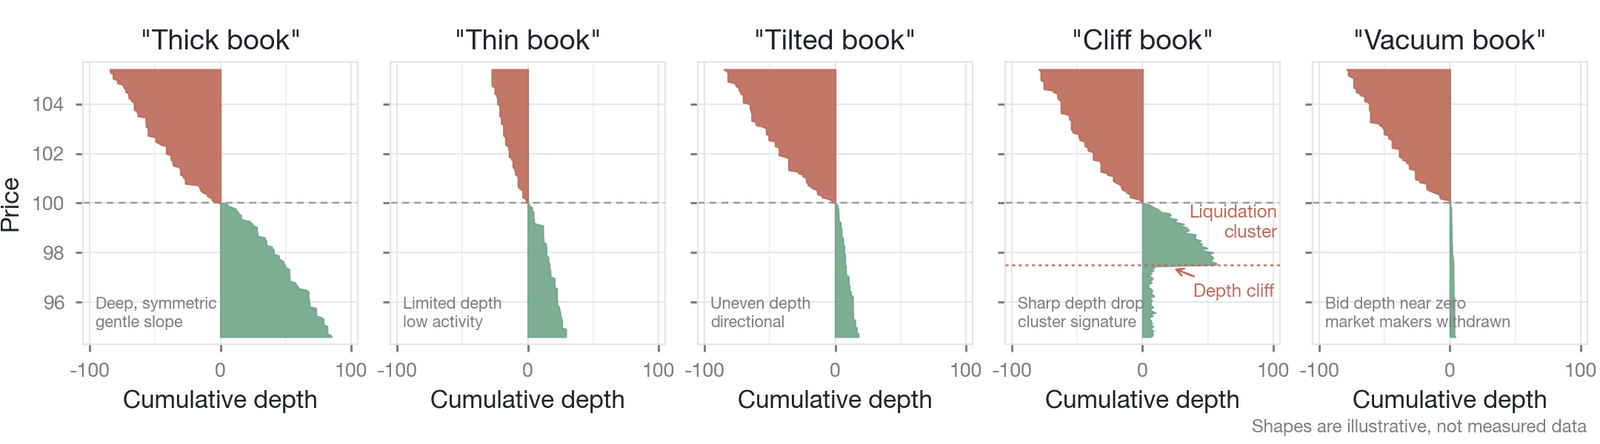
Figure 8-8. A visualization of the five order book morphologies (conceptual illustration of the five order book morphologies; synthetic depth profiles, not empirical data)
From left to right, the figure shows the ordered degradation of the order book from "thick book" to "vacuum book"; the cliff book and vacuum book are morphologies unique to perpetual futures under extreme stress and almost never appear in traditional spot markets. Table 8-3 further summarizes, in a feature matrix, the differences among the morphologies along three dimensions — topological features, market implications, and typical occurrence scenarios — providing traders and risk managers with a rapid classification and diagnostic framework based on topological features.
| Morphology | Topological features | Market implications | Typical occurrence scenario |
|---|---|---|---|
| "Thick book" | Ample depth, symmetric on both sides, gentle slope | Market healthy, strong impact-absorption capacity | Calm periods, low volatility, ample market-maker confidence |
| "Thin book" | Limited depth, but still symmetric | Low market activity, no pronounced directional pressure | Weekends, holidays, or liquidity-trough periods |
| "Skewed book" | Deep on one side, shallow on the other, pronounced asymmetry | Presence of directional pressure or one-sided market-maker risk avoidance | Trending markets, or when the price approaches an important support/resistance level |
| "Cliff book" | Depth drops abruptly near a certain price level, exhibiting concavity | Unique to perpetual futures: dense liquidation zone, defensive market-maker retreat | Leverage-accumulation periods, with the OI-to-market-cap ratio markedly elevated |
| "Vacuum book" | Depth on one side (usually the bid side) is nearly zero | Liquidity collapse, complete market-maker retreat, liquidation cascade underway | The peak moment of an extreme crisis event (such as a flash crash) |
Table 8-3. The feature matrix of the five order book morphologies (Data source: compiled by the author)
8.4.4 The mapping between morphology and market state
The evolution of order book morphology is not random; it maps strictly onto the deterioration of the macro market state. The transition from "healthy" to "collapsed" exhibits complex dynamics in which continuous deterioration and nonlinear jumps coexist. During the evolution from "healthy" to "tense" to "fragile," the changes in the order book's topological structure are indeed traceable and approximately continuous: the gradual widening of the spread, the progressive contraction of one-sided depth, and the steady climb of the cancellation rate all constitute traceable precursor warning signals. The transition from "fragile" to "collapsed," however, may exhibit a phase-transition-like nonlinear jump. Sornette's (2003) research on critical phenomena in financial markets shows that systemic collapse often manifests as "quasi-continuous" micro-deterioration that, upon reaching a critical threshold, suddenly triggers a violent qualitative change at the macro level [20]. The empirical observation that "70% of the damage was concentrated within 40 minutes" in the October 2025 event is precisely a textbook feature of a critical transition: the system had already accumulated sufficient fragility at the micro level, but the macro-level collapse, once triggered, erupted in a discontinuous manner, with no gradual transitional phase available for intervention in between.
The starting point of this continuous deterioration is the transition from healthy to tense, manifested as the evolution from "thick book" to "skewed book." When the market receives an initial shock or a directional expectation begins to form, the spread starts to widen, one-sided depth begins to contract, the order book evolves from a symmetric "thick book" into an asymmetric "skewed book," and the market-maker cancellation rate begins to rise, indicating that their sensitivity to risk is increasing. As leverage accumulates further and the price moves in an adverse direction, the market slides from tense into fragile: market makers foresee liquidation risk and begin to actively withdraw liquidity near the dense liquidation zone, and the "cliff book" morphology appears on the order book. This is the key marker that the market has entered a highly fragile state, indicating that even a tiny shock could trigger a chain reaction. Once the price breaks through the residual depth above the "cliff" and touches the liquidation trigger line, the market plunges from fragile into the collapse phase: a large volume of forced market orders floods in, market makers instantly cancel all remaining quotes to control their own risk exposure, bid-side depth is entirely consumed, the order book evolves into a "vacuum book," and the positive feedback loop of the liquidation cascade unfolds in full. When all the liquidation momentum has been released, the market enters the long process from collapse to recovery: the price stabilizes at the bottom, market makers re-enter the market with smaller order sizes and wider quote intervals, and the order book gradually recovers to a "thin book" morphology with limited depth. Only with the passage of time and the gradual rebuilding of confidence can depth slowly return to the "thick book" state. It should be noted that the speed of this recovery is often far slower than the speed of the collapse, reflecting the asymmetry of perpetual futures market resilience.
Figure 8-9 uses a state-transition diagram to map the characteristic microstructural signal corresponding to each phase transition (each transition signal is labeled in the figure). Particular attention should be paid to the pronounced asymmetry of the recovery path: the return from collapse to health is far longer than the deterioration path and must pass through a gradual rebuilding of "vacuum book → thin book → thick book," reflecting the time cost of market makers' capital redeployment, risk-model recalibration, and gradual restoration of confidence after an extreme event.
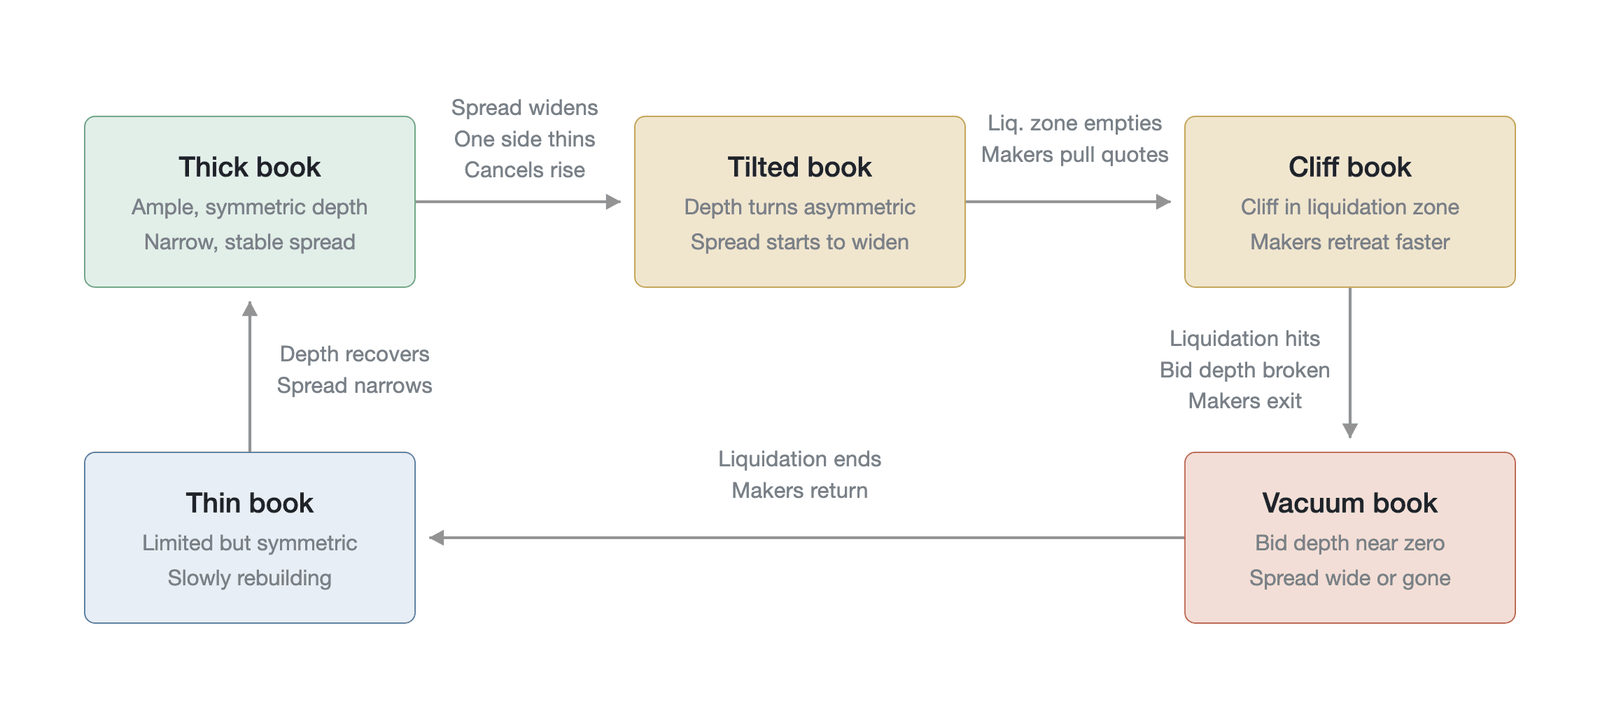
Figure 8-9. The transition path between order book morphology and market state (conceptual illustration of the morphology-to-market-state mapping path, not empirical data)
In theory, an analyst who continuously monitors the evolution of the order book's topological structure can identify the early indicators of rising market fragility before a collapse occurs. This morphology-based diagnostic capability constitutes the core foundation for the discussion of volatility clustering and the construction of a liquidity early-warning system in later chapters.
8.5 The four fingerprints of the perpetual futures order book
The underlying financial rules of perpetual futures (in particular high leverage, forced liquidation, the funding rate mechanism, and the around-the-clock, uninterrupted trading environment) significantly alter their market microstructure. These distinctive institutional features produce observable structural characteristics on the order book, which we call the "four fingerprints." These microstructural patterns simply do not exist in traditional spot markets or in futures markets with an expiry date. The four fingerprints constitute a microstructural diagnostic framework designed specifically for perpetual futures.
8.5.1 The depth cliff
In perpetual futures markets, because of the widespread use of high leverage, traders' liquidation trigger prices often cluster heavily within certain specific price ranges, forming what is called a "dense liquidation-price zone." When the price approaches these zones, a distinct topological feature appears on the order book: the depth cliff. Specifically, bid-side (or ask-side) depth near that price level becomes abnormally thin, and the depth curve exhibits a cliff-like vertical drop.
The cause of the depth cliff is market makers' defensive order cancellation: high-frequency market makers can identify the location of dense liquidation zones with considerable precision and foresee that, once the price touches them, the liquidation engine will throw out the toxic liquidation orders described in Section 8.3.1 (involuntary, entirely price-insensitive, far larger than normal orders). Unwilling to serve as the counterparty here, they sharply reduce their resting orders in that region in advance, or push their quotes to deeper and wider levels, artificially creating a liquidity vacuum. This complete causal chain of "identify the dense liquidation zone → defensive cancellation → liquidity vacuum" was developed in Section 8.2.4.
Figure 8-10 visually shows the formation mechanism of the depth cliff and its spatial overlay with liquidation-price density.
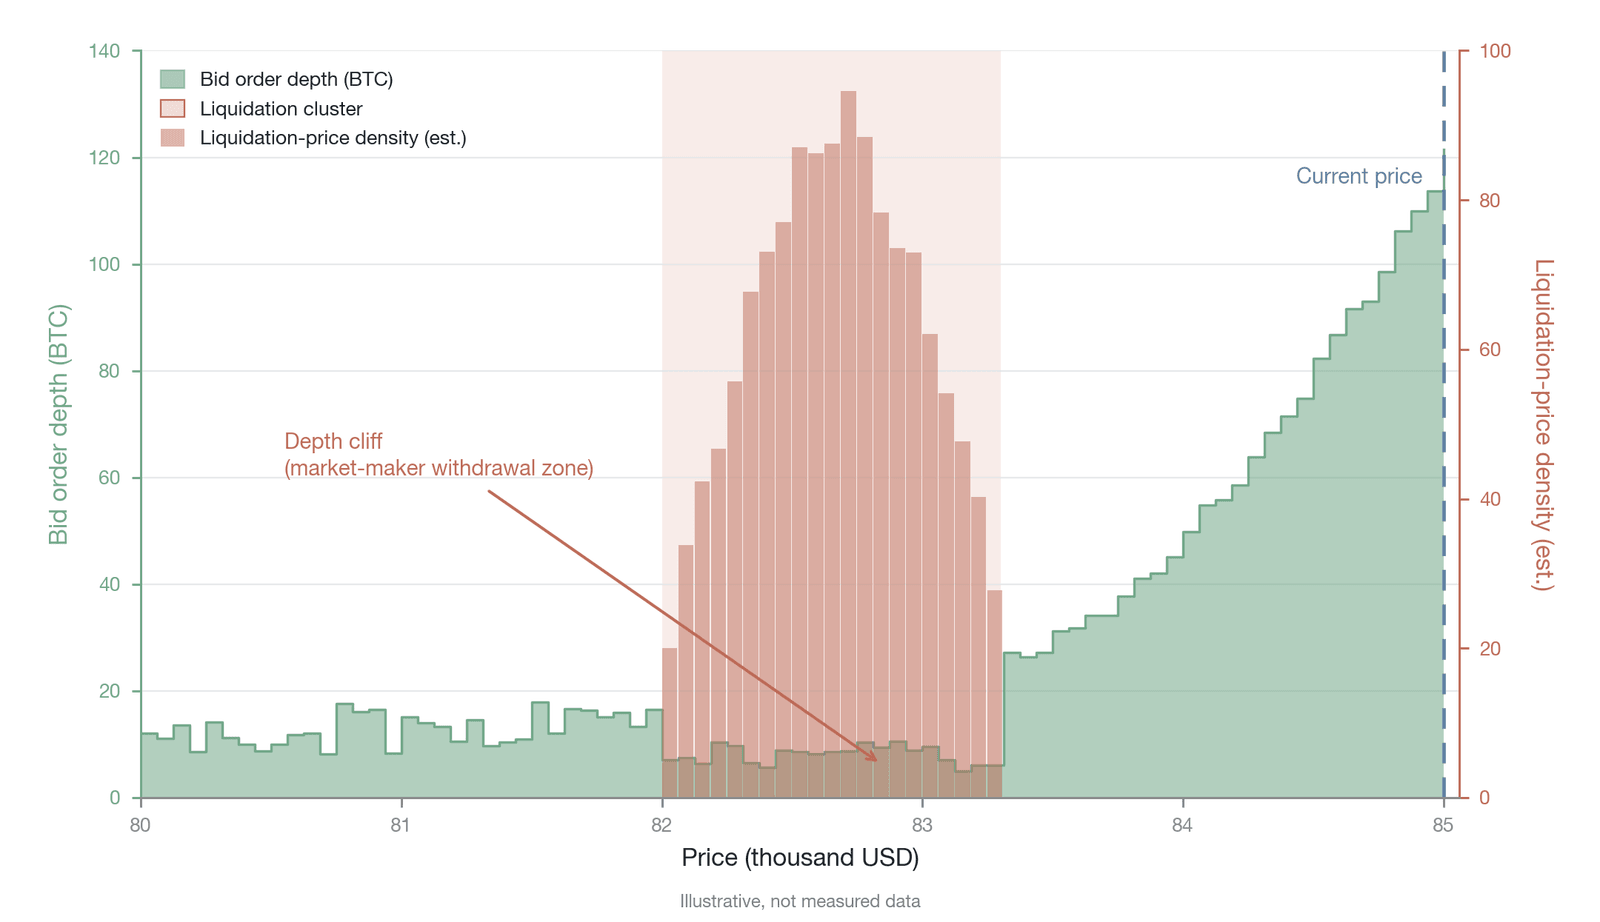
Figure 8-10. The depth cliff at the dense liquidation-price zone (conceptual illustration of the depth cliff; both bid-side depth and liquidation-price density are illustrative, not empirical data)
The existence of the depth cliff gives the dense liquidation zone a dangerous game-theoretic property: it becomes a positive-feedback region with a self-fulfilling tendency. Once the price falls into the cliff region, the lack of sufficient bid support means that even minimal ordinary selling pressure is enough to consume the remaining thin depth and push the price directly to the liquidation trigger line. The triggered liquidation orders then execute continuously in the low-liquidity range that lacks counterparty quotes, causing a violent price plunge that in turn triggers deeper liquidations. This is precisely the core transmission mechanism of the liquidation cascade at the level of the micro order book. In an on-chain transparent environment, this mechanism may even be maliciously exploited and evolve into a strategic liquidity attack.
8.5.2 The depth tide
Perpetual futures anchor the contract price to the spot index price through the funding rate mechanism. This mechanism requires longs and shorts to exchange funds at specific settlement moments (typically every 8 hours, or every hour on some high-frequency platforms). This cyclical institutional arrangement gives rise to the second fingerprint on the order book: the depth tide.
The depth tide manifests as cyclical, predictable fluctuations in the order book's depth, spread, and bid-ask asymmetry around the funding-settlement moment. According to the empirical study by Ruan and Streltsov (2022), this tidal phenomenon is especially pronounced when the expected funding rate is positive (that is, longs must pay shorts) and high [15].
In the several hours approaching settlement, the market experiences an "ebb tide" period. To avoid paying a high funding rate, cost-sensitive long traders choose to close positions briefly before settlement. This significantly increases selling pressure, and the order book develops a pronounced sell-side skew. Funding-rate arbitrageurs, meanwhile, establish short positions to collect the rate, further intensifying sell-side pressure. Faced with this one-directional, structural order-flow imbalance, market makers — to control inventory risk — actively widen the bid-ask spread and reduce resting depth.
After the settlement moment passes, the market enters a "flood tide" period. Longs that had avoided the rate re-establish their positions, arbitrageurs may close and exit, and directional pressure quickly recedes. Market makers accordingly narrow the spread and restore resting orders, and the order book's depth and symmetry return to normal levels.
The morphology and intensity of the depth tide depend heavily on the design of the funding-rate settlement frequency. The traditional 8-hour settlement cycle (such as Binance's UTC 00:00/08:00/16:00) produces the clearest tidal pattern, because the rate accumulates a large enough payable amount over the longer accumulation period that the directional order flow around settlement is sufficient to leave a discernible structural feature on the order book. As exchanges compete to introduce higher-frequency settlement mechanisms (Binance has implemented 4-hour settlement for some trading pairs, and Hyperliquid uses hourly settlement), however, the payable amount at each settlement shrinks correspondingly, and the amplitude of the tide weakens with it. If the settlement frequency were raised further to a near-real-time variable-rate system, the directional impact of a single settlement might fall below the level of market noise, at which point the diagnostic value of the depth-tide fingerprint would be significantly diminished. In addition, in an extreme funding-rate environment (an annualized rate exceeding 100%), the normal tidal pattern may fail entirely: the scale of directional position closing before settlement may exceed market makers' normal absorption capacity, causing the tide to shift from a regular ebb-and-flow into a one-directional liquidity shock.
Figure 8-11 simulates and displays this cyclical tidal process based on the characteristics of empirical data.
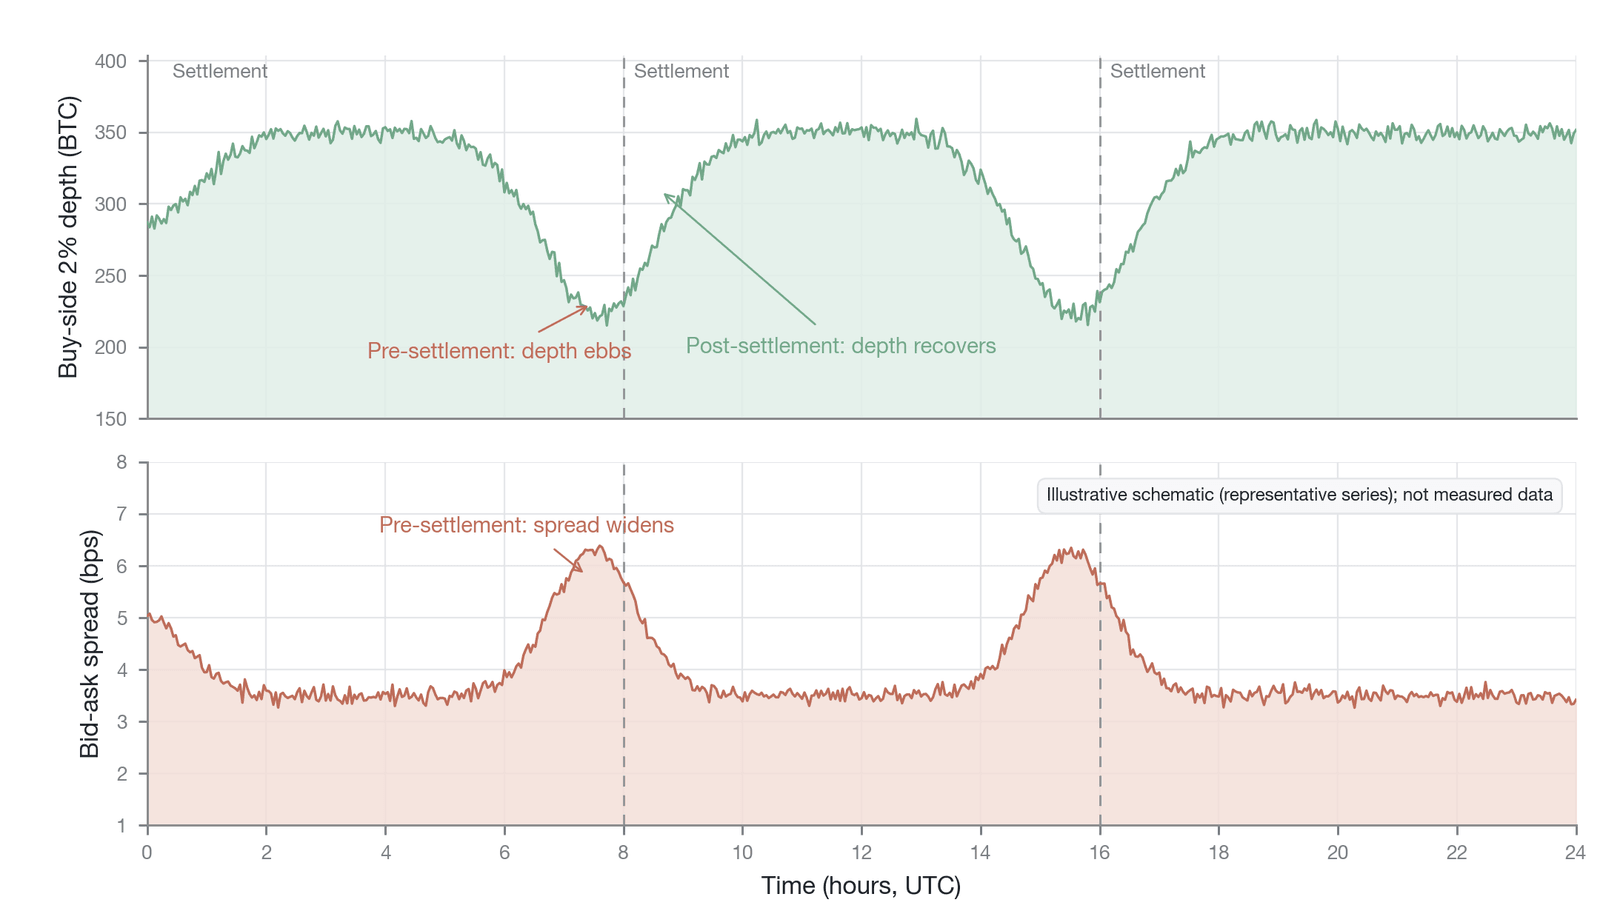
Figure 8-11. The depth tide around funding-rate settlement
Note: This figure is a theoretical illustration drawn from the characteristic parameters of the empirical data in Ruan and Streltsov (2022) [15] (a synthetic illustration of the depth tide, not empirical data). The depth tide is a microstructural feature unique to perpetual futures. It shows that even in the absence of an external macro information shock, internal institutional friction alone is enough to cause a cyclical contraction of market liquidity. For an ordinary trader, executing a large order during the ebb-tide period entails significantly higher implicit transaction costs (slippage).
8.5.3 The liquidity circadian rhythm
The cryptocurrency perpetual futures market is the world's first trillion-dollar financial market to achieve genuine around-the-clock, uninterrupted operation. The continuity of trading hours, however, does not equate to uniformity in the distribution of liquidity. On the contrary, the order book exhibits a third fingerprint highly correlated with the time zones of the world's major financial centers: the liquidity circadian rhythm.
Structurally, this rhythm exhibits a pronounced alternation of peaks and troughs. The absolute peak of liquidity typically appears during the few hours in which the European and American trading sessions overlap (approximately UTC 13:00–17:00). At this time, the world's most important institutional investors, high-frequency market makers, and active traders are online simultaneously, order book depth reaches its maximum, the spread compresses to an extremely narrow level, and the market's resilience in absorbing shocks is strongest.
By contrast, the trough of liquidity appears during the "transition period" between the close of the American market and the full activation of the Asian market (approximately UTC 00:00–05:00), as well as during traditional weekend periods. In these trough periods, the algorithms of many Western institutional market makers may enter a low-risk operating mode or reduce their quoting frequency, causing order book depth to fall significantly below peak-period levels and accompanied by a widening of the spread.
Figure 8-12, by superimposing the activity of different time zones, clearly delineates this 24/7 liquidity rhythm.
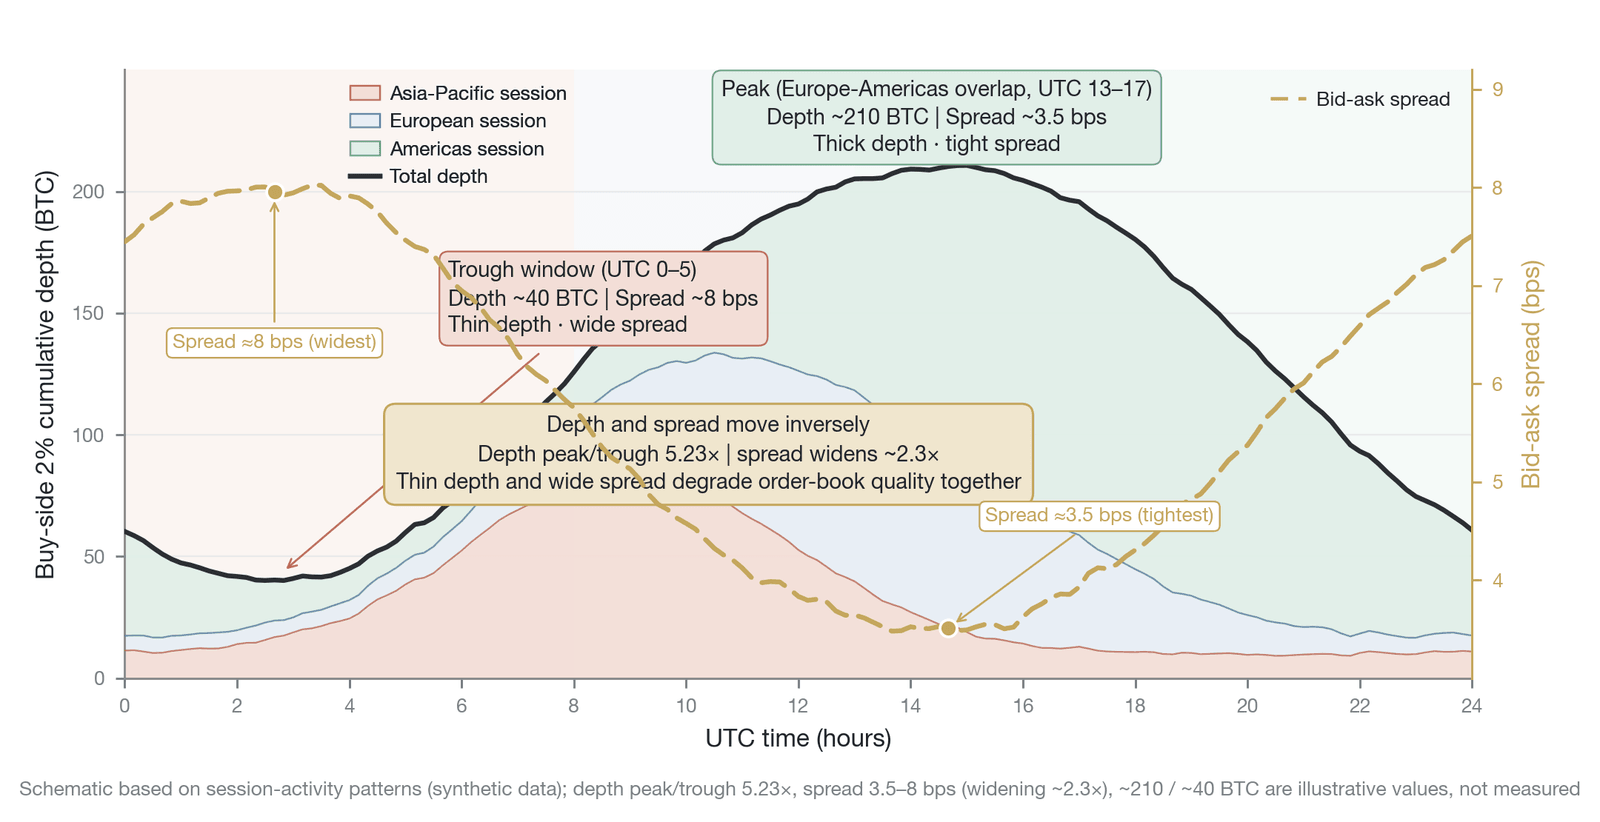
Figure 8-12. The 24/7 liquidity circadian rhythm (a stylized illustration of the 24/7 liquidity circadian rhythm: the peak of about 210 BTC, the trough of about 40 BTC, and the peak-to-trough ratio of 5.23x are synthetic representative values, not empirical data)
The existence of this rhythm reveals a serious endogenous risk of the perpetual futures market. In traditional financial markets, the market-close mechanism functionally serves to interrupt the transmission of negative feedback. The perpetual futures market lacks this interruption mechanism; in its place are cyclical liquidity-trough periods. The problem is that a trough not only fails to cushion shocks but actually becomes a window in which they amplify more easily. If a sudden piece of bad news is encountered during a liquidity-trough period, or a liquidation cascade is triggered, its destructive power is amplified exponentially, because there is simply not enough depth at that time to absorb the selling pressure.
8.5.4 The asymmetric response of the spread
In traditional low-leverage spot markets, the bid-ask spread's response to market volatility is typically approximately symmetric. That is, whether volatility is caused by a price rise or a price fall, market makers synchronously widen the spread and reduce depth on both the bid and ask sides to compensate for the increased adverse-selection risk. In the high-leverage environment of perpetual futures, however, the order book exhibits a fourth fingerprint: the asymmetric volatility response of the spread.
Specifically, during a volatility spike triggered by a sharp price decline, the widening of the order book's bid-side spread is significantly greater than the widening of the ask-side spread during volatility triggered by a sharp price rise. This asymmetry is deeply rooted in the crypto market's systematic long bias and in the asymmetry of the liquidation mechanism.
When the price falls, a large volume of high-leverage long positions faces liquidation. As noted earlier, this produces a massive volume of price-insensitive forced sell orders. Foreseeing this impending large-scale toxic selling pressure, market makers rapidly cancel their bid quotes, causing bid-side depth to plunge to near zero and the bid-side spread to widen nonlinearly.
By comparison, although a price rise also triggers short liquidations and generates forced buy orders, in the vast majority of periods the scale of longs in the crypto market far exceeds that of shorts. The forced-buy impact during a rise is therefore typically smaller in magnitude than the forced-sell impact during a fall. The magnitude and speed of market makers' retreat on the ask side are correspondingly smaller, and the widening of the ask-side spread is relatively mild.
Figure 8-13, through a scatter plot and a fitted curve, visually shows this asymmetric response pattern.
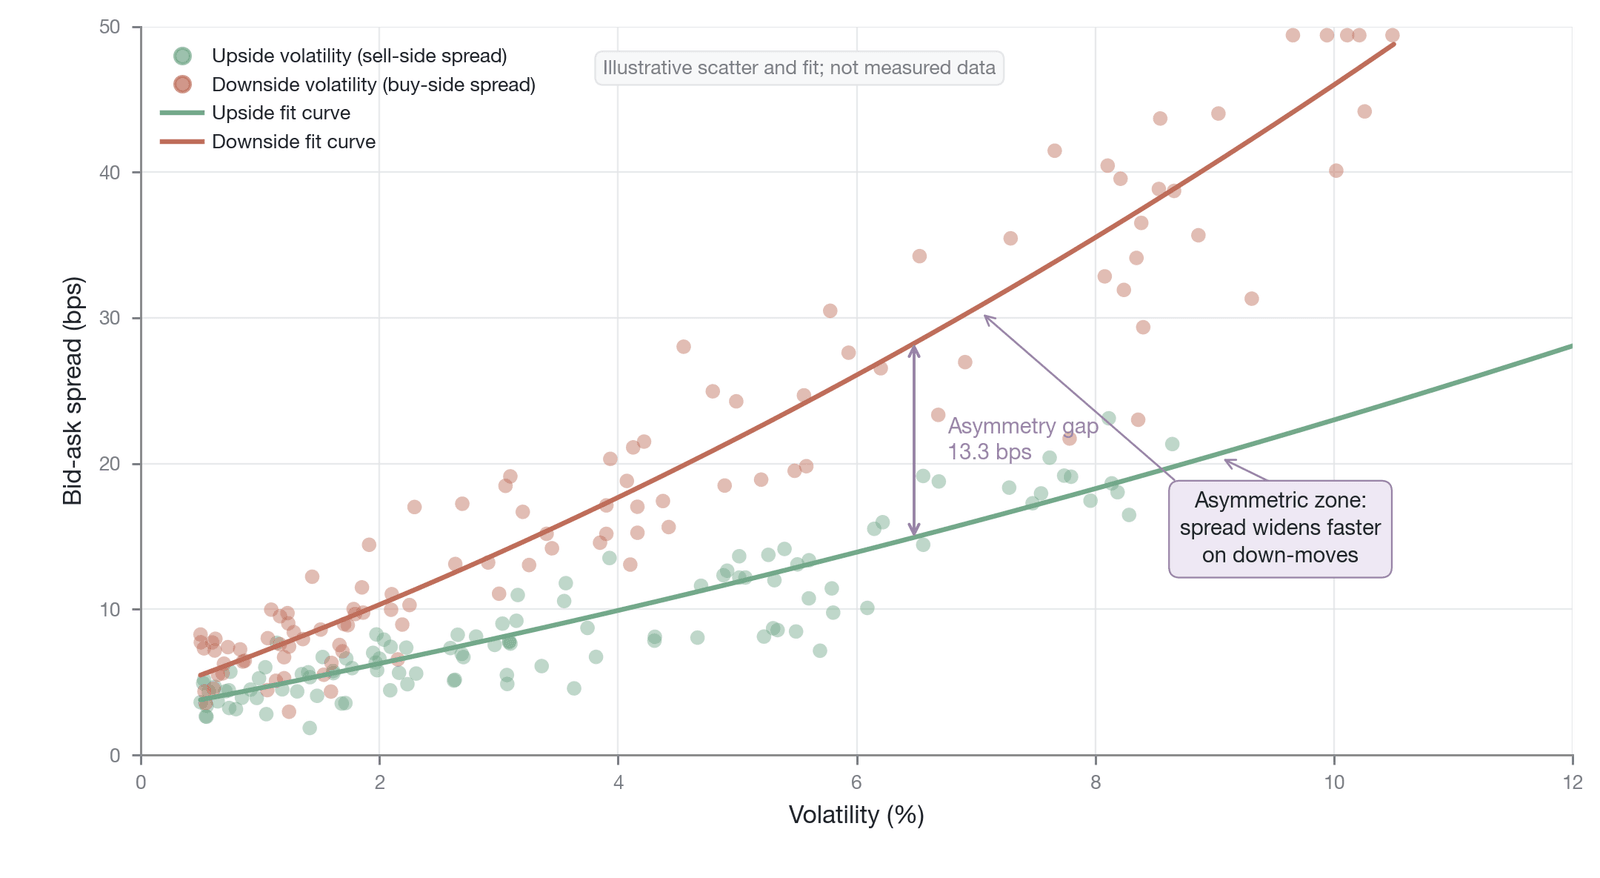
Figure 8-13. The asymmetric volatility response of the spread (a synthetic scatter illustration of the asymmetric volatility response of the spread: the 13.3 basis points is a representative asymmetry gap, not empirical data)
The scatter in the figure reveals this structural skew: the fitted slope of the bid-side spread in the negative-return (decline) range is significantly greater than that of the ask-side spread in the positive-return (rise) range, meaning that under the same magnitude of volatility shock, a decline systematically damages bid-side liquidity more than a rise damages ask-side liquidity. This is precisely the microstructural root of the perpetual futures adage that "declines tend to be faster than rises" — the forced liquidation selling pressure, the rapid retreat of market makers, and the sharp drop in depth occur simultaneously and reinforce one another, forming a high-intensity positive feedback loop.
8.5.5 The superposition effect of the four fingerprints
The four fingerprints described above (the depth cliff, the depth tide, the liquidity rhythm, and the asymmetric response) do not exist in isolation. In specific market environments, they undergo a high-risk resonance and superposition, producing a market-shock magnitude far exceeding that of any single factor. Understanding this superposition effect is key to building an advanced market-risk early-warning system.
In the most dangerous superposition scenario, the market has undergone a prolonged one-directional rise and has accumulated a large volume of high-leverage long positions, and the funding rate remains positive and high (Fingerprint 2: longs are unwilling to close positions, and leverage is locked in). At this point, a dense liquidation-trigger zone has already formed just below the current price (Fingerprint 1: a depth cliff is emerging). If this happens to coincide with a liquidity-trough period on a weekend or in the early Asian morning (Fingerprint 3: depth is at its weakest overall), then once a tiny piece of negative news causes the price to dip slightly, it can easily break through the already-thin bid-side depth. After touching the liquidation line, the enormous selling pressure from long liquidations causes market makers to retreat sharply on one side (Fingerprint 4: the bid-side spread asymmetry widens to an extreme). In that instant, all four fingerprints point simultaneously to "liquidity collapse," and the probability of a flash crash rises sharply.
To monitor this superposition risk systematically, we can construct a "comprehensive perpetual futures order book risk dashboard" (Figure 8-14). This dashboard tracks the state indicators of the four fingerprints in real time, and when multiple indicators simultaneously break through their warning — or even danger — thresholds, it issues the highest-level systemic-risk alert.
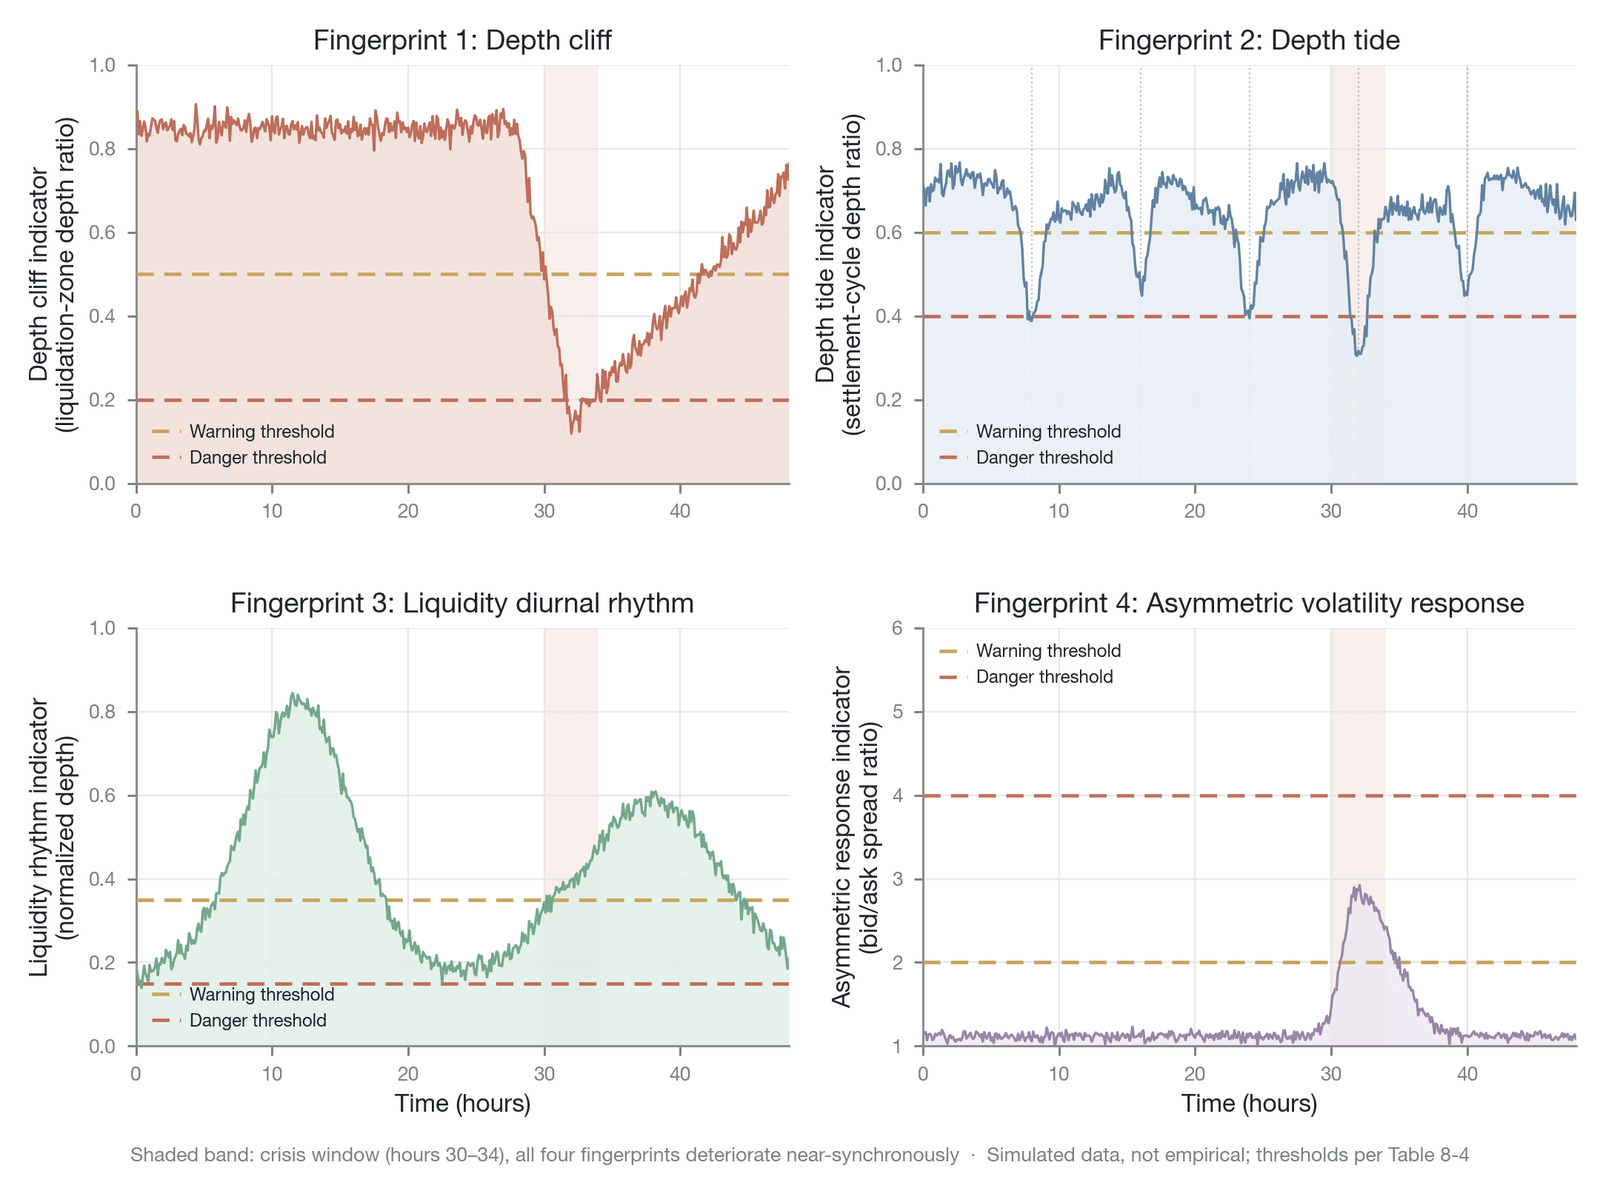
Figure 8-14. The comprehensive risk dashboard of the four fingerprints
Note: This figure is drawn from simulated data based on the characteristic parameters of historical events (the thresholds of the four fingerprints are the author's ratings, not empirical data). During the crisis period (the shaded region), the indicators of the four fingerprint dimensions deteriorate almost synchronously within an extremely short time window. This synchronized deterioration pattern is the core criterion for distinguishing a systemic-risk event from normal volatility. The diagnostic value of the dashboard lies in capturing the synchronized-deterioration signal across multiple dimensions, rather than monitoring the absolute level of any single indicator.
Table 8-4 lists the parameters of this comprehensive diagnostic matrix. The thresholds for each fingerprint dimension are calibrated on the basis of backtesting analysis of multiple historical extreme events, including the October 2025 flash crash (the thresholds are calibrated through historical backtesting; specifically, the distribution of each indicator across multiple extreme events is analyzed statistically, and the corresponding quantiles are selected as the grading boundaries).
| Fingerprint dimension | Core observation indicator | Normal-state benchmark | Warning threshold (entering the tense period) | Danger threshold (approaching the collapse point) |
|---|---|---|---|---|
| Fingerprint 1: depth cliff | Bid-side depth in the dense liquidation zone / average depth in the normal range | > 80% | < 50% | < 20% (market makers have clearly retreated) |
| Fingerprint 2: depth tide | Depth 1 hour before settlement / average depth within the cycle | ~ 90% | < 60% | < 40% (accompanied by an extremely high funding rate) |
| Fingerprint 3: liquidity rhythm | Total depth in the current period / 24-hour peak depth | Naturally fluctuates by period (typically > 50%) | < 35% | < 15% (period of extreme liquidity exhaustion) |
| Fingerprint 4: asymmetric response | Bid-side spread widening rate during a decline / ask-side spread widening rate during a rise | ~ 1.0–1.2 (slight long bias) | > 2.0 | > 4.0 (one-sided liquidity is being drained) |
Table 8-4. The comprehensive diagnostic matrix of the four fingerprints (Data source: compiled by the author)
The threshold settings in the diagnostic matrix above face several applicability limitations, and users should regard them as a methodological framework rather than fixed point estimates. First, the validity of the thresholds depends on a specific volatility regime: an indicator reading flagged as "dangerous" in a low-volatility environment may fall within the normal fluctuation range under a high-volatility regime, and vice versa. Fixed thresholds therefore run the risk of being invalidated by a switch in volatility regime; a more robust approach is to use conditional thresholds — that is, to replace absolute levels with the distributional quantiles of the indicator within a rolling window, so that the thresholds adapt to the market state. Second, the thresholds for Fingerprint 4 (the asymmetric spread response) — normal at about 1.0–1.2, warning at > 2.0, danger at > 4.0 — are at present inferred mainly from the mechanistic narrative of the "systematic long bias" and still lack independent quantitative empirical anchoring; they should be regarded as illustrative. Moreover, all of the above thresholds are calibrated on BTC historical data as a whole, and their extension to altcoins and long-tail assets requires recalibration: the normal-state liquidity level, volatility structure, and participant composition of these assets differ systematically from those of BTC, and applying the BTC thresholds directly may produce a large number of false positives or false negatives. The core value of this matrix lies in providing a multidimensional joint-monitoring diagnostic methodology, not a set of static numbers that can be applied mechanically.
In sum, the four fingerprints of the perpetual futures order book are both the microscopic projection of its distinctive institutional design and microstructural diagnostic tools in their own right. By integrating the signals of these four dimensions, we can move beyond surface-level price fluctuations and systematically identify how liquidity evolves from ample to fragile to collapsed.
8.6 Order book resilience
Operationalizing "resilience" from a vague qualitative concept into a measurable micro indicator is a key step in understanding the dynamic properties of the order book. The preceding sections analyzed the static structure of the order book (depth, slope, morphology) and the four fingerprints of perpetual futures, but all of these analyses are cross-sectional descriptions of the order book state "at a single moment." Introducing the time dimension, we will argue that the resilience of the perpetual futures order book is systematically weaker than that of the spot market — not a technical defect but an intrinsic cost that necessarily accompanies the institutional combination of "high leverage + liquidation mechanism + no expiry date + 24/7 trading." The positive-feedback mechanism of the liquidation cascade makes shocks not only larger in scale but also self-amplifying, thereby significantly lengthening the recovery time. The measurement of resilience provides a key micro foundation for the market-quality assessment in Chapter 25. In the October 2025 flash crash, the market experienced the extreme asymmetry of "collapse in about 2 hours, recovery over more than 24 hours," which is a real-world portrayal of the resilience characteristics of perpetual futures [2].
8.6.1 The operational definition and measurement of resilience
In the market microstructure literature, liquidity is typically decomposed into three dimensions: tightness (the size of the spread), depth (the order size the market can absorb without causing a significant price move), and resilience (the speed of recovery to a normal state after a shock). The first two dimensions are static descriptions of the order book at a single moment, whereas resilience characterizes the order book's dynamic adjustment capacity. In his seminal paper, Large (2007) explicitly proposed that an electronic limit order book possesses resilience when it can rapidly restore its normal shape after a large trade [21]. This definition transforms resilience from a vague intuition into an operational concept that can be empirically tested with time-series data.
We operationally define order book resilience as follows:
the time required for the order book's spread and depth to recover to their pre-shock levels after it is subjected to a standardized shock.
The specific measurement method comprises the following steps. First, select a "standardized shock" as the starting point of the measurement. A standardized shock refers to a market order that consumes a certain proportion (for example, 50% or more) of the depth near the current best bid and ask, or an observable price jump driven by an exogenous event. Record the instant the shock occurs, , at which the spread widens from its pre-shock steady-state level to , while cumulative depth falls from to . Subsequently, track the recovery process of these two core state variables. Record the time required for the spread to recover to the pre-and-post-shock mean , denoted ; record the time required for depth to recover to , denoted [22]. The resilience indicator is a function of these two time variables. The smaller the value of , the faster the market recovers from the liquidity vacuum, and the stronger the resilience of the order book.
A more precise operational definition of "recovery" itself is needed. The framework above uses the midpoint of the pre-and-post-shock mean (that is, a 50% recovery rate relative to the pre-shock level) as the recovery threshold, but different analytical purposes may require different recovery criteria: the values corresponding to a 75% recovery rate and a 90% recovery rate may differ by several fold. In addition, the recovery speed differs significantly across price tiers: depth near the best bid and ask typically recovers fastest, because market makers prioritize re-posting at the most profitable best-price levels, whereas the deeper regions of the order book far from the mid price take longer to recover, because the return to providing liquidity at these levels is lower and the adverse-selection risk is higher [9]. A single value may therefore mask the significant heterogeneity in recovery speed across price tiers.
Empirical research shows that in traditional markets the different dimensions of the order book deteriorate simultaneously after a shock but recover at significantly different speeds. Wuyts (2008) documented this pattern of synchronous deterioration and uneven recovery [22], and Lo and Hall (2015) further confirmed that the spread typically recovers faster than depth [23]. This finding has an intuitive economic interpretation: after a shock, market makers tend to first provide a small amount of liquidity at the best price to narrow the spread (a "tentative" return that carries little risk), and then gradually replenish the depth at each price tier in response to market feedback (a "committed" return that requires greater capital investment and stronger confidence).
This asymmetric recovery pattern of "spread recovers first, depth recovers later" is further amplified in perpetual futures markets. As shown in Figure 8-15, in a typical shock event the spread and depth of the spot market can both recover to close to pre-shock levels within a relatively short time (on the order of minutes). The perpetual futures market, by contrast, not only experiences a larger initial shock (because of the amplification effect of the liquidation cascade) but also follows a more tortuous recovery path, in which a liquidation-triggered "secondary shock" may appear after the initial shock, repeatedly interrupting the recovery process. More critically, perpetual futures depth often cannot fully recover to its pre-shock level but instead stabilizes at a lower "new baseline," reflecting market makers' permanent reassessment of risk exposure after an extreme event.
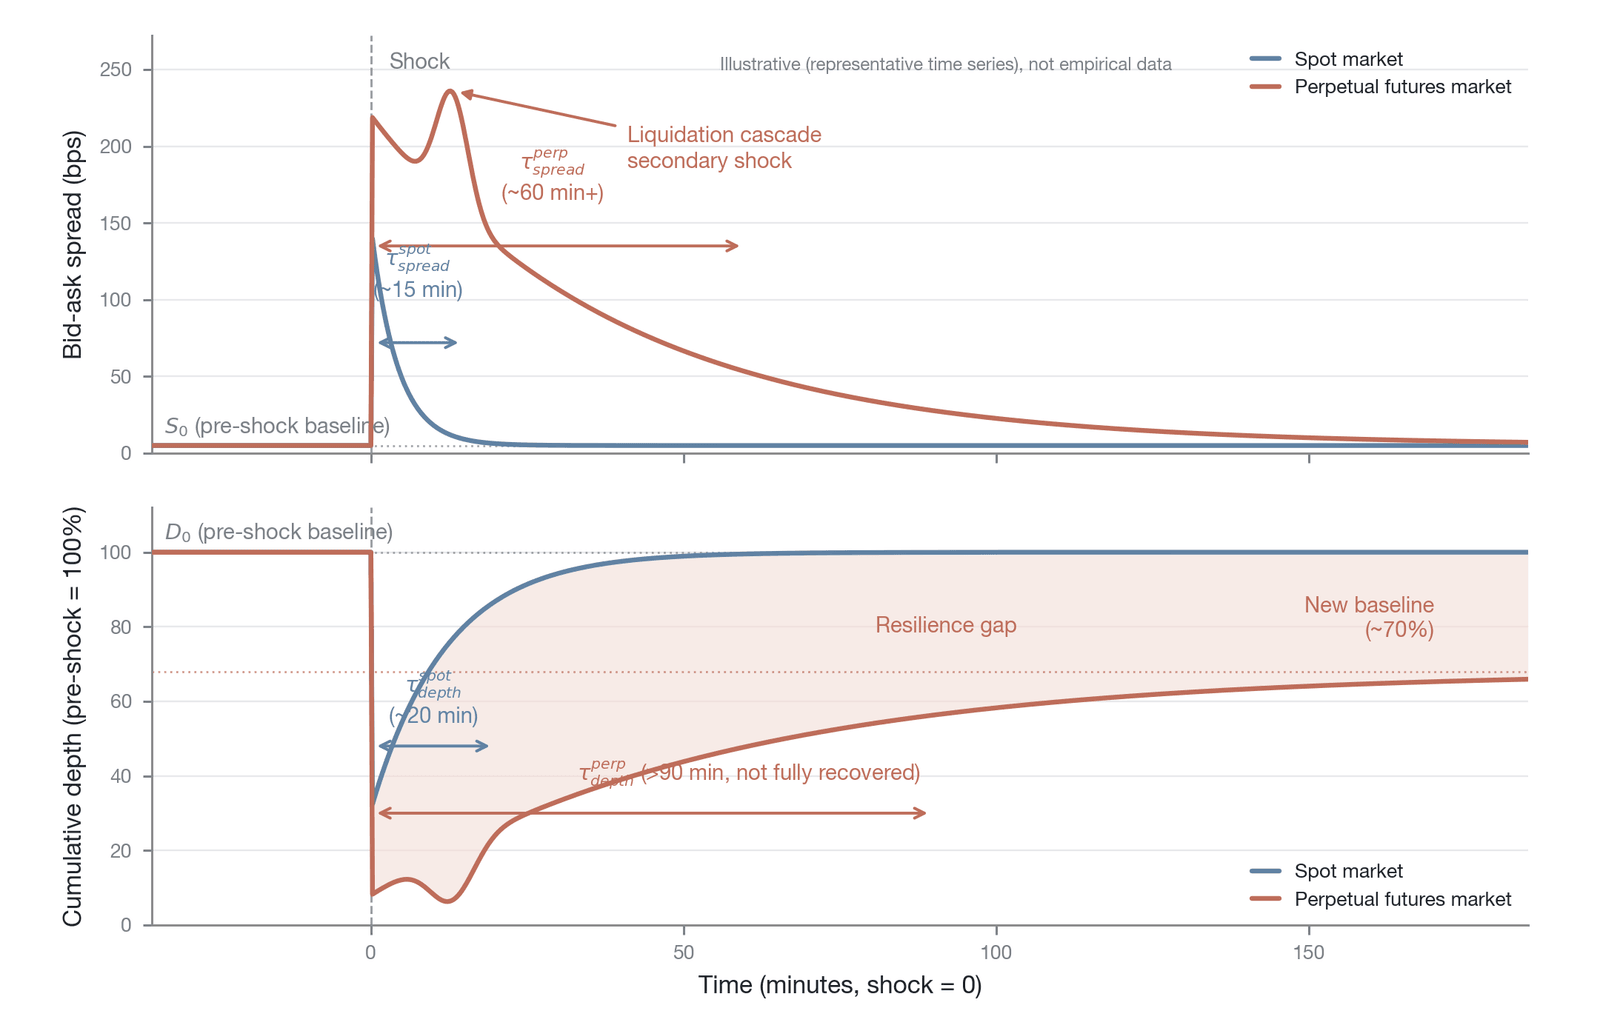
Figure 8-15. The resilience measurement of the shock-recovery time series (a conceptual time-series illustration of order book shock-recovery resilience; the τ, the ~70% new baseline, and similar values are conceptual illustrative values, not empirical data)
The upper and lower panels of the figure track, respectively, the post-shock recovery paths of the spread and of depth. In the spot market (dashed line), both the spread and depth return to close to pre-shock levels within minutes; in perpetual futures (solid line), the initial shock is not only larger ( and are both significantly greater than in spot) but also, in the initial recovery phase, a liquidation cascade produces a "secondary shock" (marked in red in the upper panel as "liquidation-cascade secondary shock"), so that the recovery curve is sawtooth-shaped rather than a smooth monotonic path. More critical is the recovery endpoint: spot depth returns to close to , whereas perpetual depth stabilizes at a significantly lower "new baseline" , with the gap quantifying market makers' permanent reassessment of risk exposure.
8.6.2 The structural disadvantage in resilience
By comparing the recovery paths of perpetual futures and the spot market, one finds that the resilience of perpetual futures is systematically weaker than that of spot. This disadvantage does not stem from a deficiency in technical performance but is caused by three structural reasons derived from its core institutional features.
The foremost structural reason is the positive-feedback mechanism of liquidation. In a spot market, the shock produced by a large sell order is typically a one-time, exogenous event. Once the seller has completed the sale, the selling pressure ends. After absorbing the shock, if market makers assess that no new fundamental information is driving events, they quickly adjust their quotes, and price and depth tend to recover naturally. In perpetual futures markets, however, the situation is entirely different. A large sell order not only produces the initial price shock but is also highly likely to trigger the forced liquidation of leveraged long positions. The liquidation engine throws these positions into the market as market orders, producing a new round of selling pressure. This new selling pressure pushes the price down further, thereby triggering deeper liquidations. The shock is no longer an isolated one-time event but a self-amplifying positive feedback loop. Market makers are keenly aware of the destructive power of this positive feedback loop. After a shock, therefore, a rational market maker will not immediately provide liquidity but must wait until "all liquidations that can be triggered have been completed" and confirm that the selling pressure has been thoroughly exhausted before beginning to slowly restore quotes and depth [2]. This rational behavior of "waiting for the liquidations to end" is precisely what lengthens the duration of the market's low-resilience state.
The flash crash of October 10, 2025, provides extreme empirical evidence of this mechanism. FTI Consulting's post-mortem report noted that on that day the depth near the best bid of BTC perpetual futures contracted by more than 90%, and the bid-ask spread widened from the normal single-digit basis points to double-digit percentages [2]. Two different depth measures must be distinguished: the ">90%" contraction described under "stress depth" in Section 8.2 characterizes the instantaneous stress-depth collapse at the 21:15 UTC cascade peak, whereas the following persistent decline characterizes the residual depth level that had not recovered weeks after the crisis; the two differ in measure and in moment. As for the persistent residual, CoinDesk Research's follow-up tracking data show that the order book depth of BTC within the 1% price range (two-sided) fell from about $20 million before the shock to about $14 million, a decline of nearly one-third, and had still not recovered to pre-shock levels five weeks after the event [3]. Amberdata's analysis in February 2026 went further, noting that BTC's order book depth within the 10-basis-point range plunged about 63%, from a peak of $38 million in September 2025 to $14 million (this 10-basis-point window differs in measure from the 1% window above, and its baseline moment is also the September 2025 peak rather than the eve of the crash, so the two sets of figures cannot be compared directly), and that "the market never fully recovered" [24]. Together, these data indicate that the collapse took only about 2 hours, whereas the recovery (if it can be called a "recovery") remained incomplete months later.
Attributing the persistent depression of depth entirely to "resilience failure," however, may be an oversimplification. Market makers' reduction of quote size and depth after the crisis was partly a rational repricing based on higher volatility expectations: after an extreme event, market makers systematically revise their estimates of future volatility upward, and a wider spread and thinner depth are their optimal response in a higher-risk environment, rather than pure loss of confidence or inadequacy of capacity [12]. In addition, the actual losses suffered during the crisis also consumed market makers' available capital, limiting their capacity to restore their market-making scale. The post-crisis "new baseline" of depth therefore contains both a structural resilience defect (that is, the system lacks a mechanism at the institutional level to promote rapid recovery) and market makers' reasonable behavioral adjustment based on a new information set. Distinguishing these two components is of significant analytical value for assessing whether the market is truly "damaged" or merely "repriced."
At the same time, the lowering of market makers' retreat threshold further weakens resilience. As discussed in Section 8.2.2, perpetual futures abolish the expiry date, causing market makers to bear open-ended inventory risk and depriving them of the definite risk-termination point and natural exit of the traditional futures "hold to delivery." This open-ended risk exposure significantly lowers market makers' retreat threshold when market uncertainty rises: at the earliest sign of an anomaly, they are more inclined to cancel orders immediately to protect capital rather than "wait a little longer," which weakens their willingness to "stay in the market and provide resilience" and causes the order book to enter a "vacuum" state faster after a shock. CoinDesk Research described this phenomenon as "a prudential contraction of market-making commitment" and regarded it as a "structural shift" rather than a temporary panic reaction [3].
Building on this, the absence of a "reset window" caused by the 24/7 operating model constitutes another important factor. Traditional financial markets have fixed trading hours, and the closed period provides the market with a natural "resilience-recovery window": market makers can reassess their risk exposure, adjust pricing models, replenish margin, and re-enter the next day in a fresher state and with more ample capital. This window also provides three often-overlooked functions — time to digest information (rationally assessing new information during non-trading hours and avoiding overreaction under immediate emotion), cross-time-zone coordination (participants in different time zones fully pricing in the same event during their respective active periods), and a definite point for clearing and settlement (providing an institutional deadline for margin calls and risk-position adjustments). The around-the-clock operation of perpetual futures means all three functions are simultaneously absent, and market makers must make "stay or leave" decisions in real time under a continuous flow of information and pressure, so that the system's continuous fatigue further weakens its recovery capacity after an extreme event. Combined with the "liquidity circadian rhythm" analyzed in Section 8.5.3, if a shock happens to coincide with a liquidity-trough period (such as between the American close and the Asian open), the absence of market-making force worsens resilience further. The October 2025 event occurred at 20:50 UTC, at the tail end of the American trading session, when the activity of European and American market makers was declining and Asia-Pacific had not yet fully started — not the absolute trough of the 24-hour cycle, but already on the downward slope of the transition from peak to trough [2]. This coincidence of the liquidity level with the moment of crisis may have had a strategic component, and it also amplified the system's vulnerability to shocks during a relatively weak period.
Figure 8-16, in the form of a causal diagram, provides a systematic visualization of the three structural reasons above and the specific paths by which they transmit to order book resilience.
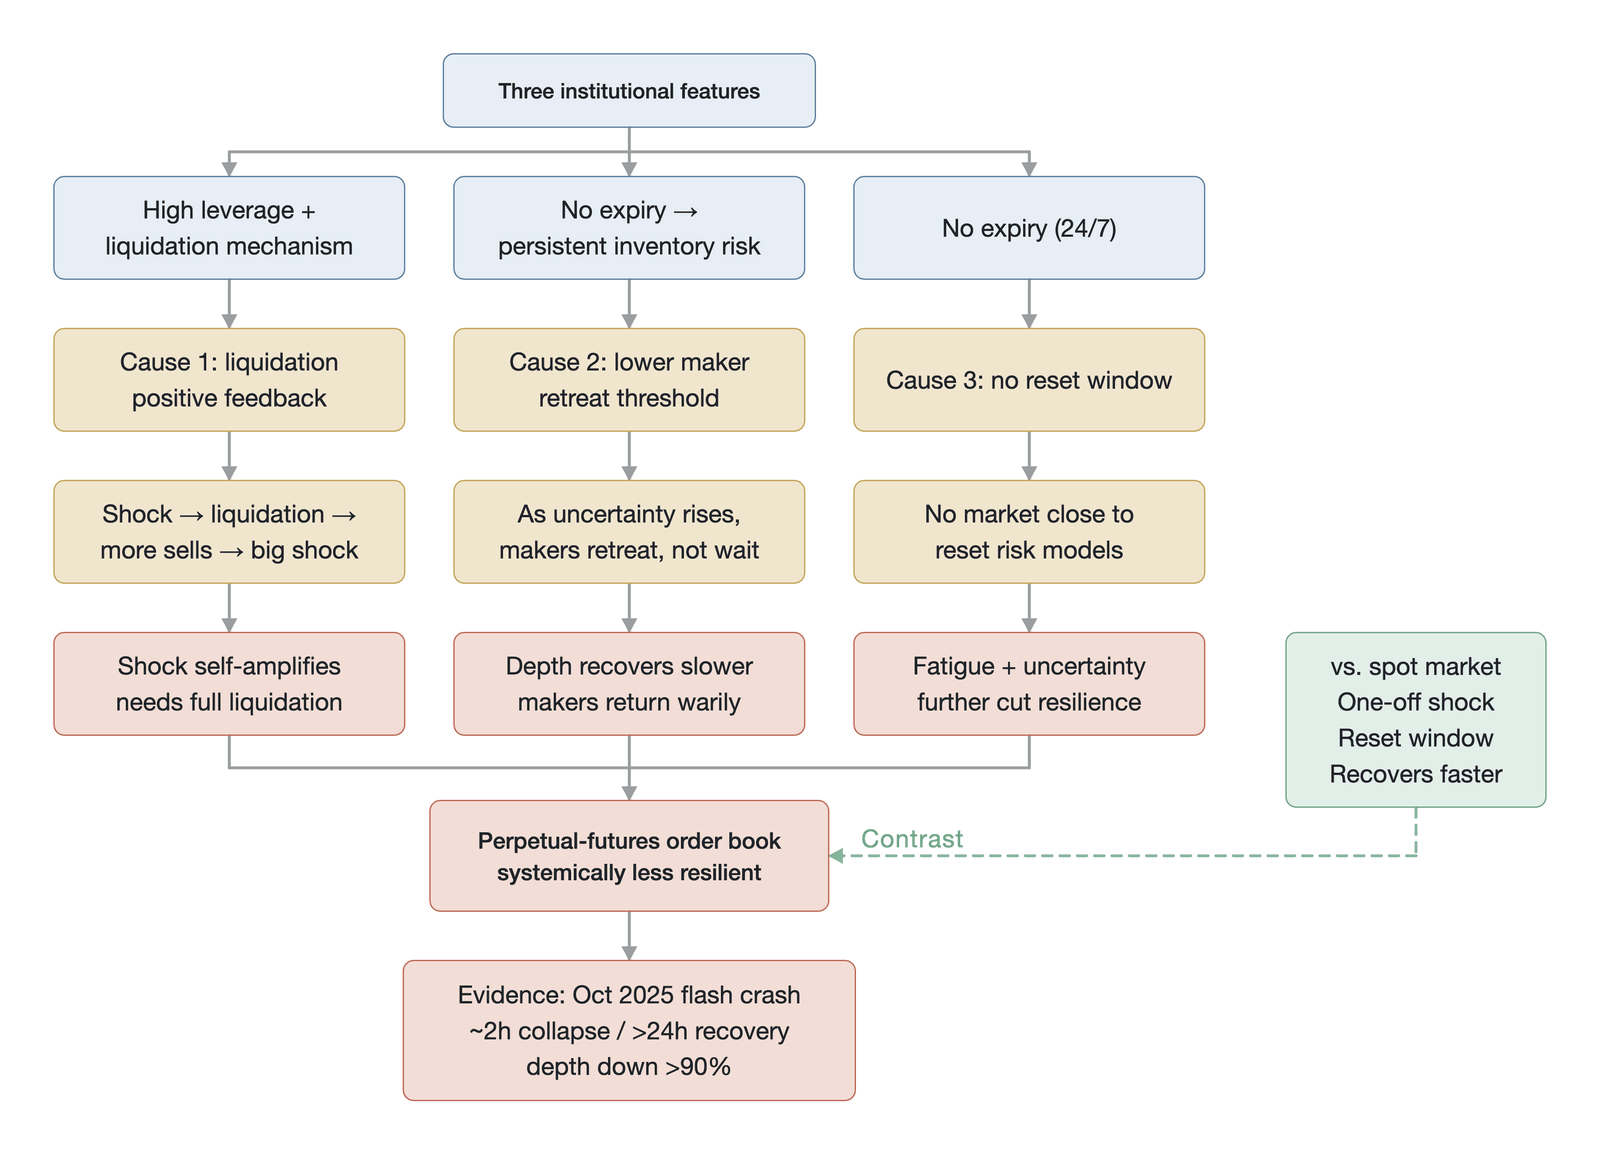
Figure 8-16. The causal mechanism of the resilience disadvantage of perpetual futures (an illustration of the three-cause causal mechanism; at the bottom, "October 2025 flash crash depth contraction >90%" is hard data, and "collapse in about 2 hours / recovery over more than 24 hours" is a representative time scale; following CoinDesk, November 15, 2025 [3])
The causal diagram reveals the synergy of three paths: the liquidation positive feedback produces immediate, self-amplifying destructive power during the shock; the low retreat threshold weakens the order book's defensive depth even before the shock; and the absence of a 24/7 reset window eliminates the institutional opportunity for recovery after the shock. The simultaneous presence of all three means that the perpetual market is already in a resilience-weakened state before the shock, suffers self-amplifying destruction during the shock, and lacks a recovery mechanism after the shock. This triple superposition, which spot markets do not possess, is precisely the structural root of why perpetual resilience is systematically inferior to that of spot (this tendency is inferred mainly from the institutional causal chain above and is corroborated by a small number of events such as October 2025; its cross-event generality still awaits testing against more extreme events).
8.6.3 A comparison of resilience across architectures
Beyond the difference in asset type (perpetual futures vs. spot), the market structure in which the matching engine resides also strongly affects the order book's resilience. Under different technical architectures, the measurement of resilience exhibits a trade-off between "verifiability" and "recovery speed."
On centralized exchanges, the order book and matching engine run on private servers, and market makers, using extremely low network latency and zero-gas-cost quote updates, can complete quote cancellations and resets at the millisecond level. On the surface, CEX resilience therefore "looks" strongest: the spread after a shock can often narrow within an extremely short time, and depth too seems to recover quickly. This resilience, however, is unverifiable. An external observer cannot know for certain whether this rapidly recovered depth contains genuine trading intent or is merely "ghost quotes" posted to obtain market-maker rebates or maintain market rankings. The problems of "flickering liquidity" and "conditional depth" analyzed in Section 8.2 are especially prominent in the assessment of CEX resilience. A CEX order book that rapidly "recovers" its nominal depth after a shock may still have extremely weak stress depth.
By comparison, a central limit order book on an application chain is subject to the physical constraint of block time. For example, on an application chain with a block time of about 200 milliseconds to 1 second, there is a hard upper limit on the frequency of market-maker quote updates, which makes its surface recovery speed inferior to that of a CEX. But every order submission, modification, and cancellation on an on-chain CLOB is recorded in a distributed ledger, and its recovery process is fully transparent and auditable: every unit of depth that is rebuilt locks in real margin, rather than a "ghost" that can be canceled instantly at zero cost (this "capital authenticity" mechanism and its contrast with CEX ghost liquidity are detailed in Section 8.9.2). The resilience of an on-chain CLOB, therefore, though inferior to that of a CEX in speed, may be more reliable in "quality."
As for DEXs deployed on general-purpose public chains (such as the Ethereum mainnet), because the block-confirmation time is long (about 12 seconds) and they face intense gas competition, their order book resilience is the weakest and their recovery speed the slowest. When updating quotes, market makers face high on-chain costs and enormous adverse-selection risk (in the several seconds of waiting for block confirmation, the market price may already have moved substantially), making depth recovery after a shock exceedingly difficult. This architecture, however, offers the highest degree of transparency and censorship resistance.
This difference reveals a core insight: in assessing market resilience, a trader must choose between "surface-level rapid recovery" and "verifiable genuine recovery." This is precisely the concrete manifestation, at the level of order book microstructure, of the "impossible triangle" in Chapter 5 and the "risk visibility-manageability proposition" in Chapter 6. A high-frequency trader who pursues execution speed may place greater value on the surface resilience of a CEX, whereas an institutional investor concerned with counterparty risk and market fairness may place greater trust in the verifiable resilience of an on-chain CLOB.
8.6.4 Resilience and market quality
Resilience is not merely a technical micro indicator but a core dimension of the five-dimensional market-quality model to be established in Chapter 25. It directly determines traders' behavioral patterns and cost expectations in a given market and has a significant effect on the overall efficiency and stability of the market.
In a market with strong resilience, traders can more boldly use market orders to execute their trading strategies, because they know that even if a large order punches through the current depth and produces a price shock, market makers will quickly fill the liquidity gap and the market price will soon recover to fair value. This expectation makes transaction costs highly certain, and traders can estimate fairly accurately the total cost of executing a trade (including the spread cost and the market-impact cost), enabling more effective portfolio management and risk control.
Conversely, in a market with weak resilience, traders must adopt a more conservative execution strategy. They need to split a large order into multiple small orders, or use algorithms such as time-weighted average price and volume-weighted average price to disperse the execution impact. Because in such a market "the shock may not recover and may even self-amplify," the positive-feedback mechanism of the liquidation cascade means that a large trade may trigger a price move far exceeding expectations. Transaction costs in this environment are full of uncertainty, and the trader faces not only the known spread cost but also an unpredictable tail-impact risk.
At the macro level, the strength of resilience also affects the market's price discovery efficiency. In a market with strong resilience, the price can quickly return to the fundamentals-driven fair value after a shock, and a temporary supply-demand imbalance does not produce a lasting distortion of the price. In a market with weak resilience, however, a shock may cause the price to deviate from fair value for a long time, or even trigger, through a liquidation cascade, a price collapse unrelated to fundamentals, severely damaging the accuracy of price discovery. The effective operation of the price discovery mechanism to be analyzed in Chapter 13 depends largely on the order book having sufficient resilience to absorb and digest information shocks.
The perpetual futures market's weaker resilience means it faces greater tail risk under extreme events. This is not a system "defect" that can be solved by patching code or adjusting parameters but an intrinsic cost that necessarily accompanies the institutional combination of "high leverage + no expiry date + 24/7 trading." These features are interrelated: high leverage provides traders with capital efficiency but also plants the seeds of a liquidation cascade; the absence of an expiry date eliminates rollover costs but also deprives market makers of a risk-termination point; and 24/7 trading provides around-the-clock market access but also eliminates the buffer window for resilience recovery. The theoretical discussion of "the cost of abolishing the expiry date" in Chapter 2 finds here, through the micro indicator of resilience, a complete and quantifiable expression. Understanding this point has important practical significance for traders in formulating risk-management strategies, for regulators in assessing market stability, and for protocol designers in optimizing liquidation mechanisms.
8.7 The evolution of matching-engine architecture
The preceding analysis shows that the resilience of the order book is structurally constrained by institutional features such as the liquidation mechanism, market-maker behavior, and market continuity. These microstructural manifestations (such as the width of the spread, the thickness of depth, and the strength of resilience), however, are also constrained to a considerable degree by the underlying technical architecture that carries the order book. A matching engine running on a sub-millisecond centralized server and one running on a public chain with second-level block confirmation will produce entirely different microstructural characteristics even when facing exactly the same order flow. The deployment location and implementation of the matching engine have undergone a clear evolutionary path from fully centralized to application-specific. This path reflects not only the iteration of technology but also decentralized exchanges' ongoing trade-offs across three dimensions: performance (efficiency), decentralization (fairness and security), and sovereignty (protocol autonomy). Understanding this evolutionary thread is a prerequisite for grasping the institutional significance of matching-mechanism design in Section 8.8, and it also lays the groundwork for understanding how Hyperliquid, in Chapter 9, stakes out its distinctive position on this spectrum.
8.7.1 Centralized exchanges
In the early stages of the development of both traditional finance and cryptocurrency, the centralized exchange was the only viable solution for providing high-performance trading. Under this architecture, the maintenance of the order book and the operation of the matching engine are placed entirely within the private server cluster controlled by the exchange. Users deposit their assets into the exchange's custodial wallet, and all order submission, modification, matching, and cancellation are completed within the exchange's internal system.
The core advantage of this design lies in its high performance. Because all operations are conducted in memory and are not subject to the constraints of a blockchain consensus mechanism, a CEX can achieve sub-millisecond (<1 ms) matching latency, with throughput reaching hundreds of thousands of orders per second or even higher. For example, Binance has stated that the regular processing capacity of its futures matching engine can reach 100,000 orders per second, with average latency of about 5 milliseconds [25]. Note that these figures are the official values published for Binance's production environment and reflect performance under normal load. This low-latency, high-throughput environment provides a suitable trading environment for high-frequency traders and market makers, enabling them to update quotes at high frequency and thereby maintain, on the surface, narrower spreads and seemingly ample depth. For the perpetual futures market, which pursues execution speed, the CEX has long been regarded as the only venue capable of meeting the needs of professional traders.
This performance, however, comes with several structural risks. The most prominent is the counterparty risk brought by extreme centralization: users' assets are held in custody by the exchange, and once the exchange faces internal misappropriation, a hacking attack, or bankruptcy (such as the FTX incident of 2022), users' funds face the risk of total loss. This risk is especially acute in the perpetual futures market, because high-leverage trading requires users to deposit large amounts of margin at the exchange. At the same time, the unverifiability of the matching process constitutes a major hidden danger: external participants cannot verify the authenticity of order book depth, nor can they know for certain whether the exchange is using its informational advantage to manipulate internally, such as front-running user orders, wash trading to inflate volume, or improper operations during liquidation. In addition, the centralized architecture introduces censorship risk: a centralized entity can unilaterally freeze user accounts, reject specific transactions, or shut down specific markets under regulatory pressure, and users lack an effective remedy against this.
8.7.2 General-purpose-chain DEXs
To eliminate the centralization risk of the CEX, the blockchain community initially attempted to deploy the order book and matching engine directly on a general-purpose public chain (such as the Ethereum mainnet). The design goal of this approach has a clear decentralization orientation: all orders and the matching process are executed transparently on-chain, users' assets are self-custodied by smart contracts, and anyone can verify the fairness of the matching. This fully on-chain decentralized approach, however, immediately ran into a severe performance bottleneck.
A general-purpose public chain was designed to handle various types of smart-contract transactions, not optimized specifically for high-frequency trading. Ethereum's limited throughput (about 15 TPS before the Merge, improved somewhat afterward but still far from sufficient) and long block-confirmation time (about 13 seconds during the PoW period) cannot meet the performance requirements of real-time order book matching. In this environment, market makers must pay high gas fees each time they update a quote, and in the several seconds of waiting for block confirmation they face significant adverse-selection risk: the market price may have moved substantially before the quote is confirmed, making the market maker's resting order a stale quote easily exploited by arbitrageurs. In addition, because all pending transactions queue in the public mempool waiting to be packed, this architecture is vulnerable to maximal extractable value (MEV) attacks such as front-running and sandwich attacks, further worsening conditions for market makers.
Facing the performance dilemma, many DEXs adopted the compromise of a hybrid architecture. A typical case is dYdX v3, which used StarkEx as its Layer 2 settlement layer. In this model, the maintenance of the order book and the matching engine still run on off-chain centralized servers controlled by the project team; orders submitted by users are first sent to these servers for matching, while the trade results are periodically batched and submitted to the Ethereum mainnet through zero-knowledge proofs for on-chain settlement and verification. This architecture achieves smart-contract self-custody of user assets (users' funds are locked in a smart contract on Ethereum, and even if the off-chain servers go down, users can withdraw funds through an on-chain mechanism), thereby eliminating part of the counterparty risk. But its core matching component is still centralized and opaque, and the project team's servers remain a single point of failure and a potential manipulation node. The hybrid architecture makes a pragmatic compromise between performance and decentralization, but it still cannot fully resolve the contradiction of the "impossible triangle."
8.7.3 The application-chain architecture
As DeFi infrastructure matured, and especially as modular blockchain development frameworks such as the Cosmos SDK became widespread, a new paradigm began to dominate the development of high-performance DEXs: the application-chain architecture. An application chain is an independent blockchain tailor-made for a single application, whose consensus mechanism, network parameters, and state-machine logic can all be deeply optimized for that application's needs. dYdX's migration from Ethereum L2 to the independent dYdX Chain (v4) built on the Cosmos SDK marked the full establishment of this trend.
The core motivation of the application-chain architecture is to ease the trade-off between performance and decentralization. In the dYdX v4 architecture, the order book is no longer hosted by a single centralized server but is jointly maintained and synchronized in the memory of the network's decentralized validators (about 50 to 60 active validators). When a user submits an order, that order is rapidly propagated to all validator nodes through a peer-to-peer network. Matching is performed by the proposer of each block based on the order book in its memory, and the trade results are then packed into a block and verified and confirmed by all validators through the CometBFT consensus mechanism. The dYdX v4 architecture therefore exhibits the hybrid characteristics of an off-chain order book and on-chain settlement: order matching is completed in the validators' off-chain memory, and only the final trade results and state changes need to pass through consensus confirmation. This design substantially improves performance while preserving decentralization. It does, however, introduce a specific trade-off: validators can observe pending orders before a block is produced, leaving potential room for validator-level MEV extraction (such as front-running based on order information).
Beyond dYdX v4, emerging platforms such as Hyperliquid have further expanded the performance frontier of the application-chain architecture. Hyperliquid uses its self-developed HyperBFT consensus mechanism (inspired by the academic HotStuff BFT protocol), which breaks the sequential constraint of traditional consensus through pipelining to achieve (for geographically co-located clients) a median end-to-end order latency of about 0.2 seconds (200 milliseconds) and a 99th percentile below 0.9 seconds; benchmark tests of its HyperCore component show it can process up to 200,000 orders per second, but this figure comes from a benchmark-test environment rather than production load and is not directly comparable to Binance's production-environment data. The actual throughput and latency data under extreme stress scenarios (such as the liquidation peak during the October 2025 flash crash) have not been publicly disclosed by either platform. Lighter.xyz takes another technical route — a zkRollup architecture based on Ethereum — achieving near-instant transaction confirmation (millisecond-level) through a single sequencer, while using zero-knowledge proofs to submit transaction batches to the Ethereum mainnet to inherit its security. This approach offers extremely high performance at the sequencer level, but its degree of decentralization depends on the design of the sequencer (currently mostly a centralized sequencer, with plans to gradually decentralize in the future).
The degree of decentralization of Hyperliquid, however, needs to be assessed with caution. As of this writing, Hyperliquid's validator set is largely dominated by nodes operated by Hyperliquid Labs, validator admission is not fully permissionless, and sequencing power is substantively concentrated in the core team. The JELLY incident of March 2025 highlighted this centralized operational reality: when the perpetual futures of the JELLY token exhibited suspected manipulation that threatened the solvency of HLP, the Hyperliquid team intervened directly in the market, voting to delist the JELLY contract and forcibly settling all positions at a price favorable to HLP. This intervention technically protected the platform's financial stability but also exposed the tension between its "decentralized exchange" positioning and its actual capacity for centralized intervention. From a regulatory perspective, this centralized control capacity may expose Hyperliquid to legal-characterization risks similar to those of a centralized exchange with respect to the Howey test and exchange-registration obligations.
The rise of the application-chain architecture has demonstrated that providing a high-performance order book meeting the needs of professional traders, without sacrificing the principle of decentralization, is now technically feasible. This technological advance has had multiple effects on the microstructure of the perpetual futures market: the on-chain-verifiable matching process eliminates the "black box" problem of the CEX, the self-custody asset model eliminates counterparty risk, and performance metrics approaching those of a CEX make professional market makers willing to deploy strategies on these platforms, thereby improving the depth and resilience of the order book.
Figure 8-17 uses an architecture-comparison diagram to visualize the three-stage evolution of the matching engine from the centralized exchange, through the general-purpose-chain hybrid DEX, to the application-chain DEX, highlighting the core differences of each stage in the hosting location of the order book, the settlement mechanism, and the asset-custody model.
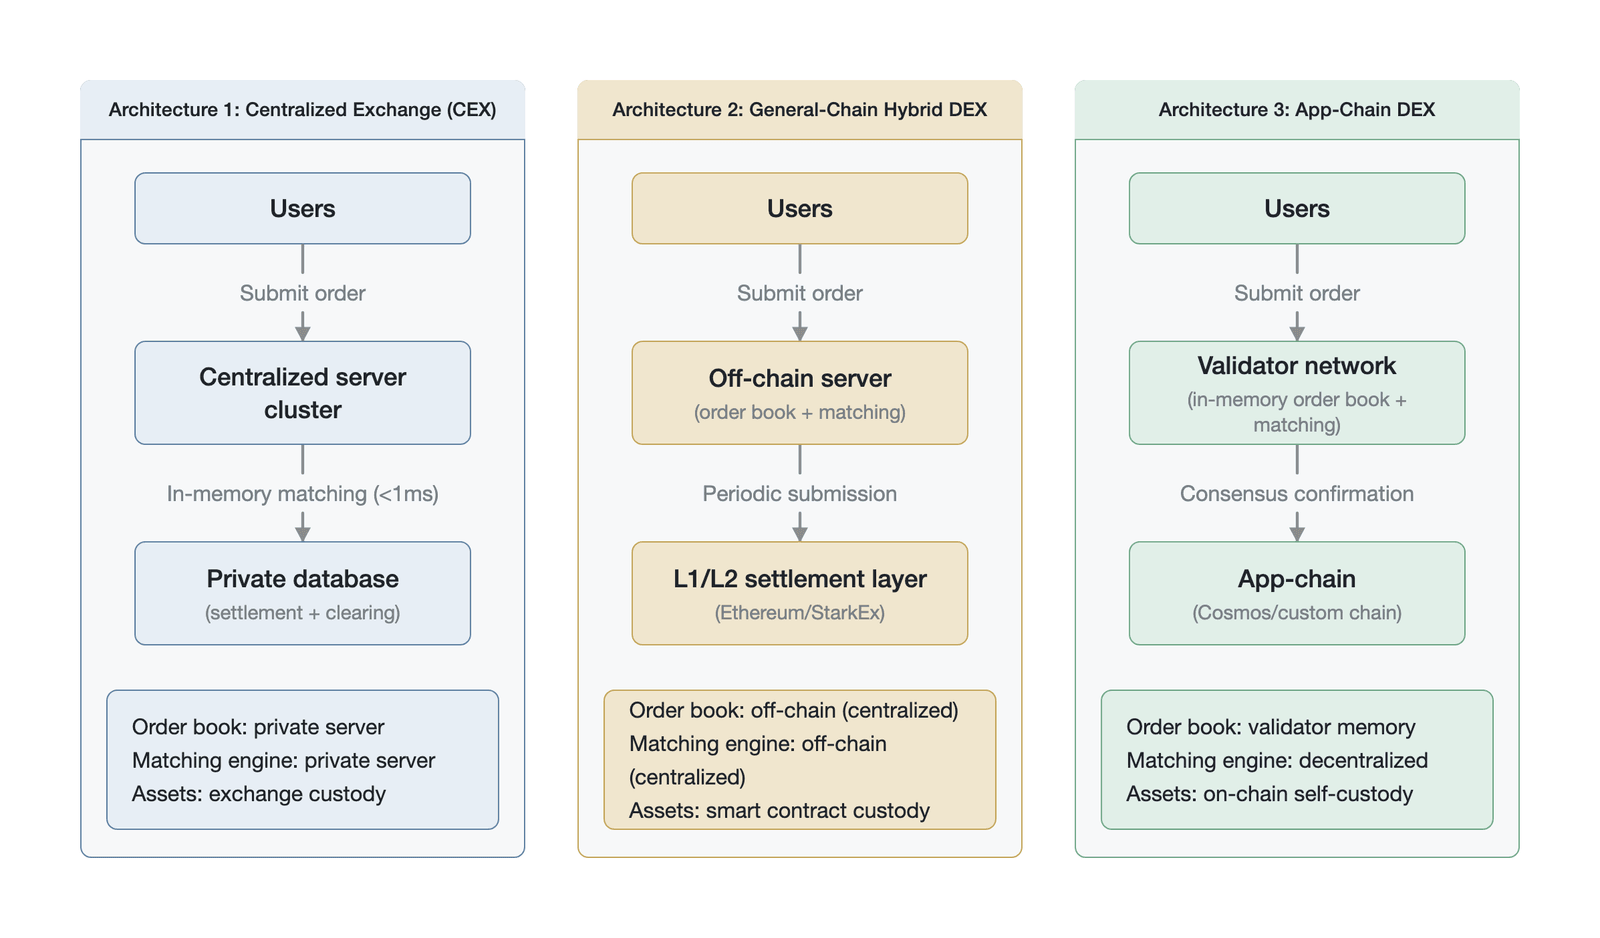
Figure 8-17. A comparison of the three matching-engine architectures (conceptual comparative illustration of the three matching architectures, not empirical data)
From left to right, the figure presents the core decentralization increments of the three architectures: from the decentralization of asset custody (the hybrid DEX migrates user assets to on-chain smart-contract self-custody, but the order book and matching are still off-chain, with only settlement on-chain) to the decentralization of the matching process itself (the application-chain DEX has validators jointly maintain the order book, matching is confirmed through consensus, and assets are fully self-custodied on-chain). The trust basis of the order book market gradually shifts from reliance on the operator's reputation to a verifiability guarantee grounded in cryptographic proof and distributed consensus.
8.7.4 A multidimensional comparison of the three architectures
To present the differences among these three architectures more clearly, we compare them across several key dimensions — matching location, settlement layer, performance metrics, custody model, transparency, MEV risk, and protocol sovereignty (see Table 8-5).
| Dimension | CEX (e.g., Binance) | General-purpose-chain hybrid DEX (e.g., dYdX v3) | Application-chain DEX (e.g., dYdX v4, Hyperliquid) |
|---|---|---|---|
| Matching location | Centralized server (private) | Centralized server (private) | Decentralized (validator network) |
| Order book location | Centralized server (private) | Centralized server (private) | Validator memory (off-chain synchronization) / on-chain state |
| Settlement layer | Private database | Ethereum L2 (e.g., StarkEx) | Independent application chain (e.g., Cosmos, Hyperliquid L1) |
| Throughput | Extremely high (~100k+ TPS) | High (limited by L2 performance) | Very high (>10k TPS, Hyperliquid reaching 200k) |
| Latency | Extremely low (<1 ms) | Low (~10–100 ms) | Relatively low (~100 ms – 1 s) |
| Custody model | Exchange custody (centralized) | Smart-contract self-custody | On-chain self-custody |
| Transparency | Opaque (black box) | Partially transparent (settlement results on-chain) | Highly transparent (fully on-chain verifiable) |
| MEV/manipulation risk | High internal-manipulation risk | Moderate (depends on the fairness of the L2 sequencer) | Relatively low (jointly supervised by decentralized validators) |
| Protocol sovereignty | Full sovereignty (controlled by a corporate entity) | No sovereignty (depends on the governance of the underlying L1/L2) | Full sovereignty (protocol/DAO autonomy) |
Table 8-5. A comparison of the core dimensions of the three matching-engine architectures (Data source: compiled by the author from the public documentation of each platform)
The "application-chain DEX" category in the table covers multiple implementation paths with significant internal architectural differences: dYdX v4 is built on the Cosmos SDK and relies on CometBFT consensus, Hyperliquid runs on its own Layer 1 and uses its self-developed HyperBFT consensus, and Lighter.xyz uses an Ethereum zkRollup architecture and relies on a single sequencer. These three paths differ fundamentally in security assumptions (independent consensus vs. inheriting Ethereum's security), degree of decentralization (dozens of validators vs. a single sequencer), and MEV-protection mechanisms. Grouping them into the same category facilitates macro comparison, but the reader should attend to the specific architectural details of each platform.
Table 8-5 shows clearly that the three architectures form a progressive spectrum between performance and decentralization. The CEX occupies the performance extreme but faces the most limitations in decentralization, transparency, and the security of user assets. The general-purpose-chain hybrid DEX achieves a breakthrough in asset self-custody, but its core matching component remains a centralized core weakness. The application-chain DEX achieves significant progress in both performance and decentralization; although it still lags the CEX on the pure latency metric (about 200 milliseconds vs. <1 millisecond), this gap is narrowing rapidly and is already entirely acceptable for the vast majority of non-high-frequency trading strategies.
As shown in Figure 8-18, in the logarithmic two-dimensional space of throughput and latency, the application-chain DEX (green) is migrating rapidly from the upper-left corner (low throughput, high latency) toward the lower-right corner where the CEX resides (high throughput, low latency), gradually approaching its performance frontier. This convergence will reshape competition: as the performance gap narrows, the relative advantage of the CEX will lie more in compliance licenses, fiat on-ramps and off-ramps, liquidity network effects, and brand recognition, while the unverifiability of its matching and its custody risk will face greater scrutiny as transparency becomes a focus of competition.
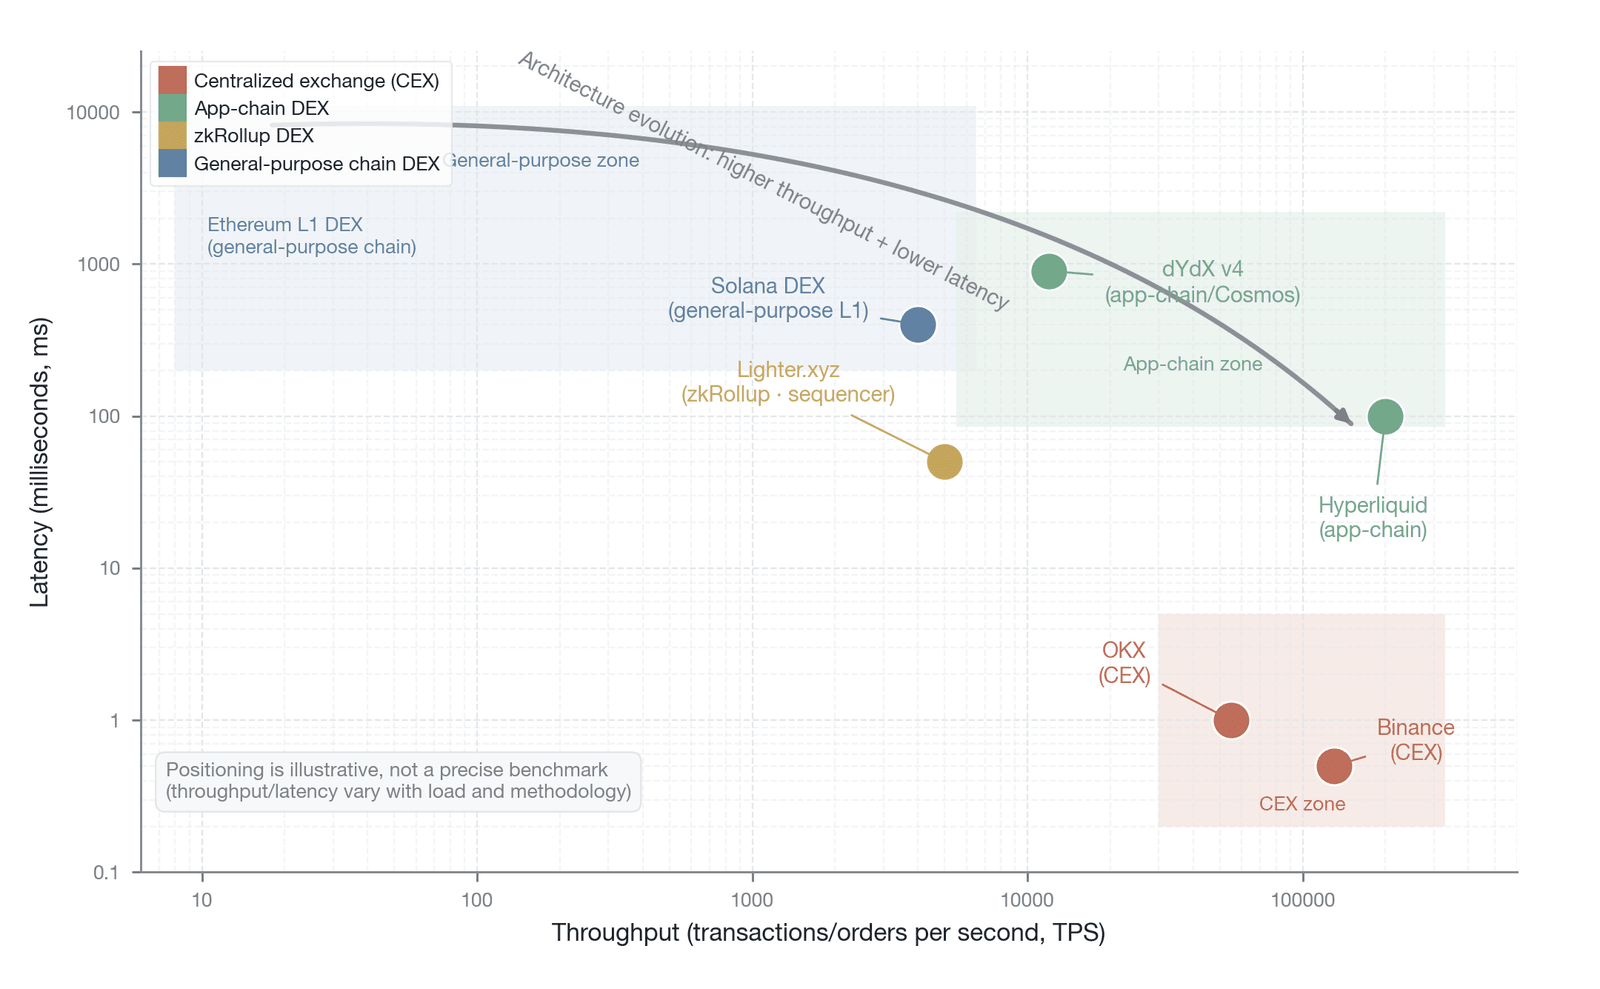
Figure 8-18. The positioning of matching engines in the throughput-latency space (conceptual illustration of two-dimensional throughput-latency positioning; the coordinates of each platform are representative orders of magnitude based on official documentation, not measured against a unified benchmark; Hyperliquid's about 200k is a benchmark-test value, not production load)
This architectural evolution is not merely technical progress; it is the infrastructural precondition for the evolution of the market microstructure. The architecture of the matching engine determines how fast market makers can update quotes (affecting resilience), whether order book depth can be externally verified (affecting the degree of the depth illusion), and whether MEV attackers can use information asymmetry to front-run (affecting the proportion of toxic order flow). Building on this, Section 8.8 further analyzes how the design of the matching mechanism itself (from continuous auction to batch auction) optimizes market fairness and efficiency through institutional innovation, within the constraints of a given technical architecture.
8.8 Continuous auction and batch auction
Having explored the on-chain evolution of the automated market maker and the central limit order book, we need to examine closely a core assumption of the order book model itself: continuous-time matching. Traditional financial markets and early decentralized exchanges mostly adopt a continuous-auction mechanism by default — that is, orders are matched immediately upon arrival against existing orders in the order book according to the principles of price priority and time priority. As high-frequency trading rose and the characteristics of blockchain infrastructure became apparent, however, the structural defects of this continuous-time matching gradually became evident. This section analyzes how the frequent batch auction and its variants optimize the market microstructure through the discretization of time.
8.8.1 The speed race and latency arbitrage
In the continuous limit order book model, the matching engine follows a strict serial processing logic. When new public information emerges in the market (for example, the price of an asset changes on another exchange), market makers and high-frequency arbitrageurs receive this signal simultaneously. A rational market maker needs to immediately cancel its old quote and submit an updated one to avoid being filled at a stale price, whereas a high-frequency arbitrageur (or scalper) attempts to trade with the market maker at the stale price before the market maker cancels, thereby capturing a risk-free profit [26].
This competition gradually turns into a speed race centered on latency advantage. In traditional financial markets, this race takes the form of enormous hardware investment in microwave communication networks, direct fiber connections, and exchange colocation, with participants competing on infrastructure for an advantage of a few microseconds or even nanoseconds. In their widely cited paper "The High-Frequency Trading Arms Race: Frequent Batch Auctions as a Market Design Response," Budish, Cramton, and Shim (2015) noted that the continuous limit order book drives price correlations toward zero at micro time scales, thereby generating obvious mechanical arbitrage opportunities [27]. They emphasized that market competition has not eliminated the scale or frequency of these arbitrage opportunities but has merely raised the speed threshold required to capture them.
In the blockchain environment, because of network latency, the discreteness of block time, and miners'/validators' control over transaction ordering, this speed race evolves into a contest over MEV. When the on-chain price deviates from an external oracle or centralized-exchange price, searchers ensure that their arbitrage transactions are ordered ahead of the market maker's cancellation transaction by paying a high priority fee or directly bribing the block builder. This behavior, known on-chain as latency arbitrage or front-running, is essentially identical to high-frequency arbitrage in traditional markets: both exploit the loophole of the time-priority principle in the CLOB.
The time-priority principle imposes a significant social cost. Under the continuous-auction mechanism, a market maker must bear the risk of having its stale quotes selectively attacked by a faster arbitrageur. This risk does not stem from any inaccuracy in the market maker's pricing model but is caused purely by the physical limitation of the system's serial processing of orders in continuous time. The profit the arbitrageur extracts constitutes a direct loss to the market maker, and this loss is ultimately passed on to all ordinary traders through the market mechanism.
8.8.2 The formation of toxic order flow and adverse selection
When arbitrageurs use their speed advantage to trade against market makers' stale quotes, this order flow is called "toxic order flow." The essence of toxic order flow is the adverse selection caused by information asymmetry. In their classic microstructure theory, Glosten and Milgrom (1985) noted that a market maker facing informed traders who may possess private information or a speed advantage will necessarily suffer adverse-selection losses [26].
In perpetual futures markets, the transmission mechanism of toxic order flow is especially pronounced. When the market is highly volatile, there is not only front-running by high-frequency arbitrageurs but also a large volume of triggered liquidation orders. These liquidation orders often sell or buy at market regardless of cost, forming an extreme toxic order flow. To measure the toxicity of this order flow in real time, Easley, López de Prado, and O'Hara (2011) proposed the VPIN indicator [28]. When the VPIN indicator rises, it means that the toxicity of the order flow is increasing and that the adverse-selection risk faced by market makers rises significantly.
Facing highly toxic order flow, a rational market maker has only two choices: either widen the bid-ask spread to compensate for the expected adverse-selection loss, or reduce resting depth at the best bid and ask to lower risk exposure.
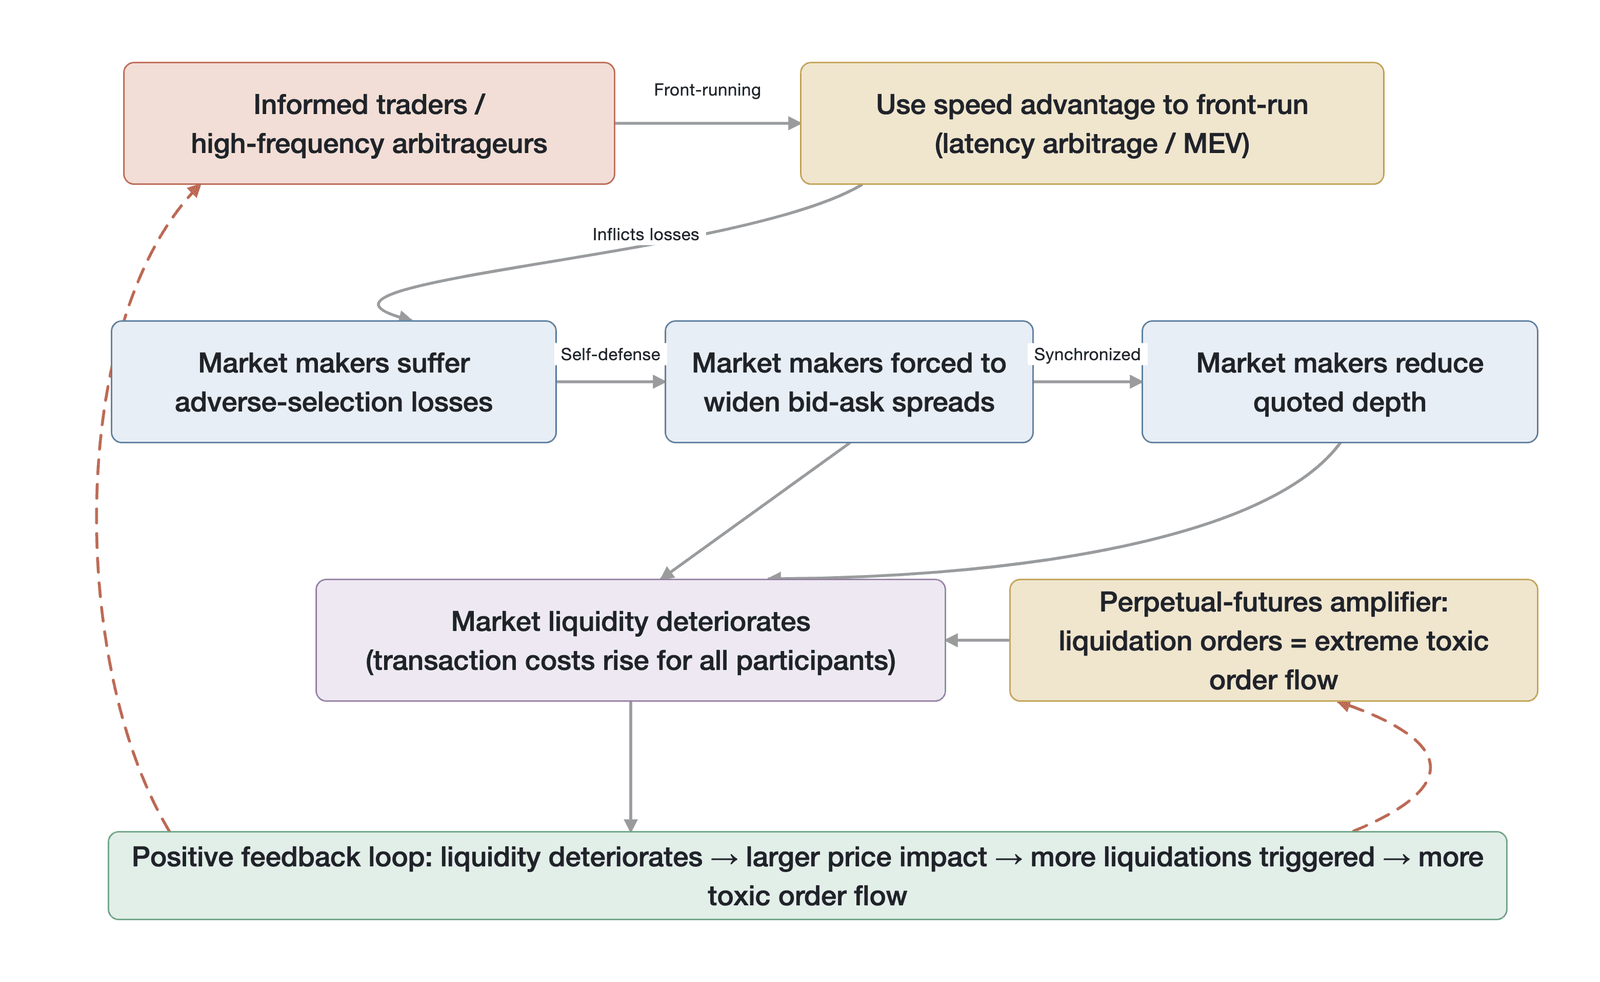
Figure 8-19. The transmission mechanism of toxic order flow (illustration of the transmission mechanism of toxic order flow, not empirical data; theoretical basis: Glosten & Milgrom 1985 [26], Easley, López de Prado & O'Hara 2011 [28])
As shown in Figure 8-19, the adverse selection triggered by toxic order flow forces market makers to widen spreads and reduce depth, leading to a deterioration of overall liquidity, so that ordinary traders (natural order flow) bear higher spreads and slippage; in the extreme, the drying up of liquidity amplifies price shocks and triggers more liquidations, forming a positive feedback loop that intensifies market instability. Solving the problem of toxic order flow is therefore not only a matter of market-maker profitability but is key to maintaining market health and protecting the interests of ordinary traders.
8.8.3 The frequent batch auction
To fundamentally solve the problems of latency arbitrage and adverse selection brought by the continuous-auction mechanism, academics and industry proposed an alternative market microstructure: the frequent batch auction (FBA). The core idea of the FBA is to abandon the continuous-time assumption, discretize time into extremely short intervals (for example, 100 milliseconds or one block time), and clear orders through a uniform-price two-sided auction at the end of each time window [27].
Under the FBA mechanism, all orders arriving within a time window are treated as arriving simultaneously. The system aggregates all buy orders (constructing the demand curve) and sell orders (constructing the supply curve) and searches for a single clearing price that maximizes the trading volume. All buy orders with a price higher than (or equal to) the clearing price, and all sell orders with a price lower than (or equal to) the clearing price, are executed at this uniform clearing price.
The FBA eliminates the micro-scale speed advantage through time discretization. Within the same auction cycle, an order submitted 1 millisecond — or even tens of milliseconds — later enjoys exactly the same execution priority as an order submitted earlier, as long as it arrives before the window closes. This mechanism pulls the competition among participants back from the "speed dimension" to the "price dimension." Market makers no longer need to invest heavily for a few milliseconds of cancellation speed, and arbitrageurs can no longer profit risk-free by relying on a speed advantage alone to exploit market makers' stale quotes.
Gong, Liu, and Kate (2025) conducted an empirical analysis of BTC-USD and ETH-USD trading data on the decentralized exchange dYdX [29]. Their study uses the realized spread as the measure of transaction cost. The results show that, compared with the CLOB model, the FBA can reduce overall transaction costs by about 21% to 37% (BTC-USD by about 24%–37% and ETH-USD by about 21%–34%, depending on the auction frequency of 5, 10, or 15 seconds). This improvement mainly benefits market makers: because the elimination of latency arbitrage lowers the adverse-selection risk they face, they are able to offer narrower quoted spreads. Note that the above data are based on a sample under normal market conditions, and the batch interval introduced by the FBA itself produces an opportunity cost of execution delay: in a high-volatility environment, a trader may miss favorable price movements while waiting for the next auction window, and whether this delay cost partly offsets the spread improvement was not included in the study's analysis. In addition, whether this conclusion applies to less liquid long-tail assets awaits further verification. Their study notes that when public information in the market (such as price-oracle updates) is more frequent than private information, the FBA has a clear welfare advantage over the CLOB.
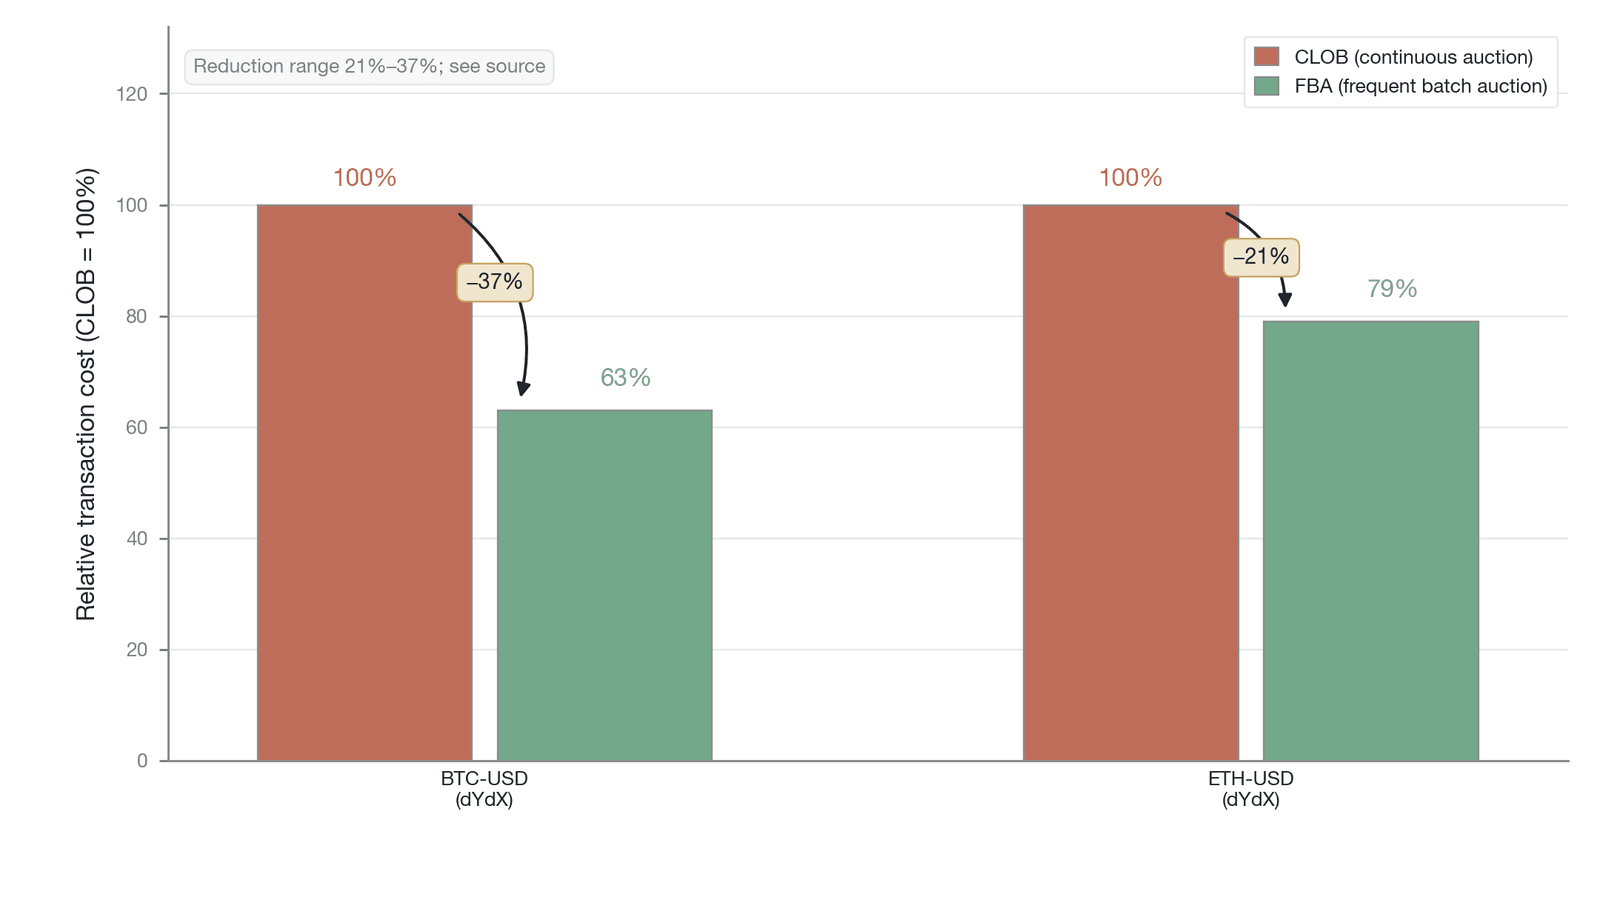
Figure 8-20. The transaction-cost-reduction effect of the FBA (the only empirical figure in this chapter: relative transaction cost is baselined at CLOB = 100%; the FBA lowers BTC-USD by 37% to 63% and ETH-USD by 21% to 79%; the 37% and 21% are the two endpoints of the 21%–37% range, depending on the auction frequency of 5, 10, or 15 seconds; in the main text the overall reduction is 21%–37%, BTC about 24%–37%, and ETH about 21%–34%; data source: Gong, Liu & Kate 2025 [29], based on BTC-USD and ETH-USD trading data from the dYdX exchange, January 2023 – October 2024)
As shown in Figure 8-20, by eliminating latency arbitrage the FBA substantially lowers market makers' adverse-selection risk, making them willing to offer narrower spreads and deeper liquidity; its uniform-price clearing also provides price improvement for market orders — buyers may be filled below their expected ceiling, and sellers above their expected floor.
8.8.4 The dual-flow batch auction
Although the FBA succeeds in eliminating the speed advantage, it remains an "all-to-all" market structure. In a traditional FBA, market makers may still be matched against one another. To optimize the market structure further, institutions such as Jump Crypto proposed the dual-flow batch auction (DFBA) mechanism [30].
The core innovation of the DFBA is to explicitly distinguish order flow into two categories — makers (liquidity providers) and takers (liquidity consumers / natural order flow) — and to strictly prohibit makers from being matched against one another. In the DFBA, each auction cycle actually contains two independent auction processes: the buy-side auction matches makers' sell orders against takers' buy orders, and the sell-side auction matches makers' buy orders against takers' sell orders.
This design brings several key advantages. It eliminates adverse-selection competition among market makers. In a continuous auction or an ordinary FBA, when an external price changes, a market maker must guard not only against arbitrageurs but also against other, faster-reacting market makers. By prohibiting maker-to-maker matching, the DFBA allows market makers to quote their best prices with confidence, without worrying about being "sniped" by peers.
At the same time, the DFBA strongly encourages market makers to display genuine liquidity depth. Because the clearing price is a uniform price determined by the supply and demand curves, and fills at the clearing price are typically allocated pro rata, market makers have a strong incentive to provide as large a size as possible at the best price in order to capture more taker order flow.
A key implementation challenge of the DFBA mechanism lies in the classification standard for makers and takers. In a continuous auction, this distinction is clear: whoever rests passively on the order book waiting to be filled is a maker, and whoever actively issues a taking instruction is a taker. In a batch-auction environment, however, all orders participate in clearing "simultaneously" when the window closes, and the boundary between maker and taker becomes blurred. The classification method used in Jump Crypto's proposal is based on the ex ante declaration of order type and submission intent [30], but this may give rise to circumvention behavior, in which participants disguise what is essentially active trading as passive resting in order to enjoy maker treatment. As of this writing, no mainstream exchange has fully deployed the DFBA mechanism in a production environment, and the robustness of its classification standard remains at the stage of theoretical discussion.
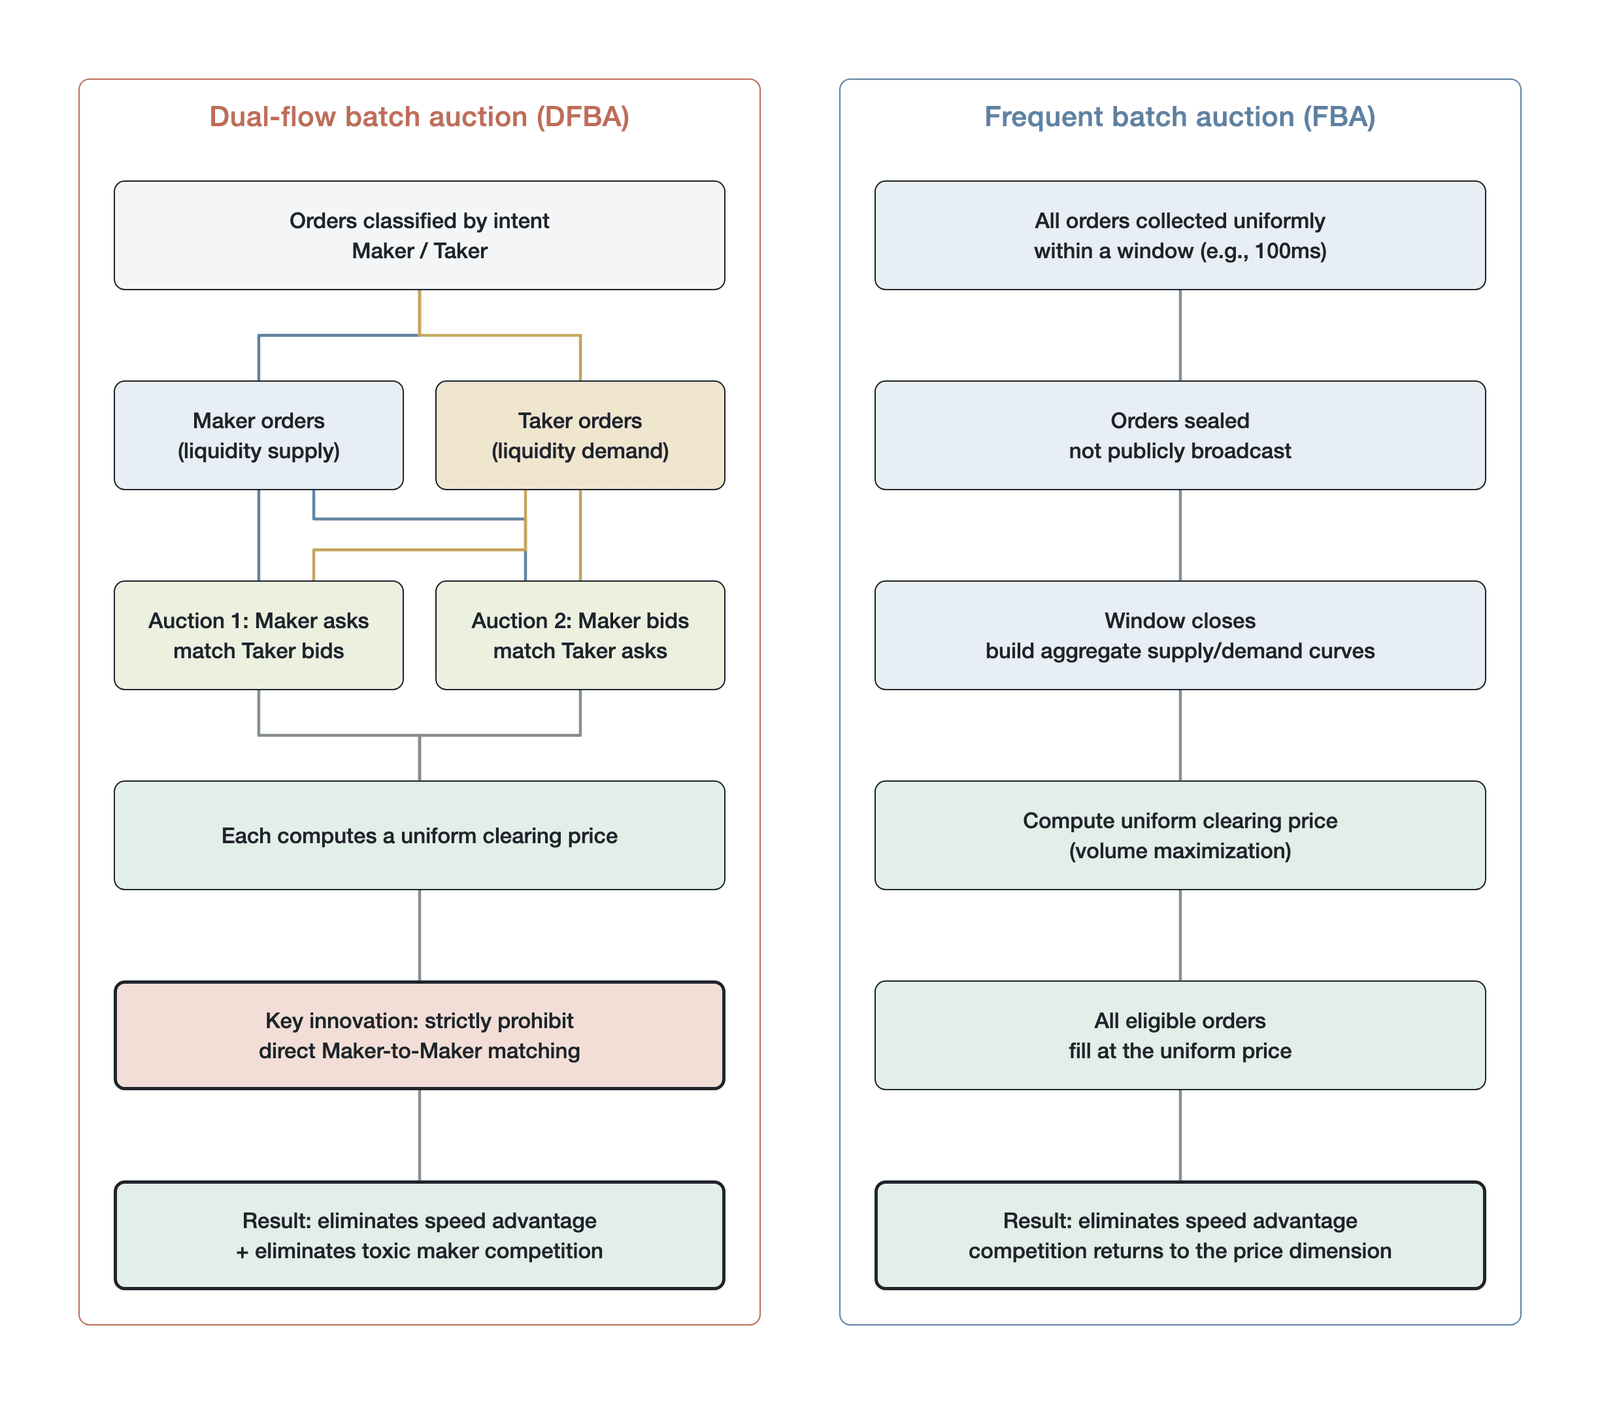
Figure 8-21. A process comparison of the FBA and the DFBA (illustration of the process comparison between the FBA and the DFBA, not empirical data; following Jump Crypto 2025 [30])
As shown in Figure 8-21, while inheriting the FBA's advantage of eliminating the speed advantage, the DFBA lowers the adverse-selection risk market makers face through structured order isolation. This improved environment ultimately translates into narrower spreads and deeper market depth, thereby benefiting the natural order flow the market is meant to serve.
8.8.5 Injective's FBA practice
A representative case of putting the FBA mechanism into practice on a blockchain is the Injective protocol. Injective is an application chain optimized specifically for decentralized finance, and it is the first blockchain network to embed the frequent batch auction mechanism directly into the Layer 1 consensus layer [31].
Implementing the FBA on a traditional smart-contract platform faces many challenges, especially the problem of order privacy protection. If orders are publicly broadcast during the auction window, they can easily trigger front-running or sandwich attacks by MEV bots. Injective effectively solves this problem by combining the Tendermint consensus mechanism with a sealed-bid design.
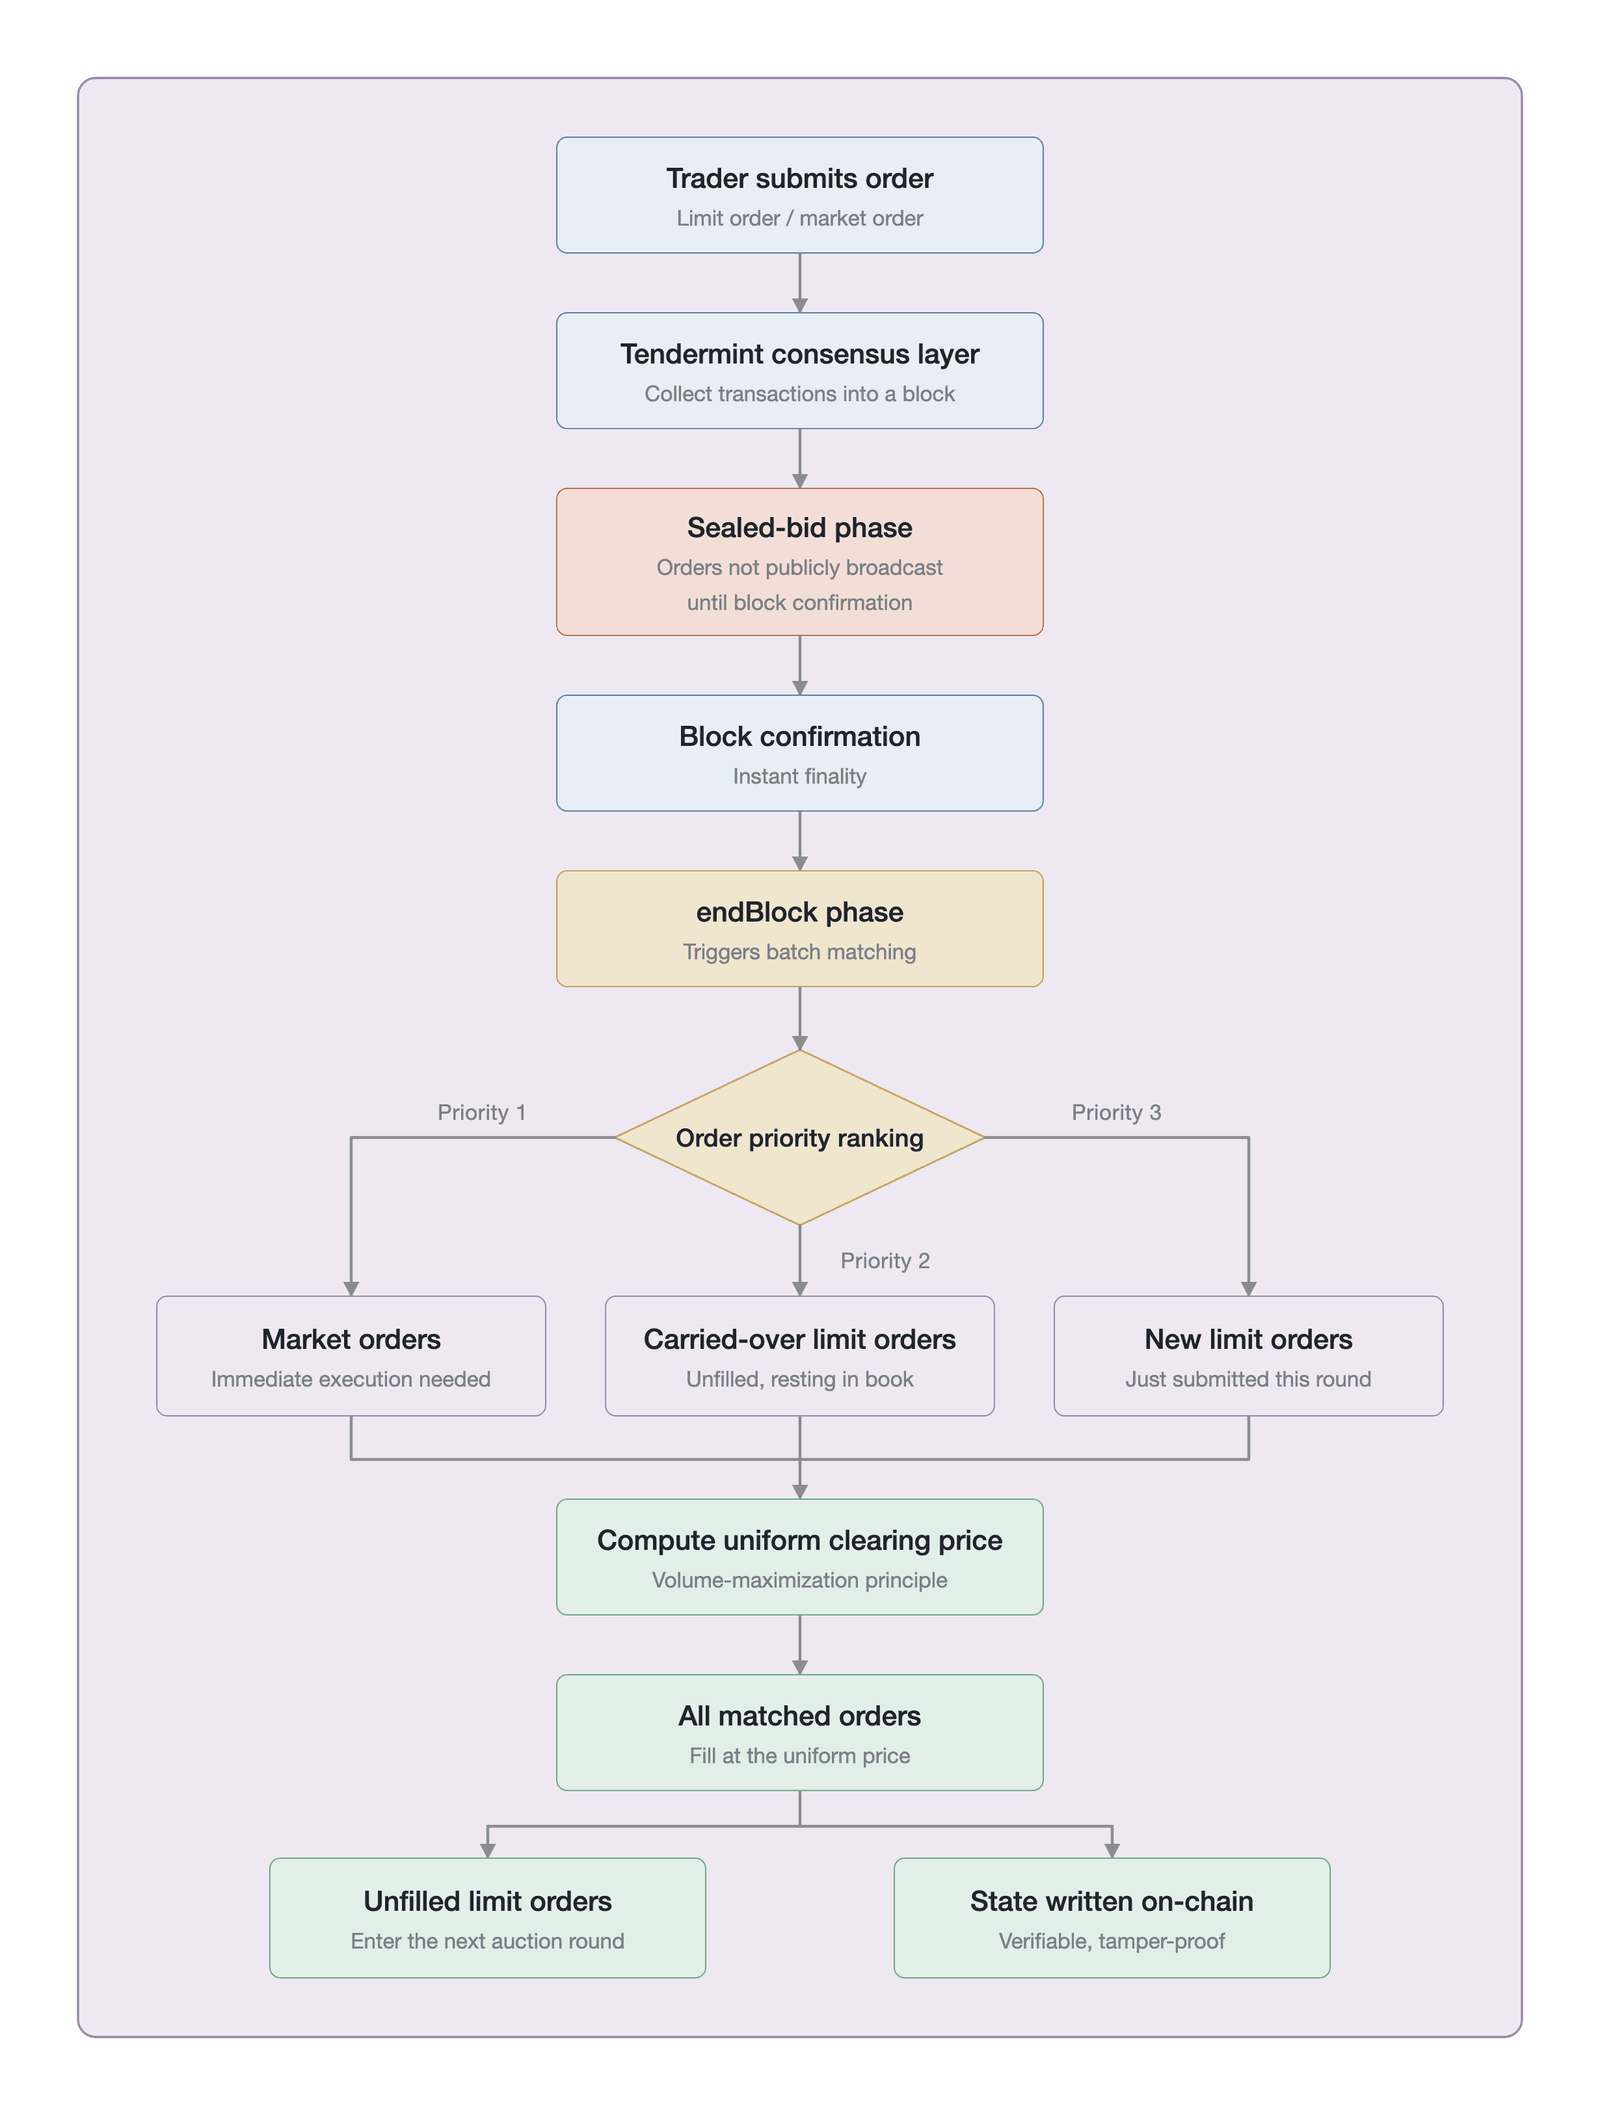
Figure 8-22. Injective's on-chain FBA execution flow (illustration of Injective's on-chain FBA execution flow, not empirical data; following Injective Protocol 2024 [31])
Injective's FBA execution flow (as shown in Figure 8-22) is deeply bound to the block life cycle. In the phase in which a block collects transactions, all submitted orders are in a sealed state and do not expose their specific price and quantity information in the public mempool. Only after the block is confirmed (which, thanks to Tendermint's instant finality, typically takes only an extremely short time) are the orders decrypted.
In the final phase of the block life cycle, the system triggers the batch matching engine. The matching logic follows a strict priority order: market orders have the highest priority to ensure the need for immediate execution, followed by unfilled limit orders from the previous round, with the lowest priority assigned to newly submitted limit orders in the current round. After determining the pool of orders participating in the matching, the engine computes the uniform clearing price that maximizes the trading volume and settles all eligible orders at this price.
Injective's practice demonstrates the feasibility and superiority of the FBA in an on-chain environment. By synchronizing time discretization with block generation and supplementing it with cryptographic means to protect order privacy, Injective has successfully built an order book market on-chain that can effectively resist latency arbitrage and harmful MEV. As of this writing, however, the liquidity and volume data for Injective's perpetual futures market remain relatively limited, making it difficult to empirically compare the FBA's real effect on this platform against theoretical expectations. Whether the theoretical advantages of the FBA hold equally in a low-liquidity environment (that is, whether uniform-price clearing can still achieve meaningful price improvement when there are few participants and possibly only a handful of orders within a batch-auction window) still requires more practical data for verification. This provides not only a predictable trading environment for market makers but also lays a microstructural foundation for the decentralized perpetual futures market to advance toward institutional-grade liquidity.
8.9 The information ecosystem of on-chain and off-chain order books
Having explored the matching mechanism of the order book, we must turn our attention to the data the order book itself carries. The order book is not only where trading happens but also the market's most important source of microstructural information. From centralized exchanges to decentralized exchanges, the migration of the order book involves both a transformation of infrastructure and a structural change in the information ecosystem. This section compares the fundamental differences between on-chain and off-chain order books in transparency, verifiability, and the barrier to data acquisition, and explores how these differences give rise to an entirely new on-chain data-analysis ecosystem.
8.9.1 The characteristics of the CEX order book
On centralized exchanges, the order book is highly opaque and unverifiable. Traders receive order book snapshots and incremental updates through the APIs (such as WebSocket) the exchange provides, but this data is generated entirely by the exchange's centralized servers. Users cannot independently verify whether a resting order at a specific price level truly exists, nor can they confirm whether the exchange is conducting wash trading or spoofing internally to manufacture false liquidity depth.
What this unverifiability buys is high performance. Because there is no need to reach consensus in a distributed network, a CEX's matching engine can achieve sub-millisecond latency. More importantly, canceling or updating a quote on a CEX is typically free (or extremely low-cost). This zero-cost quote-update mechanism lets high-frequency market makers revise their quotes dozens of times per second in response to tiny market fluctuations.
This information ecosystem, based on centralized trust and zero-cost updates, however, causes the CEX order book to be flooded with a large volume of "ghost liquidity." When the market fluctuates violently, these seemingly substantial resting orders are often canceled in an instant, causing liquidity to vanish suddenly precisely when it is most needed.
8.9.2 The characteristics of the on-chain CLOB
Entirely unlike the CEX, a central limit order book built fully on a blockchain (such as Hyperliquid or Injective) offers a fully transparent and verifiable information ecosystem. In an on-chain CLOB, every resting order, cancellation, and trade record is packed into a block as a transaction and broadcast to the entire network through the consensus mechanism. Anyone can run a full node, replay all transaction states from the genesis block, and thereby reconstruct locally an order book precisely consistent with the on-chain state.
This verifiability changes the trust basis of order book depth, but its meaning needs to be defined precisely. An on-chain resting order, at the legal and operational level, is still a revocable offer, just like an order on a traditional order book: a market maker can submit a cancellation transaction in the next block to cancel a prior quote. The POPCAT incident analyzed in Section 8.2.5 has already clearly demonstrated this: the $20 million order wall the manipulator posted on-chain was ultimately withdrawn in full. An on-chain resting order therefore does not possess "execution irrevocability." What the on-chain order book genuinely improves is the degree to which "capital authenticity" is verifiable: every resting order must lock in real on-chain margin, and both submitting and canceling orders require paying gas fees, which significantly raises the capital cost of spoofing at the economic level. On a centralized exchange, posting and canceling a false order of $100 million is nearly costless, but in an on-chain environment the manipulator must at least actually lock in the corresponding margin assets, substantially raising the economic barrier to spoofing.
At the same time, the full transparency of the on-chain order book is a double-edged sword. The distribution of liquidation prices, the location of large positions, and the price ranges with weak liquidity — this information is visible equally to all market participants, including potential attackers. As the POPCAT incident demonstrated, an attacker can use on-chain-visible position-distribution information to locate a manipulation target precisely and design a targeted liquidity-attack strategy. This "information symmetry" aids price discovery efficiency in a normal market, but in an adversarial environment it also provides malicious actors with a complete "map of the attack surface."
This verifiability, however, comes at the cost of speed and flexibility. The update frequency of an on-chain order book is limited by the block time of the underlying blockchain. Even on a high-performance application chain or Layer 2 network, this time is typically between a few hundred milliseconds and a few seconds. In addition, every on-chain state update (including cancellations) requires paying a gas fee. This time constraint and cost friction force on-chain market makers to abandon high-frequency quote-update strategies in favor of wider spreads and more stable resting-order strategies. As a result, although the depth of an on-chain order book may not be as "thick" as that of a CEX, the liquidity it provides is more genuine and more durable.
8.9.3 The democratization of data access
In traditional finance and CEX markets, obtaining high-quality order book data is an expensive privilege. Exchanges typically divide data into different tiers (such as Level 1, Level 2, and Level 3) and charge high subscription fees for Level 3 data, which provides full depth and tick-by-tick trade records. In addition, to obtain the lowest-latency data feed, institutions must also pay expensive colocation fees. This data-commercialization model creates a stratification of information access, placing ordinary retail traders at a structural disadvantage.
On the surface, the public and transparent nature of the blockchain seems to "democratize" this reading capability. On-chain, order book data becomes a public good. No centralized entity can restrict access to this data, and there is no need to pay expensive API subscription fees. Anyone willing can obtain the lowest-level smart-contract state through an RPC node and parse out the most complete Level 3 order book data.
This gives rise to an interesting "transparency paradox," however: although the data is public, the barrier to extracting valuable information from it is extremely high. To reconstruct and analyze an active on-chain order book in real time requires building a high-availability node cluster, writing complex smart-contract event-parsing logic, and handling a massive data stream. For an ordinary DeFi user facing a vast volume of hexadecimal raw data, the barrier to interpreting the data is actually higher than when using a CEX's standardized API. The "reading" capability has therefore been democratized in theory, but in engineering practice it remains in the hands of a small number of professional teams with powerful infrastructure capabilities.
8.9.4 The on-chain data-analysis ecosystem
It is precisely on the basis of this "transparency paradox" that the decentralized perpetual futures market has given rise to an entirely new on-chain data-analysis ecosystem. Since the underlying order book data is public and tamper-proof, third-party developers can build a rich variety of visualization tools and real-time monitoring platforms on top of it, filling the information gap between ordinary users and professional market makers.
In this new ecosystem, we see many innovative data products. For example, through joint analysis of on-chain open interest and order book depth, data platforms can plot high-precision "liquidation heatmaps." These heatmaps can intuitively show users the price ranges in which large volumes of high-leverage positions are clustered, and the chain reaction that may be triggered when these positions are liquidated.
In addition, targeting the "whale behavior" unique to the on-chain order book, analysis tools can track in real time the resting and cancellation actions of specific addresses, identifying potential "order-propping" or "order-suppressing" behavior. Because the transaction history of an on-chain address is fully public, users can even assess whether the address behind these large orders has sufficient financial strength, thereby judging the true intent of these orders.
| Feature dimension | Centralized exchange order book | Fully on-chain order book |
|---|---|---|
| Data-generating entity | Exchange's centralized servers | Decentralized consensus network |
| Transparency and verifiability | Black box, unverifiable, risk of false trades | Fully transparent, cryptographically verifiable, every trade recorded |
| Data-acquisition cost | High (Level 3 data and colocation require payment) | Free (data is a public good, obtained via RPC) |
| Engineering-parsing barrier | Relatively low (standardized API directly outputs structured data) | Extremely high (requires parsing underlying contract events and the state tree) |
| Quote-update friction | Extremely low (sub-millisecond latency, typically no cancellation fee) | Relatively high (limited by block time, requires paying gas fees) |
| Liquidity characteristics | Large depth, but containing a large volume of easily cancelable "ghost liquidity" | Relatively smaller depth, but strongly committed and more genuine liquidity |
Table 8-6. A comparison of the core differences between the CEX and on-chain order books at the level of the information ecosystem (Data source: compiled by the author)
Table 8-6 summarizes the core differences between the CEX and on-chain order books at the level of the information ecosystem. Overall, the on-chain order book shifts trust from "reliance on a centralized entity" to "verification of cryptography and code." Although this shift brings engineering challenges, it compresses the space for a centralized operator to conduct unverifiable black-box operations (such as internal wash trading, zero-cost spoofing, and improper operations during liquidation), and it lays the data foundation for building a fairer, more transparent decentralized derivatives market. As the POPCAT incident in Section 8.2.5 shows, however, the on-chain transparent environment does not eliminate market manipulation itself but merely changes the cost structure and traceability of manipulation. As infrastructure continues to improve and third-party analysis tools mature, the information ecosystem of the on-chain order book is expected to continue developing toward greater openness and efficiency.
8.10 Chapter summary
Taking the order book as its central object, this chapter has constructed an analytical framework for understanding the operating logic of the perpetual futures market from the standpoint of microstructure. The starting point of this framework is the redefinition of the order book as an information machine: the five signal channels of spread, depth, slope, flow, and dynamics continuously gather the private information and risk preferences of market participants and transform them into observable state variables. By cross-validating the joint changes in these five channels (rather than observing any single indicator in isolation), one can diagnose the market state systematically, mapping the continuous deterioration from "healthy" to "collapsed" into identifiable structural features that can be flagged early.
The depth illusion is the core risk concept this chapter reveals. A systematic gap exists between the visible nominal depth on the order book and the trading size the market can genuinely bear under stress, and this gap is amplified in the perpetual futures market by three mechanisms: high-frequency market makers' flickering quotes cause a large volume of visible depth to exist only within a millisecond-scale time window; market makers' liquidity commitment is implicitly premised on "normal market conditions" and triggers a collective retreat once volatility rises; and the strategically constructed false depth demonstrated by the Hyperliquid POPCAT incident shows that visible depth can even be actively constructed as a tool of manipulation. Empirical data from the October 2025 flash crash show that the reduction between nominal depth and stress depth exceeded 90%, providing quantitative validation of this concept.
Building on this, the chapter has proposed the four microstructural fingerprints of the perpetual futures order book: the depth cliff, the depth tide, the liquidity circadian rhythm, and the asymmetric volatility response of the spread. None of these four patterns exists in traditional spot markets or in futures markets with an expiry date; they arise, respectively, from perpetual futures' unique institutional features of the liquidation mechanism, the funding rate, 24/7 trading, and the systematic long bias. When the four fingerprints resonate and superimpose in a specific market environment (for example, when a high-funding-rate period coincides with a liquidity-trough period and a dense liquidation zone approaches the current price), the systemic risk the market faces far exceeds the level any single fingerprint could foreshadow.
The resilience analysis further reveals the structural fragility of the perpetual futures market along the time dimension. The positive-feedback mechanism of the liquidation cascade gives shocks a self-amplifying character, market makers face open-ended inventory risk because of the absence of an expiry date and therefore have a lower retreat threshold, and 24/7 uninterrupted trading eliminates the resilience-recovery window that the closed period provides in traditional markets. These three factors together produce the asymmetric resilience characteristic of "collapse measured in minutes, recovery measured in weeks," with the fact that depth had still not recovered to pre-shock levels months after the October 2025 event serving as direct evidence.
Finally, the chapter has traced the evolutionary path of the technical architecture that carries the order book from the centralized exchange to the application chain, as well as the institutional innovation of the matching mechanism from continuous auction to batch auction. The application-chain architecture achieves the verifiability of the matching process through a decentralized validator network, eliminating the CEX's counterparty risk and the possibility of manipulation; the frequent batch auction and the dual-flow batch auction, through time discretization and order-flow separation, reduce at the mechanism level the harm that latency arbitrage and toxic order flow inflict on market makers, thereby lowering traders' implicit costs. These advances at the technical and institutional levels are reshaping the microstructural foundation of the perpetual futures market, and their implementation and effects on specific platforms will be analyzed in detail in Chapter 9, using Hyperliquid as a case study.
References
[1] Amberdata. (2025, October). How \$3.21B vanished in 60 seconds: October 2025 crypto crash explained through 7 charts. https://blog.amberdata.io/how-3.21b-vanished-in-60-seconds-october-2025-crypto-crash-explained-through-7-charts
[2] FTI Consulting. (2025). Crypto crash Oct 2025: Leverage meets liquidity. https://www.fticonsulting.com/insights/articles/crypto-crash-october-2025-leverage-met-liquidity
[3] CoinDesk. (2025, November 15). Crypto liquidity still hollow after October crash, risking sharp price swings. CoinDesk. https://www.coindesk.com/markets/2025/11/15/crypto-liquidity-still-hollow-after-october-crash-risking-sharp-price-swings
[4] Hasbrouck, J. (2007). Empirical market microstructure: The institutions, economics, and econometrics of securities trading. Oxford University Press.
[5] Harris, L. (2003). Trading and exchanges: Market microstructure for practitioners. Oxford University Press.
[6] Kyle, A. S. (1985). Continuous auctions and insider trading. Econometrica, 53(6), 1315–1335. https://doi.org/10.2307/1913210
[7] Almgren, R., & Chriss, N. (2001). Optimal execution of portfolio transactions. Journal of Risk, 3(2), 5–39. https://doi.org/10.21314/jor.2001.041
[8] Bouchaud, J.-P., Farmer, J. D., & Lillo, F. (2009). How markets slowly digest changes in supply and demand. In T. Hens & K. R. Schenk-Hoppé (Eds.), Handbook of Financial Markets: Dynamics and Evolution (pp. 57–160). North-Holland. https://doi.org/10.1016/b978-012374258-2.50006-3
[9] Cont, R., Kukanov, A., & Stoikov, S. (2014). The price impact of order book events. Journal of Financial Econometrics, 12(1), 47–88. https://doi.org/10.1093/jjfinec/nbt003
[10] Tiniç, M., Sensoy, A., Akyildirim, E., & Corbet, S. (2023). Adverse selection in cryptocurrency markets. The Journal of Financial Research, 46(2), 497–546. https://doi.org/10.1111/jfir.12317
[11] Amihud, Y. (2002). Illiquidity and stock returns: Cross-section and time-series effects. Journal of Financial Markets, 5(1), 31–56. https://doi.org/10.1016/s1386-4181(01)00024-6
[12] Brunnermeier, M. K., & Pedersen, L. H. (2009). Market liquidity and funding liquidity. Review of Financial Studies, 22(6), 2201–2238. https://doi.org/10.1093/rfs/hhn098
[13] CoinDesk. (2025, November 13). Peak degen warfare: Alleged POPCAT manipulation hits Hyperliquid with \$4.9M loss. CoinDesk. https://www.coindesk.com/markets/2025/11/13/peak-degen-warfare-alleged-popcat-manipulation-hits-hyperliquid-with-usd4-9m-loss
[14] Kirilenko, A., Kyle, A. S., Samadi, M., & Tuzun, T. (2017). The Flash Crash: High-frequency trading in an electronic market. The Journal of Finance, 72(3), 967–998. https://doi.org/10.1111/jofi.12498
[15] Ruan, Q., & Streltsov, A. (2022). Perpetual futures contracts and cryptocurrency market quality (SSRN Working Paper No. 4218907, posted 2022, rev. 2024). https://papers.ssrn.com/sol3/papers.cfm?abstract_id=4218907 https://doi.org/10.2139/ssrn.4218907
[16] Kahneman, D., & Tversky, A. (1979). Prospect theory: An analysis of decision under risk. Econometrica, 47(2), 263–292. https://doi.org/10.2307/1914185
[17] Commodity Futures Trading Commission. (2023, January 9). CFTC charges Avraham Eisenberg with manipulative and deceptive scheme to misappropriate over \$110 million from the Mango Markets exchange [Press Release No. 8647-23]. https://www.cftc.gov/PressRoom/PressReleases/8647-23
[18] Makarov, I., & Schoar, A. (2020). Trading and arbitrage in cryptocurrency markets. Journal of Financial Economics, 135(2), 293–319. https://doi.org/10.1016/j.jfineco.2019.07.001
[19] Cont, R., Stoikov, S., & Talreja, R. (2010). A stochastic model for order book dynamics. Operations Research, 58(3), 549–563.
[20] Sornette, D. (2003). Why Stock Markets Crash: Critical Events in Complex Financial Systems. Princeton University Press.
[21] Large, J. (2007). Measuring the resiliency of an electronic limit order book. Journal of Financial Markets, 10(1), 1–25. https://doi.org/10.1016/j.finmar.2006.09.001
[22] Wuyts, G. (2008). The impact of liquidity shocks through the limit order book (CFS Working Paper No. 2008/53). Center for Financial Studies.
[23] Lo, D., & Hall, A. (2015). Resiliency of the limit order book. Journal of Economic Dynamics and Control, 61, 222–244. https://doi.org/10.1016/j.jedc.2015.09.012
[24] Amberdata. (2026, February). Bitcoin below \$70K: The crash, the data, and what comes next. Amberdata Blog. https://blog.amberdata.io/bitcoin-below-70k-the-crash-the-data-and-what-comes-next
[25] Binance. (n.d.). Binance Futures for institutions: Pioneering performance & technology. Binance Blog. https://www.binance.com/en/blog/futures/binance-futures-for-institutions--pioneering-performance--technology-421499824684900642
[26] Glosten, L. R., & Milgrom, P. R. (1985). Bid, ask and transaction prices in a specialist market with heterogeneously informed traders. Journal of Financial Economics, 14(1), 71–100. https://doi.org/10.1016/0304-405x(85)90044-3
[27] Budish, E., Cramton, P., & Shim, J. (2015). The high-frequency trading arms race: Frequent batch auctions as a market design response. The Quarterly Journal of Economics, 130(4), 1547–1621. https://doi.org/10.1093/qje/qjv027
[28] Easley, D., López de Prado, M. M., & O'Hara, M. (2011). The microstructure of the "Flash Crash": Flow toxicity, liquidity crashes, and the probability of informed trading. The Journal of Portfolio Management, 37(2), 118–128. https://doi.org/10.3905/jpm.2011.37.2.118
[29] Gong, T., Liu, Z., & Kate, A. (2025). The case of FBA as a DEX processing model. In Proceedings of Financial Cryptography and Data Security (FC'25). https://arxiv.org/abs/2302.01177 https://doi.org/10.1007/978-3-032-07024-1_7
[30] Jump Crypto. (2025). Dual flow batch auction. https://jumpcrypto.com/writing/dual-flow-batch-auction/
[31] Injective Protocol. (2024). A new era of Injective: Limitless scale. Injective Blog. https://blog.injective.com/en/a-new-era-of-injective-limitless-scale/