In early November 2022, the bid-ask spread on Bitcoin perpetual futures at major exchanges held at roughly 1 basis point, and aggregate order-book depth within 1% of the mid-price across the entire market totaled about $580 million [1]. Even a $10 million market order could be filled with minimal slippage. Yet after the FTX crisis erupted in full on November 8, liquidity deteriorated abruptly. Over the following week, bid-ask spreads at major exchanges widened to several times their normal level, and aggregate order-book depth within 1% of the mid-price collapsed from about $580 million to roughly $230 million, a contraction of more than 60%. Kaiko termed this structural collapse in liquidity the "Alameda Gap" [2]. At the same time, liquidity on FTX's own platform fell to nearly zero, and some trading pairs saw order-book depth evaporate to an extreme degree during the most violent hours of the collapse [3]. This was not a gradual process of depletion; it was market makers actively withdrawing their supply of liquidity within an extremely short window. The phenomenon raises the central question of this chapter: why can a liquidity system that appears amply supplied collapse within days or even hours, and why does that collapse always occur at the very moment the market's demand for liquidity is greatest?
Note on the level of evidence. Several of the specific figures in this chapter's crisis cases—such as the opening $580 million→$230 million depth decline and 60% contraction, as well as the later characterizations of spreads, depth, and drawdowns for events including the May 19, 2021 crash, the May 2022 Terra-LUNA collapse, and the November 2022 FTX collapse—are drawn in part from data-vendor research notes and from exchange and project-team blogs (Kaiko, Deribit, Perpetual Protocol, and others). These are firsthand but independently unverified gray-literature sources. Where this chapter cites such figures, it does so primarily to convey qualitative trends rather than to present them as precise measured conclusions. The formalizations of theoretical mechanisms (Sections 20.2.5, 20.3.3, and 20.8) are all illustrative specifications rather than empirically calibrated models, and the relevant qualifications are flagged explicitly at each point.
The sudden disappearance of liquidity is not an incidental system failure but a structural tendency of the market maker's profit equation under extreme conditions. When a sharp price decline triggers a rise in volatility, market makers' inventory costs grow convexly, forcing them to widen spreads and reduce depth. This ebbing of liquidity in turn amplifies price impact, forming a self-reinforcing loop between volatility and liquidity. At the same time, falling prices cause the system's effective leverage to climb passively, triggering forced-liquidation mechanisms. Liquidation orders enter the market as perfectly inelastic demand for liquidity: they not only directly consume the already-thin order-book depth, but the high order-flow toxicity they carry also drives out the remaining market makers, causing available liquidity to contract at a multiplicative rate. In addition, abrupt swings in the funding rate under extreme conditions force large volumes of arbitrage positions to close in concert, and the resulting one-directional order flow breaks the symmetry of liquidity on the two sides of the book. Running through all three of these positive-feedback loops is a split between apparent liquidity and true liquidity. The depth displayed in a calm market is merely a conditional commitment by market makers; once stress exceeds their tolerance band, those commitments quickly lapse.
This chapter first establishes the theoretical foundations of liquidity endogeneity (Section 20.1), then analyzes in turn the three positive-feedback loops of the volatility spiral, the liquidation cascade, and funding-rate distortion (Sections 20.2–20.4). It then examines the split between apparent and true liquidity (Section 20.5), a five-stage framework of liquidity evaporation (Section 20.6), and the cross-dimensional pathways of contagion (Section 20.7).
20.1 Theoretical foundations of liquidity endogeneity
Traditional market-microstructure theory tends to treat liquidity as an exogenously given background condition. In the institutional environment of perpetual futures, however, liquidity exhibits a high degree of endogeneity, coupled deeply with price, volatility, and leverage through positive-feedback loops. This section establishes the theoretical foundations of this endogenous perspective and reveals the deeper mechanisms that cause liquidity to evaporate suddenly under stress.
20.1.1 Exogenous versus endogenous liquidity
In the classical framework of financial-market analysis, liquidity is typically assumed to be an exogenous variable, determined by market makers' capital reserves and risk preferences and treated as a slowly changing constant over the short term. In perpetual futures markets, however, the supply of liquidity is the dynamic optimal solution that market makers arrive at after continuously assessing toxicity risk, inventory costs, and institutional constraints. The parameters in the profit equation depend, directly or indirectly, on the current market state; changes in the market state adjust the supply of liquidity through the profit equation; and that adjustment in turn reshapes the market state, forming an inseparable closed loop. This paradigm shift from exogenous to endogenous liquidity means that the sudden disappearance of liquidity no longer requires an external shock to explain it, but is instead a foreseeable outcome once the system's internal positive-feedback loops are activated. A somewhat larger-than-usual routine trade, or an ordinary liquidation event, is sufficient to set off a self-reinforcing collapse spiral so long as it happens to cross some trigger band. This perspective draws heavily on the theory of market-liquidity and funding-liquidity spirals proposed by Brunnermeier and Pedersen (2009) [4], but within the specific institutional context of perpetual futures, this endogenous coupling exhibits more complex features.
20.1.2 The reflexivity triangle of liquidity
Within the framework of endogenous liquidity, we can construct a core theoretical model that explains the fragility of liquidity in perpetual futures markets: the reflexivity triangle of liquidity. In this model, the three vertices of the triangle represent the supply of liquidity, the price level, and the position structure, while the three edges connecting them represent three positive-feedback loops: the volatility-driven mechanism, the leverage-liquidation mechanism, and the funding-rate mechanism. Deterioration along any one dimension can trigger a chain reaction along the others, ultimately converging into a systemic evaporation of liquidity.
The concept of reflexivity has a specific scholarly lineage in finance. Soros (1987) [5] defined reflexivity as a two-way feedback relationship between market participants' perceptions and market reality. Brunnermeier and Pedersen (2009) [4] formalized this feedback mechanism through the two-way spiral between market liquidity and funding liquidity. The reflexivity triangle proposed in this chapter builds on the Brunnermeier-Pedersen framework by introducing the funding-rate dimension that is unique to perpetual futures, extending the two-sided spiral into a three-dimensional positive-feedback network. This extension reflects the fact that perpetual futures, as a synthetic instrument with no expiry and high leverage, have liquidity dynamics with additional sources of fragility that traditional derivatives markets do not possess.
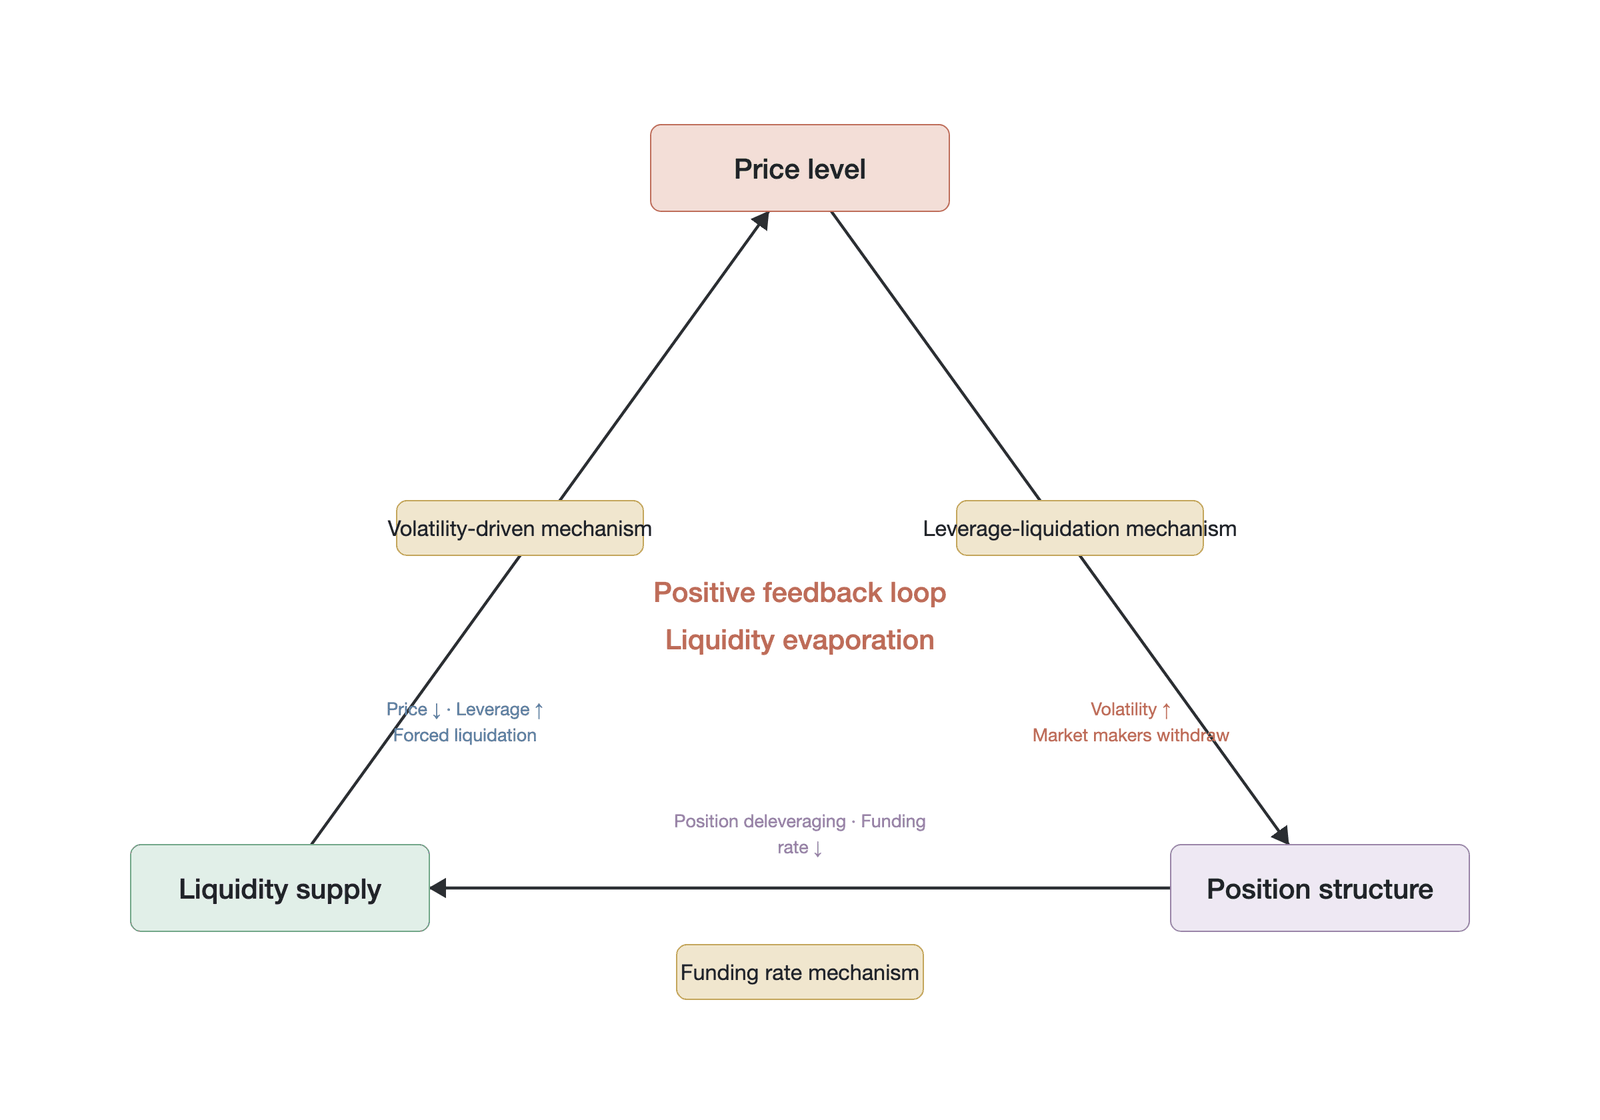
Figure 20-1. The reflexivity triangle of liquidity: the positive-feedback loops among price, volatility, and leverage
The first edge of the reflexivity triangle connects price, volatility, and liquidity. When the market suffers an initial price-decline shock, the realized volatility of the asset rises markedly. As our earlier analysis of market makers' inventory costs showed, there is a strong convex relationship between the carrying cost of inventory risk and volatility. A multiplicative increase in volatility causes market-making costs to surge convexly (quadratically). Faced with a rapidly deteriorating profit equation, rational market makers adopt defensive strategies: first widening the bid-ask spread to compensate for adverse-selection risk, and then cutting order-book depth to limit their potential inventory exposure. When volatility breaches a market maker's tolerance band, the maker withdraws from the market entirely. This substantive decay in liquidity means that subsequent trades of the same size produce larger price impact, which further raises volatility, forming a self-reinforcing vicious cycle.
The second edge of the triangle describes the interaction among price, leverage, and liquidity. In perpetual futures markets, a sharp decline in price rapidly erodes the margin balance of long positions, causing the system's effective leverage to climb passively. When margin falls below the maintenance threshold, the liquidation engine is triggered. Liquidation orders, as a form of mandatory demand for liquidity, pour into the market as market orders and directly consume what little depth remains on the order book. At the same time, the extremely high toxicity carried by the liquidation flow forces market makers to retreat faster. This twofold drain on liquidity pushes the price down further, dragging still more previously safe positions into the liquidation zone and triggering a cascading collapse.
The third edge of the triangle reveals the intrinsic link among the funding rate, position structure, and the directional distribution of liquidity. In extreme market conditions, the funding rate often tilts sharply in one direction. For example, in a scenario of plunging prices accompanied by extreme negative rates, short holders face high carrying costs and are forced to close by buying. This concentrated buy-side demand for liquidity comes into sharp conflict with the reduced buy-side supply that market makers offer because of inventory skew, producing a severe directional distortion in liquidity. An abrupt swing in the funding rate can also trigger the concentrated unwinding of enormous cash-and-carry arbitrage positions, and this structural mass migration of positions places unbearable one-directional pressure on an already fragile liquidity pool.
These three edges do not operate in isolation; they exhibit a high degree of nonlinearity. In real crisis scenarios, they are often activated simultaneously and produce cross-amplification effects. Surging volatility accelerates the retreat of market makers, so that liquidation orders confront thinner depth; the shock of liquidation in turn drives volatility higher and worsens the distortion of the funding rate. This multidimensional resonance of risk means that the total destructive force on liquidity typically exceeds the simple sum of the individual factors' effects. The claim of "exceeding the simple sum" here is a testable proposition: if, in a given collapse, the total shock when multiple loops act concurrently does not exceed the sum of the shocks from each loop acting alone, then the cross-amplification hypothesis does not hold in that case. This chapter treats it as a working hypothesis awaiting empirical testing rather than a proven conclusion.
The foregoing analysis carries an important simplifying assumption: that the market's major market makers are highly homogeneous in their risk-control models, risk thresholds, and information sets. This assumption is what allows the arguments about coordination games and synchronized retreat to hold. In actual markets, some market makers may adopt differentiated strategies—for example, providing liquidity counter-directionally during a crisis to capture extreme spreads—but empirical evidence shows that market makers' behavior in extreme conditions is far more synchronized than in normal times (Anand and Venkataraman, 2016 [6]), supporting the reasonableness of the homogeneity assumption as a first-order approximation.
The reflexivity-triangle model also has an important boundary of applicability: it describes endogenous liquidity crises at the level of market microstructure, but it does not cover liquidity evaporation driven by counterparty credit risk. In the FTX collapse, the disappearance of liquidity was largely driven not by a reflexive loop of volatility, leverage, or funding rates, but by a collapse of market participants' confidence in the exchange's own solvency. Even when volatility and leverage are at normal levels, once traders doubt that an exchange can honor their margin and profits, liquidity evaporates instantly, and this is a contagion channel independent of the reflexivity triangle. This chapter's analytical framework focuses on endogenous mechanisms at the market-microstructure level; a systemic analysis of counterparty credit risk is developed in a later chapter.
20.1.3 The four liquidity amplifiers of perpetual futures
If the reflexivity triangle describes the general dynamics of a liquidity collapse, then the institutional design specific to perpetual futures constitutes four structural dimensions that amplify that mechanism. These features, regarded in normal times as core advantages of the product, become sources of heightened liquidity fragility under stress.
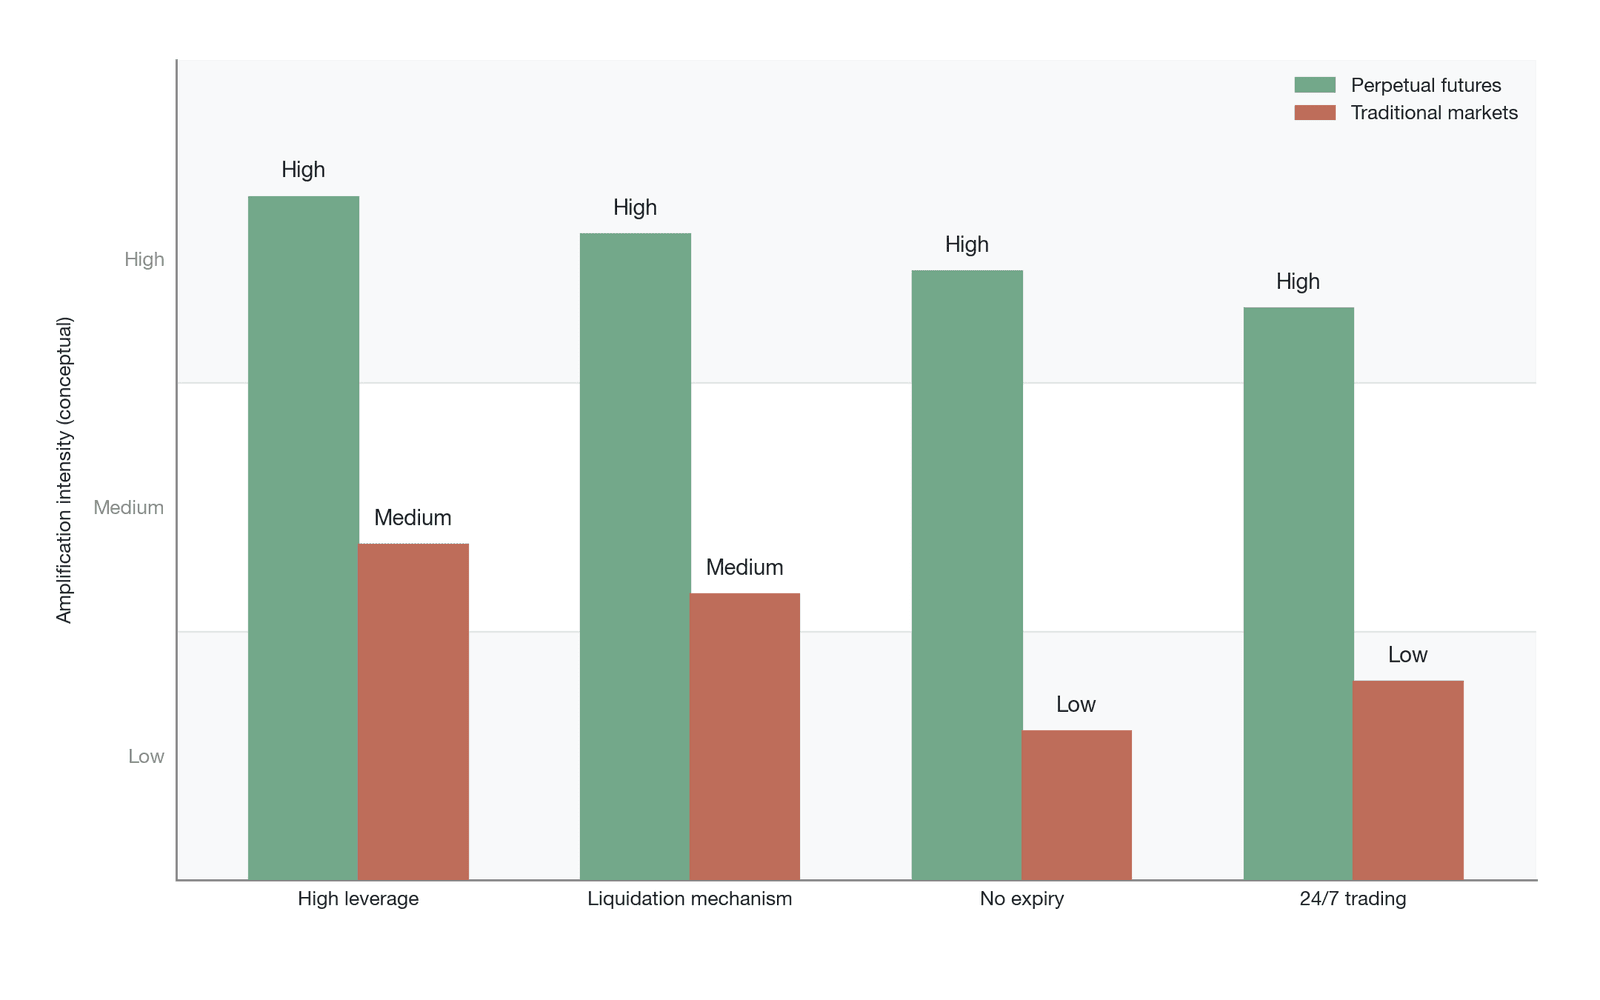
Figure 20-2. The four liquidity amplifiers of perpetual futures (conceptual illustration, not measured values)
The first amplifier is extremely high leverage. Unlike traditional financial markets, which impose strict regulatory limits on leverage, perpetual futures markets commonly permit trading at very high multiples of leverage. This means that a given amount of initial capital can establish a notional position far exceeding its own equity. When the market reverses, these enormous notional positions convert into equally enormous liquidation volume, exerting far greater impact pressure on market liquidity than in traditional markets. High leverage not only amplifies returns; it also structurally amplifies the system's potential claim on liquidity.
The second amplifier is a mandatory and immediate liquidation mechanism. In traditional margin trading, when account equity falls below the requirement, a trader typically receives a margin call and is given some buffer of time to add funds or close positions voluntarily. Liquidation in perpetual futures, however, is strictly enforced by code: it is non-negotiable and offers no time buffer. Once a threshold is breached, the system automatically takes over and sells off the assets in the form of market orders or aggressive limit orders. Although major modern exchanges have introduced multi-tiered liquidation processes to mitigate this shock (the tiered execution and its negative dependence on depth impact are detailed in Section 20.3.3), the effectiveness of these buffers declines markedly when the liquidation queue backs up rapidly in extreme conditions, and the shock still approaches immediate full execution. This mechanism converts potential risk into an actual run on liquidity within an extremely short time and can readily drain the order book in short order.
The third amplifier is the absence of an expiry date. Traditional deliverable futures contracts have a definite expiry; at expiry, the contract price naturally converges to the spot price and all open positions are forcibly settled. This mechanism provides the market with a natural stabilizing anchor. Perpetual futures instead maintain their price anchoring through the funding-rate mechanism, which allows imbalanced positions to persist indefinitely. In extreme conditions, market makers cannot count on holding to expiry to work off a temporary paper loss, which pushes them toward immediate stop-losses and retreat when confronting risk, thereby reducing the system's resilience in absorbing shocks.
The fourth amplifier is a round-the-clock trading environment. Perpetual futures markets operate continuously, seven days a week, twenty-four hours a day, and lack the circuit breakers and price limits that serve as shock absorbers in traditional markets. This means a liquidity shock can erupt at any moment, including the pre-dawn hours when market-maker participation is lowest and order-book depth is thinnest. During these liquidity troughs, even a relatively small shock is enough to trigger violent price swings and set off the collapse spiral of the reflexivity triangle. The fragility of round-the-clock trading also includes an often-overlooked operational-risk dimension: the technical infrastructure of crypto exchanges has a poor track record under extreme load. During the crash of May 19, 2021, several major exchanges experienced surging matching-engine latency, suspended deposit and withdrawal services, and even complete outages, leaving many traders unable to place stop-loss orders or add margin in time. Technical failures not only impede risk-management operations; they also force market makers to withdraw liquidity preemptively out of distrust in the stability of an exchange's systems, making infrastructure failure an independent amplifier of liquidity evaporation.
20.1.4 The wedge between apparent and true liquidity
The endogenous evolution and amplification of liquidity also give rise to a key concept: the wedge between apparent liquidity and true liquidity. The bid-ask spread and depth displayed on the order book constitute apparent liquidity, but these metrics reflect only market makers' conditional commitments given the current market state. Once volatility breaches their tolerance band or one-directional order flow accumulates, those commitments are withdrawn within milliseconds. Because major market makers use similar risk-control models, their retreat is highly synchronized, so the disappearance of order-book depth manifests as an abrupt collective evaporation rather than a gradual decay. The mechanism by which the wedge between apparent and true liquidity forms, the microstructure of ghost liquidity, and the resulting failure of liquidity metrics are analyzed systematically in Section 20.5.
20.2 The volatility-liquidity spiral
The first edge of the reflexivity triangle of liquidity reveals a self-reinforcing positive-feedback loop between volatility and liquidity. At the core of this loop is the fact that a rise in volatility is not merely a symptom of market risk; it is a direct driver that weakens the supply of liquidity. When market makers confront a violently volatile market, their rational defensive behavior—widening spreads and pulling orders—in turn amplifies the market's price impact and thereby drives volatility higher. This mechanism can be observed across multiple crashes in crypto-asset markets.
20.2.1 The market maker's volatility-response function
The effect of volatility on liquidity can be explained from the market maker's profit equation. In Chapter 19, we decomposed the market maker's three costs in detail: adverse-selection cost, inventory cost, and institutional cost. The convex relationship between inventory cost and volatility is central to understanding market makers' volatility response. Ho and Stoll (1981) [7], in their classic dealer-inventory model, first derived that the optimal bid-ask spread has a nonlinear positive relationship with inventory risk (a function of volatility). Avellaneda and Stoikov (2008) [8] further formalized this conclusion within an optimal-control framework for high-frequency market making, showing that the optimal spread is proportional to the square of volatility (optimal spread ), where is the risk-aversion coefficient (here follows the notation of Avellaneda and Stoikov's original paper and is synonymous with the used to denote the risk-aversion coefficient in Section 20.2.5 of this chapter). This means that when market volatility doubles, the inventory risk borne by the market maker does not increase linearly but climbs at four times the rate. This nonlinear cost structure dictates that a market maker's response to rising volatility is necessarily sharp and abrupt.
Rising volatility also weakens liquidity through a second channel: it intensifies adverse-selection risk. The sequential-trade model of Glosten and Milgrom (1985) [9] shows that the equilibrium level of the bid-ask spread under information asymmetry is determined by the proportion of informed traders and the size of their informational advantage. When market volatility rises sharply, it is often accompanied by intensifying information asymmetry, and the market maker cannot tell whether incoming orders reflect informed trading based on genuine information or mere panic selling. To protect itself against adverse selection by informed traders, the market maker must widen the bid-ask spread to add a buffer. In perpetual futures markets, the dual overlay of inventory-cost convexity and adverse-selection risk makes this defensive mechanism especially sharp. Because of the absence of an expiry constraint and the amplifying effect of high leverage, both costs are sharply magnified simultaneously in extreme conditions.
In high-frequency data on Bitcoin perpetual futures over 2020 to 2023, realized volatility and the bid-ask spread show a significant positive relationship (the sample period and field definitions remain to be specified; the thresholds below are illustrative characterizations). In calm market conditions (daily volatility below 3%), the bid-ask spread on Bitcoin perpetual futures at top exchanges typically holds between 0.5 and 1 basis point. When volatility breaches a certain threshold (for example, daily volatility above 8%), however, the spread widens rapidly to 10 basis points or more (as shown in Figure 20-3). This widening is not gradual; after the threshold is breached, it exhibits a sharp convex surge. This is the direct microstructural manifestation of inventory-cost convexity: when expected profit can no longer cover the sharply rising cost of risk, the rational choice for the market maker is to contract the supply of liquidity immediately. The spread data above reflect the gap between the best bid and best ask, but in extreme volatility the resting depth at the best quotes may be minimal. For a trader who needs to execute a particular size, the realized spread they face—the deviation of the volume-weighted execution price from the mid-price—will be far larger than the best-quote spread, so that the actual deterioration in liquidity is more severe than the quote data suggest.
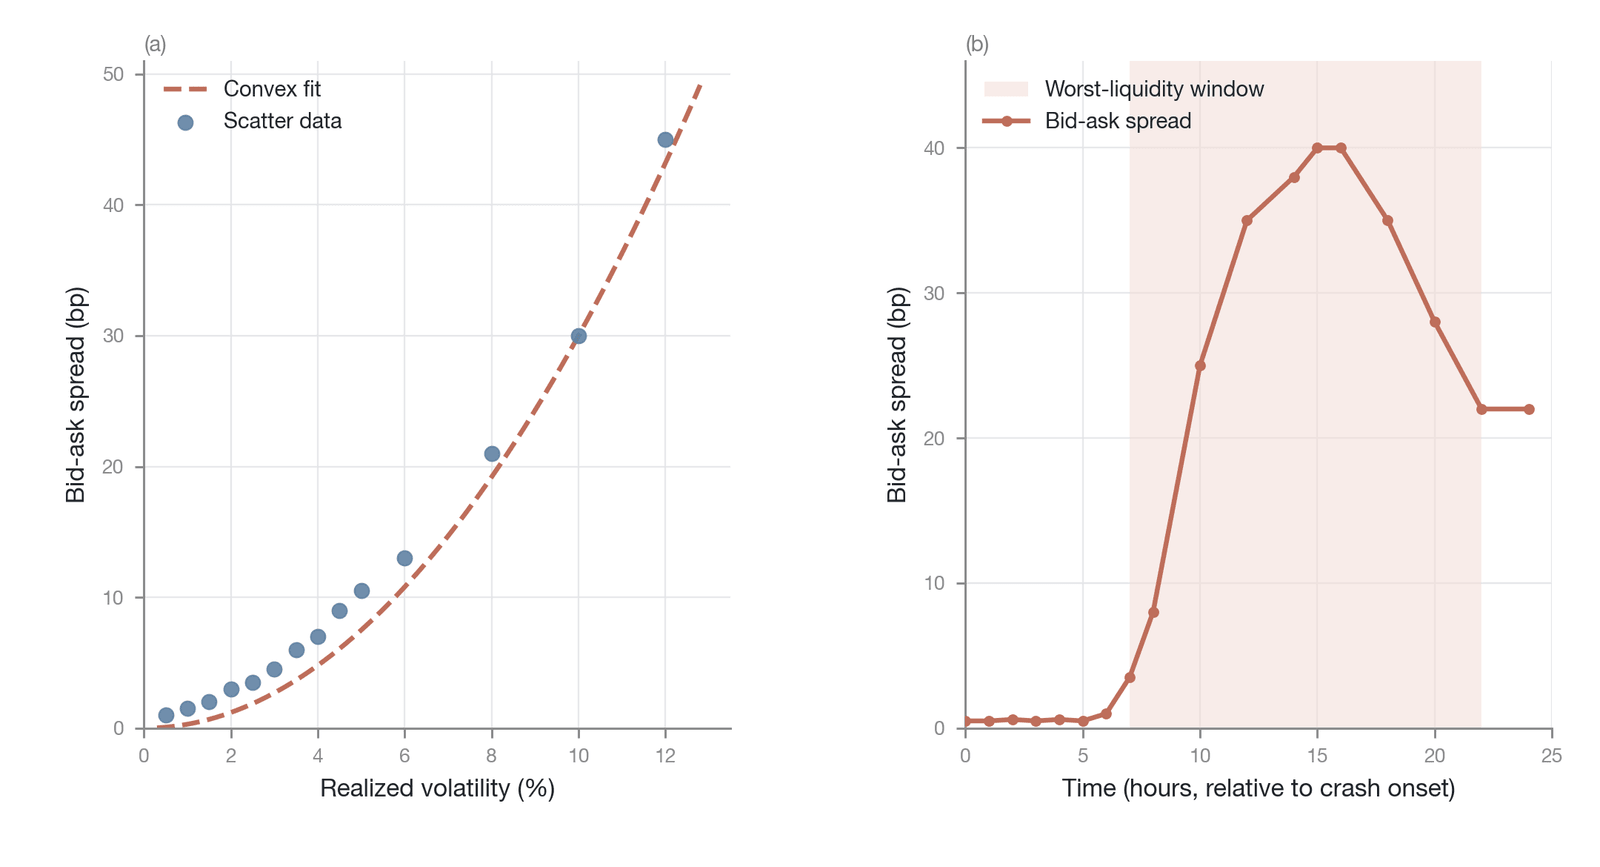
Figure 20-3. The nonlinear relationship between realized volatility and the bid-ask spread (illustrative characterization)
The retreat of market makers shows up not only in widening spreads but, more so, in the rapid evaporation of order-book depth. In the early phase of rising volatility, market makers may merely widen their quotes; but if volatility keeps climbing and reaches the circuit-breaker threshold in their internal risk-control models, they rapidly cancel all limit orders. At that point, the seemingly abundant "apparent liquidity" on the order book vanishes in an instant, leaving an extremely fragile market vacuum. This behavior stems not from panic or irrationality but from a precise calculation of the profit function: when inventory-cost convexity makes the expected return to continued market making negative, retreat becomes the only optimal choice.
20.2.2 The transmission mechanism of spread widening
Market makers' widening of spreads and withdrawal of depth is merely the starting point of the volatility-liquidity spiral. This microstructural contraction of liquidity then acts back on the macro market's price-discovery process through a clear transmission chain, ultimately driving volatility still higher.
First, the widening of spreads directly causes transaction costs to rise sharply. For an ordinary market-order trader, this means not only greater slippage but also an order book whose depth has been drastically reduced. In such an environment, even a medium-sized order cannot be fully absorbed near the best bid and ask, and instead inevitably "breaks through" several price levels. This phenomenon is the amplification of price impact.
The amplification of price impact means that a given trading volume produces a far larger price movement in a liquidity-starved market than it would under normal conditions. The price-impact coefficient proposed by Kyle (1985) [10] can quantify this effect. Under normal market conditions, a $10 million Bitcoin market order might cause only a 0.05% price move; but in the extreme conditions of a liquidity retreat, the same order could cause the price to plunge 1% or more in an instant. This violent price swing caused by liquidity depletion shows up statistically as a direct surge in realized volatility.
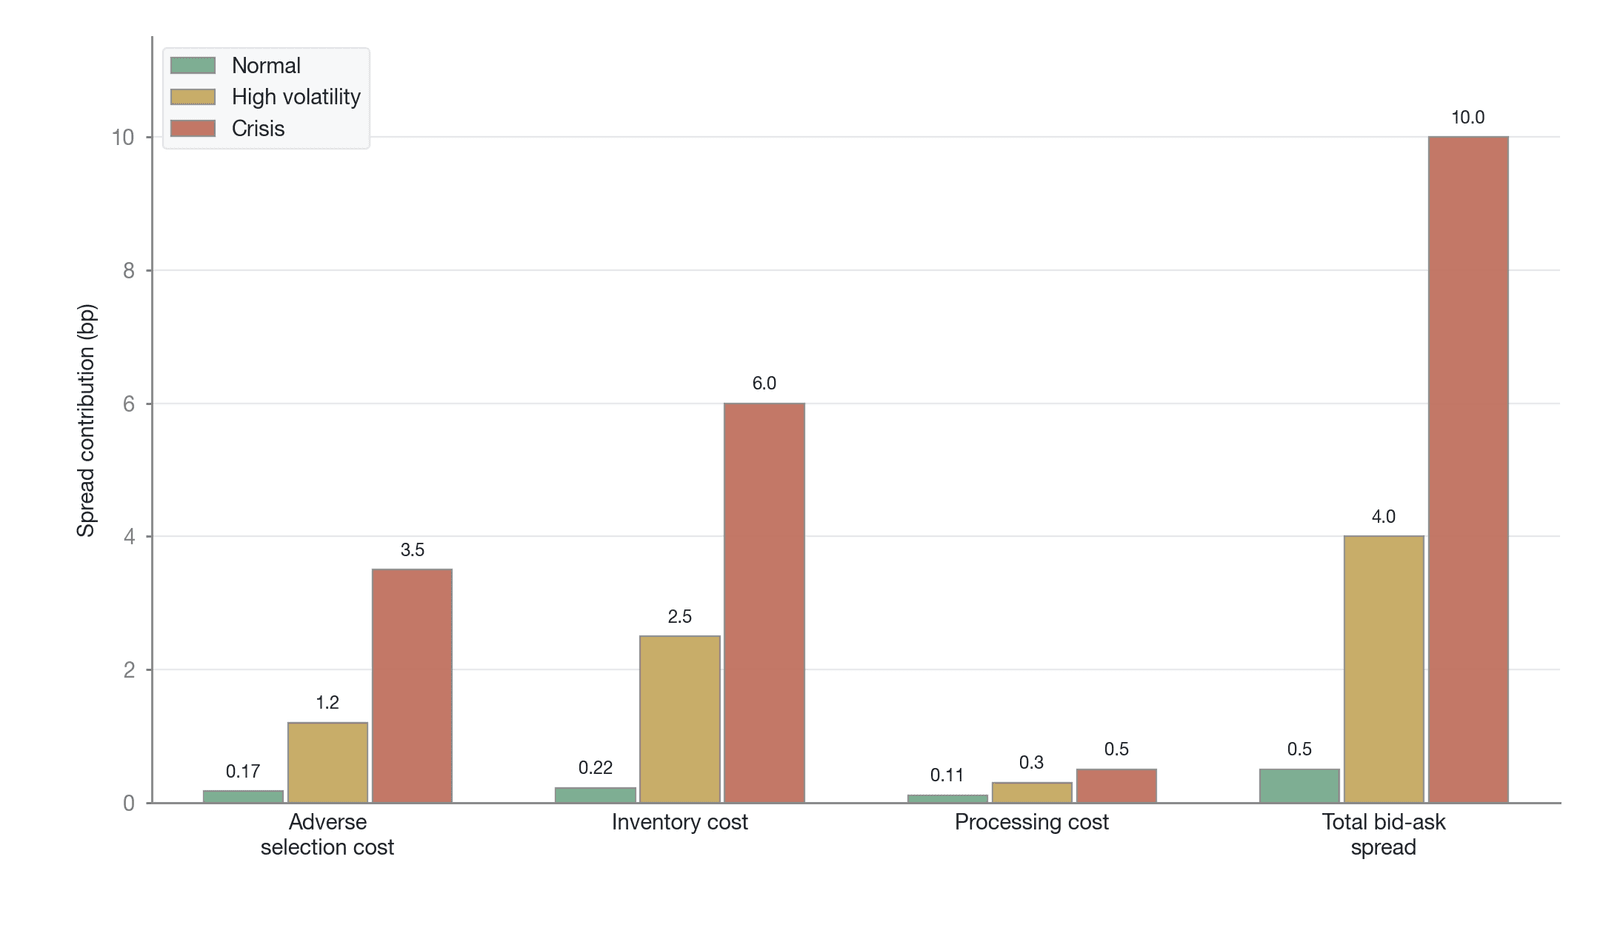
Figure 20-4. The Glosten-Milgrom decomposition of the bid-ask spread (normal, high-volatility, and crisis regimes; illustrative values)
At this stage, the rise in volatility has decoupled from any external fundamental information and has become a purely liquidity-driven phenomenon. No new negative news has arrived; simply for want of a bid, the price falls rapidly under the impact of a small sell order. The emergence of this "non-informational volatility" marks the formal closing of the positive-feedback loop. High volatility drives liquidity to retreat, the retreat of liquidity amplifies price impact, and price impact drives volatility higher still. Once this spiral is set in motion, it accelerates continuously on its own endogenous positive feedback until some external force—an exchange outage, a circuit breaker, or the entry of large new capital—forcibly interrupts the process.
20.2.3 Trigger conditions and the critical point of the spiral
If the volatility-liquidity spiral is so destructive, why does it not occur every day? The answer is that the spiral's onset requires specific trigger conditions and involves a highly nonlinear critical band.
From a game-theoretic perspective, market makers providing liquidity face a classic "coordination game." Under normal conditions, if all market makers remain in the market, overall liquidity is ample, price impact is small, and the risk each maker bears is within a controllable range. This is a Pareto-optimal "good equilibrium." Once the market suffers some initial shock that raises volatility, however, each market maker begins to guess how its competitors will respond. If market maker A expects market maker B to pull its orders out of fear of risk, then A's optimal strategy is to pull its own orders ahead of B, so as not to become the sole liquidity provider in the market and bear all the adverse-selection risk.
This expectation-based, self-fulfilling mechanism gives the collapse of liquidity its suddenness and synchronization. When volatility approaches a certain critical band, market expectations reverse in an instant. At that moment, the strategic risk of maintaining quotes rises sharply, and collective retreat becomes the only Nash equilibrium. This mechanism has a structure similar to the bank-run model described by Diamond and Dybvig (1983) [11]: when depositors lose confidence in a bank's liquidity, the run itself causes the bank to fail. In perpetual futures markets, once market makers' confidence in market liquidity is shaken, their collective retreat instantly manufactures the very liquidity crisis they fear.
This analogy, however, contains an important structural difference. The strategic complementarity in the Diamond-Dybvig model arises from the first-come, first-served constraint of the deposit contract: depositors at the back of the line face the risk that the bank's assets have already been emptied, so each depositor has an incentive to withdraw first. The source of strategic complementarity in market-maker retreat is entirely different: it is not a queuing effect but an informational externality. When other market makers retreat, those who remain must face all of the toxic order flow alone, and their adverse-selection risk climbs sharply. The global-games framework of Morris and Shin (1998) [12] may capture this mechanism more precisely: each market maker makes a binary decision (stay or retreat) based on its private signal about volatility, order-flow toxicity, and peer behavior, and when the signal crosses a certain threshold, the state flip from staying to retreating happens almost simultaneously. This distinction carries important implications for the design of governance solutions: a bank run can be prevented through deposit insurance, whereas market-maker retreat driven by an informational externality requires different intervention tools, such as enhancing market transparency to reduce signal noise, or introducing mandatory minimum-quoting obligations to remove the dominant strategy of retreat.
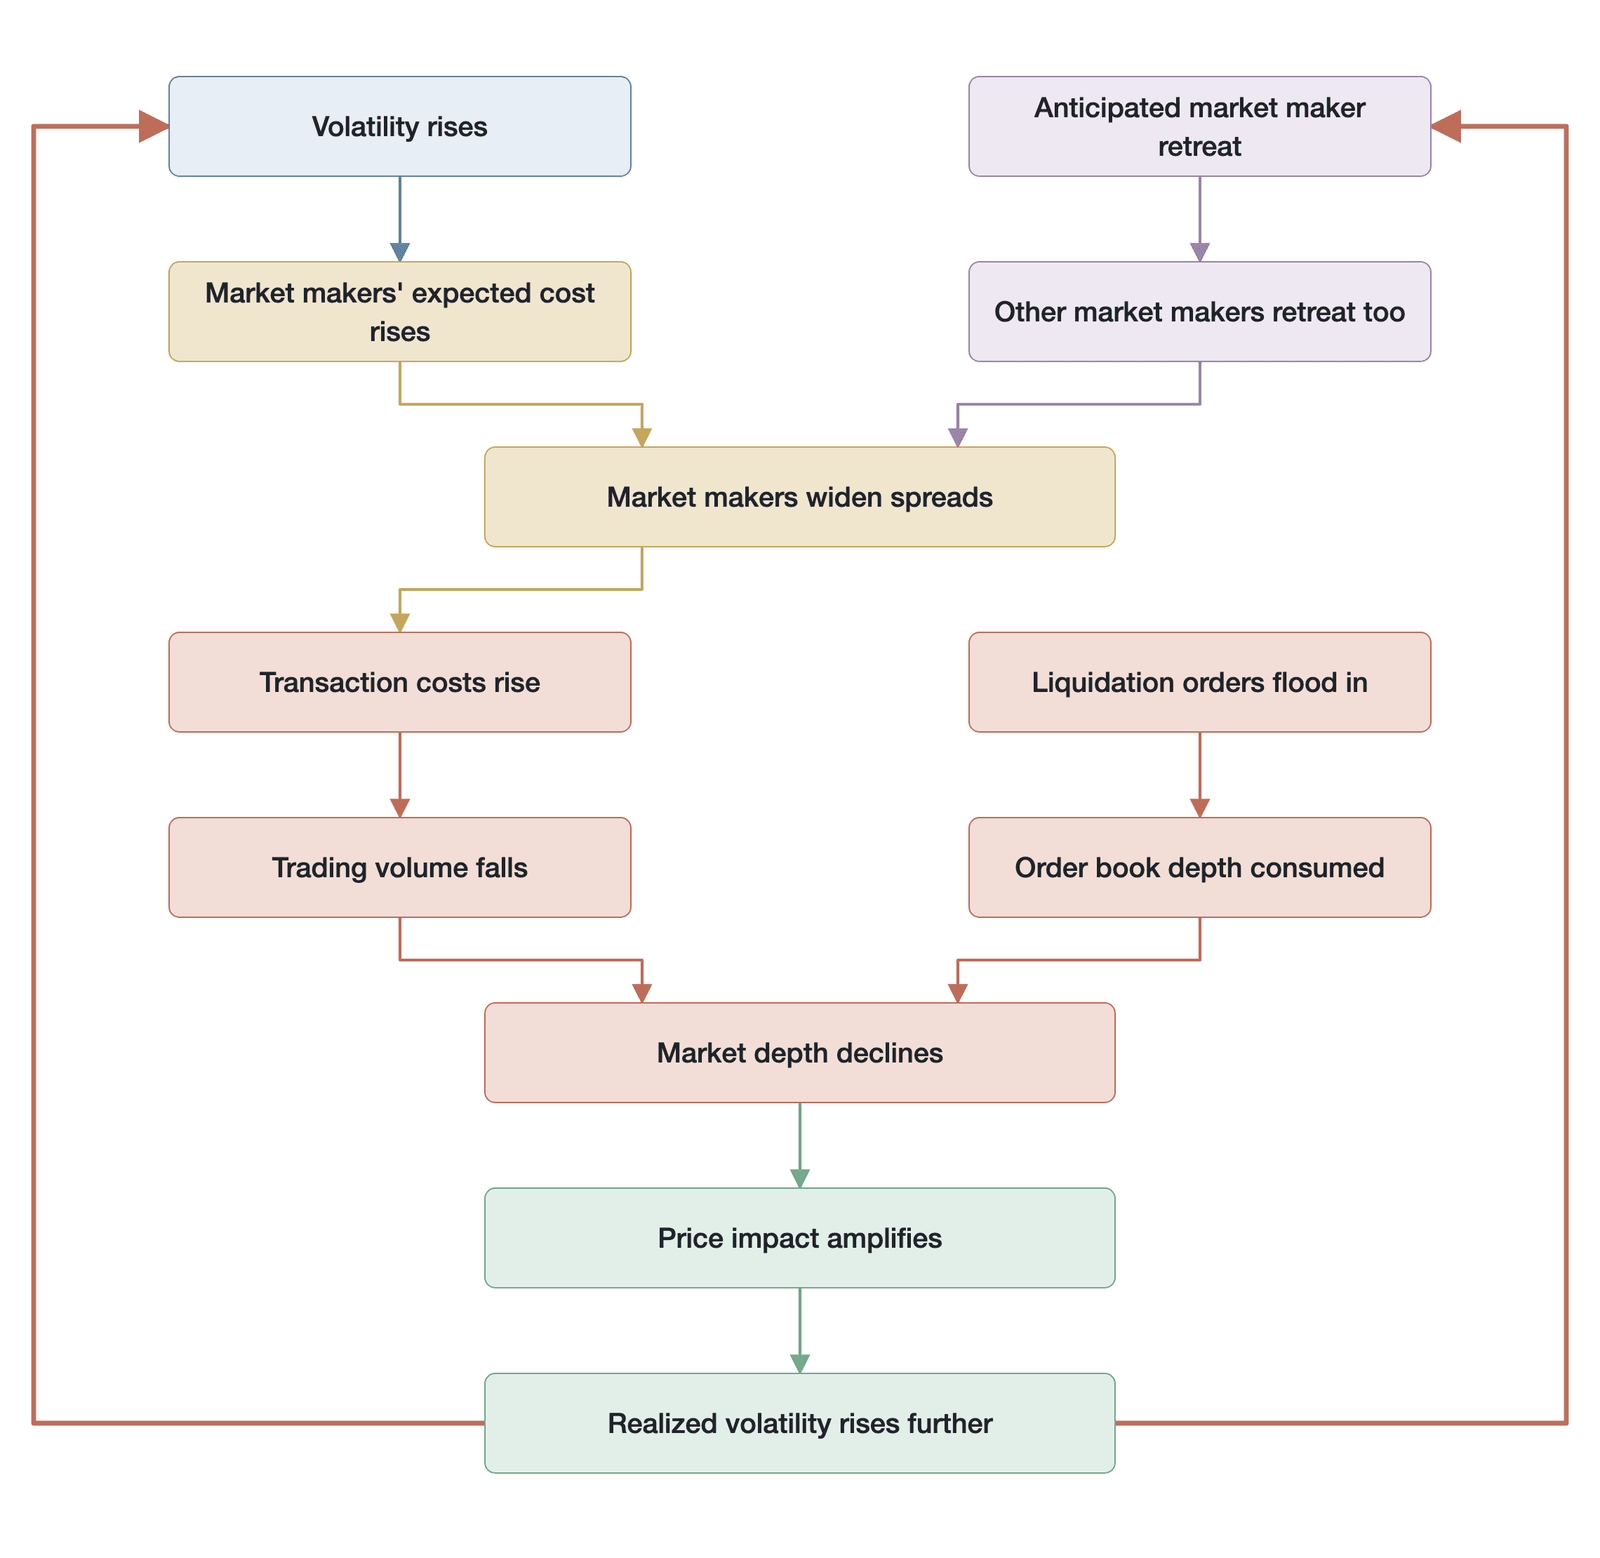
Figure 20-5. The transmission chain and critical point of the volatility-liquidity spiral
The Bitcoin flash crash of May 19, 2021 provides a typical case. That day, under the blow of multiple macro headwinds, the Bitcoin price began to fall. At first this was merely a normal market correction. But as the price broke through key support levels, large numbers of high-leverage long positions were pushed into the liquidation zone. Forced-liquidation market sell orders poured into the market, causing volatility to surge. Within about six hours, the bid-ask spread at top exchanges widened from a normal 0.5 basis point to 40 basis points, and order-book depth evaporated by more than 80%. Under the extreme load, Binance even experienced a gap of as long as 40 minutes in its trading data. In the phase of complete liquidity vacuum, the Bitcoin price fell at one point from about $43,000 to about $30,000, a drop of more than 30%. The core figures on the BTC side in this event—the BTC drawdown, depth evaporation, spread, and duration—are compiled from exchanges' historical candlestick and liquidation data (the exchange-side price-protection mechanism is detailed in Section 20.3.4 and the Deribit report cited there); they are anchored here once and referenced back in later passages, while the ETH-side drawdown figures are first given in Section 20.3.4. This is precisely what the volatility-liquidity spiral looks like once volatility crosses its critical point and spins out of control.
20.2.4 Cross-asset spillover effects
The impact of the volatility-liquidity spiral is not confined within a single asset; it is also strongly contagious across assets and across markets. When market makers suffer inventory losses on a core asset or face extreme volatility, portfolio-level risk-control directives force them to withdraw their supply of liquidity on other assets simultaneously. This contagion unfolds along four dimensions—cross-asset, cross-exchange, cross-layer, and cross-product—amplifying a local volatility shock into a systemic liquidity crisis. Section 20.7 provides a detailed analysis of these four contagion dimensions.
20.2.5 A mathematical characterization of the spiral
The mechanism of the volatility-liquidity spiral can be formalized through the mathematical properties of the market maker's profit function. The formalizations in this section and throughout the chapter are illustrative specifications that characterize the qualitative structure of a mechanism; their parameters are not calibrated to real data, and the associated numbers should be read as illustrations of the mechanism rather than empirical estimates. The market maker's profit function can be simplified into a key trade-off. Let the market maker's profit at time be:
Here the relationship between inventory cost and volatility is markedly convex. Let inventory cost be , where is realized volatility, is the inventory quantity, and is a dimensional risk-aversion coefficient (used to normalize into monetary units). Here , , and are all illustrative specifications, not calibrated to real volatility and inventory data. The implication of this functional form is profound: when volatility rises from to , inventory cost rises from to , a fourfold increase. This factor of four reflects the quadratic convexity of , not an exponential relationship. This nonlinear cost structure means that when volatility doubles, the market maker must maintain profit by sharply raising spreads or sharply reducing inventory.
In the Bitcoin flash crash of May 19, 2021, this mechanism was especially evident: that day, realized volatility surged from a daily 3% to more than 25% in just six hours, and spreads and depth accordingly went through a three-stage illustrative deterioration (its staged figures are the May 19 definitions anchored in Section 20.2.3; see also Figures 20-3 and 20-4), with most market makers withdrawing from the market entirely. This staged deterioration is precisely the rational response of market makers to steadily rising inventory costs.
More important, this process exhibits a clear "critical point" phenomenon. As the spread widened from 10 bps to 15 bps, trading volume did not decline noticeably. But once the spread breached 20 bps, volume began to shrink sharply, which caused market makers' total profit to fall instead, further incentivizing them to withdraw liquidity. This "abrupt" behavioral shift is the direct manifestation of the profit equation turning from positive to negative somewhere within a certain volatility band. Mathematically, this corresponds to a rapid (non-smooth) transition of the market maker's profit equation from positive to negative over a certain volatility range. Because the expression for above is not given an explicit differentiable functional form, this section makes no formal claim about whether that transition is a discontinuous jump in the strict sense.
20.3 The leverage-liquidation-liquidity cascade
Of the three positive-feedback loops, the liquidation cascade produces the most direct shock. Liquidation not only consumes liquidity directly, by devouring order-book depth, but also destroys liquidity indirectly, by driving out market makers. The superposition of these two effects creates a positive-feedback loop far more violent than the volatility-liquidity spiral, leaving the market highly prone to a nonlinear collapse when shocked. Unlike the volatility-liquidity spiral discussed above, the destructiveness of the liquidation cascade lies in its compulsory and irreversible nature: once set in motion, it is hard to stop through traders' voluntary adjustments. The liquidation cascade is also distinctive in that it converts microscopic individual risk into macroscopic systemic risk, so that the liquidation of a single trader can trigger a chain reaction that ultimately drains liquidity from the entire market.
20.3.1 The endogeneity of leverage
Traditional market-microstructure theory tends to treat a trader's leverage level as an exogenous variable—a fixed multiple chosen at the time a position is opened. In perpetual futures markets, however, the system's effective leverage is highly endogenous: it is a dynamic function of the price level, open interest, margin balance, and liquidation threshold. This endogeneity makes the market increasingly fragile as prices fall, forming a hidden risk-amplification mechanism.
The endogeneity of effective leverage shows up in its procyclical character. When prices rise, the unrealized profit on long positions increases, margin balances become ample, and the system's average effective leverage falls, so the market grows safer. Conversely, when prices fall, the margin on long positions is eroded and effective leverage climbs passively. This mechanism means that as prices fall, the number of positions drawing ever closer to the liquidation trigger line increases at an accelerating rate.
Concretely, suppose a trader goes long 1 BTC of perpetual futures at $50,000 with an initial margin of $10,000 (initial leverage of 5x) and a maintenance-margin rate of 5%. When the price rises to $55,000, an unrealized profit of $5,000 raises account equity to $15,000, and effective leverage falls from 5x to 3.67x ($55,000/$15,000), markedly improving the margin cushion. But when the price falls to $45,000, an unrealized loss of $5,000 erodes half the initial margin, account equity shrinks to $5,000, and effective leverage climbs passively to 9x ($45,000/$5,000). If the price falls further to $42,000, account equity is only $2,000 while the maintenance-margin requirement is $2,100 ($42,000 × 5%), and the position will be forcibly liquidated. This passive rise in leverage is not the trader's active choice but the algebraic result of the market state.
Figure 20-6 shows how, under a fixed initial margin ($10,000) and 5x initial leverage, a price decline causes effective leverage to rise nonlinearly and approach the liquidation threshold.
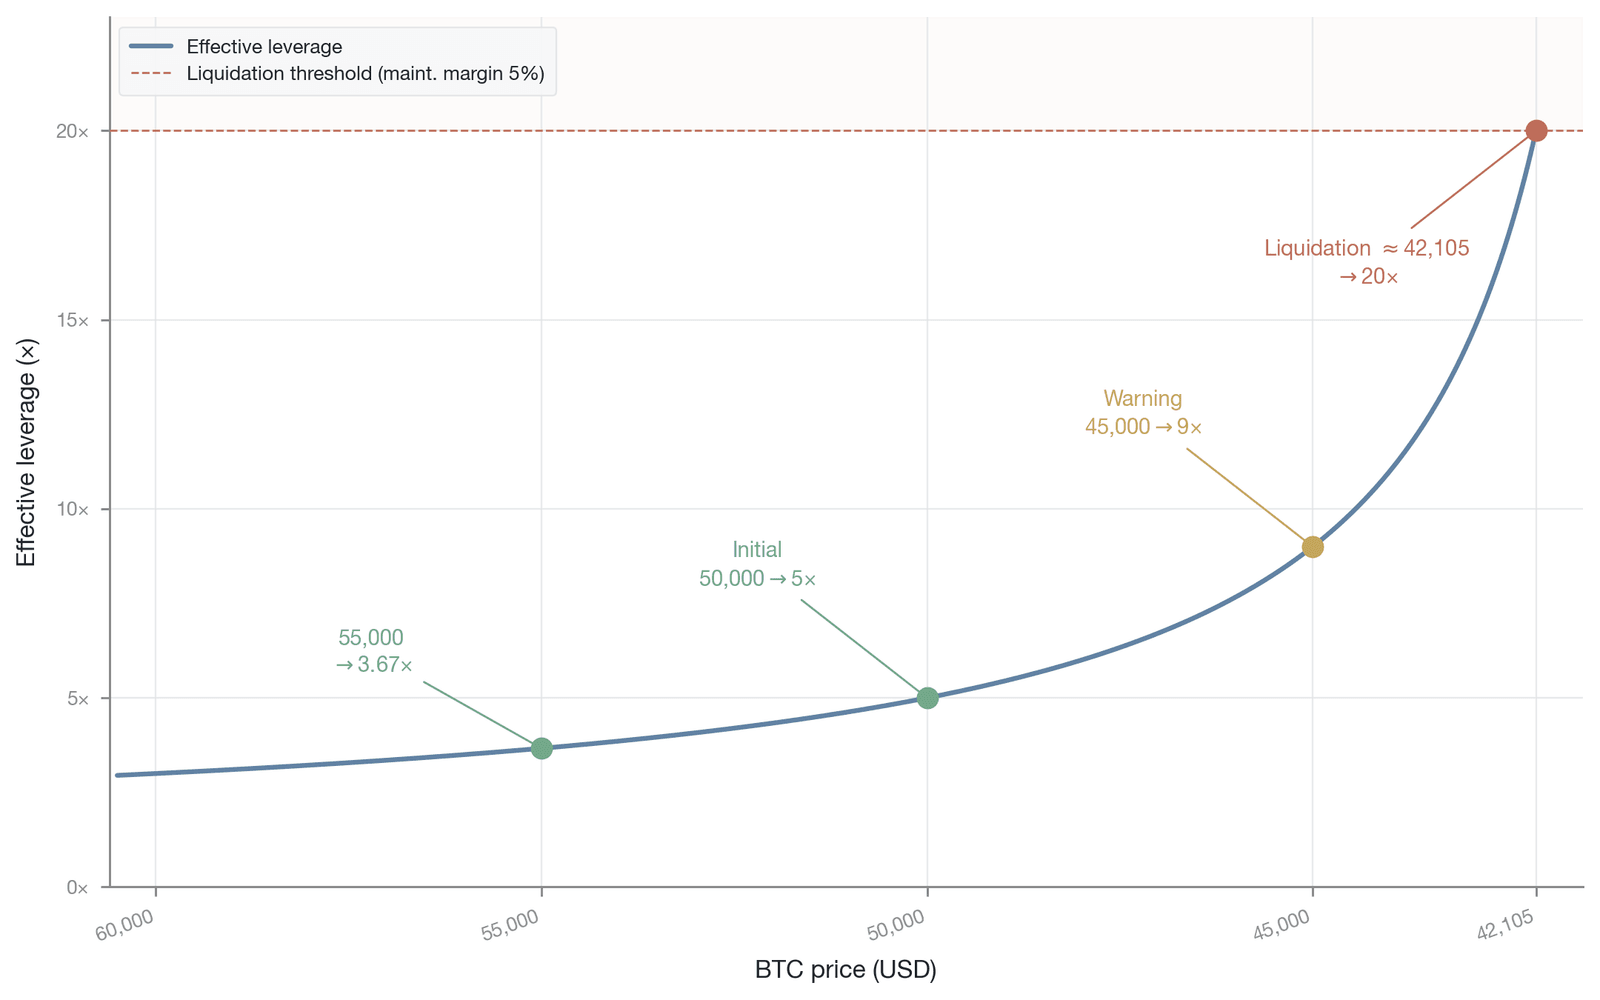
Figure 20-6. The procyclicality of leverage and the nonlinear rise in liquidation risk (Data source: derivation from a theoretical model)
This procyclicality of leverage explains why a seemingly mild initial price shock can evolve into a catastrophic market collapse. In the early phase of a price decline, the rise in system leverage mainly absorbs traders' buffer capital; but once the price crosses a certain critical point, large numbers of high-leverage positions hit their liquidation lines simultaneously, converting potential demand for liquidity into an actual market shock. This procyclical dynamic of "accumulating leverage in the bull market and releasing it all at once in the bear market" is precisely the core proposition characterized by Geanakoplos's (2010) [13] theory of the leverage cycle: in a rising asset-price phase, collateral constraints loosen and leverage climbs endogenously; in a falling phase, shrinking collateral values force deleveraging to occur all at once, amplifying price swings. Brunnermeier and Pedersen (2009) [4], in their classic liquidity-spiral model, further point out that the procyclicality of margin requirements is one of the core mechanisms that cause market liquidity to dry up suddenly. Their model shows that when funding costs rise (that is, when margin requirements increase), market makers' funding constraints tighten, which reduces their supply of liquidity, forming a self-reinforcing vicious cycle. In perpetual futures markets, this mechanism is amplified through the nonlinear character of the liquidation trigger line.
The endogeneity of leverage also means that high-leverage positions accumulated in a bull market become a concentrated source of systemic-risk release in a bear market. Many traders steadily increase their leverage multiple during a sustained price rise, because their margin cushion keeps improving and their risk perception is dulled. But once the price reverses, these positions go from "safe" to "dangerous," and from "profitable" to "loss-making," in a very short time. The speed of this state change often exceeds traders' ability to react, resulting in passive liquidation.
20.3.2 Inelastic demand for liquidity
In a normal trading environment, demand for liquidity is elastic: traders can adjust order size or defer trading according to market depth and execution costs. The liquidation mechanism, however, converts this elastic demand into perfectly inelastic, mandatory demand for liquidity, thereby fundamentally shocking the market structure. This transformation is one of the most fundamental differences between perpetual futures markets and traditional markets.
The special nature of liquidation orders stems from their execution mechanism. When a position's margin rate falls below the maintenance-margin requirement, the liquidation engine takes over the position and pushes it into the market as a market order or an aggressive limit order. This mode of execution strips the trader of any freedom to choose timing or price; the order must be filled immediately at whatever price is currently available. As the price falls rapidly, liquidation volume grows at an accelerating rate because of leverage endogeneity, causing more and more inelastic sell orders to pour into the order book.
The concentrated eruption of inelastic demand for liquidity directly causes a nonlinear amplification of price impact. Kyle's (1985) [10] price-impact model shows that the sensitivity of the market price to order flow—the price-impact coefficient —is inversely proportional to market depth. When enormous liquidation orders pour in over an extremely short interval, they not only consume the existing liquidity reserve but also force the market to clear at an extreme discount, thereby creating the conditions for the next round of liquidation. Kyle's linear price-impact model assumes that market makers cannot distinguish informed from uninformed order flow; as Section 20.3.3 discusses, however, liquidation orders have identifiable mechanical features. This means the actual price impact in a liquidation cascade may exhibit nonlinear (convex) features that exceed the linear model's predictions.
Compared with traditional futures markets, the liquidation mechanism of perpetual futures is more aggressive: as described in Section 20.1.3 and Table 20-3, traditional exchanges grant a margin-call buffer period when margin is insufficient, whereas perpetual liquidation executes the moment it is triggered, leaving no time to react. This difference makes liquidation flow in perpetual markets markedly higher than in traditional markets during stress periods, exerting greater shock on liquidity.
The compulsory nature of liquidation also means that the arrival of liquidation orders is unpredictable. Market makers cannot know in advance when a large volume of liquidation orders will pour in, so they must prepare for the worst case. This uncertainty further raises the risk cost of market making, making market makers more inclined to shrink their supply of liquidity during high-volatility periods.
20.3.3 The dual-shock mechanism
The damage that a liquidation cascade does to market liquidity is not a single-dimensional consumption of depth; it is a dual shock composed of depth devouring and market-maker expulsion. The interaction of these two effects explains why, under extreme conditions, liquidity disappears far faster than a linear model predicts.
The first shock is the direct devouring of depth. The market orders generated by the liquidation engine consume the limit orders on the book layer by layer in price-priority order. Because liquidation orders are typically far larger than ordinary trades, they can easily break through the first and second layers of liquidity, producing significant slippage. This physical consumption of depth not only reduces the market's capacity to absorb subsequent shocks but also directly depresses the mark price, thereby pushing still more previously safe positions into the liquidation zone.
The second shock is the active retreat of market makers. As noted earlier, market makers face enormous adverse-selection risk when confronting extreme volatility and one-directional order flow. The toxicity of liquidation orders differs from the informational toxicity that informed traders bring in traditional market microstructure: liquidation orders themselves carry no private information about the asset's fundamentals; their toxicity stems from the extreme adverse-selection risk that their compulsory and unpredictable nature imposes on market makers. When a market maker's algorithm detects a large influx of liquidation orders, it cannot distinguish whether these orders are uninformed forced closures or informed directional selling. To protect their own capital, market makers respond rationally by widening the bid-ask spread or pulling their quotes outright. This behavior causes available liquidity to evaporate actively at the very moment it is most needed. This "liquidation → selling → further price decline → more liquidation" fire-sale spiral is isomorphic to the fire-sale mechanism characterized by Shleifer and Vishny (1992) [14]: when forced sellers clear positions in concert while the natural buyers (peers with the valuation capacity and balance sheet to absorb them) are equally constrained, assets trade at liquidation prices far below fundamentals, and liquidation value and debt capacity depress each other, forming positive feedback.
To quantify the compounded effect of the dual shock, Figure 20-7 contrasts the predictions of a single-factor model that considers only the depth-devouring effect with those of a two-factor model that also incorporates the market-maker-retreat effect on liquidity consumption.
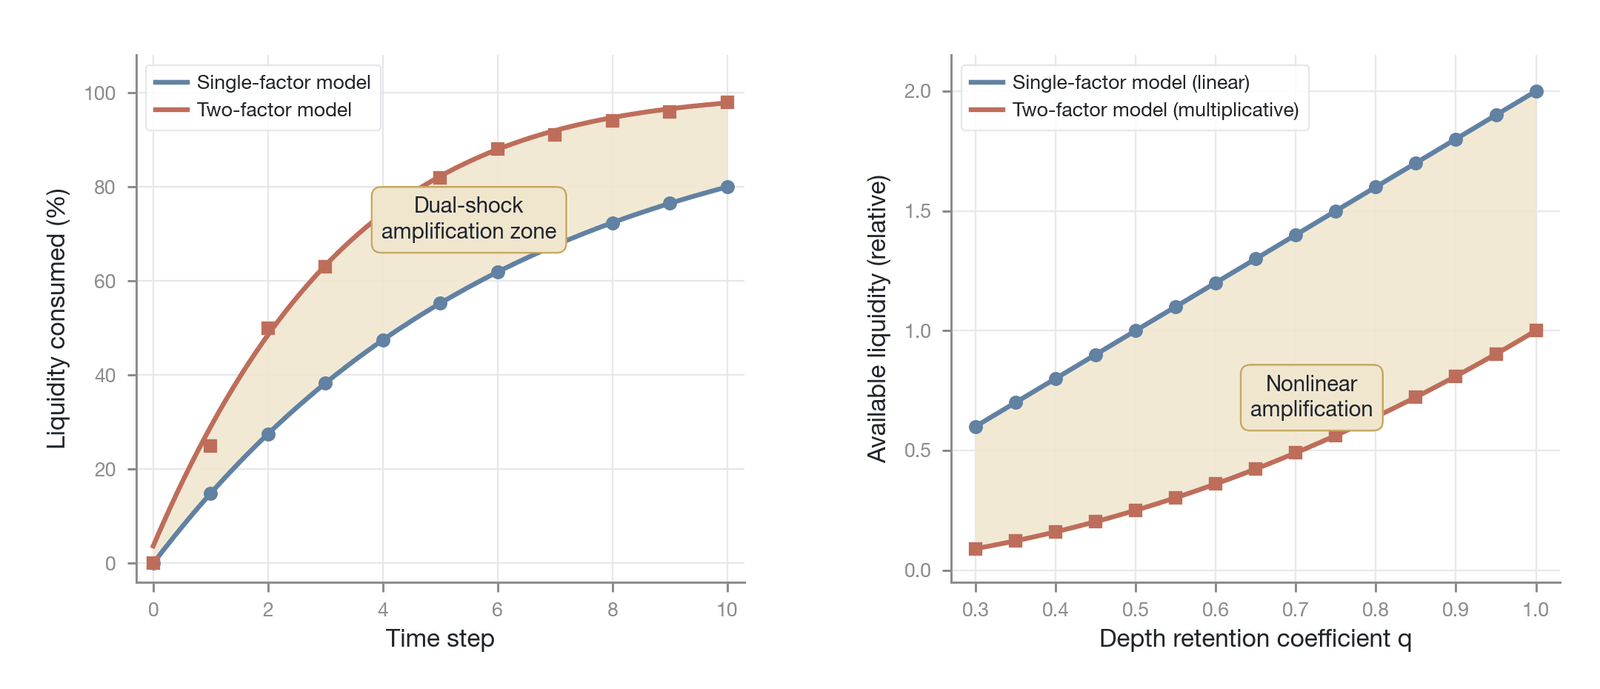
Figure 20-7. The dual-shock mechanism of liquidity consumption: the multiplicative effect of depth devouring and market-maker retreat (Data source: derivation from a theoretical model)
The superposition of the dual shock produces a marked multiplicative effect. On one hand, liquidation orders physically consume order-book depth; on the other, the retreat of market makers reduces the replenishment of new liquidity. This two-way deterioration of supply and demand causes the market's effective liquidity to fall sharply (superlinearly), ultimately forming a price gap. From a mathematical standpoint, let initial available liquidity be , let the depth-consumption factor denote the proportion of order-book depth remaining after liquidation orders are consumed, and let the market-maker-retention factor denote the proportion of market makers still providing quotes. If an analyst considers only the larger of the two single effects, they might use as the benchmark for assessing liquidity. The actual effect of the dual shock, however, is multiplicative: . For example, under the assumption that and are mutually independent, when depth consumption is 40% (, illustrative example) and market-maker retreat is 40% (, illustrative example), taking only a single effect would overestimate remaining liquidity at 60% of the initial level, whereas the multiplicative model gives 36%. This 36% is the worst-case lower bound under the independence assumption (the theoretical upper bound on losses), not a measured value. In fact, real exchanges' liquidation engines implement a variety of buffering mechanisms, including tiered liquidation (first attempting to fill via limit orders and converting to market orders only on failure) and smart order-splitting strategies, so that a negative dependence exists between the two factors: more refined liquidation execution reduces the depth impact of any single liquidation, which in turn slows the pace of market-maker retreat. Therefore, the multiplicative model describes a worst-case theoretical lower bound under the assumption that and are independent, while the actual effect (milder, because and are negatively dependent) depends on the specific implementation of the liquidation engine. The earlier references to "underestimation" and "underestimated by nearly half" should be understood as the gap between the upper bound under this independence assumption and the single-factor estimate, not as a measurement of the true liquidity loss.
Another consequence of market-maker retreat is that it destroys the market's price-discovery function. Under normal conditions, market makers help the market discover the equilibrium price by providing liquidity on both sides of the book. In a liquidation cascade, however, the retreat of market makers causes a severe asymmetry in liquidity on the two sides, and the market cannot conduct effective price discovery. In this situation, price movements no longer reflect fundamental information but are purely liquidity-driven.
20.3.4 The nonlinear cascade and state transitions
The most salient feature of the liquidation cascade is its state-transition-like nonlinearity. Faced with shocks of different magnitudes, the market exhibits sharply different microstructural responses. This nonlinearity explains why there is a marked state transition between "just short of triggering a cascade" and "just barely triggering a cascade." This chapter here borrows the term "phase transition" from physics as an analogical description of this transition, and gives a falsifiable criterion for its core assertion rather than treating it as a proven mathematical property.
When liquidation volume is below a certain critical threshold, the market's existing liquidity is sufficient to absorb the forced sell orders, price impact is confined to a local range, and the system can quickly return to equilibrium. Once liquidation volume exceeds that threshold, however, the existing depth is completely broken through, the price is pushed to the next liquidation line, and new liquidation orders are triggered. At this point the positive-feedback loop is activated, and the system transitions rapidly from a controllable state to an uncontrollable one. The existence of this transition means that market risk is not smoothly distributed but concentrated near certain critical bands. This "phase-transition" hypothesis can be falsified as follows: if, as liquidation volume increases continuously, both price impact and available depth change continuously and smoothly, without any abrupt change (jump-like deterioration) in depth and price impact appearing near a particular liquidation-volume level, then for that event a phase transition in the sense of this section does not hold—it degenerates into a steep but continuous response curve.
The crypto-market flash crash of May 19, 2021 is a typical case of this nonlinear cascade. Over the full span of less than 12 hours, the Ethereum price plunged more than 46% and Bitcoin fell about 32% cumulatively (this is the cumulative drawdown over the full span; the $43,000→$30,000 move and the drop of more than 30% recorded in Section 20.2.3 refer to the interval drawdown within the roughly six-hour window in which the collapse in spreads and depth was most violent, and the two definitions are mutually compatible). According to Deribit's market-analysis report [15], extreme network-wide liquidation volume caused severe liquidity depletion, prompting exchanges to trigger price-protection and rate-limiting mechanisms. In this event, Deribit's price-protection mechanism was triggered when the ETH index price moved rapidly [15]. Unlike the circuit breakers of traditional markets, Deribit's protective measures did not halt trading entirely but instead slowed the response speed of the liquidation engine by limiting the rate of change of the mark price, buying market participants a window of time to reassess. Even with such a protective mechanism, however, the speed of liquidity evaporation still exceeded the expectations of most market participants. The BTC drawdown, depth evaporation, and duration in this passage are the reference-backs to the figures anchored in Section 20.2.3, while the ETH drawdown is first given here. This event shows that when liquidation volume breaches the critical band, the speed and scale of liquidity evaporation largely decouple from fundamental logic.
Figure 20-8, taking the dynamic relationship between liquidation volume and available liquidity as its through-line, shows the full path by which a liquidation cascade accelerates nonlinearly after breaching the critical threshold and ultimately produces a liquidity vacuum.
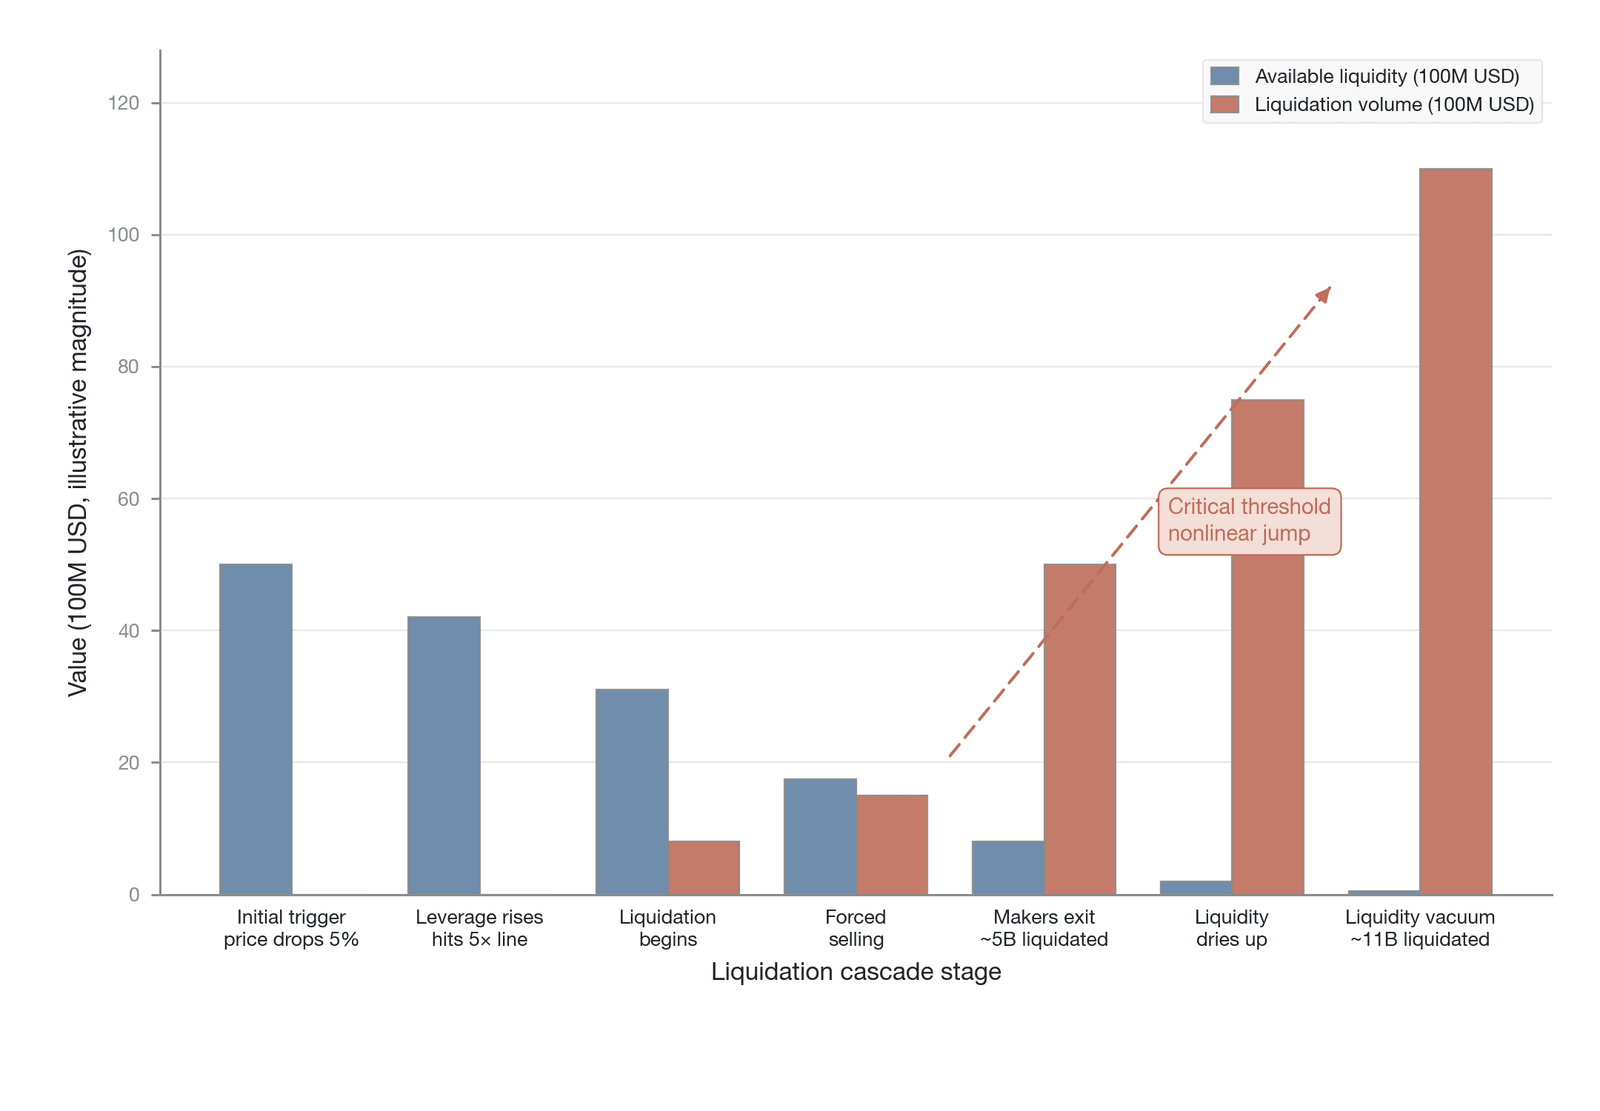
Figure 20-8. The nonlinear development of the liquidation cascade and the formation of a liquidity vacuum (Data source: derivation from a theoretical model)
To mitigate such extreme shocks, exchanges have introduced insurance funds and auto-deleveraging mechanisms. The insurance fund is designed to absorb bankruptcy losses near the liquidation threshold and prevent the spread of systemic risk. The capital scale of the insurance fund, however, is often severely inadequate relative to potential liquidation losses. Binance, for example, had an insurance fund of about $1 billion in 2023, whereas single-day network-wide liquidation volume on May 19, 2021 once exceeded $8 billion; if one takes as reference the extreme single-day network-wide liquidation demand on the same basis, a single exchange's insurance-fund coverage ratio is under 20% (here the numerator is a single exchange's fund and the denominator is network-wide liquidation volume, so the dimensions are not strictly aligned; this is used only to illustrate the vast disparity between fund size and systemic liquidation demand, and the two figures come respectively from exchange disclosures and third-party liquidation statistics, at different points in time). More important, the mechanism by which the insurance fund accumulates is itself procyclical: it builds up gradually through liquidation surpluses in calm markets and is consumed all at once in a crisis, exactly opposite to the direction of demand. In an extreme liquidation cascade, when enormous losses exhaust the insurance fund, the exchange is forced to activate the auto-deleveraging mechanism, forcibly closing profitable positions to cover the losses. Although this mechanism guarantees the system's solvency, by forcibly stripping profitable traders of their positions it further destroys the stability of market expectations and intensifies the systemic retreat of liquidity.
The activation of the auto-deleveraging mechanism marks the market's entry into the deep phase of the liquidity vacuum. By this point the market's microstructure has completely collapsed, the price-discovery mechanism has failed, and a vast price gap has opened on the order book. What traders face is no longer a matter of liquidity cost but a fundamental difficulty of execution. This phase is characterized by the fact that even a trader willing to clear a position at an extreme price may be unable to find a counterparty. This is the essential definition of a liquidity crisis.
20.4 Funding-rate distortion and position squeezes
Extreme funding rates cause a structural imbalance in liquidity by forcibly altering the position structure. This is the third positive-feedback loop unique to perpetual futures, in which the funding-rate mechanism—originally a tool for price anchoring—is transformed into a catalyst that destroys the supply of liquidity under extreme market conditions. Under normal conditions, the funding rate maintains the convergence of the perpetual and spot prices through a mild arbitrage incentive; but under stress, extreme rate levels trigger large-scale one-directional demand to close positions while simultaneously driving out market makers, forming a self-reinforcing liquidity crisis.
20.4.1 The distortion of the rate signal
Under normal conditions, the funding rate reflects the relative strength of the long and short forces in the market, but under extreme market conditions it turns into a structural factor that distorts the directional distribution of liquidity. The settlement frequency of the funding rate differs markedly across exchanges and is undergoing rapid evolution. Early perpetual futures commonly used a discrete mechanism settling once every 8 hours, but Binance, Bybit, and OKX have successively launched product lines settling every 4 hours or even every 1 hour, while on-chain perpetual futures platforms use near-continuous, high-frequency settlement. Higher settlement frequency in theory lowers the absolute rate value of any single settlement, thereby lessening the concentrated closing shock at the moment of settlement. This improvement, however, does not necessarily eliminate the rate-driven fragility of liquidity: higher-frequency settlement means the rate responds more sensitively to the market state, and in an extreme one-sided market this can cause the rate to remain persistently at an extreme level rather than delivering an intermittent shock. The following analysis proceeds on the basis of a discrete settlement mechanism, but its core logic—directional liquidity imbalance driven by extreme rates—holds under different settlement frequencies. Under normal conditions, market makers provide roughly symmetric liquidity on both sides of the order book, keeping the trading environment friendly to both longs and shorts. When the market enters a one-sided extreme regime, a violent surge in the funding rate breaks this symmetry and triggers a severe mismatch between the supply of and demand for liquidity.
During periods of extreme positive rates, holders of long positions face high carrying costs. This cost pressure prompts longs to close in concert, which means the sell-side demand for liquidity in the market rises sharply. At the same time, however, market makers face markedly intensified inventory skew and adverse-selection risk. To avoid accumulating an excessive long inventory by absorbing large volumes of long-closing flow, market makers rationally reduce or even withdraw their sell-side supply of liquidity. This severe mismatch between the willingness to buy and to sell causes liquidity to become directionally distorted: sell-side depth dries up while buy-side depth may be relatively ample. Conversely, during periods of extreme negative rates, holders of short positions are forced to pay high rates, causing shorts to close in concert by buying, and buy-side demand for liquidity surges. The same logic drives market makers to shrink their buy-side supply of liquidity, causing buy-side depth to fall sharply.
There is a negative relationship between the funding rate and available liquidity, and this deterioration typically accelerates in the high-rate range. Specifically, when the absolute value of the funding rate is in a mild range, market makers can absorb the risk by adjusting spreads, and liquidity declines relatively gently; but when the rate enters a high range that portends an imminent wave of one-directional liquidation, market makers' profit-equation expectations turn negative, and they choose to pull their orders outright rather than merely widen spreads, so the deterioration in liquidity noticeably accelerates. Whether an estimable critical rate threshold exists, and how the deterioration rate compares on either side of that threshold, is an empirical question that can be tested with bucketed data; what this chapter offers is a qualitative direction rather than a calibrated threshold. This retreat is not only one-directional but is often carried out by multiple market makers simultaneously, instantly manufacturing a liquidity vacuum in a particular direction.
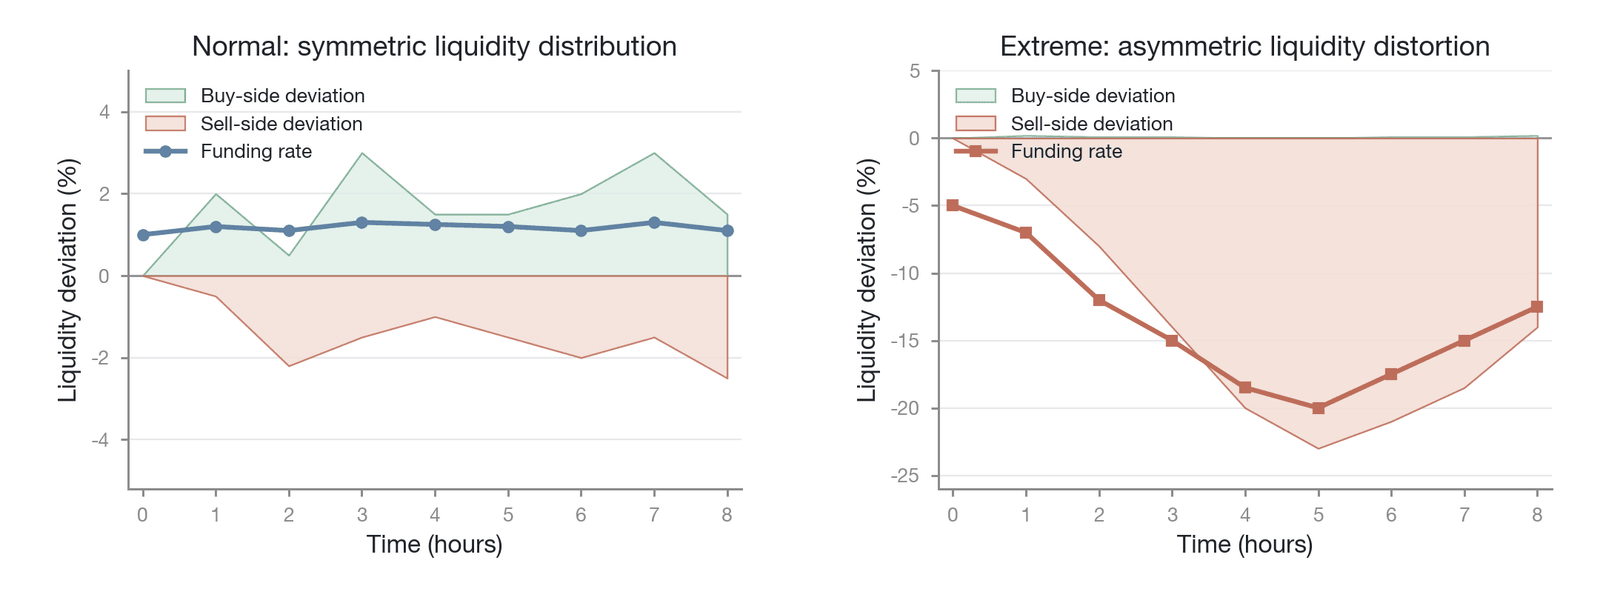
Figure 20-9. The relationship between the funding rate and the directional distribution of liquidity
The left panel of Figure 20-9 shows the symmetric two-sided quoting under normal conditions, and the right panel shows the asymmetric distortion under extreme negative rates, with buy-side liquidity shrinking sharply and sell-side orders piling up passively. This distortion means that closing a short will face far higher slippage costs than normal, whereas opening a long is unusually easy, further intensifying the one-sided imbalance in the market.
20.4.2 Position squeezes
A position squeeze is the direct consequence of an extreme funding-rate environment, inflicting severe shock on market liquidity through compulsory directional trading demand. Position squeezes fall into long squeezes and short squeezes, which are markedly asymmetric in their trigger mechanisms and market impact. This asymmetry stems from at least three levels. First, the physical asymmetry of liquidation direction: long liquidation manifests as selling, and the price can approach zero; short liquidation manifests as buying, and the price has no theoretical upper bound, so a short squeeze has greater price-impact potential in the extreme case. Second, the asymmetry in the structure of market participants: retail investors in crypto markets are generally biased toward going long, so long crowding is systematically higher than short crowding, which makes a long squeeze affect a broader base of participants and propagate panic faster. Third, the asymmetry of the funding-rate formula: most exchanges impose upper and lower bounds on the rate, and some exchanges' premium-index algorithms depend on order-book depth, so that when depth is thin the extreme values of the premium index may be amplified, thereby magnifying the distortion of the rate signal (the specific strength of this effect depends on each exchange's premium-index implementation). On balance, a long squeeze is typically accompanied by a rapid price collapse, whereas a short squeeze manifests as a violent upward price surge.
Short squeezes are especially prominent in perpetual futures markets, and their core mechanism lies in the persistent loss effect of negative funding rates on short positions. After the market has experienced a sharp decline, large numbers of speculative shorts pour in and push the perpetual price down, causing the funding rate to turn deeply negative. This extreme negative rate not only increases the carrying cost of shorts but also attracts arbitrageurs to buy the perpetual and sell the spot. When the price stabilizes or rebounds slightly, some high-leverage shorts are forced to close by buying, and this compulsory buy-side demand for liquidity, in an environment lacking market-maker sell-side supply, rapidly drives the price up, thereby triggering more shorts' stop-losses and liquidations and forming a chain of short squeezes.
The Bitcoin flash crash of February 22 to 23, 2021 provides a typical squeeze case. At the time, the Bitcoin price plunged from about $58,000 to about $45,000 over roughly two days, a drop of more than 22% (according to the post-mortem by the Perpetual Protocol team [16], which dates the flash crash to February 21; this chapter records it as February 22 to 23 by the event's duration). This extreme move stemmed not from fundamental news but from the liquidation of a few large high-leverage positions; here the attribution to "a few large positions triggering it" is the post-mortem attribution in [16], while the price range is public market data, and the two come from different sources. As the price fell, the funding rate changed sharply, and market liquidity became extremely scarce because of market-maker retreat. When the price bottomed, extreme negative funding rates and an oversold condition triggered a violent short-covering rally and an influx of arbitrage flow. Because the sell-side depth on the order book had already been cleared, the compulsory buy-to-close orders could only be filled at extremely high slippage, causing the price to "squeeze" upward at great speed. This squeeze destroyed not only directional traders but also inflicted enormous adverse-selection damage on market makers attempting to provide liquidity.
20.4.3 The stabilization limit of arbitrageurs
Funding-rate arbitrageurs are usually regarded as the natural stabilizers of perpetual futures markets. Through basis trades—establishing offsetting positions between the spot market and the perpetual futures market—they earn funding-rate income and, in doing so, objectively promote the convergence of the perpetual price toward the spot price. This stabilizing role, however, is not unlimited; when market stress exceeds their capacity limit, arbitrageurs not only lose their stabilizing function but may even become a factor that intensifies liquidity stress.
The stabilizing force of arbitrageurs stems from their sensitive response to the funding rate. When the funding rate is markedly positive, arbitrageurs buy the spot and short the perpetual, which provides sell-side liquidity to the perpetual market and suppresses excessive premiums; when the rate turns negative, they close or reverse, providing buy-side liquidity. This mechanism works well under normal conditions and effectively dampens price deviations. The capacity of arbitrage capital, however, is finite. When the market suffers an extreme shock and one-directional speculative demand far exceeds the absorptive capacity of arbitrage capital, the funding rate breaks through the arbitrageurs' dampening band and enters an extreme state.
The critical condition for arbitrageurs to retreat is typically determined jointly by a sharp reversal of the funding rate and the depletion of spot-market liquidity. When many basis traders hold "long spot plus short perpetual" positions to collect a positive funding rate, if the market suddenly plunges and drives the rate deeply negative, these originally positive-yielding positions instantly turn into persistently loss-making ones. To stop losses, arbitrageurs are forced to simultaneously buy to close their shorts in the perpetual market and sell to close their longs in the spot market. This large-scale influx of same-direction orders not only creates enormous buy-side demand for liquidity in the perpetual market but also forms heavy selling pressure in the spot market. When all arbitrageurs try to retreat through a narrow liquidity exit at the same time, a concentrated-exit effect inevitably occurs, and the originally stabilizing mechanism turns into an amplifier of volatility.
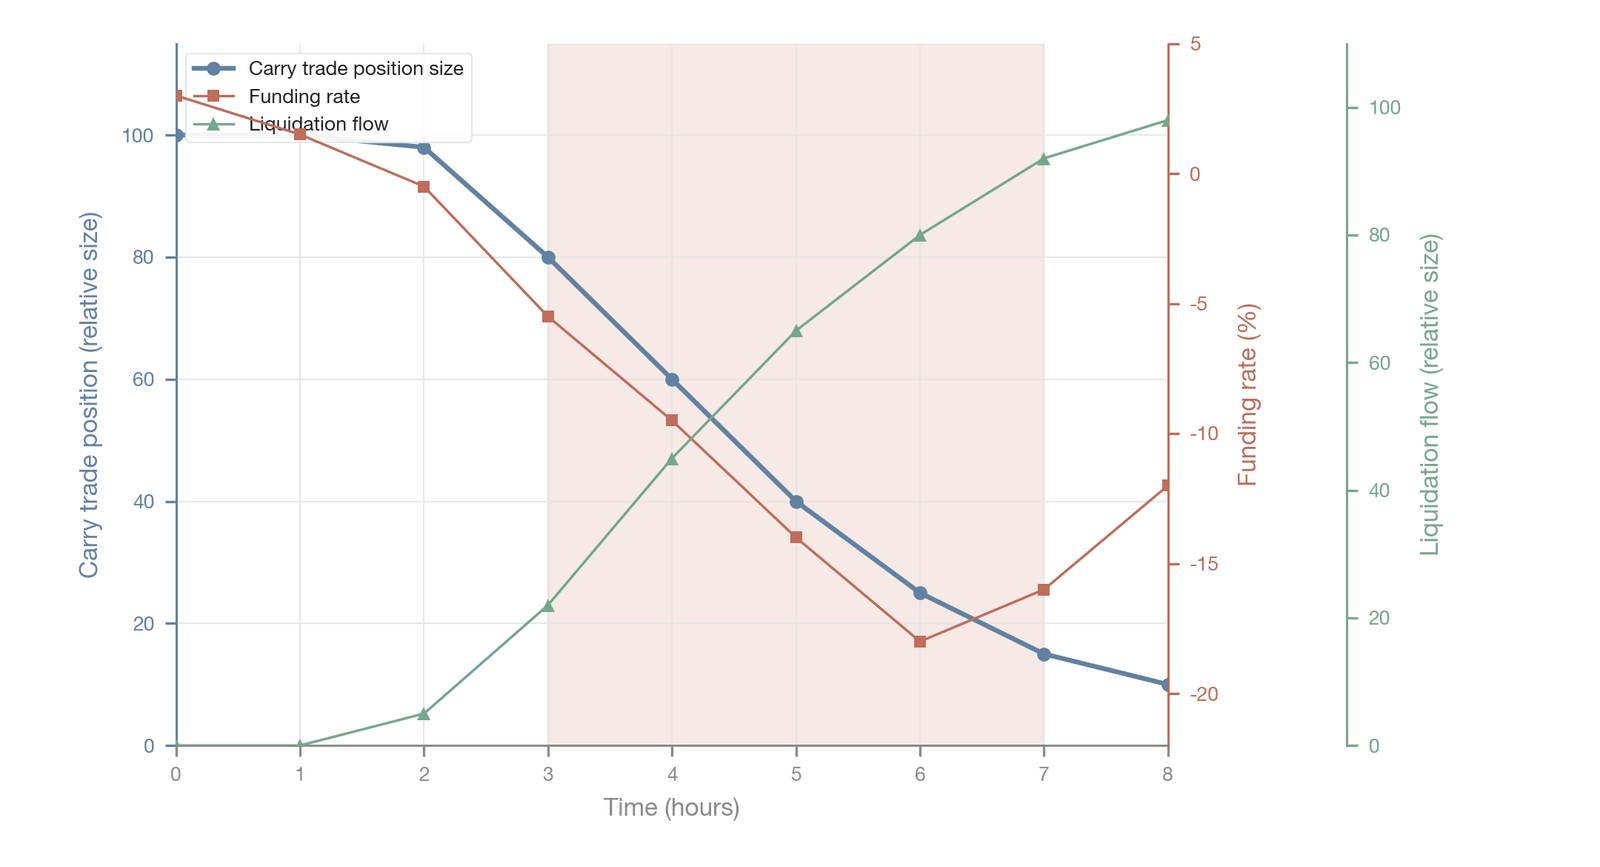
Figure 20-10. The time series of basis-arbitrage position squeezes (illustrative characterization)
As shown in Figure 20-10, as the funding rate moves from positive to an extreme negative value, the scale of basis-arbitrage positions falls sharply, accompanied by a synchronous rise in liquidation flow. This dynamic process clearly shows how the concentrated exit of arbitrageurs turns a stabilizing force into a destructive one: as the rate reverses, originally dispersed closing demand converges within a short time into a concentrated one-directional liquidity shock, accelerating the market's further decline.
In addition, the discrete settlement mechanism of the funding rate can also create a liquidity gap at particular moments. This settlement-related liquidity gap is seen mainly in low-frequency contracts that settle discretely every 8 hours; under the every-1-to-4-hour or near-continuous on-chain settlement regimes described earlier, the rate exposure of any single settlement is smaller and this effect is markedly weaker. In the final minutes before a rate settlement, traders who expect to pay a high rate close positions in concert to avoid the payment, causing an instantaneous surge in demand for liquidity. Meanwhile, market makers sharply reduce their quoted depth to avoid bearing unfavorable inventory and rate exposure at the moment of settlement. This instantaneous divergence of supply and demand forms a distinct liquidity-vacuum period around settlement, which can readily be exploited by malicious traders to trigger artificial price spikes and liquidations.
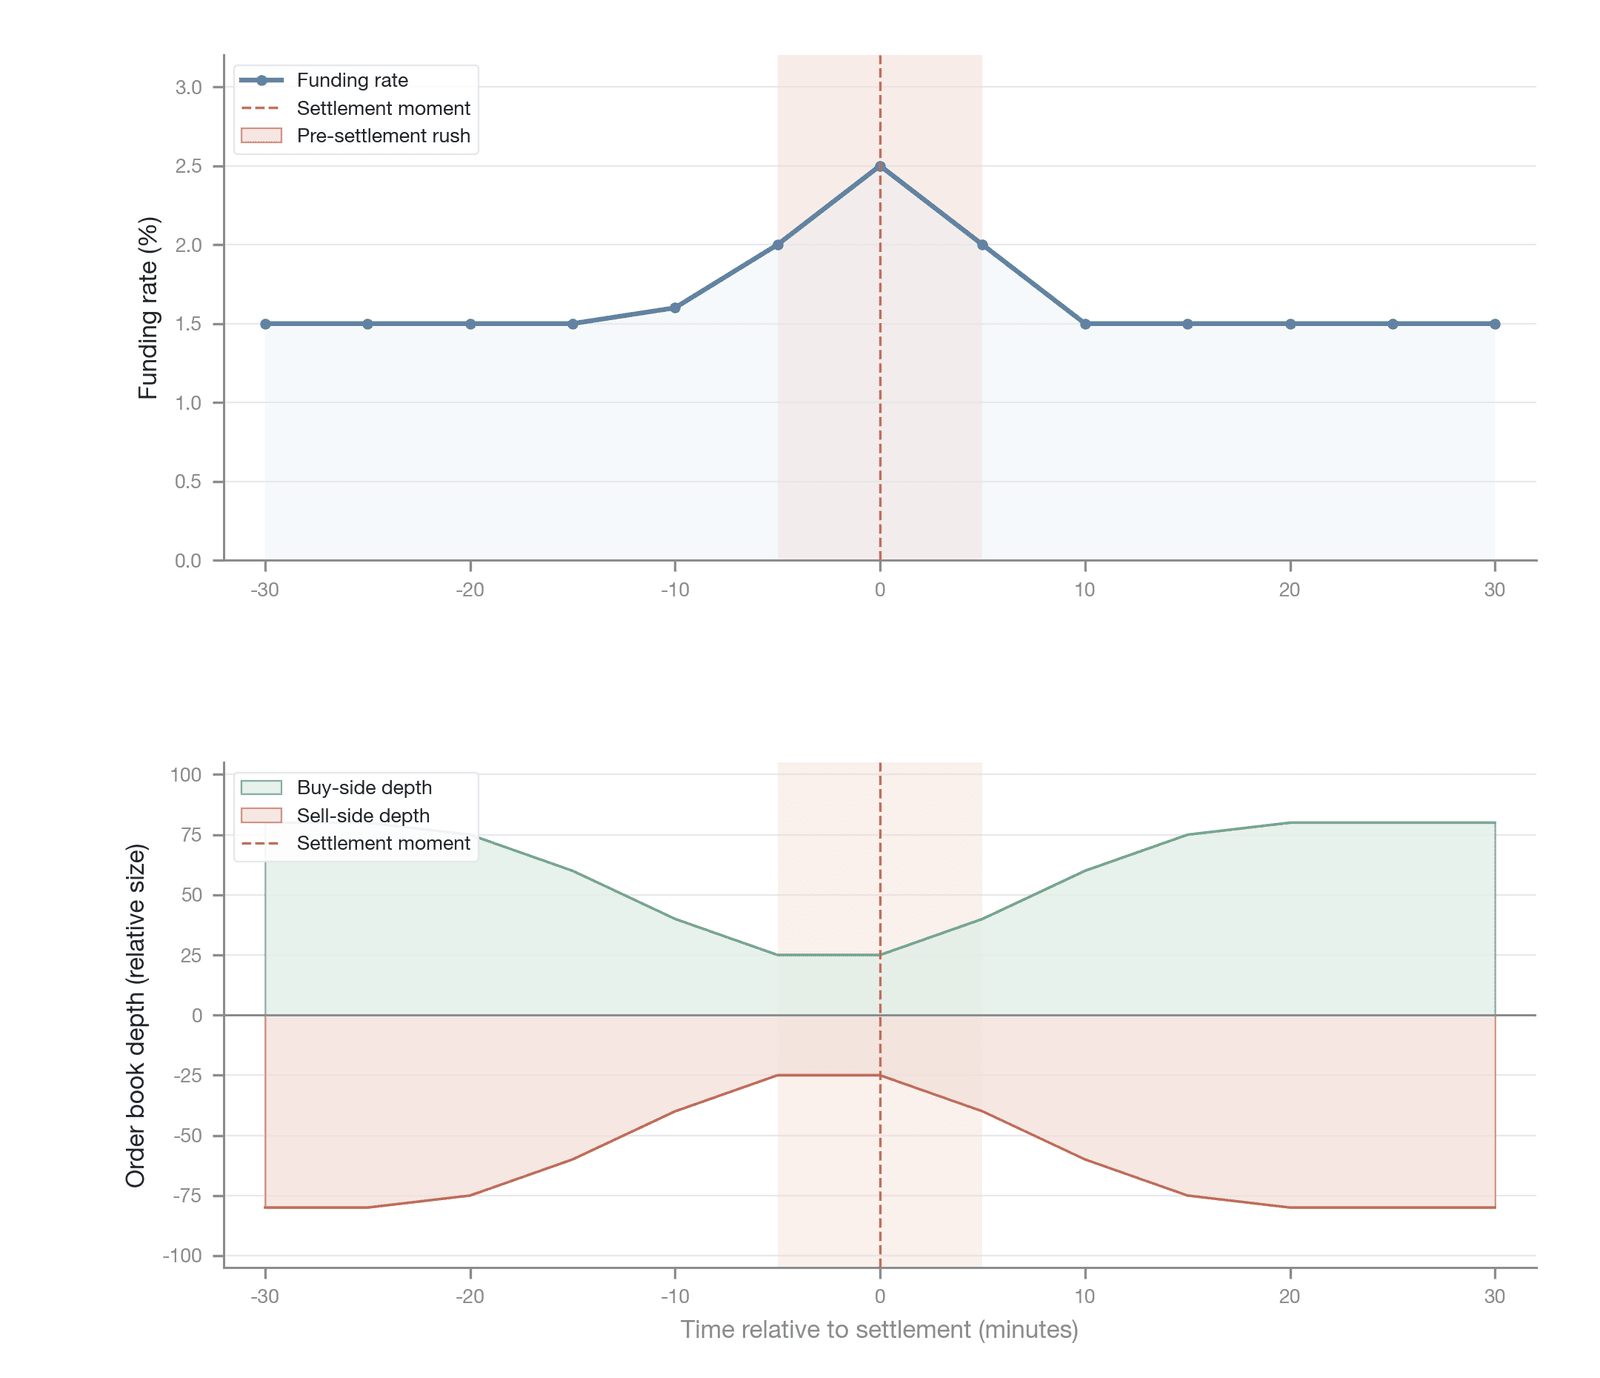
Figure 20-11. The liquidity gap at the moment of funding-rate settlement (seen mainly in low-frequency discrete contracts settling every 8 hours)
Figure 20-11 presents the liquidity gap around settlement: in the minutes before settlement, rate-avoiding closing demand and preemptive market-maker retreat overlap, and depth falls sharply to form a brief vacuum; after settlement completes, market makers quickly replenish, and liquidity returns to normal within minutes. This periodic pulse is a structural by-product of the low-frequency discrete settlement regime of perpetual futures and is insignificant under high-frequency or continuous settlement regimes.
20.4.4 Loop coupling and compound crises
A systemic liquidity collapse in perpetual futures markets is rarely triggered by a single mechanism; it is instead the result of the mutual coupling and cross-amplification of the three positive-feedback loops—the volatility spiral, the liquidation cascade, and funding-rate distortion. This kind of compound crisis exhibits strong nonlinearity: in the early phase, a market shock may activate only one of the loops, and the system still retains some capacity for self-repair; but once the shock breaches the critical point and all three loops fire at once, the multiplier effect among them causes liquidity to evaporate completely in an instant.
The formation of a compound crisis follows a clear transmission chain. First, an external shock or a large sell order causes the price to plunge, realized volatility rises, and market makers begin to retreat because of the convex rise in inventory costs, setting off the negative spiral between volatility and liquidity. As the price falls further, the system's endogenous leverage climbs passively and hits the liquidation lines of large positions. Compulsory market liquidation orders pour in, not only directly devouring the already-thin order-book depth but also, through the extreme toxicity they generate, driving out the remaining market makers entirely, so that the liquidation cascade erupts in full. In this process, the extreme deviation of the price deeply distorts the funding rate, the arbitrageurs who originally played a stabilizing role are forced to close, and the concentrated exit of basis trades releases into the market a final wave of one-directional liquidity demand that cannot be absorbed. These three mechanisms overlap heavily in time and are causally intertwined, jointly pushing the market into a state of liquidity vacuum.
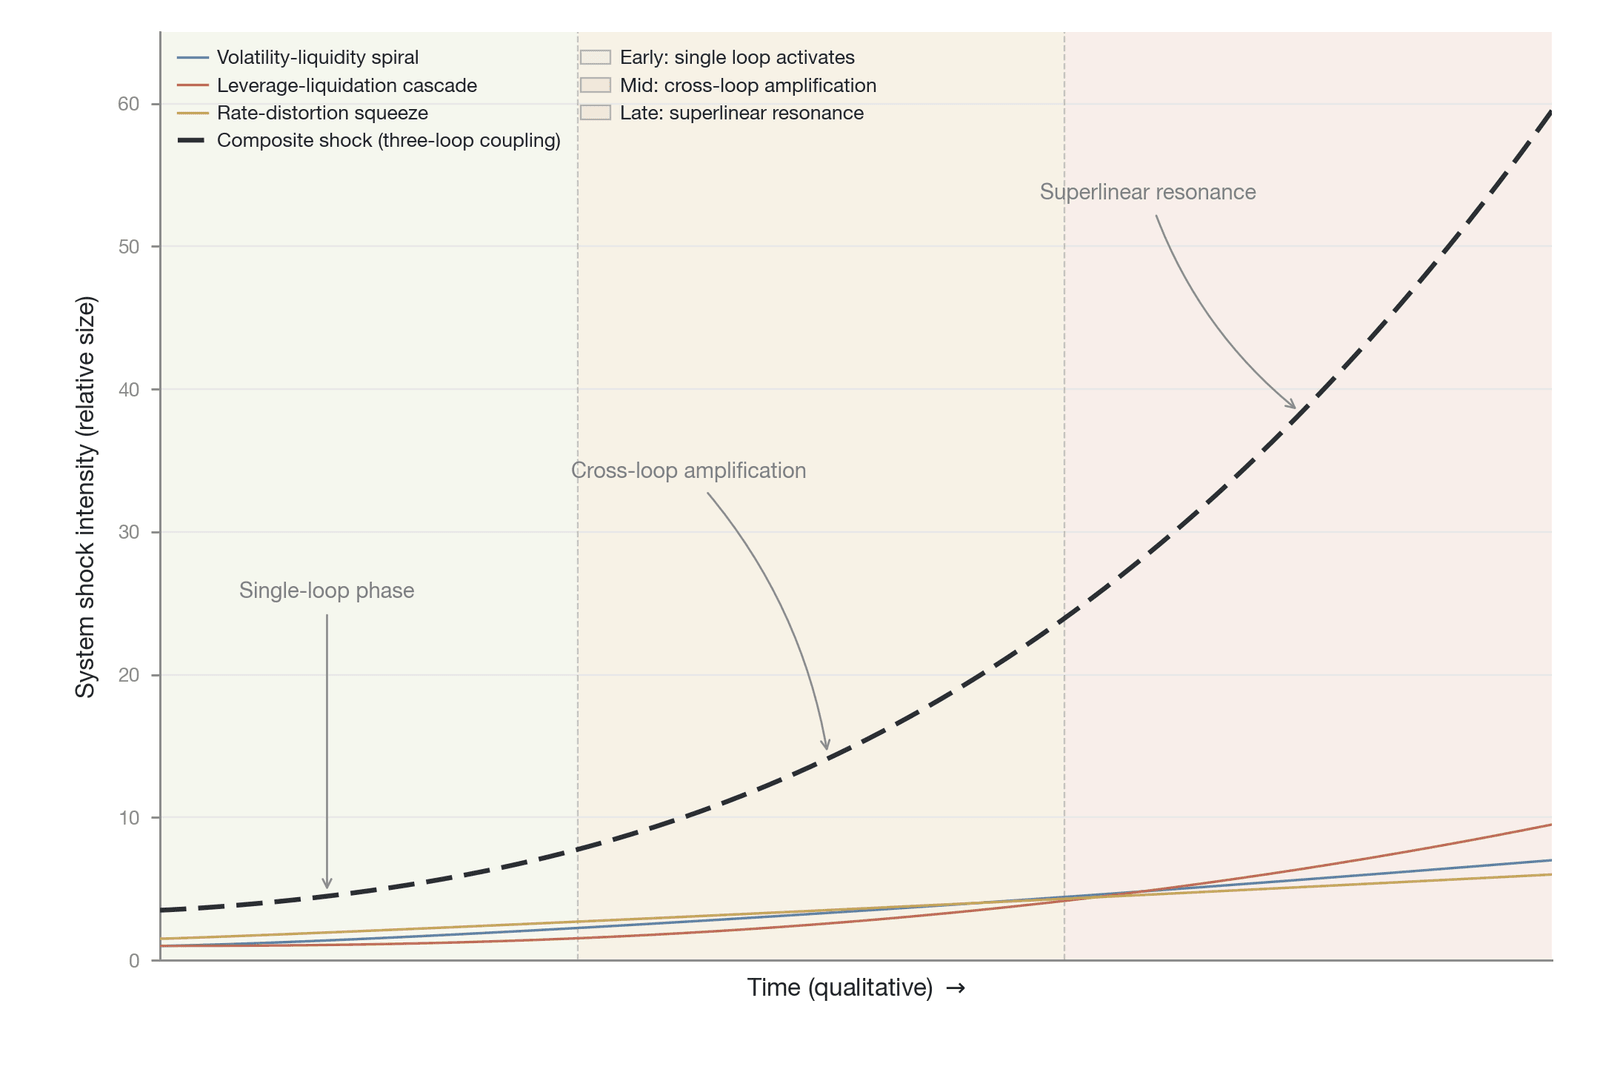
Figure 20-12. The coupling of the three positive-feedback loops and the nonlinear character of a compound crisis
Figure 20-12 reveals the nonlinear character of a compound crisis: in the early phase, the loops develop independently and shock intensity is approximately linear; in the middle phase, the loops cross-amplify (rising volatility simultaneously accelerates liquidation and rate distortion); in the late phase, all three loops resonate fully, the multiplier effect makes shock intensity grow superlinearly, and the market transitions rapidly from a controlled state to complete collapse in a very short time. The "transition" here follows the analogical usage of the liquidation-cascade state transition in Section 20.3.4 and can likewise be tested empirically by "whether shock intensity changes abruptly as the driving variable changes."
The Terra-LUNA collapse of May 2022 is the most extreme empirical instance of this compound-crisis coupling [17]. This event contained two coupled but mechanistically distinct spirals: first, the credit-collapse spiral of an algorithmic stablecoin (UST depeg → LUNA issuance dilution → LUNA selling → further UST depeg), a monetary-level crisis stemming from a design flaw in UST's mint-redeem mechanism; and second, the endogenous liquidity spiral of perpetual futures (LUNA price decline → liquidation cascade → market-maker retreat → liquidity vacuum → further price decline), which is this chapter's core mechanism. Their coupling point is this: the perpetual-futures liquidation cascade drove the LUNA spot price down further, which in turn accelerated the death spiral of the algorithmic stablecoin. The following focuses on the second spiral and its coupling with the first. The trigger was a mild depeg caused by a large sell-off of UST in a Curve liquidity pool; this initial shock raised implied volatility and prompted market makers to widen spreads. As Luna Foundation Guard failed to defend the peg by selling its Bitcoin reserves, market confidence deteriorated sharply and the LUNA price plunged [18], rapidly triggering large-scale liquidation cascades in lending protocols and perpetual futures markets. At the same time, the market's extreme bearishness toward LUNA drove its perpetual-futures funding rate to extreme negative values, which not only failed to attract arbitrageurs to buy but instead forced all cross-market basis traders to take their losses and exit. Surging volatility drove out market makers, relentless liquidation devoured all bids, and rate distortion destroyed the last arbitrage buffer; under the multifactor resonance of all three loops, LUNA's apparent and true liquidity fell to zero simultaneously, its price fell more than 99.9% within just a few days, and the shock reverberated systemically across the entire crypto market [19].
20.5 The split between apparent and true liquidity
Order-book depth and the bid-ask spread are the two most intuitive metrics for assessing market microstructure. In normal markets, these metrics accurately reflect the expected cost that a trader will incur in executing a large order. When the market enters a state of stress, however, these conventional metrics systematically overestimate the true available liquidity [20]. This overestimation is not measurement error but a structural feature of modern high-frequency market-making mechanisms. This section examines the mechanism by which the wedge between apparent and true liquidity forms, revealing why seemingly ample liquidity can suddenly disappear at the very moment the market needs it most.
20.5.1 Ghost liquidity
The order books of modern crypto-asset exchanges are highly dynamic, with order submission and cancellation occurring at frequencies far exceeding the frequency of actual fills. This dynamism is driven largely by high-frequency market makers' algorithms, so that the liquidity depth displayed on the order book contains a large volume of conditional quotes. Degryse, de Winne, Gresse, and Payne (2018) termed this phenomenon ghost liquidity [21]. Ghost liquidity refers to limit orders that are visible on the order book but are rapidly withdrawn once actual trading demand arrives or when market conditions change slightly. Degryse et al.'s original definition focused on repeated quoting across trading venues followed by immediate cancellation after a fill; building on that cross-venue sense, this chapter extends the concept to millisecond-scale conditional cancellation within a single venue.
The existence of ghost liquidity stems from market makers' defense against adverse-selection risk. In a continuous two-sided quoting mechanism, a market maker that provides liquidity is also exposed to the risk of being "picked off" by informed traders. To balance this risk, high-frequency market makers' algorithms continuously send orders to the market to probe other participants' intentions and the genuineness of market depth. When the market is calm, these probing orders rest on the order book and constitute thick apparent depth. These orders, however, are not unconditional commitments. Once volatility rises or the accumulation of one-directional order flow is detected, the algorithm cancels these quotes within milliseconds. Identifying such "toxic" order flow and dynamically shrinking quotes accordingly is precisely the core of high-frequency market makers' risk control; the volume-synchronized probability of informed trading (VPIN) proposed by Easley, López de Prado, and O'Hara (2012) [22] is a representative tool for measuring order-flow toxicity, and its rapid rise in high-frequency environments often precedes an abrupt contraction in liquidity.
This conditional-quoting strategy causes a severe split between apparent and true liquidity. Figure 20-13 shows the dynamic relationship between order-book depth and actual executable depth before and after a crisis trigger.
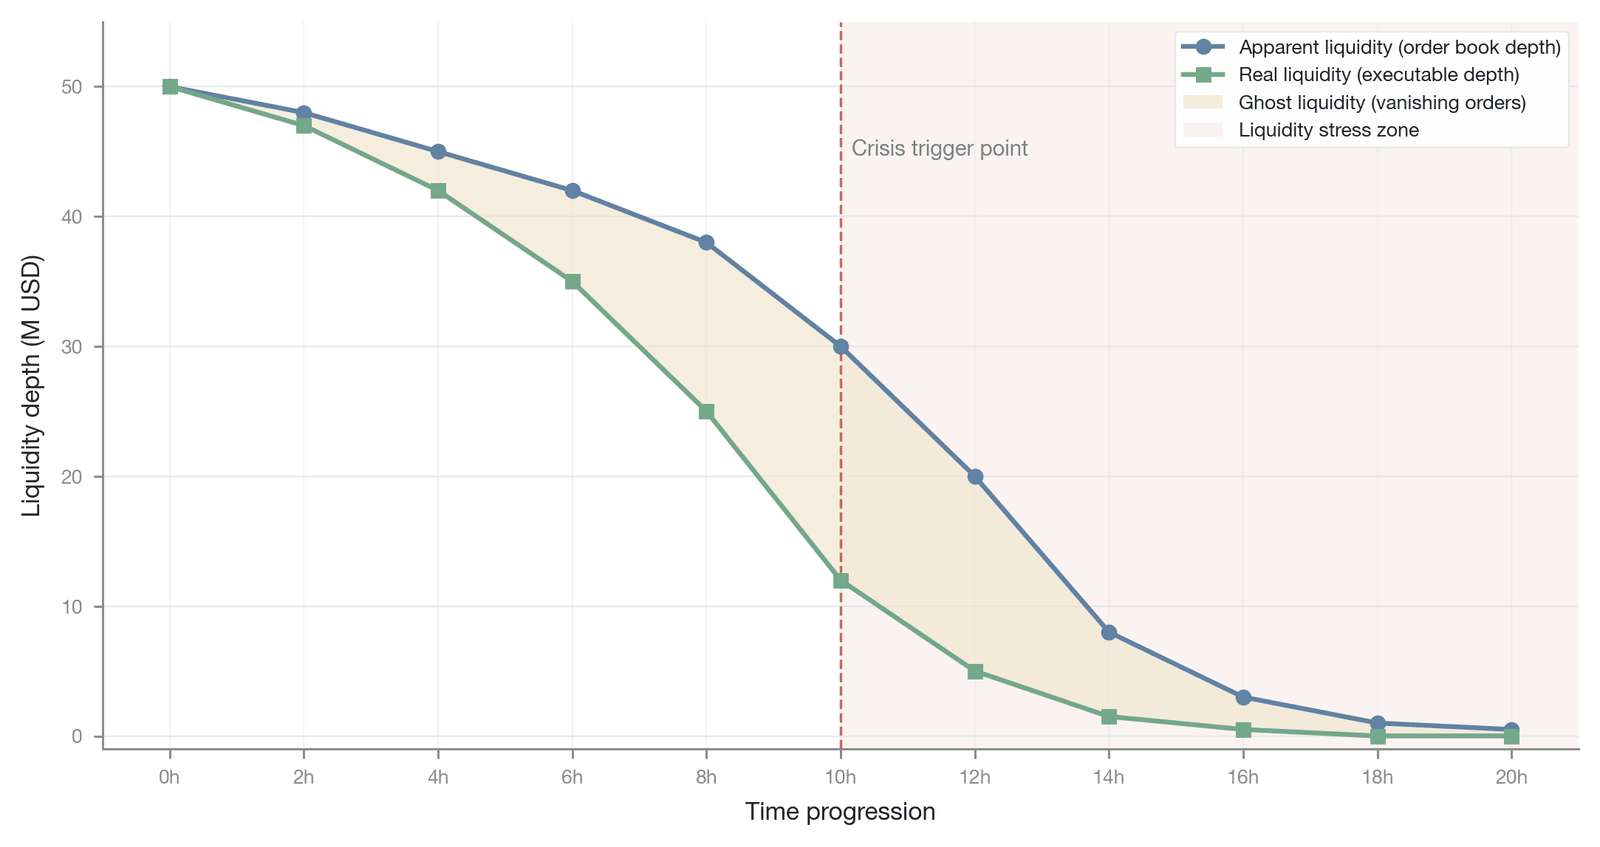
Figure 20-13. The evolution of apparent versus true liquidity before and after a stress event (an illustrative reconstruction by the author, based on public market data, of BTC perpetual depth during the FTX collapse; not data from [15])
Under normal conditions, apparent liquidity and true liquidity overlap closely, and conventional liquidity metrics are reliable. But when the crisis trigger arrives, apparent liquidity begins to decline yet still holds at a certain level, creating the illusion that the market still has absorptive capacity. At the same time, true liquidity plunges abruptly. The vast gap between the two is ghost liquidity. This split means that price-impact models computed from historical order-book depth will severely underestimate the actual execution cost in extreme conditions, causing risk-management systems to fail.
20.5.2 Hidden liquidity
The opposite of ghost liquidity is a layer of invisible liquidity that also exists in the market: hidden orders and conditional orders. If ghost liquidity is the illusion of being "visible but not executable," then hidden liquidity is a reserve of liquidity that is "invisible but executable." Research by Bessembinder, Panayides, and Venkataraman (2009) shows that the use of hidden orders rises markedly as market volatility, order size, and relative depth increase [23].
The hidden-order mechanism allows a trader to submit a large limit order to the exchange while displaying only a small portion on the public order book (the exposed tip of the "iceberg"), with the remainder hidden inside the matching engine. This mechanism is intended to protect large traders from information leakage and predatory algorithmic trading. For market makers, hidden orders are an important tool for managing large inventories. When a market maker needs to close or build a large position, publicly displaying its full intent would trigger anticipatory reactions in the market and move the price in an unfavorable direction. By using hidden orders, a market maker can release liquidity gradually without setting off market panic.
Under stress scenarios, the existence of hidden liquidity makes measuring true liquidity more complex. On one hand, hidden orders may provide unexpected support at key price levels and slow the pace of a price decline; on the other, when market stress reaches an extreme level, this hidden support may also be rapidly withdrawn. On-chain automated market maker mechanisms have, to some extent, changed the paradigm of hidden liquidity. In a concentrated-liquidity model, although liquidity providers must publicly disclose the range over which their capital is distributed, they can achieve an effect similar to hidden orders by dynamically adjusting the range boundaries. This microstructural difference causes centralized and decentralized exchanges to exhibit different liquidity-decay features under stress testing.
| Liquidity type | Visibility | Executability | Behavior in normal markets | Behavior in stressed markets |
|---|---|---|---|---|
| Apparent liquidity | Fully visible | Partly executable | Stable and ample; metrics reliable | Declines with a lag; false support present |
| Ghost liquidity | Fully visible | Very low | Constitutes the bulk of order-book depth | Withdrawn within milliseconds, producing a depth vacuum |
| Hidden liquidity | Invisible | Fully executable | A stable buffer of large orders | High cancellation uncertainty; fragile support |
Table 20-1. The microstructural features and state evolution of the three liquidity dimensions (Data source: compiled based on the research frameworks of Bessembinder et al. [23] and Degryse et al. [21])
Table 20-1 reveals a key asymmetry: in normal markets, ghost liquidity constitutes the bulk of order-book depth, whereas in stressed markets this portion of depth disappears within milliseconds. By contrast, hidden liquidity is invisible under normal conditions, and its behavior under stress is likewise hard to predict. This means that any risk assessment based on the visible depth of the order book faces a dual bias of both overestimation (the false support of ghost liquidity) and underestimation (the potential buffer of hidden liquidity), and in extreme conditions the risk of overestimation far outweighs that of underestimation.
20.5.3 The synchronized retreat of market makers
The disappearance of liquidity in a crisis is not a gradual process of decay but manifests as an instantaneous collective evaporation. The root of this phenomenon lies in the high correlation among different market makers' decisions. The empirical study by Anand and Venkataraman (2016) points out that when market conditions turn unfavorable, market makers tend to shrink their supply of liquidity at the same time, and this behavior produces strong covariation in liquidity both cross-sectionally and over time [6].
The synchronized retreat of market makers can be explained along two dimensions: inventory cost and the coordination game. First, all market makers face similar external environmental constraints. When volatility surges, a liquidation cascade begins, or the funding rate becomes extreme, market makers' inventory-risk costs and adverse-selection costs simultaneously cross their internally set risk thresholds. Because different market makers' risk-management models and input variables (such as price volatility and order-flow imbalance) are highly homogeneous, their algorithms tend to output similar retreat instructions when confronting the same market shock.
Figure 20-14 simulates the evolution of the participation levels of multiple independent market makers during a typical liquidity-shock event.
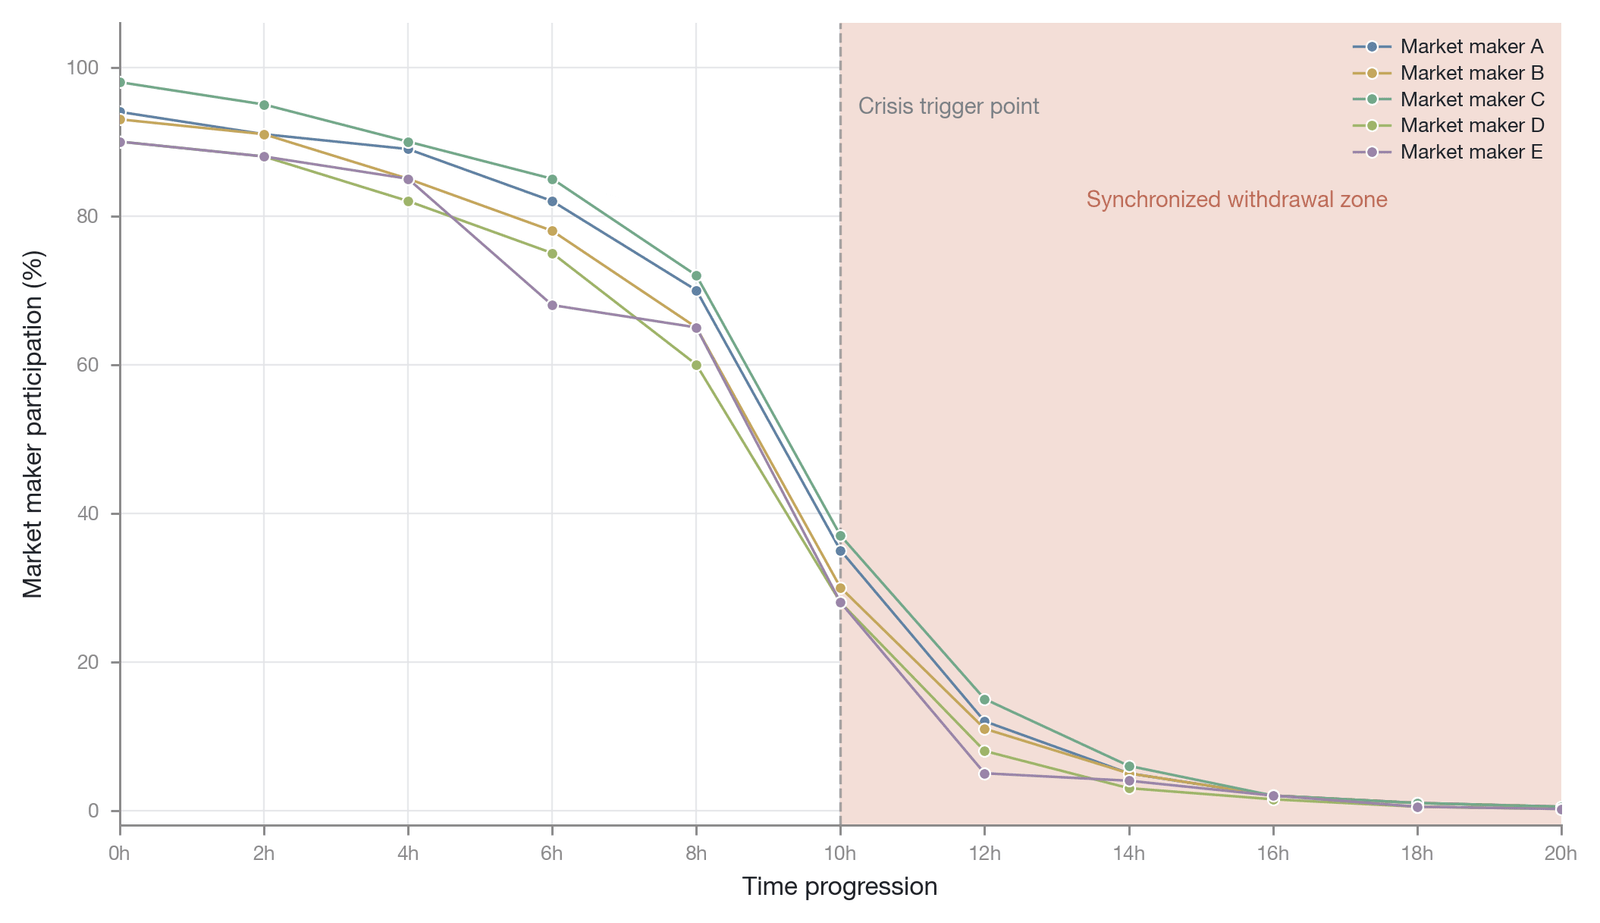
Figure 20-14. The synchronized retreat of market makers' liquidity supply under a stress event (Data source: constructed based on the covariation model of Anand and Venkataraman [6])
Second, there is also an implicit strategic complementarity among market makers, whose game-theoretic roots are the coordination game and informational externality analyzed in Section 20.2.3: when a market maker expects its peers to retreat, whoever stays will absorb all of the toxic order flow alone, so each maker strives to retreat first, and the system thereby transitions instantly from the good equilibrium of "everyone provides liquidity" to the bad equilibrium of "everyone retreats." The game-theoretic derivation is not repeated here.
20.5.4 The failure of liquidity metrics
The split between apparent and true liquidity ultimately causes traditional liquidity-assessment frameworks to fail under stress testing. Conventional liquidity metrics—such as the bid-ask spread, the cumulative order volume within a specified depth, or a price-impact coefficient based on historical trade data—are all built on the assumption that the supply of liquidity is continuous and stable. As discussed above, however, liquidity in perpetual futures markets is highly endogenous, and there is a structural negative correlation between its quantity supplied and market demand. This subsection focuses on a mechanistic diagnosis of this metric failure, leaving the concrete design of quantitative metrics to Section 20.8.
Figure 20-15 shows how this endogeneity causes the stable linear relationship between apparent depth and actual executable depth to become highly nonlinear under stress, with executable depth exhibiting severe marginal diminution, thereby causing risk models based on apparent depth to fail. This relationship can be tested by fitting the slope on paired "required depth–executable depth" samples for stress periods and normal periods; if the slopes in the two regimes do not differ significantly, the marginal-diminution claim does not hold.
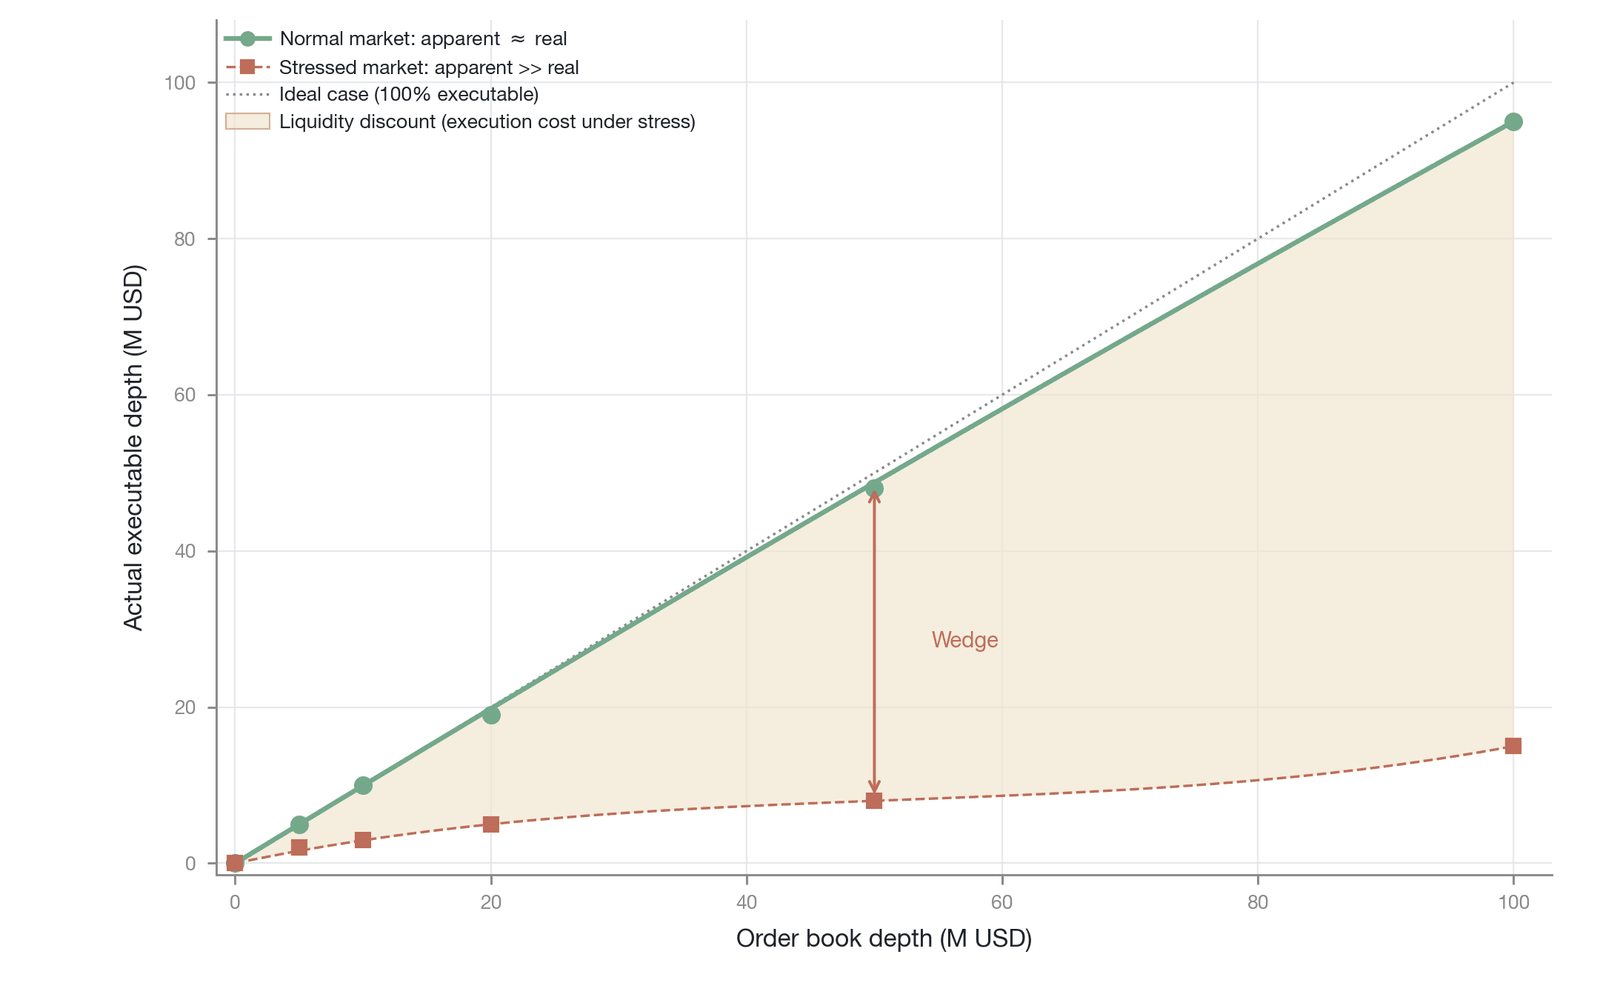
Figure 20-15. The nonlinear divergence between order-book depth and actual executable depth (Data source: derived in combination with Berkowitz's [24] liquidity-risk model; [24] is a working paper and has not been peer-reviewed)
To address this metric failure, risk-management theory has introduced the concept of liquidity-adjusted value at risk. Bangia, Diebold, Schuermann, and Stroughair (1999) [25] first proposed a methodology for incorporating liquidity risk into the value-at-risk framework, capturing the amplifying effect of liquidity on portfolio losses by overlaying a distribution of execution costs on top of market risk. In the liquidation mechanism of perpetual futures, the underestimation of liquidity risk is especially pronounced. When the system's liquidation engine relies on apparent liquidity to assess an account's safety margin, it may mistakenly conclude that the existing margin is sufficient to cover the cost of closing. But when real liquidation orders pour into the market and trigger the synchronized retreat of market makers, the actual slippage cost far exceeds expectations, exceeds the margin coverage, and sets off chain liquidations.
The traditional liquidity-adjusted value-at-risk framework, however, still assumes that liquidity cost is exogenous (estimating execution slippage under a stress scenario at a fixed discount rate) and cannot capture the nonlinear collapse of endogenous perpetual-futures liquidity under market-maker retreat, so in principle it does not apply to the scenario described in this chapter. Measuring true liquidity requires endogenizing market makers' dynamic response function, simulating the nonlinear rise in inventory costs under a given volatility shock and predicting the critical point of algorithmic order cancellation; future methodological innovation may need to turn toward agent-based modeling or a reflexivity value-at-risk framework [24].
20.6 A five-stage framework of liquidity evaporation
The preceding sections revealed the theoretical foundations of liquidity endogeneity and the three positive-feedback loops that drive its self-dissolution. These mechanisms do not operate in isolation; they interweave along a specific temporal sequence and logical chain, constituting a complete transmission path for a liquidity collapse. The disappearance of liquidity is rarely instantaneous; it instead follows an identifiable five-stage evolutionary model. Understanding this transmission path is decisive for identifying market fragility, designing early-warning indicators, and formulating intervention strategies.
A word on positioning: this section links the preceding mechanisms from an integrative temporal perspective, and the five stages are identifiable phases, on the collapse timeline, of the three loops in Sections 20.2 to 20.4 and the contagion in Section 20.7, rather than a new mechanism independent of the three loops. Adjacent stages can overlap, and not every shock passes through all five stages in sequence (the counterexamples at the end of Section 20.6 and in Section 20.6.4 bear this out). The incremental value of the five-stage framework lies in characterizing the prefatory stage of the "microstructural trigger," as well as the leading indicators between stages (such as the time lag by which spreads and toxicity deteriorate ahead of depth, described in Section 20.6.2), while the internal mechanisms of each stage refer back to Section 20.3 (the liquidation cascade) and Section 20.7 (contagion). Viewed this way, the sudden drying-up of liquidity through synchronized market-maker retreat under stress is consistent with the empirical characterization by Kirilenko, Kyle, Samadi, and Tuzun (2017) [26] of the "Flash Crash" of May 2010: the concentrated exit of high-frequency market makers once their inventory limits were exceeded was the key link by which a single large sell order evolved into a market-wide evaporation of liquidity. This empirical work provides external corroboration, from outside crypto markets, for this section's microstructural-trigger and synchronized-retreat stages.
Figure 20-16 shows the core transmission path and feedback mechanisms of the five-stage model of liquidity evaporation.
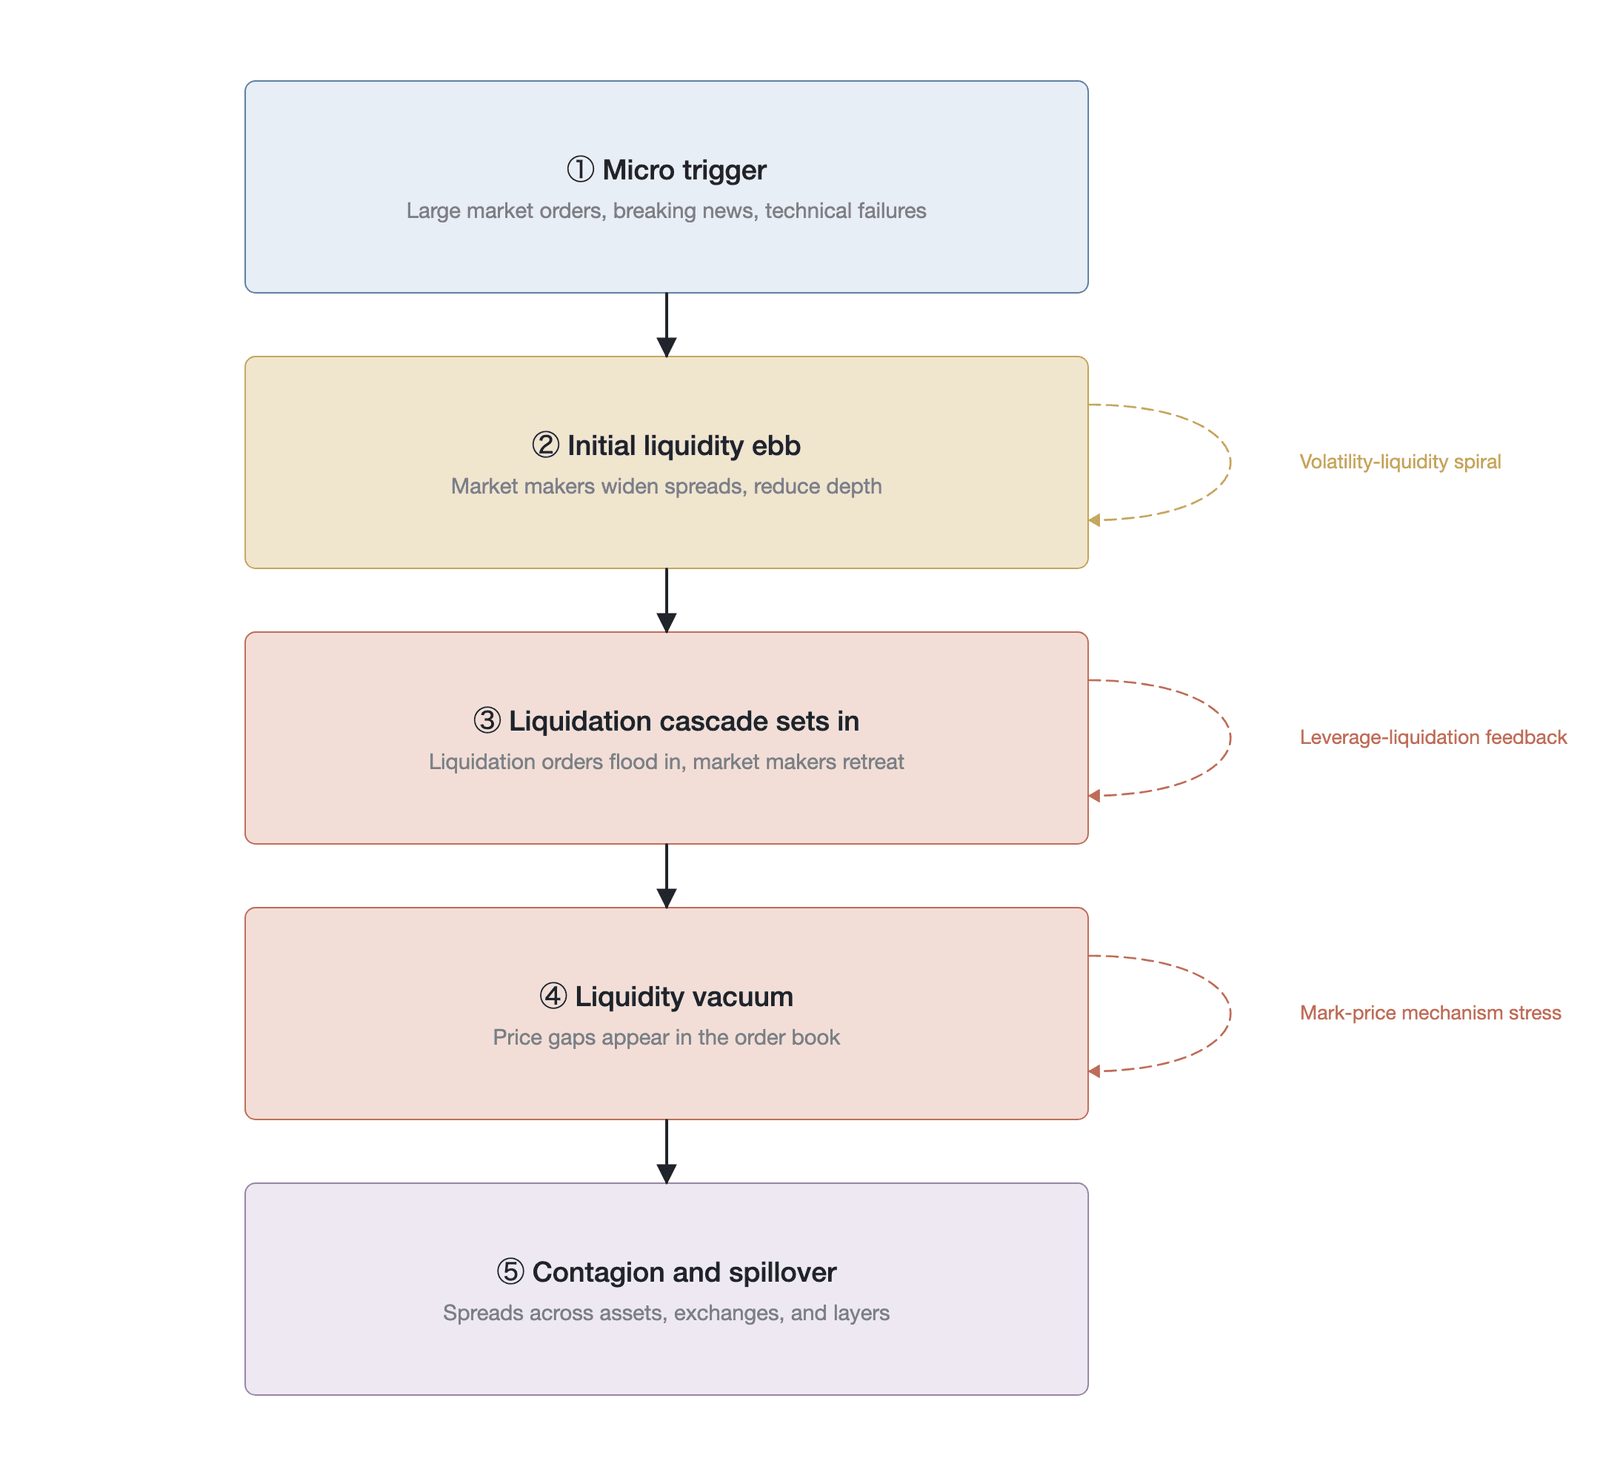
Figure 20-16. A schematic of the five-stage model of liquidity evaporation and its positive-feedback loops
As shown in Figure 20-16, the five stages are not a simple linear progression; a positive-feedback loop intervenes at each transition node: the microstructural trigger to the initial ebb is driven by the volatility-liquidity spiral, the initial ebb to the liquidation cascade is amplified by leverage endogeneity, and the liquidity vacuum to contagion spillover relies on market makers' cross-asset risk-control linkages.
Not every liquidity shock evolves to the fifth stage. During the "Black Thursday" event of March 12, 2020, BitMEX was forced to suspend trading for about 25 minutes because of system overload at the extreme moment when the BTC price plunged to about $3,800. This involuntary trading halt and the subsequent slowing of the liquidation cascade occurred in temporal succession, and can serve as an illustrative example of "an external intervention interrupting a loop at a particular stage." A caveat: in a single event it is hard to separate whether the halt itself or the market's natural bottoming was the principal cause, so this chapter makes no strong causal claim that the halt blocked the cascade. When BitMEX resumed trading, the most violent panic had already passed, and the market, near stage three, did not continue to evolve toward stages four and five. This case also illustrates that the five-stage framework describes the complete transmission path in the absence of intervention, and that a timely external intervention—whether an intentional circuit breaker or an incidental system outage—can interrupt the positive-feedback loop at a particular stage.
20.6.1 Stage one: the microstructural trigger
The starting point of liquidity evaporation is typically a trigger event at the microstructural level. The event itself need not be systemically destructive, but it is enough to break the prevailing liquidity equilibrium. Such trigger events fall into three categories: the shock of a single very large market order, the injection of sudden negative news, and a technical failure of an exchange's infrastructure. In normal markets, these shocks are quickly absorbed by ample apparent liquidity. When the market is already in a fragile state, however—when the system's effective leverage is elevated, market makers' inventory is severely skewed, or the market is in a naturally thin liquidity trough—a small trigger event can set off a catastrophic chain reaction.
The core feature of a trigger event lies in its instantaneous perturbation of the initial price and the bid-ask spread. For example, a market sell order that exceeds the top-layer depth of the order book directly penetrates several price levels, causing the last traded price to jump anomalously. This price jump not only reflects an instantaneous imbalance of supply and demand but, more important, sends a strong signal of rising volatility to all market participants. Market makers' algorithmic models immediately capture this signal and reassess the current adverse-selection risk and inventory-carrying cost. At this stage, the observable microstructural indicators show a widening of the initial price-jump magnitude and an initial widening of the bid-ask spread, even though overall order-book depth has not yet contracted catastrophically.
20.6.2 Stage two: the initial ebb of liquidity
As the microstructural trigger event pushes realized volatility higher, market makers begin to make a rational first-round response, and the market enters the stage of the initial ebb of liquidity. Based on the inventory-cost convexity analyzed in Chapter 19, rising volatility causes market makers' expected inventory costs to grow nonlinearly. To control their risk exposure, market makers' first defensive measure is to widen the bid-ask spread, thereby increasing compensation for potential adverse selection. If the volatility indicators continue to deteriorate, market makers further reduce the size of the limit orders they post at each price level of the order book—that is, they shrink their market-making depth.
This stage marks the formal onset of the positive-feedback spiral between volatility and liquidity. Market makers' widening of spreads and reduction of depth directly cause subsequent orders of the same size to produce larger price impact. This liquidity-decay-induced price impact further raises the market's effective volatility, forcing more market makers to tighten their quotes [27]. Market makers have not yet withdrawn from the market entirely at this point; although apparent liquidity is impaired, it still maintains basic trading functionality. Observable indicators show the bid-ask spread possibly widening to three to ten times its normal level, order-book depth falling by more than half, and indicators reflecting order-flow toxicity beginning to climb sharply.
Figure 20-17 shows the evolution of key market-microstructure indicators across the stages of liquidity evaporation.
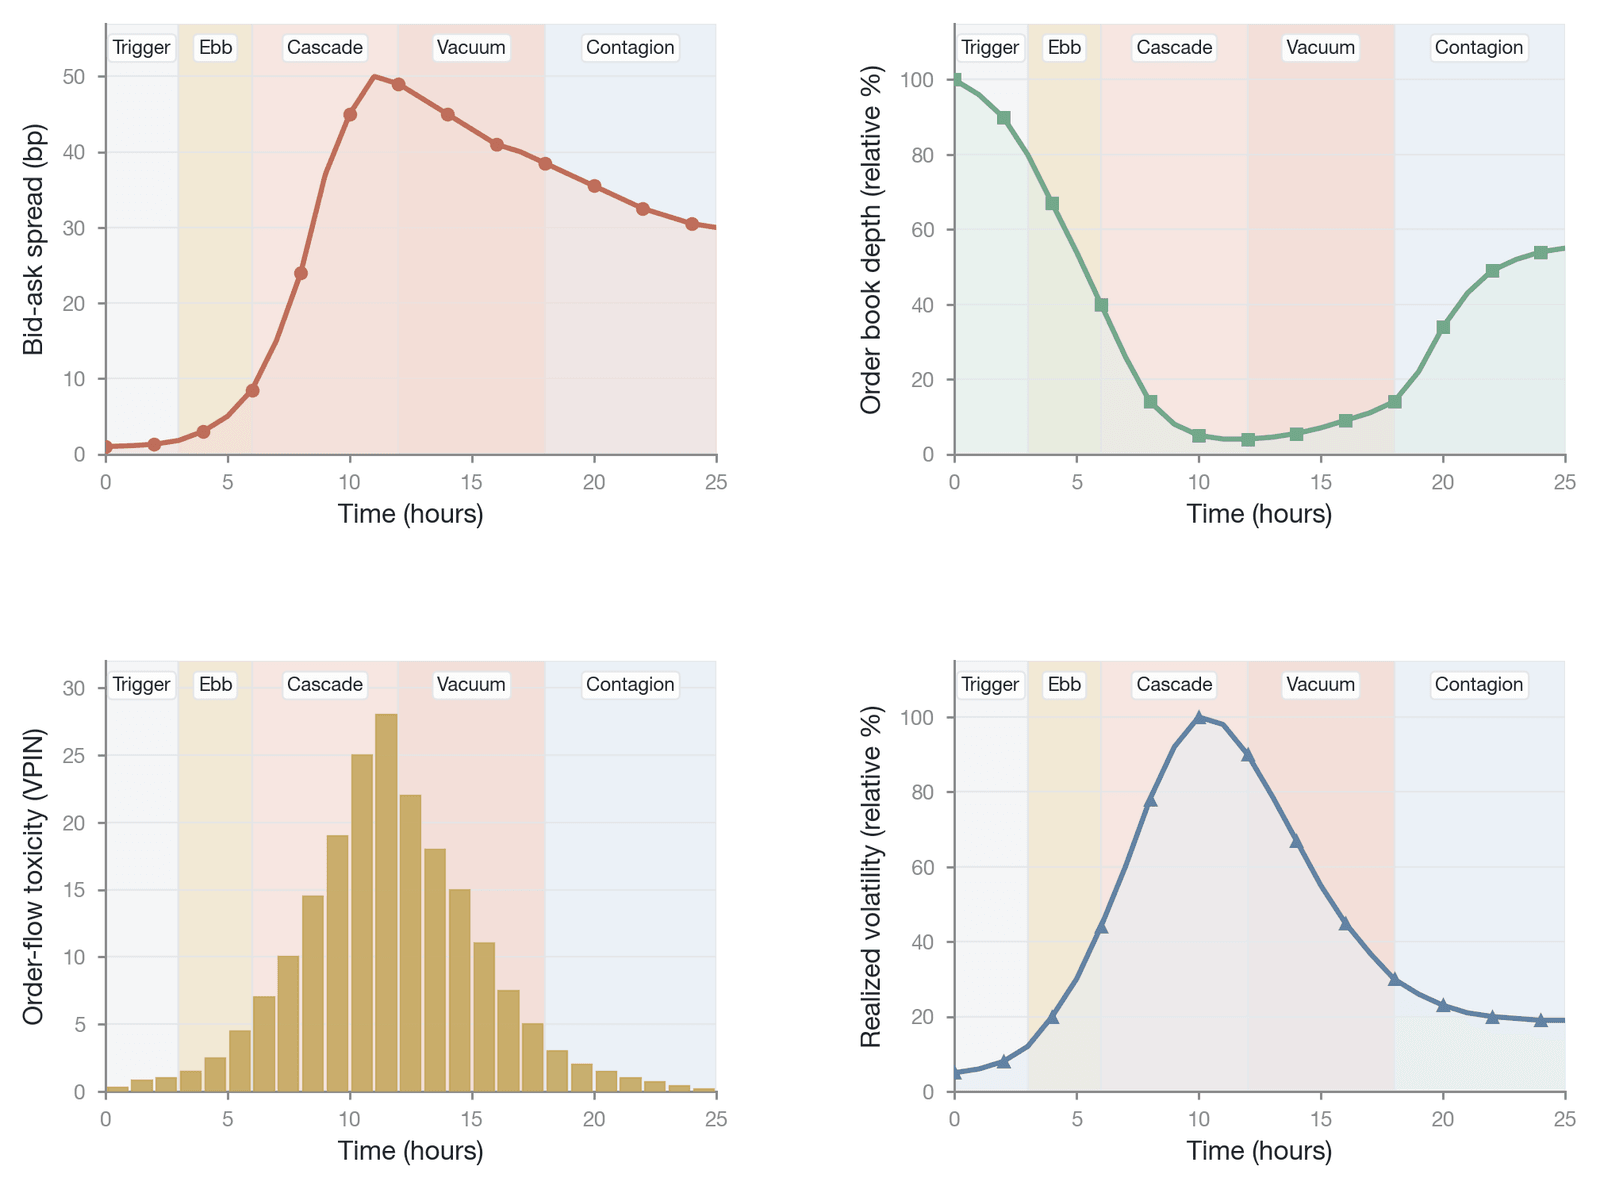
Figure 20-17. The evolution of key indicators in the five-stage model of liquidity evaporation (an illustrative fit by the author based on the FTX collapse case; not data from [15])
In the sense of a model illustration, Figure 20-17 reveals a key early-warning logic: during the transition from stage one to stage two, the bid-ask spread and order-flow toxicity indicators have already begun to deteriorate markedly, but the apparent depth of the order book has not yet fallen abruptly. This time lag among the indicators means that the anomalous widening of spreads and the sharp climb in toxicity can serve as leading signals of a liquidity collapse. Once these signals appear, the transition from stage two to stage three may be completed in a very short time, leaving market participants a very limited window to react.
20.6.3 Stage three: the intervention of the liquidation cascade
When the magnitude of the initial price decline reaches the maintenance-margin requirements of large numbers of high-leverage positions, the market enters the most destructive third stage: the intervention of the liquidation cascade. Its internal mechanisms were detailed in Section 20.3; here we only characterize the identifiable features of this stage. As noted earlier, liquidation orders are a perfectly inelastic, mandatory demand for liquidity. These liquidation instructions, pouring in as market orders, directly devour the order-book depth that has already become thin during the initial-ebb stage. The price is pushed down without resistance to the next liquidation trigger line, setting off a new round of forced closures, and the positive-feedback loop between leverage and liquidation (Sections 20.3.1–20.3.3) is fully activated.
At this stage, market makers face a core discrimination problem. Confronting the surging one-directional order flow, a market maker must judge whether it is a temporary liquidity shock or the harbinger of a systemic collapse. Because taking on the wrong orders could push their own positions to the brink of liquidation, whereas the cost of retreating in error is merely the loss of some fee income, the vast majority of market makers choose the latter. This collective, rational retreat turns former liquidity providers into bystanders; in extreme cases, market makers may even become demanders of liquidity themselves in order to hedge the one-directional inventory they have accumulated. The observable features of this stage are: liquidation volume climbs sharply, open interest falls sharply, and the exchange's insurance fund begins to be heavily consumed.
20.6.4 Stage four: the liquidity vacuum
The compounded effect of the liquidation cascade and the synchronized retreat of market makers ultimately pushes the market into the liquidity-vacuum stage. At this stage, the continuity of the order book is completely destroyed, and a visible "price gap" appears—an extremely wide price range with no limit-order quotes whatsoever. Any market order attempting to cross this vacuum zone causes an extreme jump-like gap in the price. This price discontinuity not only destroys the market's price-discovery function but also poses a serious challenge to the underlying infrastructure of perpetual futures.
The liquidity vacuum places enormous pressure on the mark-price mechanism. A mark price based on an exponential moving average lags significantly when confronting a price gap, which can lead to misjudgment of a position's health and thereby trigger unjustified liquidations or impede necessary risk control. If the bankruptcy losses caused by liquidation exceed the absorptive capacity of the insurance fund, the exchange is forced to trigger the auto-deleveraging mechanism. The forced closure of positions on the profitable side means that even a trader whose directional judgment was correct is forced to bear the cost of the systemic depletion of liquidity. During this period, the bid-ask spread may widen to hundreds of basis points, and conventional liquidity metrics fail completely.
The FTX data come with one important qualification: some of the liquidity on the FTX platform was built on the basis of an affiliated institution misappropriating client funds for market making, and its collapse was to a large extent a fraud-exposure event (Conlon, Corbet, and Hu, 2026 [28]). The fraud factor, however, does not negate the analytical value of the endogenous liquidity spiral, because similar order-book depth evaporation and spread surges also occurred in the May 2021 crash, which involved no fraud. The following data are used to illustrate the speed and magnitude of liquidity deterioration, not to generalize the special circumstances of FTX.
| Market state | Stage | Bid-ask spread | Order-book depth (bid/ask) | Price-impact coefficient |
|---|---|---|---|---|
| Pre-crisis normal | November 7 | 0.5 bp | $50M / $50M | Very low |
| Initial ebb | Morning of November 8 | 2.0 bp | $45M / $42M | Rising slightly |
| Liquidation cascade | Evening of November 8 | 10.0 bp | $25M / $20M | Rising markedly |
| Liquidity vacuum | Midday of November 9 | 45.0 bp | $3M / $2M | Extremely elevated |
Table 20-2. An illustrative evolution of BTC perpetual-futures liquidity metrics during the FTX collapse (Data source: an illustrative reconstruction by the author based on public market data; not data from [15])
The data in Table 20-2 are an illustrative time series meant to reveal the astonishing speed of liquidity deterioration. From the normal state of November 7 to the liquidity vacuum of November 9, the bid-ask spread widened 90-fold in under 48 hours (from 0.5 bp to 45 bp), while order-book depth shrank by about 94%–96% (from $50M to $2–3M). The depth decay on the two sides was not symmetric: in the liquidity-vacuum stage, bid-side depth ($3M) was slightly higher than ask-side depth ($2M), reflecting the structural feature that sell-side liquidity is consumed first in a plunging-price environment. The depth data in Table 20-2 are an illustrative characterization of the order-book condition of a single BTC perpetual-futures trading pair on the platform directly hit by the FTX crisis, whereas the $580 million depth cited at the opening of this chapter is Kaiko's aggregate 1%-band depth across the whole market, multiple exchanges, and multiple currencies. The two datasets have different statistical definitions, but both point to the same conclusion: whether at the single-platform or market-wide level, the speed and magnitude of liquidity deterioration far exceed what market participants would expect based on normal experience.
20.6.5 Stage five: contagion spillover
A liquidity crisis is rarely confined to a single asset or a single trading platform; its final stage manifests as cross-dimensional contagion and spillover. Market makers' global risk-control directives spread the liquidity stress of core assets to peripheral assets; the rupture of cross-exchange arbitrage paths causes price-spread anomalies to persist and transmits pressure in reverse; and the price feeds of oracles transmit the extreme volatility of centralized markets to decentralized protocols, triggering on-chain liquidations. The full mechanism of this contagion spillover is developed systematically in Section 20.7.
20.7 The cross-dimensional contagion of liquidity
Once a liquidity crisis erupts, it rarely stays within the single asset or single market in which it originated. The liquidity network of perpetual futures markets forms a highly interconnected complex system through market makers' cross-asset capital allocation, arbitrageurs' correlated strategies, and oracles' price-transmission mechanisms. When a vacuum in liquidity appears at one node, this stress spreads outward through specific transmission chains, amplifying a local microstructural shock into a systemic liquidity crisis. This contagion process does not occur at random; it follows structural paths from core to periphery, from spot to derivatives, and from centralized to decentralized markets.
Figure 20-18 shows the four main dimensions along which a liquidity crisis spreads outward and the mechanisms by which they interact.
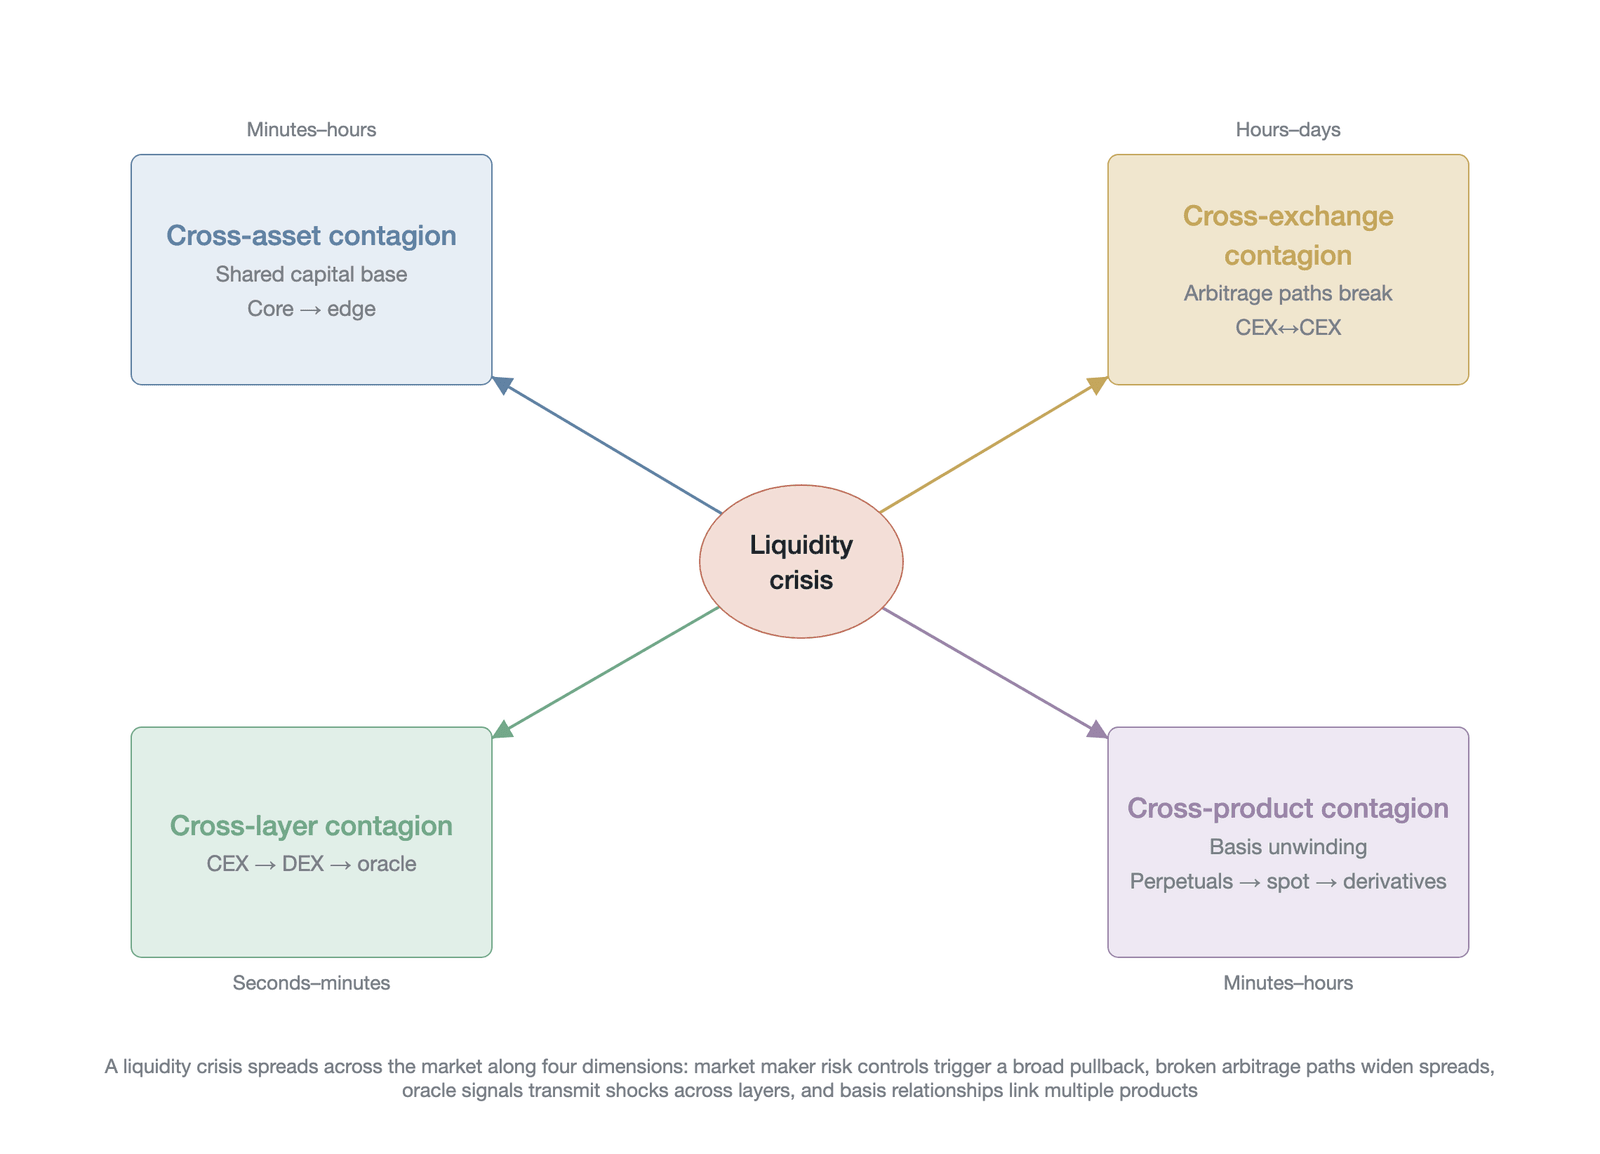
Figure 20-18. A four-dimensional model of liquidity contagion (mechanism reference: Akhtaruzzaman et al. [29]; the four-dimensional framework is the author's extension of their systemic-risk concept, not the original classification in [29])
As shown in Figure 20-18, the four contagion dimensions are not mutually independent but interact closely: cross-asset contagion operates through market makers' unified capital base, cross-exchange contagion through the rupture of arbitrage paths, cross-layer contagion through the oracle system, and cross-product contagion through the concentrated closing of basis trades, each spreading local liquidity stress outward. The following subsections analyze each in turn.
20.7.1 Cross-asset contagion
In crypto-asset markets, the cross-asset contagion of liquidity exhibits a marked asymmetry, typically taking the form of a strong one-directional transmission from core assets to peripheral assets. The root of this phenomenon lies in market makers' capital-management structure and risk-control mechanisms. A market maker typically provides liquidity across multiple assets simultaneously, but its capital base is unified. When a core asset experiences violent price swings and triggers a liquidation cascade, the market maker's market-making positions in that asset face extreme adverse-selection risk and inventory pressure.
To protect its overall capital, a market maker's risk-control system triggers a global directive to shrink. This risk-control mechanism does not distinguish among asset classes but instead requires widening bid-ask spreads and reducing quoted depth across all trading pairs. As a result, even peripheral assets that have themselves experienced no fundamental change or direct selling pressure see their liquidity dry up instantly because of the market maker's defensive retreat.
The speed and scope of cross-asset contagion depend to a large extent on the topology of the market-maker network. Market depth is highly concentrated among a small number of top market makers: according to industry reports from institutions such as Kaiko and Wintermute, the top five market makers provide a substantial share (on the order of 50% to 70%) of order-book depth at major exchanges. These figures come from the proprietary definitions of data vendors and market-making firms, whose methodologies are not public, and some sources (such as the top market makers themselves) have an inherent conflict of interest; this chapter treats them only as an order-of-magnitude reference rather than a precise measurement, cross-referencing them with the "top 3–5 firms reaching depth on the order of 70%" definition in Section 19.5.1 of Chapter 19. This highly concentrated core-periphery structure has an efficiency advantage in normal times: the depth coverage of core market makers reduces the market's overall transaction costs. Research by Acemoglu, Ozdaglar, and Tahbaz-Salehi (2015) [30], however, shows that such a network structure has absorptive capacity under small shocks but experiences cascading, full-scale contagion under large shocks that exceed a critical threshold. When one core market maker fully retreats because of a risk-control directive, its exit simultaneously affects dozens of trading pairs and multiple exchanges, instantly creating a liquidity vacuum across the entire network.
The cross-margin regime further reinforces this cross-asset contagion effect. Under a unified margin account, if the long positions in a core asset held by a trader incur unrealized losses because of a sharp price decline, those losses directly erode the account's total margin balance. When the total margin level falls below the maintenance requirement, the system forcibly closes the account's other asset positions, including peripheral assets whose prices were originally stable. This mechanism converts the price shock of a core asset into forced selling of peripheral assets, and against the backdrop of peripheral-asset liquidity already drained by market makers, this forced selling triggers an even more violent price collapse in the peripheral assets.
Figure 20-19, based on market data from the November 2022 FTX collapse, records the difference in the liquidity-evaporation timeline between core and peripheral assets during this transmission process.
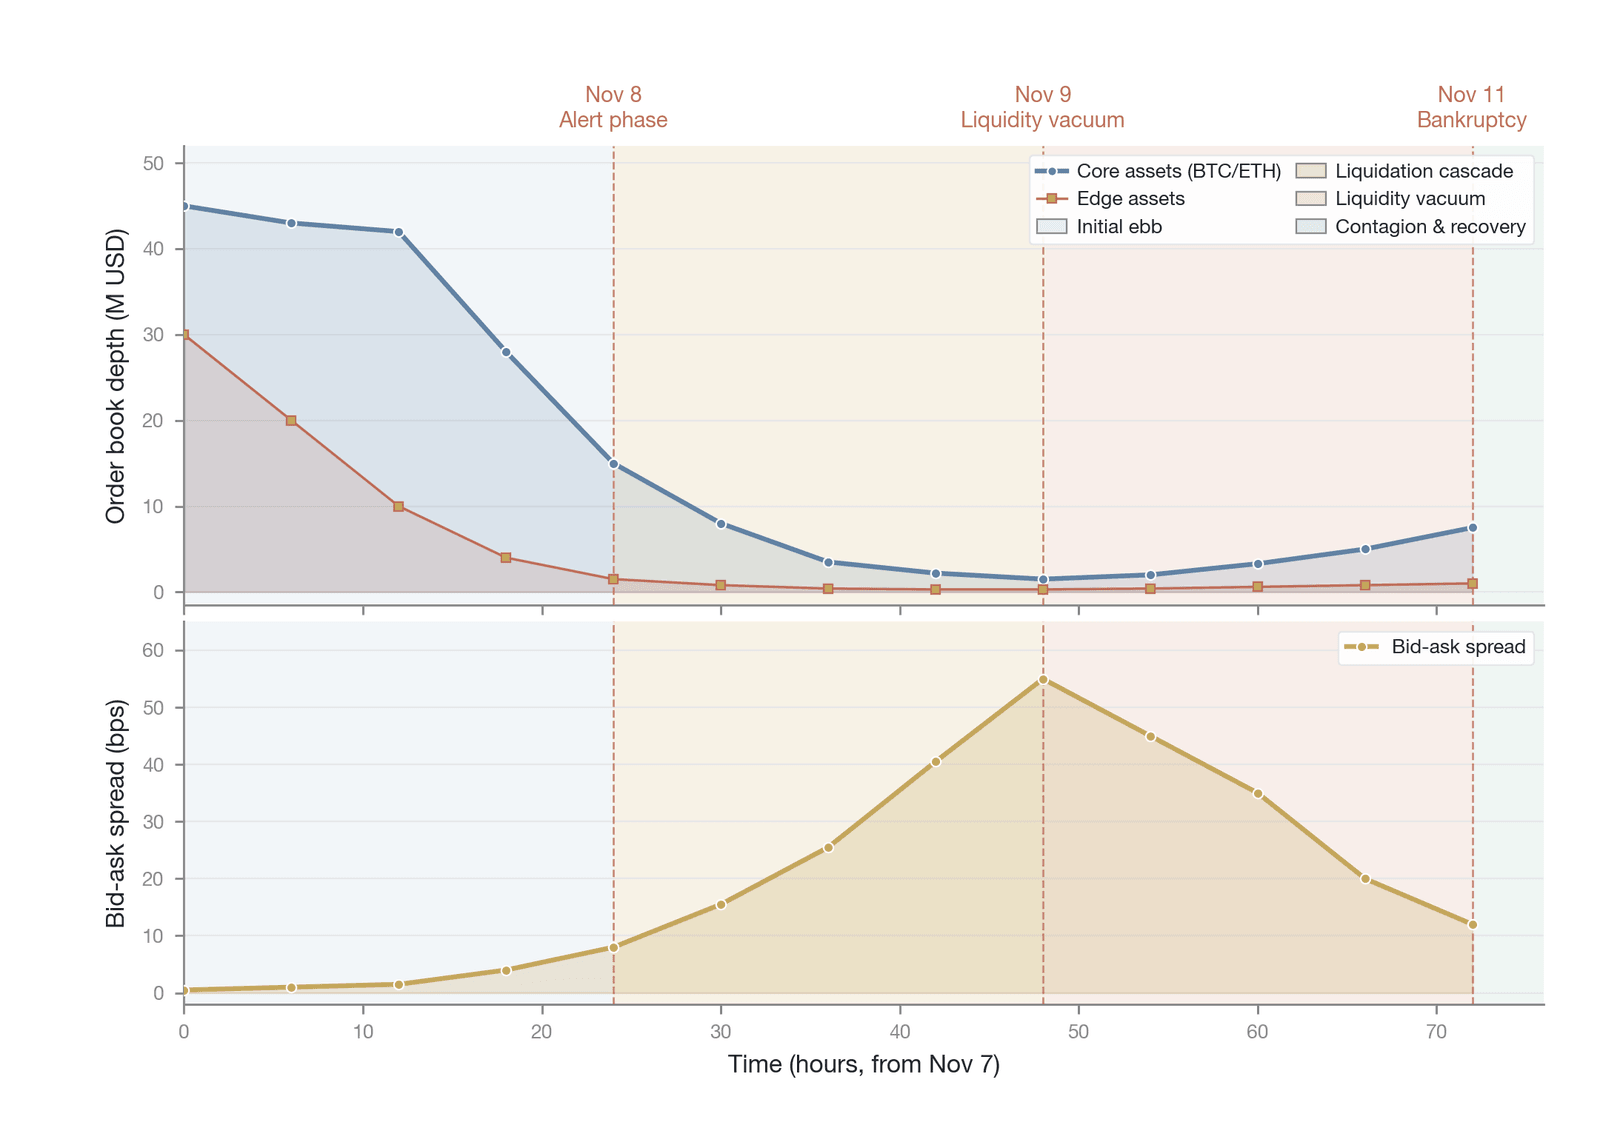
Figure 20-19. The timeline of liquidity evaporation under extreme market conditions (mechanism reference: Galati et al. [31])
In this transmission process, the degree of liquidity deterioration in peripheral assets often far exceeds that in core assets. Because of their large trading volume and diversified participant structure, core assets can still attract some bargain-hunting liquidity providers after an initial liquidity shock. Peripheral assets, however, ordinarily rely on just a few market makers to maintain liquidity, so once those market makers retreat, the market falls into a complete liquidity vacuum, and the bid-ask spread may widen dozens or even hundreds of times, producing an extreme liquidity premium.
An apparent tension arises here: this subsection emphasizes that core assets "can still attract some bargain-hunting liquidity" (a self-repair tendency), whereas Section 20.5.3 emphasizes that market makers' "synchronized retreat causes collapse" (a fragility tendency). The two are not contradictory but correspond to different parameter regimes: when the market is sufficiently deep, participants are sufficiently heterogeneous, and there is still a capital buffer (typically a mild pullback in a core asset), replenishment dominates and the market exhibits self-repair; when the market is thin, participants are highly homogeneous, and the capital buffer is exhausted (typically a peripheral asset or the extreme tail of a core asset), retreat dominates and the market exhibits an abrupt collapse. The dividing variables are mainly the number of heterogeneous participants and the size of the deployable capital buffer. This "retreat-dominated versus replenishment-dominated" demarcation is currently a theoretical inference, and empirical calibration of its threshold is left to future research.
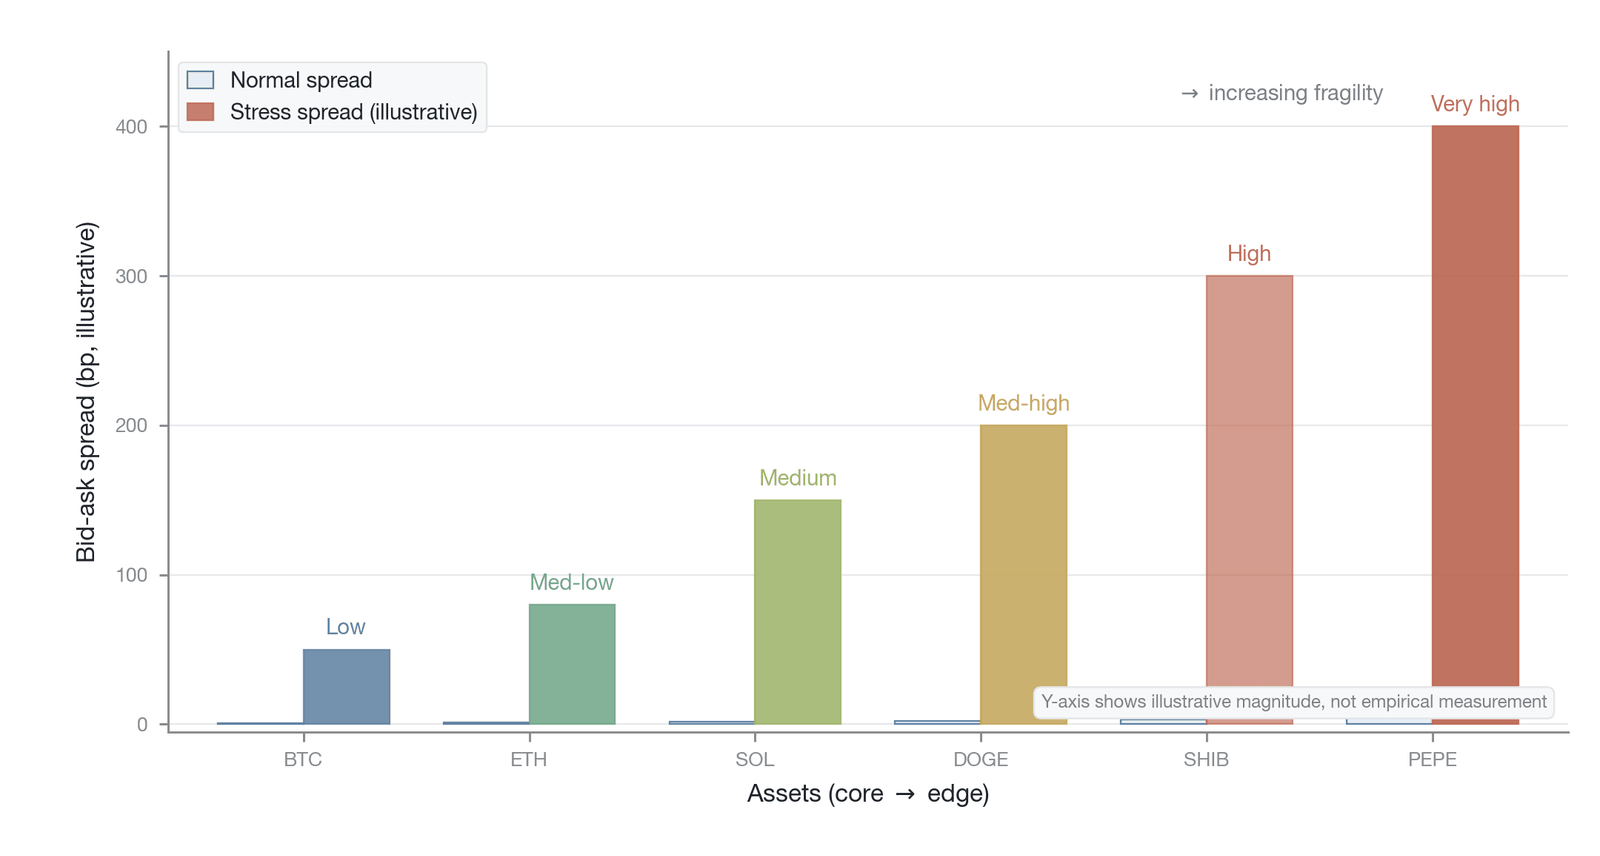
Figure 20-20. A comparison of the features of cross-asset liquidity-transmission chains (mechanism reference: Hautsch et al. [32])
Figure 20-20, taking the liquidity-transmission-chain features of multiple asset classes as its objects of comparison, shows the differentiated impact of cross-asset contagion across core assets, mid-tier assets, and peripheral assets, corroborating this subsection's argument that core assets are relatively resilient while peripheral assets are extremely fragile.
20.7.2 Cross-exchange contagion
Liquidity contagion among centralized exchanges is realized mainly through the failure of the cross-exchange arbitrage mechanism. In normal markets, arbitrageurs play the role of a bridge connecting the liquidity pools of different exchanges. When a particular exchange experiences a brief liquidity imbalance and price deviation in a specific asset, arbitrageurs trade counter-directionally at that exchange while hedging at other exchanges with ample liquidity, thereby dispersing the local liquidity stress across the whole market.
When an extreme liquidity crisis erupts, however, this dispersion mechanism suddenly ruptures. If a major exchange suffers a liquidity run that severely distorts its internal prices, cross-exchange arbitrageurs will attempt to capture this enormous price-spread profit. But the peculiarity of a crisis is that the collapsing exchange is often accompanied by withdrawal restrictions, overloaded trading interfaces, or extreme slippage costs. These frictions prevent arbitrageurs from smoothly completing fund transfers or position hedges, causing the arbitrage path to rupture substantively.
Once the arbitrage path ruptures, arbitrage positions that were originally meant to dampen price spreads turn into one-sided exposures. To control risk, arbitrageurs are forced to urgently close their hedge positions at the other exchanges that are still functioning normally. This large-scale, unexpected closing behavior directly transfers the liquidity stress of the collapsing exchange onto the order books of the other exchanges. At the same time, having observed the collapse of one exchange, the market makers at the other exchanges anticipate the incoming flow of closing orders and the potential systemic risk, and proactively withdraw their quotes. This expectation-based synchronized retreat causes the liquidity crisis to achieve instantaneous cross-exchange contagion among physically isolated exchanges.
20.7.3 Cross-layer contagion
Liquidity contagion between centralized and decentralized markets characterizes the third dimension of systemic risk. The core hub of this cross-layer contagion is the oracle system. The operation of decentralized finance protocols depends heavily on the external price data that oracles provide, and the vast majority of that data originates from the spot or derivatives markets of centralized exchanges.
When a centralized exchange suffers a liquidity crisis that causes its price to plunge in an instant, this extreme and possibly distorted price is faithfully captured by the oracle and broadcast to the various decentralized lending protocols and synthetic-asset platforms. The smart contracts of decentralized protocols lack the ability to discern anomalous price movements and mechanically trigger on-chain liquidation procedures according to the oracle's price feed. This on-chain liquidation triggered by an external liquidity shock forces liquidators to sell the collateral assets into the liquidity pools of decentralized exchanges, thereby causing on-chain liquidity depletion and price collapse.
As the hub of cross-layer contagion, the oracle has failure modes spanning at least three distinguishable dimensions. The first is latency contagion: the price updates of mainstream oracles are constrained by heartbeat intervals and deviation thresholds, and in extreme volatility the price feed may lag significantly behind the real-time price of centralized exchanges, causing the timing of on-chain liquidation triggers to deviate from the true market state and producing over-liquidation or under-liquidation. The second is manipulation contagion: an attacker can influence an oracle's price feed by manipulating the price of the underlying asset on a centralized exchange, thereby triggering anomalous liquidations in a decentralized protocol. The Mango Markets incident of October 2022 is a representative case of this contagion channel, but its specific mechanism must be characterized accurately: the attacker pumped the price of the MNGO perpetual futures across multiple exchanges, which raised the valuation of their own collateral within the Mango protocol (a long MNGO position), then over-borrowed against it and drained the protocol's funds, involving more than $100 million. The essence of this case is "manipulating the valuation of one's own collateral and then over-withdrawing," not "manipulating a third party's spot price to trigger cascading liquidations of others' positions"; but it likewise reveals the cross-layer fragility whereby "the oracle faithfully transmits a manipulated price." The third is congestion contagion: during extreme conditions, a surge in the underlying blockchain's transaction fees may prevent oracle nodes from updating their price feeds in time, causing on-chain protocols to make liquidation decisions using stale price data.
Reverse contagion also exists, and although it is less frequent, its destructive power should not be dismissed. When a decentralized market suffers a flash-loan attack, oracle manipulation, or a vulnerability in the underlying protocol, on-chain asset prices become extremely distorted. High-frequency arbitrageurs quickly capture this enormous on-chain/off-chain price spread and convert this distorted price signal into real trading orders on centralized exchanges. If the market makers of the centralized market fail to identify this false-information shock in time, they may suffer severe losses after taking on the orders, which in turn triggers their risk-control mechanisms and leads to a full retreat. This two-way contagion mechanism shows that centralized and decentralized markets are already deeply bound at the liquidity level, and that fragility at either end becomes a hidden danger for the entire system.
20.7.4 Cross-product contagion
The liquidity crisis of perpetual futures markets ultimately spreads, through inter-product arbitrage relationships, to the spot market and other traditional financial derivatives markets. The most direct link between the perpetual futures and spot markets is the funding-rate arbitrage mechanism. Under normal conditions, large amounts of arbitrage capital earn a steady funding-rate return by holding long spot and short perpetual positions.
When the perpetual futures market falls violently and triggers a long-liquidation cascade, the funding rate rapidly turns from positive to negative, and the negative value may reach an extreme level. At this point, the arbitrage positions that were originally earning a return turn into persistently loss-making positions. To stop losses, arbitrageurs must close their combined positions—buying to close their shorts in the perpetual futures market while selling to close their longs in the spot market. This large-scale spot selling directly transmits the liquidity stress of the perpetual futures market to the spot order book, causing the spot price to plunge in tandem.
This inter-product contagion is not confined to crypto-native markets; it also extends outward along the complexity chain of financial instruments. Violent swings in the spot price are quickly reflected in the regulated futures contracts listed on traditional exchanges, forcing the market makers of traditional financial institutions to adjust their hedge positions. Further, within traditional trading hours, this volatility is transmitted to the related exchange-traded fund (ETF) markets, where, through the lag effect of the creation and redemption mechanism, it continues to affect market liquidity the next day or over a longer period. This tiered transmission from crypto-native derivatives to regulated futures and ETFs is a mechanistic inference; its specific strength and time lag await empirical testing. This cross-product contagion, unfolding in tiers along a temporal sequence, demonstrates the systemic influence of perpetual futures as a source of liquidity risk.
20.8 Institutional roots and quantification
The foregoing mechanistic analysis has revealed the complete transmission chain by which liquidity evaporates under stress. This section integrates these mechanisms into an institutional-level summary, proposes quantitative methods for measuring liquidity risk, and examines the game-theoretic dilemma in market makers' collective behavior, thereby providing a theoretical basis for the design of governance frameworks in subsequent chapters.
The liquidity fragility of perpetual futures markets is not a transitional phenomenon of the market's early development but a structural feature arising from its core institutional design. Compared with traditional equity or futures markets, perpetual futures amplify the intensity and transmission speed of liquidity shocks along multiple dimensions (Table 20-3).
| Dimension | Traditional equity and futures markets | Perpetual futures markets |
|---|---|---|
| Leverage multiple | Constrained by regulation (equity margin about 2–3x; index/commodity futures about 10–20x by contract) | Commonly offer high leverage of 50x to 125x |
| Liquidation mechanism | Margin-call mechanism with a buffer period | Forced market closure executed the moment it is triggered |
| Trading hours | A fixed closing period exists as a natural shock absorber | Round-the-clock, non-stop trading |
| Circuit breakers | Price limits or trading halts are common | The vast majority of platforms lack systemic circuit breakers |
| Market-maker obligations | Some markets have quoting obligations for designated market makers | Purely voluntary participation, with no mandatory quoting requirement |
| Central clearing | A central counterparty absorbs default risk | No unified clearing; each exchange's risk is independent |
| Information environment | Standardized disclosure under strict regulation | No unified and transparent disclosure standard |
Table 20-3. A comparison of the institutional features of traditional markets and perpetual futures markets (Data source: Joshi [33]; that paper is a working paper / job-market paper, not peer-reviewed, and the relevant institutional comparisons should be cross-checked against public trading rules)
The combination of high leverage and an immediate liquidation mechanism is the core driver of liquidity fragility. As listed in Section 20.1.3 and Table 20-3, perpetual liquidation executes the moment it is triggered, with no margin-call buffer; while this protects the exchange from bankruptcy losses, it shifts enormous liquidity stress onto the market. When the market is in a one-sided sharp decline, the chain liquidation of high-leverage positions produces perfectly inelastic demand for liquidity that rapidly devours order-book depth [34].
In addition, as described in the fourth amplifier of Section 20.1.3, round-the-clock trading and the absence of circuit breakers deprive the market of any respite during extreme volatility. A liquidity shock may erupt during the thinnest-depth periods, such as weekends or the pre-dawn hours, when market makers' response capacity is limited and an initial shock more readily evolves into a systemic liquidity vacuum. This difference in institutional design shows that, without changing the underlying architecture, the fragility of perpetual futures markets cannot be eliminated by trading-volume growth alone.
Moreover, the liquidity fragility of perpetual futures markets is not determined solely by endogenous mechanisms; the macro liquidity environment constitutes an important precondition for the accumulation of fragility. The liquidity deterioration of 2022 did not begin with the FTX event in November but had been accumulating throughout the Federal Reserve's aggressive rate-hiking cycle. Market-wide order-book depth had already declined markedly from early 2022 to just before the FTX event, and the FTX event merely delivered a final blow to an already fragile base. The dollar-tightening cycle systematically compressed the liquidity base of perpetual futures markets through multiple channels: the contraction of institutional capital's risk appetite caused market-making capital to withdraw, the rising yield on stablecoin reserves raised the opportunity cost of market making, and the failures of crypto-friendly banks directly severed the funding channels between fiat and crypto markets. Ignoring this macro context would overestimate the independent explanatory power of the endogenous mechanisms described in this chapter.
The difference in institutional features is further reflected at the level of measuring liquidity risk. Traditional liquidity metrics can effectively reflect market depth and transaction costs under normal conditions, but they often fail under extreme market conditions: as analyzed in Section 20.5, apparent liquidity systematically overestimates true liquidity under stress, causing severe bias in risk measurement.
To capture the risk of a liquidity collapse more accurately, this section proposes four liquidity-risk quantification metrics oriented toward perpetual futures markets. This section is a design proposal for quantification metrics, intended to indicate operable directions for measurement; their full parameterization and historical backtesting are left to subsequent empirical research, and except for the "market-maker concentration index," for which a minimal formalization is given below, the other metrics remain at the level of conceptual definition.
First, conditional depth measures the expected available liquidity at a given level of volatility or order toxicity. Unlike a static order-book snapshot, conditional depth incorporates market makers' cancellation probability and reflects the dynamic response of liquidity supply to market state variables. When volatility breaches a certain threshold, conditional depth exhibits a nonlinear, abrupt decline, and this metric can provide an early warning of the fragility behind apparent liquidity (see Cont et al. [35] on the framework for liquidity stress testing).
Second, liquidity value at risk borrows a concept from traditional financial risk management to quantify liquidity losses under extreme scenarios. It measures, at a given confidence level, the maximum proportion of liquidity that the market may evaporate within a specified time window [35]. For example, liquidity value at risk at a 95% confidence level indicates that in the worst 5% of market scenarios, order-book depth will shrink to an extremely low proportion of its normal level. This metric transforms liquidity risk from a single price-impact measure into a system-level probability of supply depletion.
Third and fourth, the liquidation-trigger distance and the market-maker concentration index provide risk early warning at the microstructural level. The liquidation-trigger distance measures the gap between the current market price and the next dense liquidation band. The nearer the distance, the higher the probability that microscopic price movements trigger a cascade liquidation, and the greater the risk that the market enters the positive-feedback loop of liquidity consumption. The market-maker concentration index assesses the degree to which market depth depends on a small number of core liquidity providers. As a minimal formal proposal, the market-maker concentration index can be defined as:
N = \sum{i=1}^{N} s_i
where is the proportion of total market-making depth provided by the -th market maker on the target trading pair (ranked in descending order), and is the number of top market makers included in the statistic. Taking , and combining this with the illustrative reference of "the top five firms accounting for depth on the order of 50%–70%" given in Section 20.7.1, yields the illustrative value (this value inherits the gray-literature nature of the source in Section 20.7.1 and is illustrative only). The closer is to 1, the more market depth depends on a small number of top market makers, and the higher the risk that the market falls into a liquidity vacuum once these market makers retreat in concert because of their risk-control strategies.
The quantitative methods reveal the structural features of liquidity risk, while market makers' collective behavior gives rise to a deeper institutional dilemma. Liquidity in perpetual futures markets exhibits the features of a quasi-public good. All market participants—whether directional traders or arbitrageurs—benefit from tight bid-ask spreads and ample order depth. Yet this resource, with its broad externalities, is supplied entirely and voluntarily by profit-maximizing private market makers. Under systemic stress, this supply mechanism inevitably falls into the classic tragedy of the commons.
From the standpoint of individual rationality, each market maker's decision is driven by its real-time profit equation. When market volatility surges and the toxicity brought by liquidation orders rises sharply, continuing to maintain quotes means bearing enormous inventory risk and adverse-selection cost. At this point, pulling orders and exiting the market is the optimal strategy for protecting one's own capital. When all market makers make the retreat decision based on the same rational logic, however, the result of collective irrationality follows: liquidity across the entire market collapses completely.
In a liquidity-vacuum environment, the price-discovery mechanism fails, and a small sell order can trigger a violent price gap. This systemic collapse harms not only ordinary traders but ultimately the market makers themselves. The inventory positions market makers already hold cannot be closed at a reasonable price in a market that lacks liquidity, causing them to face paper losses far exceeding expectations. This is a classic prisoner's dilemma: cooperation (jointly maintaining liquidity) can prevent a market collapse and is most beneficial for the collective; but for any single market maker, defection (retreating first) is always the dominant strategy. The final Nash equilibrium is necessarily that all market makers retreat in concert and the market falls into a suboptimal state of liquidity depletion [36].
Traditional financial markets mitigate this dilemma by introducing external mechanisms. For example, a central bank acts as lender of last resort in times of crisis, or an exchange mandates quoting obligations for licensed market makers under extreme conditions. In the crypto-asset derivatives market, which is highly decentralized and lacks unified regulation, there is neither a central institution capable of providing unlimited liquidity nor any mandatory market-making constraint. The competitive relationships and information asymmetry among market makers make spontaneous coordinated action impossible. This is the core challenge of liquidity governance. The global regulatory environment is responding to the institutional deficiencies described above: as of 2025, the European Union's Markets in Crypto-Assets Regulation (MiCA), the Hong Kong Securities and Futures Commission's framework for virtual-asset trading platforms, and Japan's Financial Services Agency, among others, are respectively imposing obligations on licensed exchanges regarding market integrity, orderly trading, and even designated-market-maker-like liquidity guarantees. These emerging regulatory directions may gradually alter the "no-obligation" baseline state described in this chapter, and their specific impact is discussed further in the next chapter.
Integrating the analysis above, this chapter has systematically diagnosed the roots of liquidity fragility in perpetual futures markets. Liquidity is not an exogenously given static environment but an endogenous variable coupled deeply with price, volatility, and leverage. The positive-feedback loops formed by these three elements, under the effect of the institutional amplifiers unique to perpetual futures, can convert a small initial shock into a market-wide liquidity catastrophe. The vast wedge between apparent and true liquidity, together with the tragedy of the commons in market makers' collective action, jointly reveals the deep-seated defects of the existing liquidity-supply system.
The collective retreat of market makers in extreme conditions stems not from irrational behavior but from a structural tendency of the profit equation. Since the sum of individual rationality produces systemic fragility, the solution must go beyond strategy optimization at the microscopic level and turn toward institutional and incentive design at the macroscopic level. The next question is: how can market rules be restructured to change the return-risk asymmetry market makers face in a crisis? How can innovative governance frameworks be designed so that privately supplied liquidity possesses the resilience of public infrastructure? These explorations of liquidity governance and reconstruction are the central topic of the next chapter.
20.9 Chapter summary
This chapter has revealed a fundamental contradiction in the liquidity system of perpetual futures: liquidity disappears on a large scale at precisely the moment it is most needed. This countercyclicality does not stem from participants' irrational panic but is a structural consequence of market microstructure and the market maker's profit equation. By dissecting the mechanisms of liquidity endogeneity, this chapter has deconstructed the positive narrative of liquidity supply established in the previous chapter, showing how a seemingly stable supply system can fail systematically under extreme stress.
Liquidity in perpetual futures markets is highly endogenous. It is no longer the exogenous background condition assumed by traditional theory but a dynamic variable coupled deeply with price, volatility, and leverage. The reflexivity triangle formed by these three elements produces mutually reinforcing positive-feedback loops: a price decline triggers rising volatility, market makers' inventory costs grow convexly, forcing them to widen spreads or withdraw depth, and the retreat of liquidity in turn amplifies the price impact of subsequent orders and drives volatility higher still; at the same time, the price decline erodes long margin, effective leverage climbs passively, and forced liquidation is triggered, with liquidation orders pouring in as perfectly inelastic demand for liquidity that both devours the remaining order-book depth and drives out the remaining market makers through high toxicity; and the extremization of the funding rate in a one-sided market distorts the long-short position structure, triggering the concentrated exit of arbitrage capital and adding another layer of pressure to the liquidity collapse.
The institutional features of perpetual futures amplify this endogenous fragility. Leverage as high as a hundredfold, market liquidation executed the moment it is triggered, the absence of the natural stabilizer of expiry convergence, and a round-the-clock trading environment lacking circuit breakers together constitute a highly sensitive risk-amplification system; these designs, which in normal times confer capital efficiency and trading convenience, turn into catalysts of liquidity evaporation in a crisis. Under their effect, a vast wedge opens between apparent and true liquidity: the ample depth displayed on the order book often contains large amounts of ghost liquidity that disappears in an instant under stress, causing conventional risk metrics to systematically underestimate true liquidity risk on the eve of a crisis.
The collapse of liquidity is not an instantaneous random event but follows a five-stage path from microstructural trigger to systemic contagion. An order that exceeds the market's absorptive capacity or an unexpected external shock acts as the initial trigger, causing market makers to tighten their quotes initially; the subsequent price decline activates the liquidation cascade, and forced sell orders resonate with market-maker retreat; once depth is exhausted, a price gap appears on the order book and the market falls into a liquidity vacuum; finally, the local depletion spreads rapidly, through market makers' cross-asset risk control, the cross-margin mechanism, and arbitrageurs' cross-market positions, to other assets, other exchanges, and even the spot and traditional derivatives markets.
The essence of this catastrophe is a classic tragedy of the commons. Liquidity, as a quasi-public good that benefits the whole market, depends entirely on the voluntary supply of private market makers. In extreme conditions, each market maker's retreat decision based on the profit equation is an individually rational choice, but the synchronized retreat of all market makers produces the result of collective irrationality—a full collapse of market-wide liquidity. Lacking an external lender-of-last-resort role and mandatory market-making obligations, the market cannot break this prisoner's dilemma on its own.
The analysis in this chapter shows that the liquidity fragility of perpetual futures markets is a systemic problem. That market makers supply liquidity amply in calm times and shrink it sharply in extreme conditions is a foreseeable outcome of their rational, optimal response to return-risk asymmetry; but foreseeable does not mean unchangeable. Since the collapse is driven by a specific profit equation and specific institutional features, restructuring these underlying logics may inject new resilience into the market. How can more effective incentive mechanisms be designed to change market makers' behavior in a crisis? How can innovative governance frameworks be introduced to overcome the tragedy of the commons in liquidity supply? These explorations of liquidity governance and institutional reconstruction constitute the core content of the next chapter.
References
[1] Kaiko Research. (2023). Looking back on FTX's impact. https://research.kaiko.com/insights/looking-back-on-ftxs-impact
[2] Kaiko Research. (2022, November 15). The Alameda Gap. Kaiko Research Weekly, 2022-11.
[3] Akyildirim, E., Conlon, T., Corbet, S., & Goodell, J. W. (2023). Understanding the FTX exchange collapse: A dynamic connectedness approach. Finance Research Letters, 53, 103643. https://doi.org/10.1016/j.frl.2023.103643
[4] Brunnermeier, M. K., & Pedersen, L. H. (2009). Market liquidity and funding liquidity. The Review of Financial Studies, 22(6), 2201–2238.
[5] Soros, G. (1987). The Alchemy of Finance: Reading the Mind of the Market. John Wiley & Sons.
[6] Anand, A., & Venkataraman, K. (2016). Market conditions, fragility, and the economics of market making. Journal of Financial Economics, 121(2), 327–349. https://doi.org/10.1016/j.jfineco.2016.03.006
[7] Ho, T., & Stoll, H. R. (1981). Optimal dealer pricing under transactions and return uncertainty. Journal of Financial Economics, 9(1), 47–73. https://doi.org/10.1016/0304-405x(81)90020-9
[8] Avellaneda, M., & Stoikov, S. (2008). High-frequency trading in a limit order book. Quantitative Finance, 8(3), 217–224. https://doi.org/10.1080/14697680701381228
[9] Glosten, L. R., & Milgrom, P. R. (1985). Bid, ask and transaction prices in a specialist market with heterogeneously informed traders. Journal of Financial Economics, 14(1), 71–100. https://doi.org/10.1016/0304-405x(85)90044-3
[10] Kyle, A. S. (1985). Continuous auctions and insider trading. Econometrica, 53(6), 1315–1335. https://doi.org/10.2307/1913210
[11] Diamond, D. W., & Dybvig, P. H. (1983). Bank runs, deposit insurance, and liquidity. Journal of Political Economy, 91(3), 401–419. https://doi.org/10.1086/261155
[12] Morris, S., & Shin, H. S. (1998). Unique equilibrium in a model of self-fulfilling currency attacks. American Economic Review, 88(3), 587–597.
[13] Geanakoplos, J. (2010). The leverage cycle. NBER Macroeconomics Annual, 24(1), 1–65. https://doi.org/10.1086/648285
[14] Shleifer, A., & Vishny, R. W. (1992). Liquidation values and debt capacity: A market equilibrium approach. The Journal of Finance, 47(4), 1343–1366. https://doi.org/10.1111/j.1540-6261.1992.tb04661.x
[15] Deribit Insights. (2021). The (Flash) Crash of May 19, 2021. https://insights.deribit.com/exchange-updates/the-flash-crash-of-may-19-2021/
[16] Perpetual Protocol Team. (2021). 2021/2/21 BTC Flash Crash. Medium. https://blog.perp.fi/2021-2-21-btc-flash-crash-149eef35f7f8
[17] Briola, A., Vidal-Tomás, D., Wang, Y., & Aste, T. (2023). Anatomy of a Stablecoin's failure: The Terra-Luna case. Finance Research Letters, 51, 103358. https://doi.org/10.1016/j.frl.2022.103358
[18] Uhlig, H. (2022). A luna-tic stablecoin crash (No. w30256). National Bureau of Economic Research.
[19] Diop, P. O. (2024). An econometric and time series analysis of the USTC depeg's impact on the LUNA classic price crash during spring 2022's crypto market turmoil. Commodities, 3(4), 24.
[20] Allen, F., & Carletti, E. (2008). The role of liquidity in financial crises. In Proceedings – Economic Policy Symposium – Jackson Hole (pp. 379–412). Federal Reserve Bank of Kansas City. https://doi.org/10.2139/ssrn.1268367
[21] Degryse, H., de Winne, R., Gresse, C., & Payne, R. (2018). High frequency trading and ghost liquidity. SSRN Electronic Journal.
[22] Easley, D., López de Prado, M. M., & O'Hara, M. (2012). Flow toxicity and liquidity in a high-frequency world. The Review of Financial Studies, 25(5), 1457–1493. https://doi.org/10.1093/rfs/hhs053
[23] Bessembinder, H., Panayides, M. A., & Venkataraman, K. (2009). Hidden liquidity: An analysis of order exposure strategies in electronic stock markets. Journal of Financial Economics, 94(3), 361–383. https://doi.org/10.1016/j.jfineco.2009.02.001
[24] Berkowitz, J. (2000). Incorporating liquidity risk into value-at-risk models (Working Paper). University of California, Irvine.
[25] Bangia, A., Diebold, F. X., Schuermann, T., & Stroughair, J. D. (1999). Modeling liquidity risk with implications for traditional market risk measurement and management. Risk, 12(12), 68–73.
[26] Kirilenko, A., Kyle, A. S., Samadi, M., & Tuzun, T. (2017). The flash crash: High-frequency trading in an electronic market. The Journal of Finance, 72(3), 967–998. https://doi.org/10.1111/jofi.12498
[27] Bouchaud, J. P., Farmer, J. D., & Lillo, F. (2009). How markets slowly digest changes in supply and demand. Handbook of Financial Markets: Dynamics and Evolution, 57–160. https://doi.org/10.1016/b978-012374258-2.50006-3
[28] Conlon, T., Corbet, S., & Hu, Y. (2026). The collapse of the FTX exchange: The end of cryptocurrency's age of innocence. The British Accounting Review, 58(3), 101277.
[29] Akhtaruzzaman, M., Boubaker, S., Nguyen, D. K., & Rahman, M. R. (2022). Systemic risk-sharing framework of cryptocurrencies in the COVID–19 crisis. Finance Research Letters, 47(B), 102787. https://doi.org/10.1016/j.frl.2022.102787
[30] Acemoglu, D., Ozdaglar, A., & Tahbaz-Salehi, A. (2015). Systemic risk and stability in financial networks. American Economic Review, 105(2), 564–608. https://doi.org/10.1257/aer.20130456
[31] Galati, L., Webb, A., & Webb, R. I. (2024). Financial contagion in cryptocurrency exchanges: Evidence from the FTT collapse. Finance Research Letters, 67(A), 105747. https://doi.org/10.1016/j.frl.2024.105747
[32] Hautsch, N., Scheuch, C., & Voigt, S. (2024). Building trust takes time: Limits to arbitrage for blockchain-based assets. Review of Finance, 28(4), 1345–1380. https://doi.org/10.1093/rof/rfae004
[33] Joshi, R. (2025). Exogenous Stress and Runs on Perpetual Futures: A Global Games Approach. https://assets.zyrosite.com/dWxb3MBxOpUo84q9/rj_final_jmp-yITW2IpzBgnp7Swl.pdf
[34] Chen, E., Ma, M., & Nie, Z. (2024). Perpetual future contracts in centralized and decentralized exchanges: Mechanism and traders' behavior. Electronic Markets, 34(1), 1–25.
[35] Cont, R., Kotlicki, A., & Valderrama, L. (2020). Liquidity at risk: Joint stress testing of solvency and liquidity. Journal of Banking & Finance, 118, 105871.
[36] Ostrom, E. (2008). The challenge of common-pool resources. Environment: Science and Policy for Sustainable Development, 50(4), 8–21.