On October 10, 2025, a macroeconomic report about an unexpected deadlock in U.S.–China trade negotiations—the U.S. president's announcement of a 100% tariff on Chinese imports—stirred only mild ripples in traditional financial markets. When the same news reached the crypto perpetual futures market, which trades around the clock, it unexpectedly triggered a systemic liquidation event of unprecedented scale. Within roughly 24 hours, visible market-wide forced liquidations exceeded $19 billion in notional value; measured over the full deleveraging process, the window spanned about 36 hours. The event affected roughly 1.62 million trading accounts, of which about 87% held long positions [1]. The price of Bitcoin plunged from an intraday high of about $122,500 and reached a low of roughly $104,800 on the spot/aggregate-index basis (an intraday drawdown of about 14.5%; because depth had dried up, perpetual futures printed even deeper wicks, with individual venues briefly touching about $102,000). Market-wide open interest evaporated by about $19.2 billion within the 40-minute cascade window (a peak-to-trough decline of about 25%), order-book depth on major exchanges collapsed by more than 99%, bid-ask spreads widened abruptly by several orders of magnitude, and liquidity dried up suddenly amid violent price swings (the complete microstructure data appear in Section 11.9.2, Table 11-7) [2].
This constitutes a structural paradox. In the weeks before the event, the vast majority of traders operated at leverage in the seemingly "safe" range of 5x to 10x. They set stop-losses, kept margin buffers, and believed their risk management was prudent. Yet when the market began to fall, these individual-level prudential measures not only failed to prevent a systemic crisis but intensified it: every stop-loss and liquidation that was triggered injected fresh selling pressure into the market, and together they drove a systemic collapse. This phenomenon, in which individual rationality leads to collective irrationality, reveals a structural blind spot in the microstructure of perpetual futures markets: when everyone manages risk "rationally" in the same direction, their collective behavior itself constitutes the greatest systemic risk.
The "10.10 event," along with the many similar crashes in crypto history—from the "3.12" COVID crash of March 2020 to the shock of China's mining ban in May 2021—was not a mere "black swan" or a chance accident. Such episodes are the periodic eruption of a predictable systemic risk driven by the market's own internal structure. This risk originates in an endogenous reflexivity feedback loop that forms between leverage and automated liquidation mechanisms: under specific conditions, leverage combines with the automated execution of the liquidation engine to become a counterintuitive risk amplifier, forming a positive-feedback mechanism that can self-reinforce and drive systemic collapse. As the systematic analysis of liquidation mechanisms in Sections 11.1 and 11.6 reveals—examining, from a mechanism-design perspective, how the liquidation engine seeks a balance between protecting system solvency and maintaining market stability—the liquidation mechanism is meant to "clear bad debt and protect the system," yet under conditions of high leverage, limited depth, and positive feedback, liquidation itself becomes the creator of systemic risk rather than its solver.
To dissect this complex dynamic process, this chapter builds a two-layer theoretical framework. At the philosophical level, it introduces George Soros's theory of reflexivity, which supplies a macro perspective for understanding the non-equilibrium nature of markets; at the mechanism level, it applies the liquidity spiral model of Brunnermeier and Pedersen, which supplies the economic tools for dissecting market microprocesses. With their extremely high leverage ceilings (up to 125x), around-the-clock trading, automated liquidation, and global access, perpetual futures have become the most extreme and purest testing ground for these two frameworks. This chapter first dissects the micro transmission chain of leverage and liquidation, clarifying the mechanical process that runs from a price move to forced liquidation; it then establishes the two-layer theoretical foundation of reflexivity. Building on this, the chapter constructs five core theoretical tools in turn: the liquidation reflexivity equation, which formalizes the liquidation cascade; the compound positive feedback that couples the funding rate with liquidation; the impossible trinity of liquidation-mechanism design; the time-compression effect unique to perpetual futures; and the information paradox of liquidation together with mechanism-induced volatility. Finally, it applies these tools jointly to a complete reflexivity dissection of the "10.10 event," testing the explanatory power of the entire analytical framework.
11.1 The transmission chain of leverage and liquidation
The core function of leverage is capital efficiency: it allows a trader to control a position far larger than their own capital. The price of this privilege, however, is a precise, stringent, code-automated risk-management system—the margin and liquidation system. This system builds a deterministic transmission chain that runs from continuous fluctuations in the market price to the forced liquidation of a trader's position. Understanding each link in this chain—how margin constrains leverage, how the mark price defines "truth," how the liquidation engine enforces its verdict, and how the margin mode determines the path of risk transmission—is a necessary precondition for understanding how systemic risk emerges from individual behavior.
11.1.1 Margin and the leverage constraint
In perpetual futures trading, leverage does not arise from nothing; it rests on the margin system. Initial margin is the minimum amount of a trader's own capital that must be committed to open a leveraged position. Its formula is straightforward:
Initial margin = position notional value / leverage multiple
For example, a trader who wants to open a $100,000 BTC long at 10x leverage must post $10,000 as initial margin. The initial margin rate directly determines the maximum leverage a trader can use: if the initial margin rate is set at 5%, the trader can use up to 20x leverage; if it is 1%, up to 100x; and in the lowest tier at some exchanges, an initial margin rate of 0.8% implies an extreme 125x leverage.
The minimum capital level required to keep a position open is called maintenance margin, and this ratio is typically far below the initial margin. For the same $100,000 position, for instance, the maintenance margin requirement might be only 0.4% to 0.5%, or $400 to $500. The difference between initial margin and maintenance margin constitutes the trader's liquidation buffer. The size of this space directly reflects the fragility of the position: when the market price moves adversely and the account's margin balance (initial margin plus or minus unrealized profit and loss, or P&L) falls below the maintenance margin level, the liquidation process is triggered automatically. For a long position, the liquidation price can be expressed, in simplified form, as:
Liquidation price (long) ≈ entry price × (1 − initial margin rate + maintenance margin rate)
This formula is a first-order approximation that ignores the continuous erosion of margin by trading fees and funding payments (the latter is addressed by the dynamic formula below). It essentially represents a lower bound on the price decline required to trigger liquidation. In actual trading, because funding costs and fees accumulate, the true liquidation price is closer to the entry price than the formula's estimate.
The formula above, however, assumes that the margin balance is affected only by price changes and ignores the continuous consumption of margin by the funding rate (see Section 11.4). Once the time effect of the funding rate is included, the liquidation price is no longer a static constant but a dynamic variable that rises monotonically with holding time. For a long position, the time-dependent liquidation price can be expressed as:
where is the static liquidation price at the moment the position is opened, is the funding-rate density at time (the rate per unit time, positive for the party paying on a long position), is the position notional value, and is the position size (the number of coin-denominated contracts). Since , the integrand is the cumulative funding payment per unit time (with dimensions of dollars per unit time); dividing by converts it into the rate at which the liquidation price rises (dollars per coin per unit time), consistent with the dimensions of the left-hand side (dollars per coin). Equivalently, this can be written as . Contract type must be distinguished: for a linear contract (USDT-margined), is simply the reciprocal of the number of coins held, and the expression can be written directly as ; for an inverse contract (coin-margined), the face value is denominated in coin terms, so a nonlinear transformation of the coin price must be layered on top of . The convention for must also be specified: taken as the rate density per unit time, is the cumulative price rise; if it is recorded per exchange convention as a discrete fraction per settlement period, the integral is replaced by a discrete sum over the settlement times. Moreover, this integral is a continuous approximation of discrete settlement: most exchanges settle the funding rate every 8 hours (some, such as OKX, have shortened this to every 4 hours or even every hour), and the margin deduction occurs at the settlement moment rather than continuously. This discreteness introduces a "funding-settlement-timing fragility": a single deduction at the settlement instant may push a marginally safe position into the liquidation zone, especially when settlement coincides with intensifying volatility. For this reason, some protocols (such as Hyperliquid) have moved to a continuously accruing funding rate, smoothing settlement from a discrete jump into a continuous micro-adjustment and eliminating the concentration of fragility at the settlement instant.
When the funding rate stays positive, the integral term accumulates over time and the liquidation price moves steadily toward the current market price. The core implication of this formula is that, even if the market price does not change at all, the continuous consumption by the funding rate alone can drive the liquidation price to reach the market price within a finite time, forcing the position into liquidation. This formula is demonstrated numerically in the analysis of the margin-erosion effect in Section 11.4.
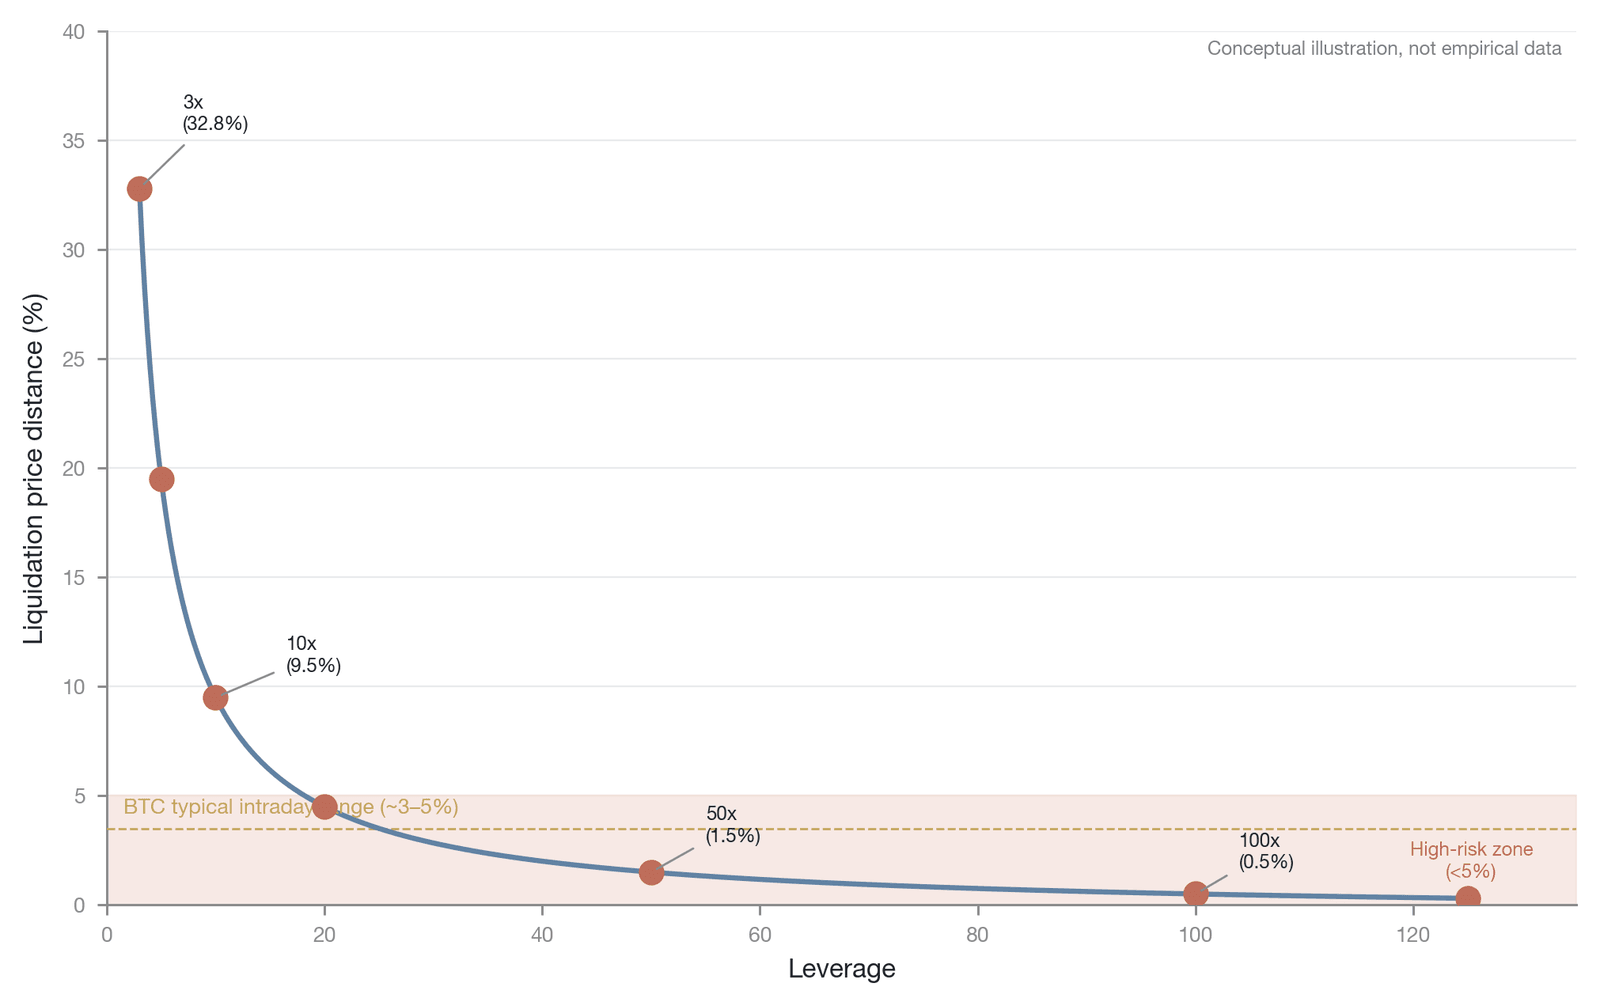
Figure 11-1. Relationship between the leverage multiple and the distance to the liquidation price (a first-order approximation based on the simplified liquidation formula, excluding funding and fees; the orange dashed band marks typical BTC intraday volatility; conceptual illustration)
The core insight is that the higher the leverage and the lower the initial margin rate, the closer the liquidation price is to the entry price, and the sensitivity of the position to price fluctuations rises nonlinearly and sharply. As shown in Figure 11-1, the orange dashed line marks the typical range of BTC intraday volatility (about 3%–5%), and at leverage above 20x the liquidation distance already falls within this range: at 3x leverage the price must fall by about 32.8% to trigger liquidation, which is a rare and extreme event in BTC's history; at 10x leverage a decline of about 9.5% suffices; at 50x leverage a move of less than 1.5% (which does not even constitute a meaningful intraday move) is enough to force liquidation; and at 100x leverage the liquidation distance is only 0.5%, so almost any random price noise can trigger liquidation. Leverage is therefore an amplifier that transforms "normal market volatility" into "liquidation events," mapping tiny fluctuations in price space into enormous changes in margin space.
Across crypto exchanges, setting the initial margin rate is a core design decision and an ongoing competitive game. Table 11-1 compares the margin parameters for BTC perpetual futures at major exchanges as of 2025 (note: actual margin rates increase in tiers with position size; the lowest tier is shown here):
| Exchange | Max leverage | Min initial margin rate | Maintenance margin rate (lowest tier) | Liquidation buffer | Type |
|---|---|---|---|---|---|
| Binance | 125x | 0.80% | 0.40% | 0.40% | CEX |
| OKX | 125x | 0.80% | 0.40% | 0.40% | CEX |
| Bybit | 100x | 1.00% | 0.50% | 0.50% | CEX |
| dYdX v4 | 20x | 5.00% | 3.00% | 2.00% | DEX |
| Hyperliquid | 40x | 2.50% | 1.25% | 1.25% | DEX |
Table 11-1. Comparison of margin parameters for BTC perpetual futures at major exchanges (Data source: exchanges' official documentation. CEX figures are lowest-tier/small-position parameters using dynamic tiering, with leverage falling sharply for large positions; DEX figures are BTC-market parameters. Hyperliquid lowered its ceiling from 50x to 40x on March 12, 2025, and the dYdX v4 BTC ceiling is about 20x; data collected in 2025)
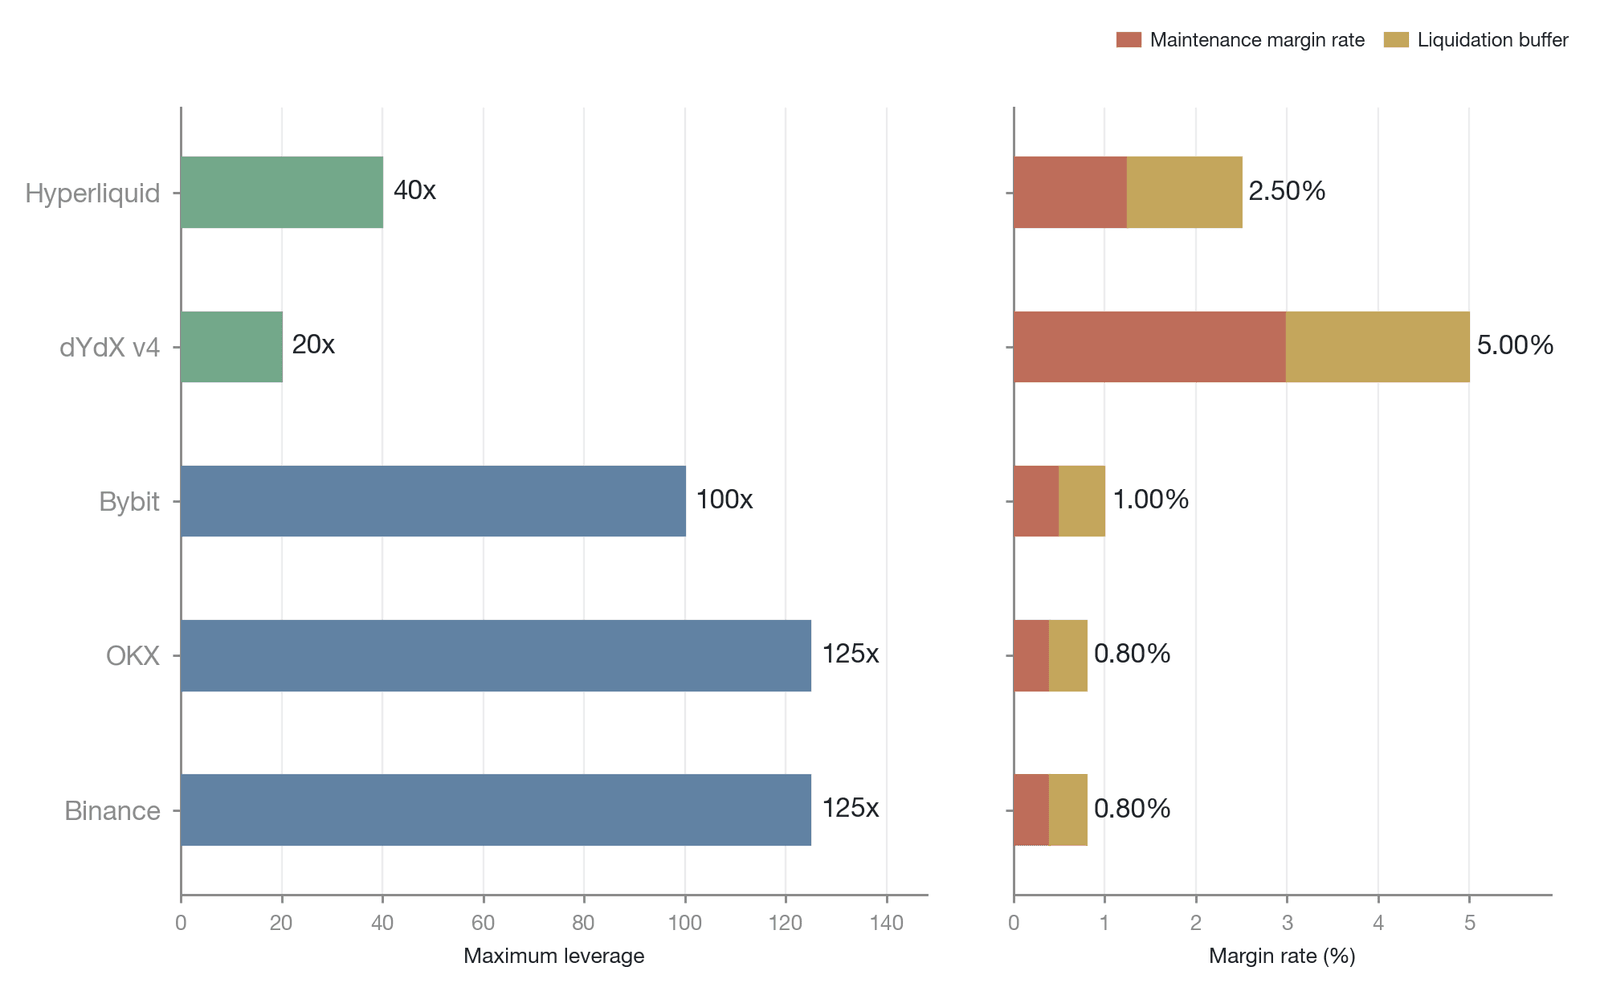
Figure 11-2. Visual comparison of margin parameters across major exchanges (Data source: exchanges' official documentation, as of 2025; CEX = blue, DEX = green; headline leverage is for the lowest-risk tier and declines dynamically with position size; Hyperliquid lowered its ceiling from 50x to 40x on March 12, 2025, and the dYdX v4 ceiling is about 20x)
As shown in Figure 11-2, centralized exchanges (CEXs) generally offer higher leverage (100x–125x) and correspondingly very narrow liquidation buffers (only 0.4%–0.5%), whereas decentralized exchanges (DEXs) such as dYdX and Hyperliquid take a relatively conservative approach, capping BTC's maximum leverage at about 20x–40x with buffers of about 1.25%–2.0%. This difference reflects different risk appetites under different market positionings: an overly low margin requirement permits extremely high leverage and, while it can attract high-yield users and boost trading volume, markedly increases systemic fragility; an overly high margin requirement limits capital efficiency and drives users away. This game between market share and system safety often devolves into a "race to the bottom." As the risk-substitution theorem of Chapter 5 ("risk cannot be eliminated, only transferred") reveals, there is a structural trade-off between capital efficiency and system safety, and under competitive pressure safety is often the first dimension to be sacrificed (here the capital-efficiency–safety tension is a derived reparameterization of Chapter 5's service-provider impossible trinity from the perspective of leverage risk, rather than that trinity itself; see Section 11.6.5).
Most exchanges use a tiered margin system, in which the initial and maintenance margin rates rise step by step as the position grows. Binance, for example, has more than a dozen tiers for BTC perpetual futures, with position sizes ranging from $50,000 in the lowest tier to hundreds of millions of dollars in the highest, and corresponding maintenance margin rates rising from 0.40% to more than 5%. The purpose of this design is to limit the leverage available on large positions and reduce the potential impact of a single whale on the market.
The tier boundaries themselves, however, can become a counterintuitive risk trigger—the phenomenon of "cross-tier liquidation." Consider a concrete scenario: a trader holds a BTC long with a notional value of $49,000, which sits in the first tier (maintenance margin rate 0.4%), so the required maintenance margin is only $196. When a rise in the BTC price lifts the position's notional value to $51,000 and into the second tier (maintenance margin rate 0.5%), the required maintenance margin jumps to $255, an increase of 30%. If the trader's margin balance happens to be between $196 and $255, a price increase that should have produced a profit instead triggers liquidation, creating the paradox that "the higher it rises, the more dangerous it becomes." This discontinuity, caused by the jump at a tier boundary, is especially pronounced for large positions at high leverage. To mitigate it, some exchanges have begun to introduce smoothed margin curves, replacing the discrete tier steps with a continuously increasing function and thereby eliminating the jump in margin at the boundaries.
The tiered system also introduces a subtle nonlinear effect: when price fluctuations push a position's notional value across a tier boundary, the maintenance margin requirement rises in a jump, which can cause an otherwise safe position to trigger liquidation suddenly. This threshold effect is formalized in the liquidation reflexivity equation of Section 11.3.
11.1.2 The mark-price mechanism
If the liquidation system used the last traded price on a single exchange directly as its trigger condition, then in a thin market a single anomalous trade—or a malicious manipulator using a small amount of capital to "wick" the price (i.e., instantaneously create an extreme price)—could trigger the erroneous liquidation of many other positions. To guard against this risk, almost all major exchanges have introduced the mark price as the benchmark for triggering liquidation, rather than relying on their own last traded price.
The mark price is usually constructed by aggregating the real-time prices of several major spot exchanges (such as Coinbase, Kraken, and Bitstamp) and taking a volume-weighted average. Some exchanges also add a moving average of the funding rate to reflect the basis between perpetual futures and spot.
Take Binance's mark-price calculation as an example: it uses a median-of-three method, where Mark price = Median(Price₁, Price₂, Contract price), with Price₁ = Index price × (1 + latest funding rate × fraction of time to next settlement) and Price₂ = Index price + EMA(fair contract price − index price). The median function provides implicit resistance to outliers: even if one of the three components is contaminated or anomalous, the other two still anchor the mark price within a reasonable range. Different exchanges use different mark-price formulas (OKX uses a weighted-moving-average method and Bybit an exponentially weighted scheme), and this difference in calculation means that the same asset can have a slightly different mark price at the same moment on different exchanges, leading to different liquidation-trigger sensitivities. In extreme market conditions, this difference can determine whether a position is liquidated.
Behind this design lies a game-theoretic point: the cost of simultaneously manipulating multiple highly liquid, mainstream spot markets is far higher than the cost of manipulating a single derivatives market. The mark price is therefore considered a better reflection of an asset's "fair value," providing a more robust anchor for liquidation decisions.
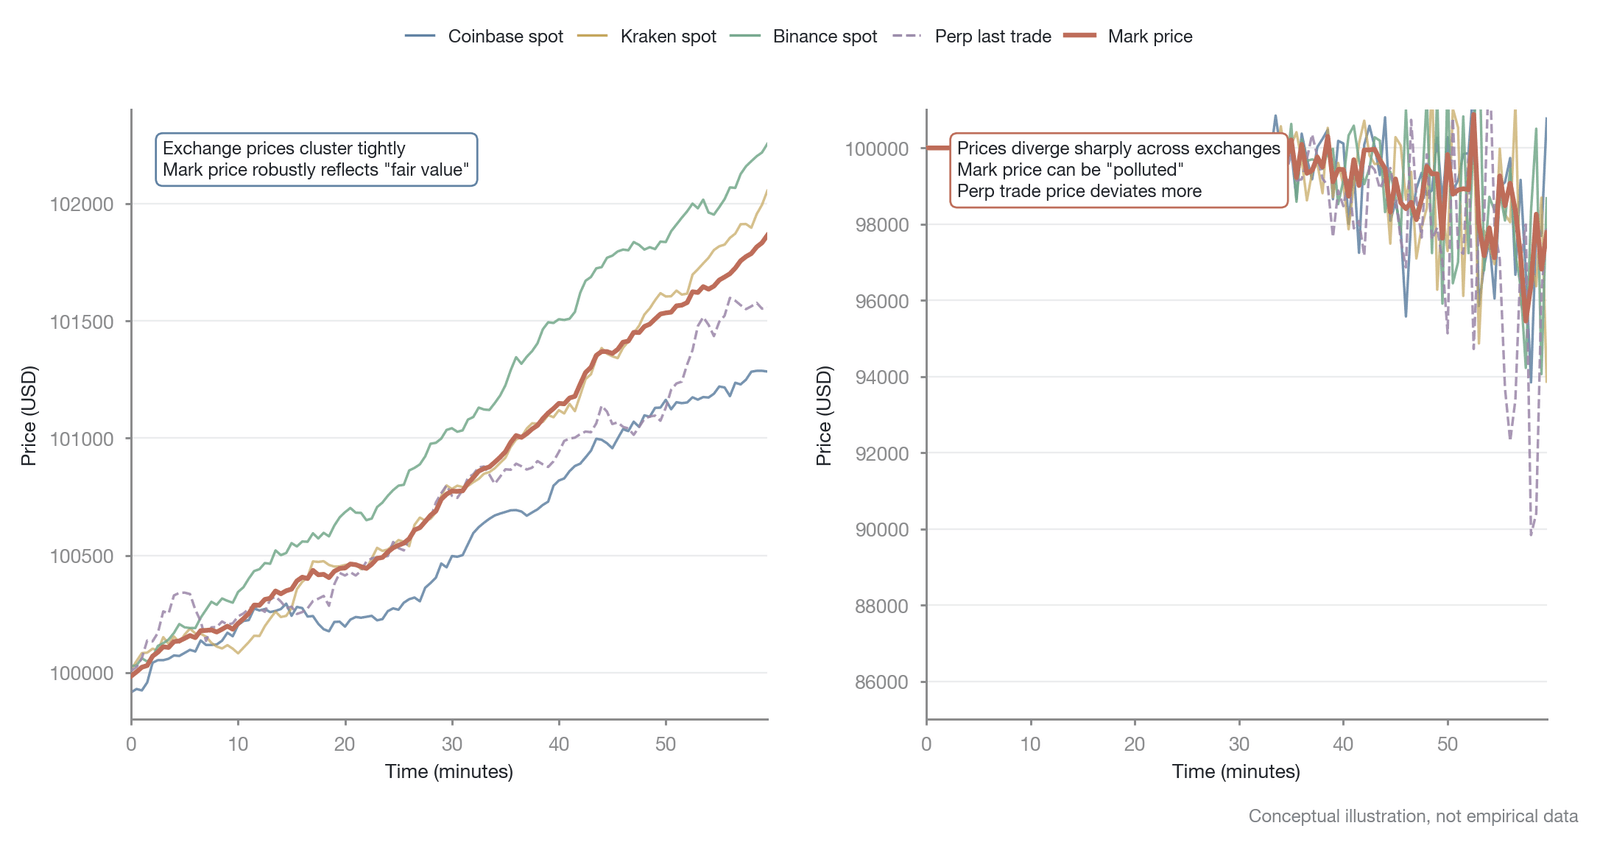
Figure 11-3. Comparison of the mark-price construction mechanism in normal and extreme states (conceptual illustration, not empirical data)
The mark price, however, is not an absolutely reliable benchmark but a derived reference price whose robustness depends on a set of assumptions that hold in normal markets but can break down in extreme conditions. As shown in Figure 11-3, the left panel shows that in a normal market the prices of the various exchanges cluster tightly and the mark price (the thick red line) robustly reflects fair value; the right panel shows that under an extreme shock, spot prices diverge markedly, the perpetual traded price (the purple dashed line) departs substantially from the mark price, and the mark price itself may be "contaminated." When these assumptions collapse in extreme conditions, the mark-price mechanism can turn from a risk buffer into a risk conduit:
On the oracle-risk front, the mark price relies on real-time price feeds from external price sources. For centralized exchanges, this usually means obtaining data via API from other exchanges; for decentralized exchanges (such as dYdX and Hyperliquid), it relies on on-chain oracles (such as Chainlink and Pyth). Either way, the price-feed system can be subject to attack, network latency, or failure. Specifically, oracle failure modes can be grouped into several categories. First, intrusion at the data-source level: an exchange's API keys are stolen, or the exchange itself reports manipulated price data, contaminating the price-feed input at its source. Second, transport-layer attacks: a man-in-the-middle attack or DNS hijacking can tamper with price data as it travels from the source exchange to the oracle node, which is especially insidious in a centralized API price-feed architecture. Third, smart-contract vulnerabilities in on-chain oracles, including reentrancy attacks, access-control flaws, or exploited upgrade mechanisms, through which an attacker can directly tamper with the price stored on-chain via a contract-level vulnerability. Fourth, economic-manipulation attacks: an attacker uses a flash loan to temporarily distort, within a single transaction, the on-chain price source on which the oracle relies (such as the spot price of a Uniswap pool); these attacks mainly target scenarios in DeFi protocols that use an instantaneous on-chain price as the oracle. Fifth, latency arbitrage: exploiting the time lag between the oracle's update frequency and actual price movements, an attacker executes trades when the oracle price has not yet updated but the market price has already moved substantially, profiting from the stale mark price. Once an erroneous mark price is adopted, catastrophic and unfair liquidations follow. As discussed in Chapter 6, maximal extractable value (MEV)—the economic gain an attacker obtains by manipulating or front-running state changes, including oracle price updates—makes this risk especially prominent in the DeFi environment.
On the data-quality front, the quality of the mark price depends on the data quality of its constituent exchanges. If one constituent exchange itself experiences a liquidity drought or a price anomaly (for example, a flash crash), its anomalous price will "contaminate" the weighted average and cause the mark price to deviate from true fair value. During the "10.10 event," when USDe traded at a severe discount on Binance, the prices of USDe-denominated pairs became sharply distorted, and the extent to which this distortion seeped into the mark-price calculation remains a focus of industry debate to this day [3].
During periods of extreme volatility, the basis between the spot market and the perpetual futures market can widen sharply. The last traded price of perpetual futures may depart substantially from the mark price because order-book depth has dried up. At such times, although the mark price is still "correct" mathematically, there can be an enormous gap between the "fair value" it reflects and the execution price a trader can actually obtain in the perpetual futures market. This means that even when the mark price has not yet reached the liquidation line, a trader may be in de facto distress because they cannot close out at a reasonable price.
The design of the mark-price mechanism is essentially a trade-off between robustness and sensitivity. A mark price that is too robust (for example, one using a long-window moving average) may lag the true price in a rapid decline, delaying the triggering of liquidations and increasing bankruptcy risk; a mark price that is too sensitive is easily affected by short-term noise and manipulation, causing unnecessary liquidations. This trade-off has no perfect solution; it is one of the intrinsic conflicts in liquidation-mechanism design and is analyzed more systematically in the "impossible trinity" framework of Section 11.6.
11.1.3 The liquidation engine
Once the mark price confirms that an account's margin balance is below the maintenance margin requirement, the liquidation engine takes over the position. The liquidation engine is essentially an automated trading program with the highest execution priority, whose sole objective is to force-close a position on the brink of bankruptcy as quickly as possible and with as little market impact as possible, thereby preventing the system from incurring bad debt from underwater positions. The system has an absolutely deterministic character: once the conditions are met, the code executes strictly according to preset rules, regardless of market depth, the trader's wishes, or potential consequences.
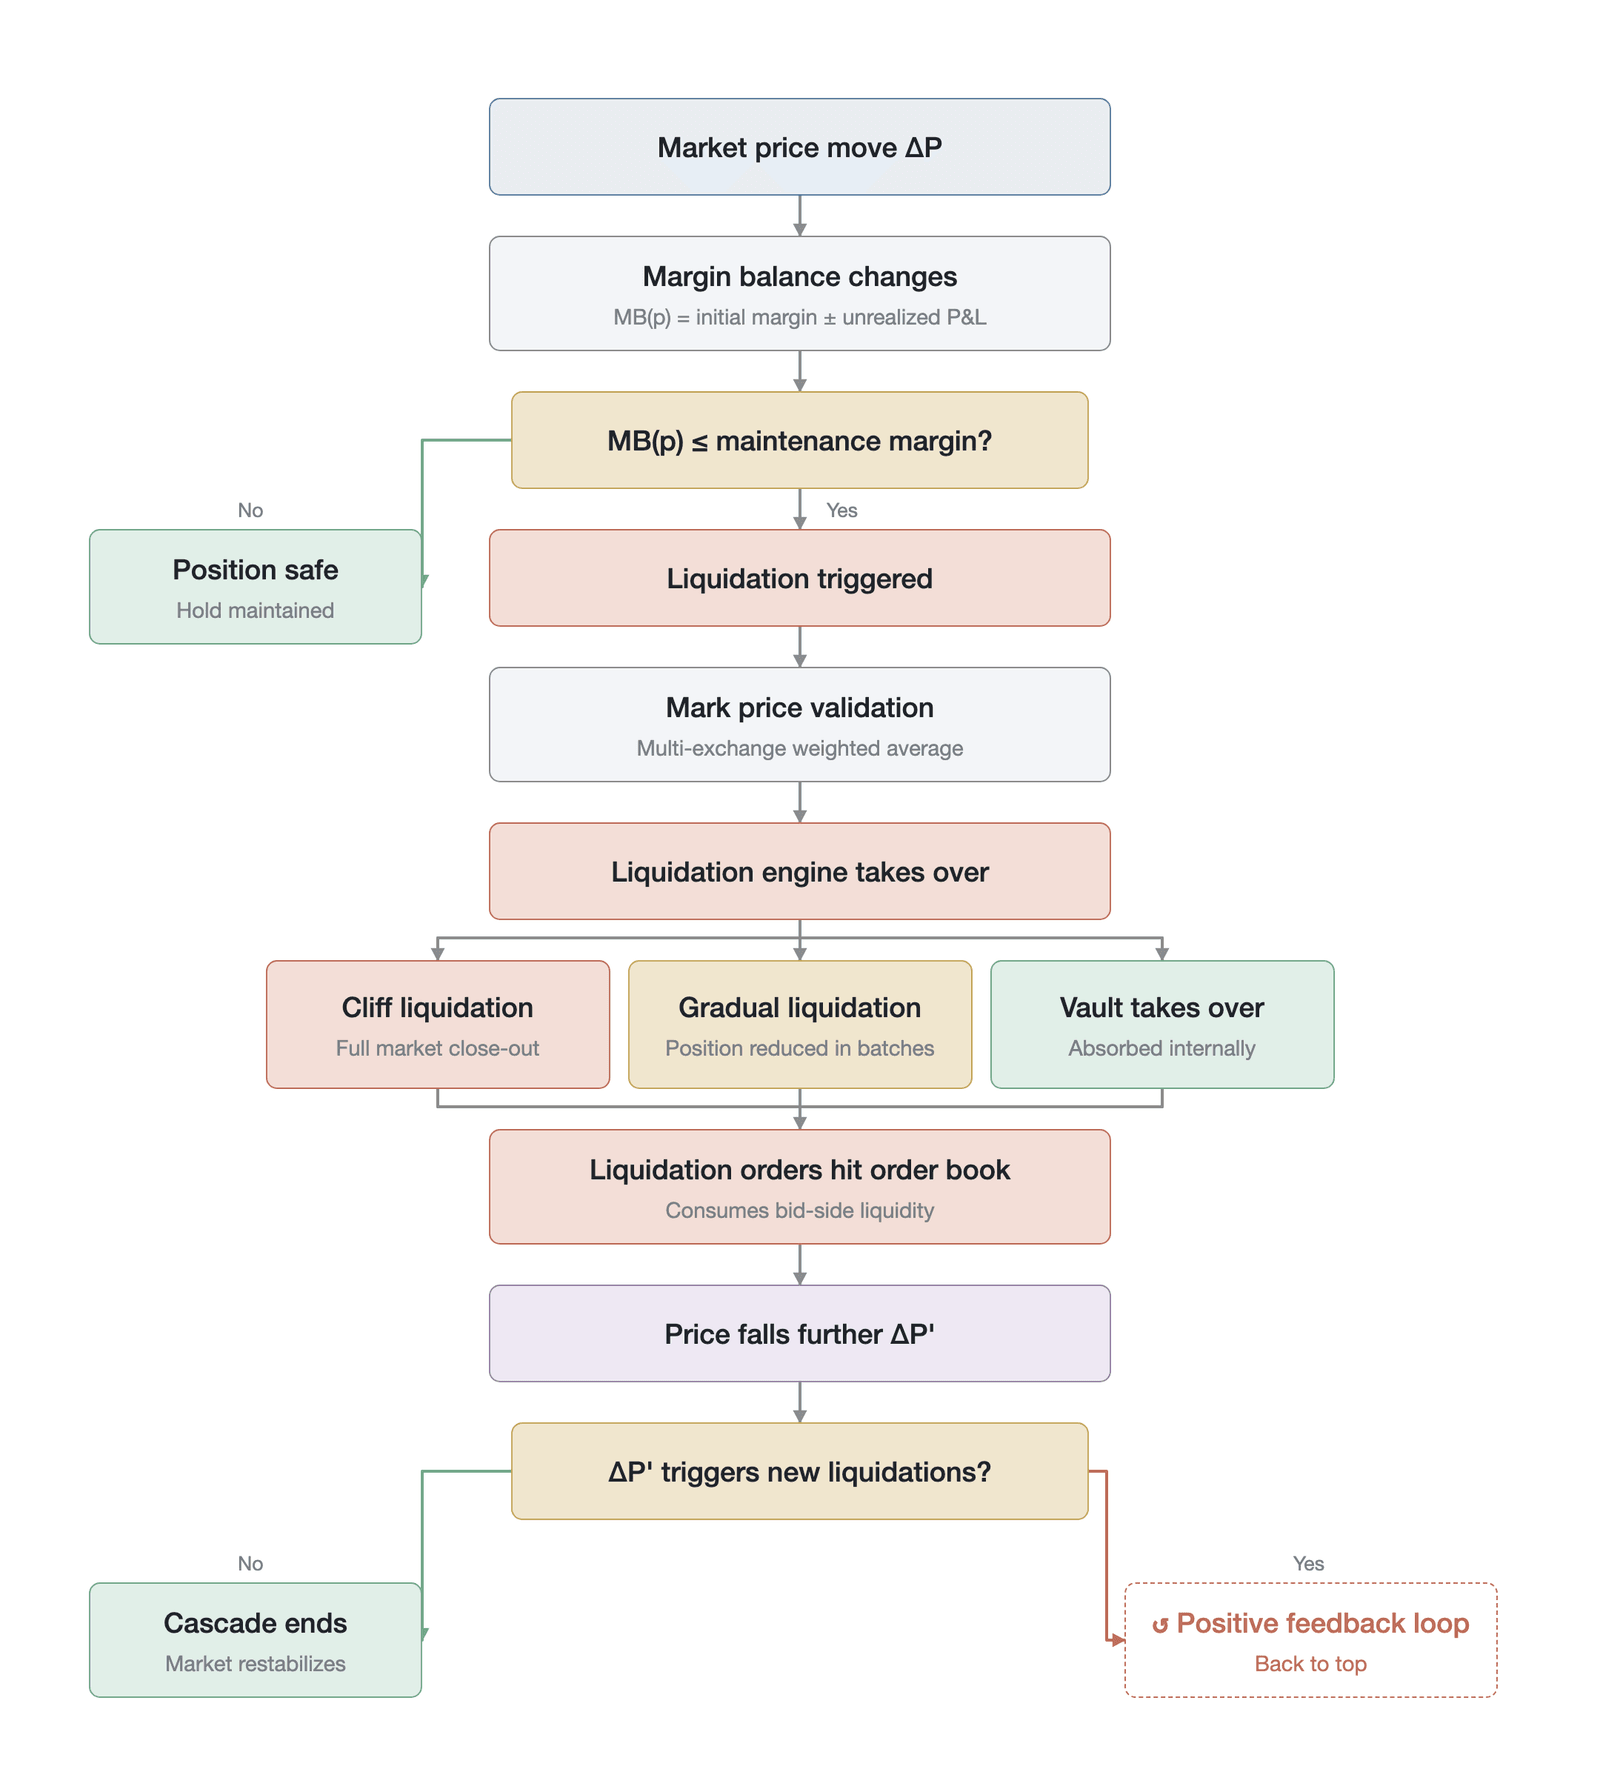
Figure 11-4. The transmission chain from a price move to liquidation execution
As shown in Figure 11-4, this transmission chain presents in full the process running from the assessment of the margin balance, through mark-price verification and the choice of liquidation mode, to the liquidation order's impact on the market and, in turn, the triggering of a new batch of liquidations that forms positive feedback. The design of the liquidation engine has undergone a marked shift over time, from a pursuit of efficiency to a balance that also weighs impact, and the mainstream liquidation-execution modes today can be grouped into the following four.
Cliff-edge liquidation is the earliest and most direct mode. When the trigger condition is met, the liquidation engine dumps the entire position onto the market at once as a market order, clearing bad debt with great speed and high execution certainty but with an enormous impact on the order book: in extreme conditions where liquidity is already thin, a single large liquidation market order may "eat through" multiple price levels at once, driving the price down further and triggering more liquidations. BitMEX around 2019 was known for this mode, and the price impact it produced repeatedly sparked accusations of "liquidation hunting." In response to this destructive impact, the industry gradually evolved progressive liquidation: when liquidation is triggered, the position is not closed all at once but reduced in batches. The proportion cut each time is calculated dynamically by the liquidation engine based on the severity of the margin shortfall and the position's tier—the larger the shortfall and the higher the tier, the larger the proportion cut in a single step. The liquidation orders are submitted as limit orders, with the target execution price set between the bankruptcy price and the mark price, rather than impacting the order book with market orders. After each partial close, the system re-assesses the remaining position: if the price recovers to a safe level, liquidation stops; if it continues to deteriorate, the cutting continues. Notably, liquidation limit orders that are not immediately filled remain on the order book as resting orders, forming a dense layer of sell orders that constitutes a resistance level to any price rebound and is gradually absorbed as sentiment deteriorates further—smoothing the liquidation impact over time while fixing it in place in price space. This approach markedly reduces the immediate impact of a single liquidation but lengthens the total liquidation window, and when the price is falling rapidly the delay can lead to larger bankruptcy losses. Binance was the first to adopt progressive liquidation comprehensively, around 2020, and OKX, Bybit, and others followed, making it the industry standard for centralized exchanges.
Another mode is the vault backstop, exemplified by Hyperliquid's HLP vault (see Chapter 9, which systematically analyzes the operating mechanism, return structure, and risk exposure of HLP as an in-protocol market-making vault). Hyperliquid's liquidation process is in fact a multi-step mechanism: when a position triggers liquidation, the liquidation engine first attempts to place the position on the order book as a limit order at a price near the bankruptcy price. Only when the order book cannot absorb the position (i.e., the position is already "underwater," with the market price worse than the bankruptcy price) do the insurance fund and then the HLP vault step in, in sequence, as successive backstops to absorb it (the full three-tier liquidation waterfall of order book → insurance fund → HLP vault is detailed in Section 9.4.3 of Chapter 9). After the JELLY manipulation event of March 2025, the protocol introduced major mechanism reforms, including a cap on the size of any single position and improved oracle-price handling logic. This tiered design channels most liquidation pressure to the public order book in normal markets and calls on the vault to absorb positions only in extreme cases, seeking a balance between minimizing market impact and preserving system solvency. In essence, however, this design creates a risk-concentration trade-off: the vault, as a single entity, absorbs liquidation pressure that should have been dispersed across the entire market, and its risk exposure rises monotonically as a one-sided market persists. Once the vault's net asset value is eroded to a critical level, it transforms from a provider of liquidity into a demander of liquidity and even becomes a new node of systemic risk (as the analysis of the JELLY manipulation event in Chapter 9 reveals, this is precisely what happens when the scale of liquidation exceeds the vault's capacity). Unlike the vault backstop, auto-deleveraging serves as the last risk buffer: when the bankruptcy losses produced by liquidation exceed the capacity of the insurance fund (the dedicated risk-reserve pool an exchange accumulates from liquidation residuals, whose capital structure, replenishment mechanism, and stress capacity are detailed in Chapter 12), the system automatically "trims" profits from the most profitable counterparty positions to cover the losses. Auto-deleveraging (ADL) ensures that the system does not incur socialized losses (in which all users share the loss) in extreme cases, but it does so at the expense of the legitimate interests of profitable traders, provoking serious fairness disputes.
Although the design of the liquidation engine has been continually optimized, its limitations remain fully exposed in extreme conditions. The data from the "10.10 event" provide striking empirical evidence: within the 40 minutes of the cascade's eruption (20:50–21:30 UTC), the liquidation rate surged from an average of $120 million per hour over the preceding 8 hours to $10.39 billion per hour, an acceleration of 86-fold [2]. At the peak moment (21:15 UTC), $3.21 billion of positions were force-closed within a single minute, of which 93.5% were market sell orders produced by long liquidations [2].
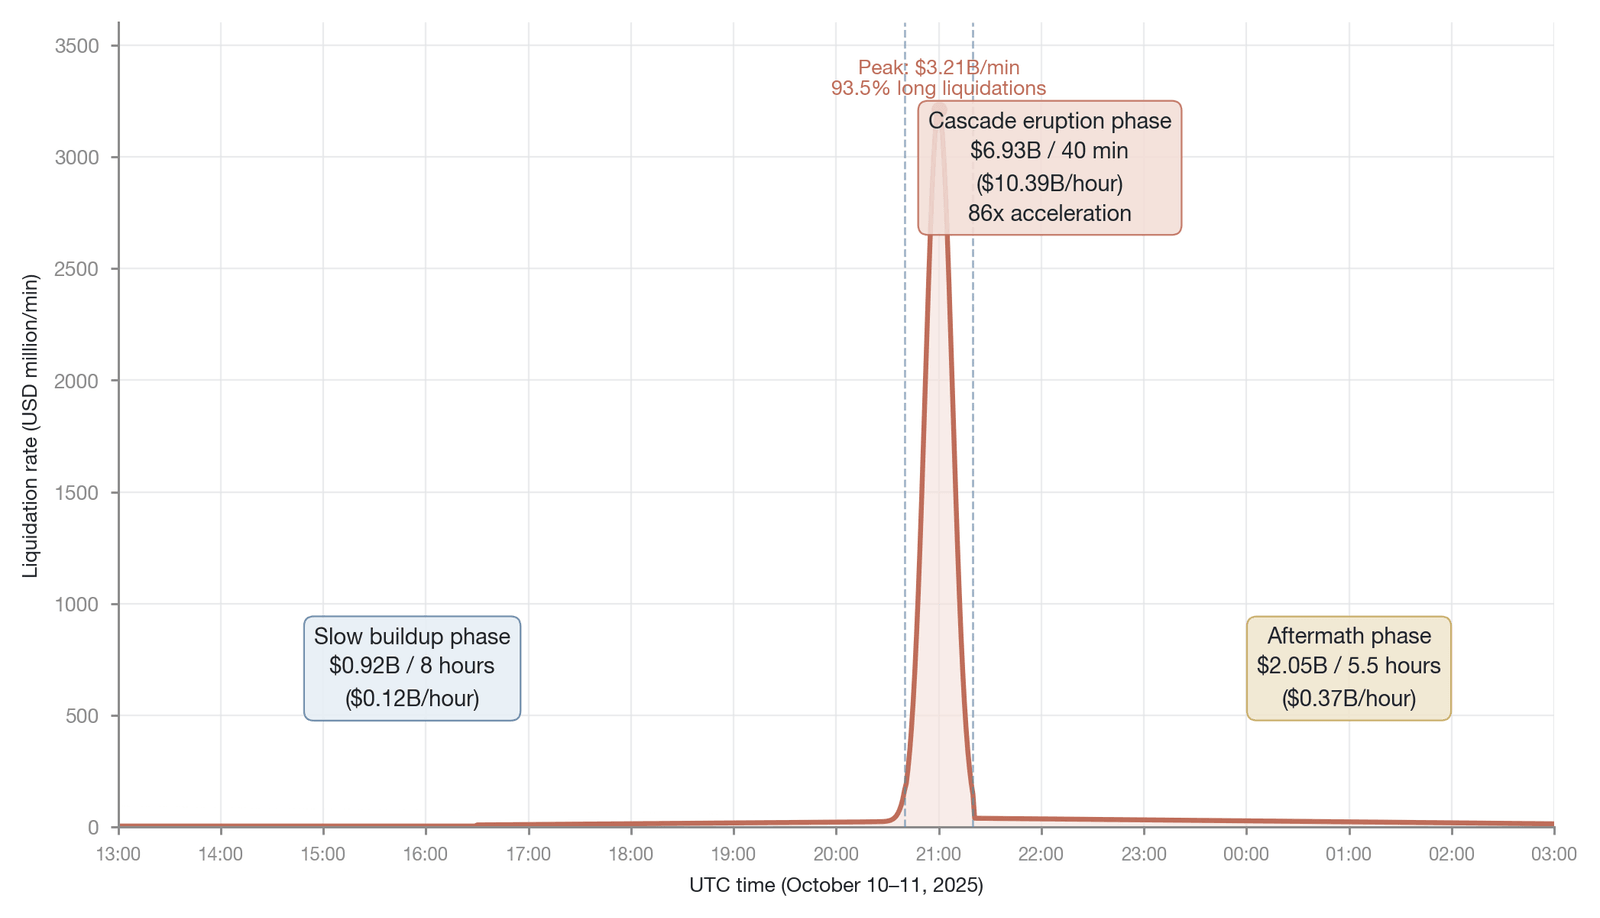
Figure 11-5. Timeline of the liquidation rate during the "10.10 event" (Data source: Amberdata [2], as of October 2025; 93.5% is on a peak-minute basis, while the 24-hour aggregate is about 87%; the roughly $9.9 billion three-phase total is Amberdata's tracked subset and is not the same basis as CoinGlass's market-wide 24-hour figure of about $19 billion—do not conflate the two)
As shown in Figure 11-5, the entire event exhibits three clearly distinguishable phases: slow accumulation, cascade eruption, and aftermath. When such a massive volume of liquidation requests floods in simultaneously, the liquidation engine itself may queue and lag because its processing capacity has reached its ceiling. This infrastructure overload means there is a discrepancy between actual execution time and theoretical trigger time, and while the price is falling rapidly, this delay often leads to larger slippage and more severe bankruptcy losses. The "3.12" event of March 2020 is a classic case of infrastructure overload amplifying risk: on March 13, BitMEX suffered a service outage of about 25 minutes (officially attributed to a DDoS attack on the platform), during which matching and liquidation nearly halted and the price subsequently rebounded, so that many positions were actually executed only at levels far below their theoretical liquidation prices before and after the outage, with bankruptcy losses far exceeding expectations [4].
11.1.4 Margin modes
The way a trader manages margin fundamentally determines the path along which risk is transmitted within the account and across the entire market. The two mainstream margin modes are isolated margin and unified margin (cross-margin). The choice between them is far from a mere tuning of technical parameters; it is an underlying institutional variable that fundamentally shapes the path of systemic-risk transmission.
Under isolated margin, the trader allocates a specific amount of margin to each position, and risk is fully isolated between positions. The maximum loss on one position is limited to the margin allocated to it and does not spill over to other funds or positions in the account. For example, if a trader allocates $5,000 of margin to a BTC long, then even if that position is fully liquidated, the funds used for ETH and SOL trading in the account are unaffected. The advantage of this mode is precise risk control and predictable losses, but its disadvantage is equally clear: low capital efficiency, because the unrealized profit of a winning position cannot be used to support other losing positions, and the trader must set aside an independent margin buffer for each position.
Under unified margin, the entire account is treated as a single liquidity pool. All available balances and the unrealized P&L of all positions serve jointly as margin, and the system decides whether to trigger liquidation based on the account's total net equity. This mode greatly improves capital efficiency: the unrealized profit of a winning position can automatically offset the margin consumption of a losing position, making long-short hedges and cross-asset strategies possible. For this reason, unified margin has been actively promoted by the major exchanges in recent years and has become the mainstream choice for professional traders.
In extreme conditions, however, unified margin exposes a fatal weakness: it creates a cross-asset, cross-position path for risk contagion.
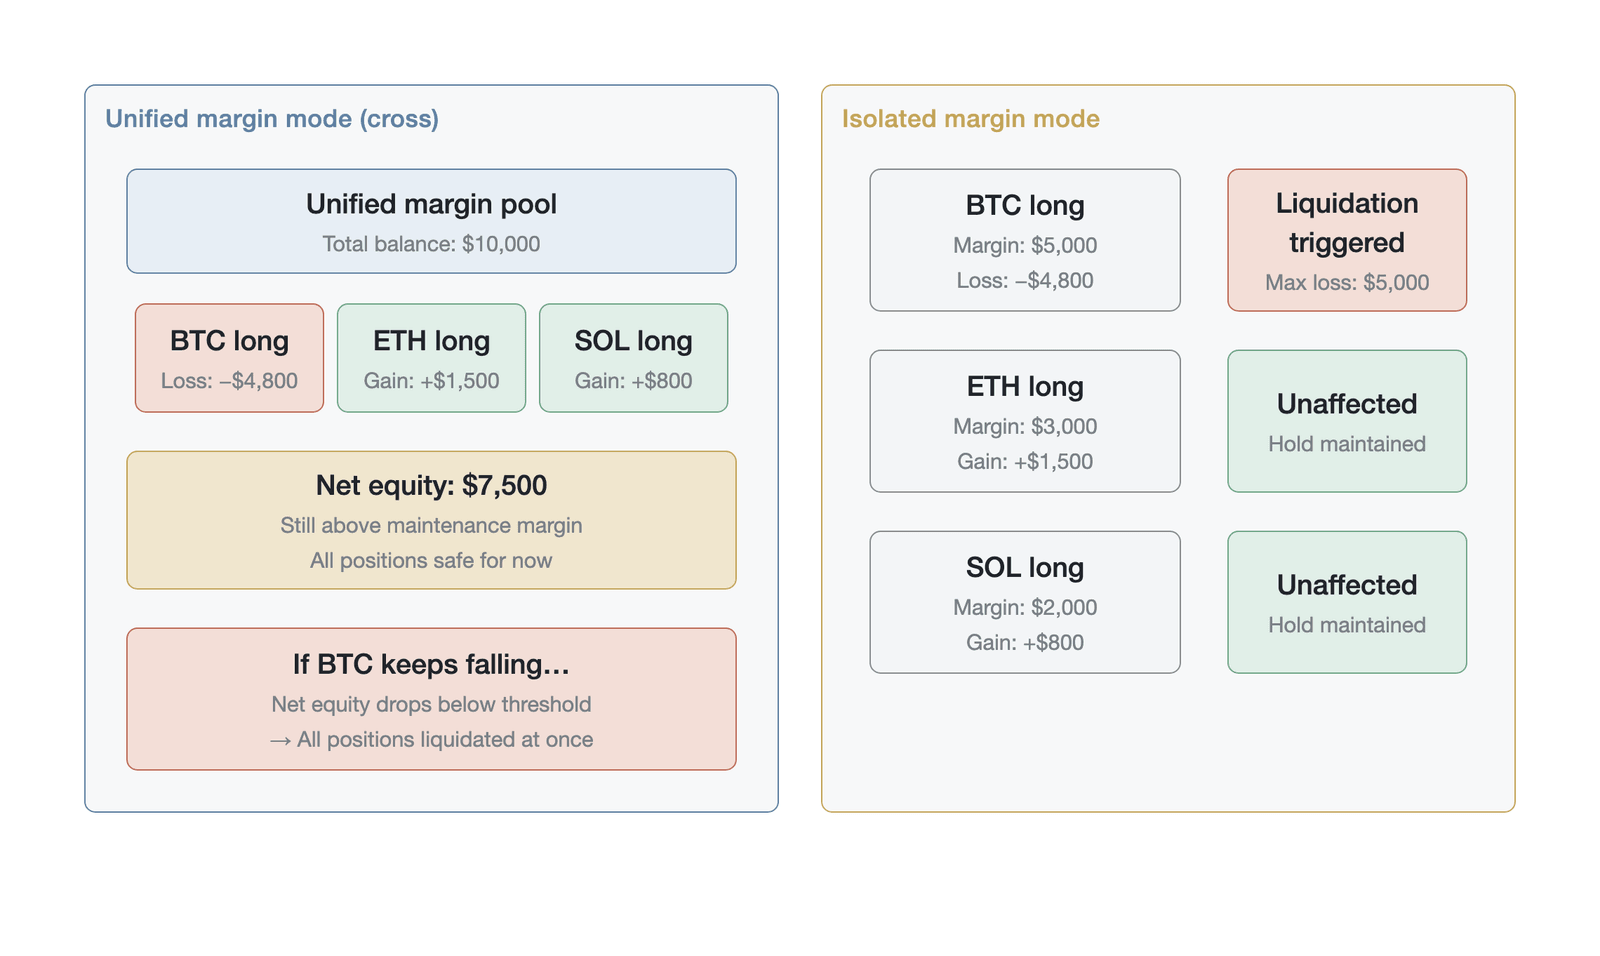
Figure 11-6. Comparison of isolated margin and unified margin under extreme conditions (conceptual illustration, not empirical data)
As shown in Figure 11-6, under the isolated mode the liquidation of the BTC position does not affect the ETH and SOL positions, whereas under the unified mode a huge loss on BTC erodes the entire margin pool, and if net equity falls below the threshold, all positions face simultaneous liquidation. When the price of one asset in the account moves sharply and adversely, the large loss substantially reduces the net equity of the entire unified margin pool. Once total net equity falls below the total maintenance margin requirement, the system may be forced to liquidate healthy positions in the account that are themselves still profitable and entirely unrelated to the loss-making asset. This cross-asset contagion mechanism was on full display in the "10.10 event."
The most representative contagion path in the "10.10 event" came from the synthetic stablecoin USDe. Many traders used USDe as margin collateral for their unified accounts—regarded as a reasonable choice in normal markets, since it was treated as a "stablecoin-like" asset. When the collateral value of USDe plunged, however, total account net equity shrank instantly, and unified margin transmitted the discount on this single collateral asset directly into the forced liquidation of a large number of BTC and ETH longs that had nothing to do with USDe [3]. A seemingly isolated stablecoin-pricing problem thus evolved into a liquidation cascade that engulfed the entire market (the full dissection of USDe's depegging to $0.65 on Binance during the "10.10 event"—a discount of about 35%—is given in Section 11.9.3).
Viewed from a network perspective, the unified margin pool is merely one of several contagion channels operating simultaneously. Other key contagion channels include: shared market makers withdrawing liquidity from all trading venues simultaneously once they detect adverse order flow, causing synchronized depth droughts across platforms; the cross-exchange linkage of oracle prices, which transmits a price shock on one exchange to the liquidation decisions of other exchanges via the mark-price mechanism; common collateral assets (such as USDe and USDT) being used simultaneously in the margin pools of multiple protocols, so that a discount on a single asset spreads through the collateral value chain to all protocols using that asset; and the transmission of operational risk—for example, a brief failure in one oracle's price feed for a given asset, or the temporary freeze of a cross-chain bridge, can affect all positions in a unified margin account that depend on that infrastructure. As Acemoglu, Ozdaglar, and Tahbaz-Salehi (2015) [5] argue in the theory of financial networks, network structure determines whether a shock is absorbed and buffered by the connections between nodes or amplified and propagated. When connection density exceeds a critical threshold, the network turns from a stabilizer that "disperses risk" into an amplifier that "propagates risk." In the "10.10 event," the simultaneous activation of these multiple contagion channels produced a superadditive amplification effect: the scale of liquidation and the depth of the collapse actually observed far exceeded the sum of the independent predictions for any single channel, indicating a nonlinear coupling in which the channels reinforced one another.
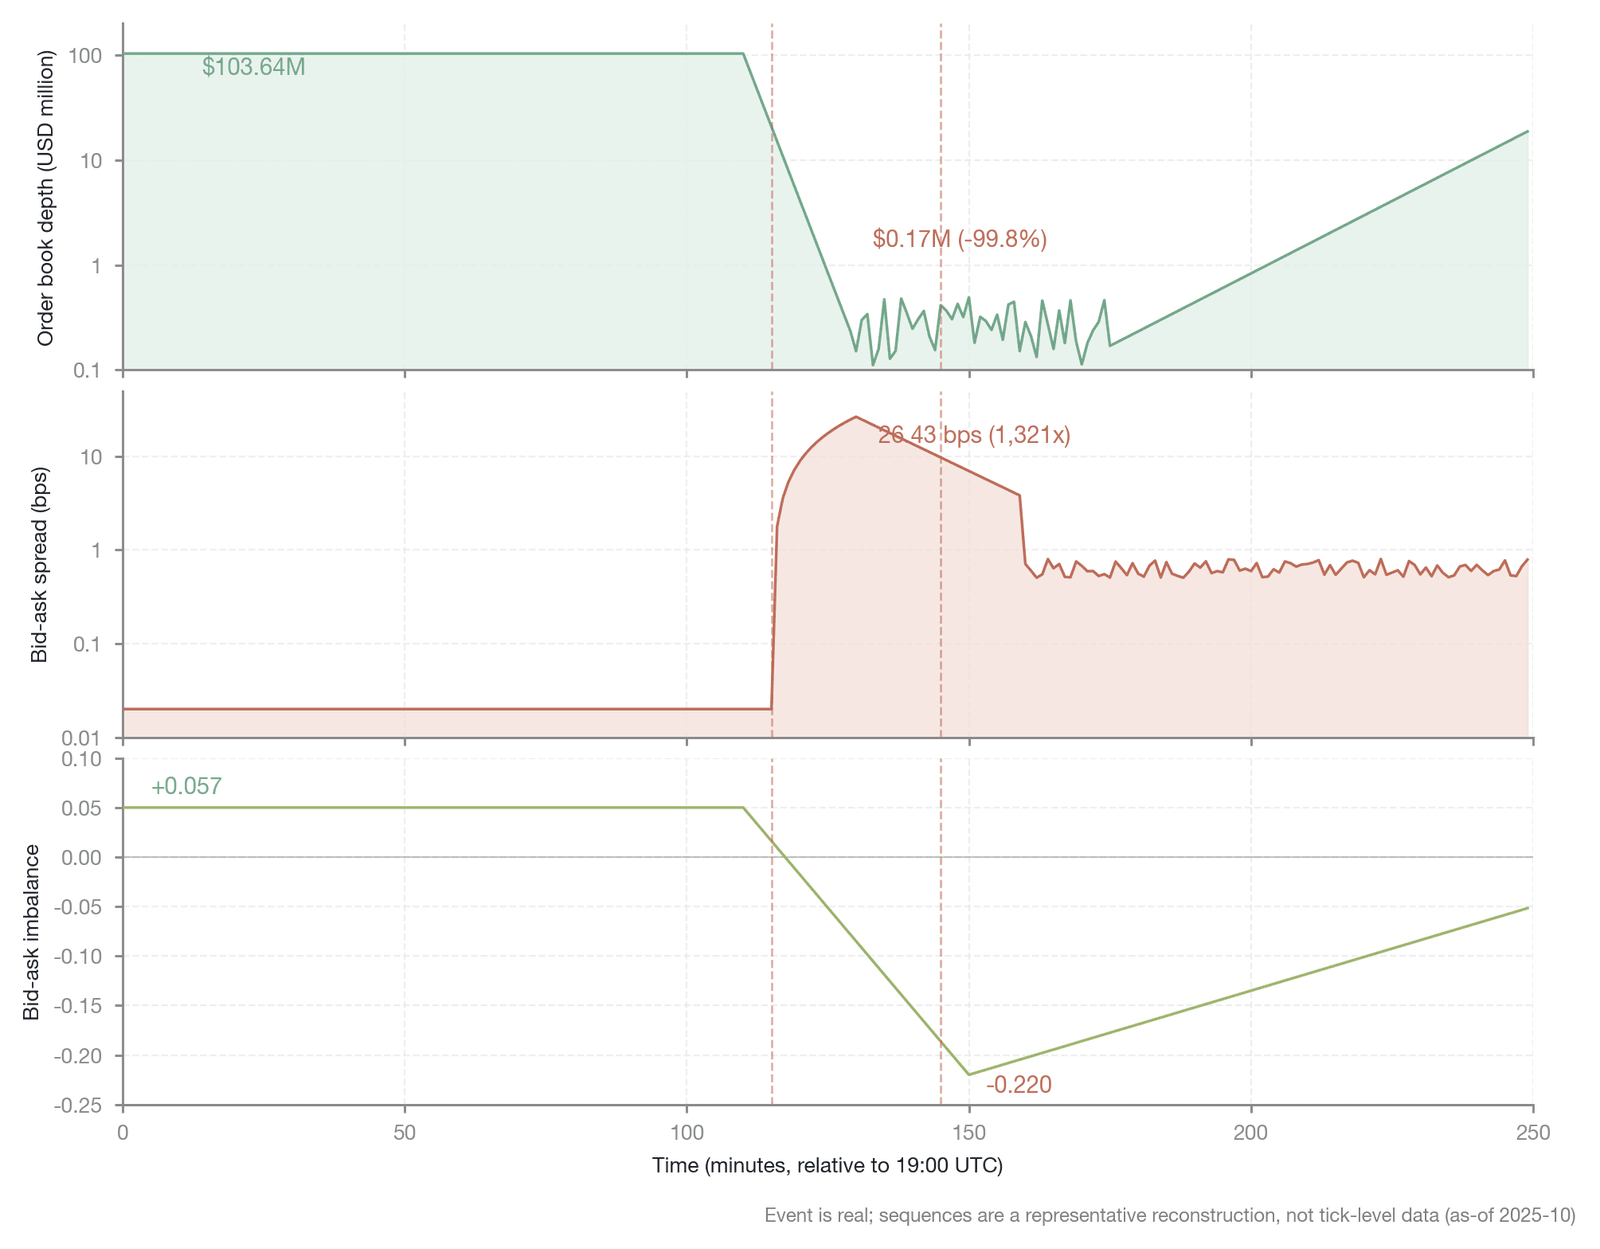
Figure 11-7. The three-dimensional collapse of liquidity during the "10.10 event" (Data source: Amberdata [2], as of October 2025; depth of about $103.6 million → $170,000 and a peak spread of 26.43 basis points are Amberdata's measured top-of-book values for BTC perpetual futures, while the three-dimensional point-by-point series is a representative reconstruction)
The essence of this procyclicality is that unified margin is a fair-weather friend: it improves capital efficiency in calm markets but turns into a dangerous liability in extreme ones. The fundamental reason is that in a true crisis the correlations among crypto assets tend to spike toward 1. As the preliminary discussion of cross-margin procyclicality in Chapter 7 (the endogenous tendency of the unified margin system to amplify risk contagion rather than provide diversification during market downturns) points out, the probability that "all positions lose money at the same time" is far higher than typical risk models assume. As shown in Figure 11-7 (the red shaded region marks the 40-minute window of the cascade's eruption), liquidity underwent a three-dimensional collapse during the "10.10 event" (see Section 11.9.2, Table 11-7 for the specific figures): order-book depth contracted by more than 99% (here depth refers to the aggregate visible limit-order depth within ±2% of the mid-price on major exchanges, with data from Amberdata, excluding iceberg orders and the dynamically refreshed liquidity of algorithmic market makers), bid-ask spreads widened by three orders of magnitude, and the buy-sell imbalance swung sharply toward overwhelming selling. This depth evaporation, spread spike, and buy-sell imbalance are the direct expression, at the order-book microstructure level, of cross-asset contagion. When all assets fall at once, all margin shrinks at once, and all liquidations trigger at once, the unified margin mode not only fails to provide a buffer but becomes a conduit for risk contagion.
The choice of margin mode therefore constitutes a deep design dilemma: the isolated mode sacrifices efficiency for safety, while the unified mode sacrifices safety for efficiency. Under competitive pressure, exchanges tend to promote unified margin to attract professional traders who seek capital efficiency, but this simultaneously plants a larger procyclical risk at the system level. This dilemma receives a deeper theoretical treatment in the "impossible trinity of liquidation design" in Section 11.6.
11.1.5 Differences in cascades across market architectures
Although the underlying dynamic logic of the liquidation cascade is the same in all leveraged markets, the fundamental differences in market architecture between centralized and decentralized exchanges cause the manifestation, propagation speed, and destruction pattern of the cascade to display marked structural divergences.
In the CEX environment, the liquidation engine runs on the exchange's internal matching servers, with execution latency typically on the order of microseconds to milliseconds. CEX order-book depth is maintained continuously by professional market makers through high-frequency API connections, and liquidity supply is relatively ample in normal times. This centralized architecture, however, also means that all liquidation decisions and execution are concentrated in a single entity. When extreme conditions overload the matching engine (as in the March 2020 BitMEX event), the queuing delay in liquidation processing makes actual execution prices deviate far from trigger prices, and bankruptcy losses are sharply amplified. In addition, CEXs hold unilateral authority to adjust margin parameters and liquidation thresholds, and this centralized risk-control power can, in a crisis, act as a stabilizer (for example, by temporarily lowering the leverage ceiling) or become an additional source of uncertainty (for example, by suddenly adjusting collateral factors).
In the DEX environment, the transmission chain of liquidation is fundamentally constrained by the underlying blockchain architecture. The liquidation execution of on-chain DeFi lending protocols on Ethereum and similar chains (such as Aave and Compound) is limited by block confirmation time (typically 12 to 15 seconds), a delay that in the traditional sense constitutes a passive "speed bump." The order-book DEXs at the center of this chapter, however, are not subject to this limitation: dYdX v4 runs on a Cosmos application chain with sub-second block times, and Hyperliquid's block latency is only about 200 milliseconds. Nonetheless, the transparency of the blockchain introduces an additional risk dimension that does not exist on CEXs: the visibility of liquidation transactions in the mempool makes them a target for MEV (see the discussion of MEV and liquidation sniping in Chapter 6). A sandwich attacker can insert a front-running transaction before a liquidation transaction is confirmed, artificially widening the price slippage and thereby aggravating liquidation losses. In periods of extreme congestion, a sharp spike in gas fees further compresses the profit margin of liquidation bots, which can leave small liquidations unexecuted and let them accumulate into a larger systemic risk. The market architecture of DEX perpetual futures is not homogeneous; it comes in at least three distinct types whose liquidation dynamics differ markedly. The first type is the application-chain order-book DEX, exemplified by dYdX v4, which runs on a dedicated Cosmos application chain with block times down to the sub-second level; the execution characteristics of its liquidation engine are relatively close to those of a CEX, though it is still constrained by the blockchain's inherent finality delay and validators' ordering power. The second type is the self-built-L1 order-book DEX, exemplified by Hyperliquid, whose block latency is about 200 milliseconds and whose execution characteristics have in practice approached CEX levels; Hyperliquid's sequencer architecture, however, is highly centralized, and its classification as a "decentralized exchange" is disputed within the industry. The third type is DEX perpetual futures based on an automated market maker or oracle quotes (such as GMX and Perpetual Protocol); these protocols genuinely lack the discrete depth structure of a traditional order book, their liquidity is distributed continuously along a price curve or an oracle price, and the price impact of a large liquidation order follows a mathematical function different from the order-book model, typically exhibiting smoother but larger total slippage. Both dYdX and Hyperliquid, the focus of this chapter, belong to the first two order-book architectures, whose cascade dynamics are structurally similar to a CEX rather than analogous to the third, automated market maker (AMM), model.
The differences between these two architectures produce distinct fragility patterns at the level of cascade dynamics. A CEX cascade tends toward a "concentrated-eruption" type, releasing a large amount of liquidation energy in an extremely short time (on the order of minutes), but it may also be abruptly cut off by the exchange's manual intervention. A DEX cascade tends toward a "diffuse-penetration" type, in which cross-protocol and cross-chain liquidations propagate gradually through oracle price updates and the delays of cross-chain bridges, with a longer time span (tens of minutes to hours) but more complex and harder-to-trace contagion paths. In the "10.10 event" of 2025, the liquidations between CEXs and on-chain DeFi were not a simple sequential process but formed a concurrent, two-way feedback loop: a price decline on CEXs triggered oracle price updates (whose delay depends on Chainlink's heartbeat interval or Pyth's push frequency), the updated oracle prices drove liquidations in DeFi lending protocols and on-chain perpetual futures, and the selling pressure from on-chain liquidations was transmitted back to the CEX spot market via arbitrageurs, further depressing CEX prices and in turn triggering a new round of oracle updates and on-chain liquidations. This CEX–DeFi two-way feedback loop ran concurrently during the event, and the oracle-update delay acted as a "clock" regulating the speed of the feedback: Chainlink's heartbeat interval and deviation threshold on Ethereum determined the lag in DeFi liquidations' response to CEX price moves, a lag that both prevented, to some degree, the instantaneous transmission of shocks and led to a temporal dispersion of liquidations, so that on-chain aftershocks persisted for hours after the main CEX shock had ended.
We have now fully dissected the micro transmission chain from a price move to forced liquidation: the margin system defines the boundaries of leverage and the measure of fragility, the mark price constructs the "truth" benchmark that triggers liquidation, the liquidation engine executes forced closure in a deterministic manner, and the margin mode determines the path along which risk is transmitted within the account and across assets. Each link in this chain is a carefully designed risk-management tool in normal markets; but when they are activated simultaneously and coupled with one another in extreme conditions, they jointly weave a precise network that converts individual risk into systemic risk. This calls for the two-layer theoretical framework of reflexivity, which provides both a philosophical and an economic lens for understanding how this network generates self-reinforcing positive feedback.
11.2 The theoretical foundations of reflexivity
Before we can understand the endogenous reflexivity of leverage and liquidation in crypto-asset markets, it is worth tracing its theoretical roots. Most traditional financial theory rests on the efficient market hypothesis (EMH) and the rational-agent assumption, holding that prices passively reflect fundamental information and tend toward some equilibrium. In the highly leveraged and automated crypto derivatives market, however, price movements often no longer merely reflect fundamentals but become the core force driving changes in those fundamentals (such as liquidity and participants' capital), which in turn feed back on prices themselves. This dynamic process is precisely the essence that the theory of reflexivity reveals. This section starts from George Soros's philosophical epistemology and, combining it with the microstructure model of Markus Brunnermeier and Lasse Heje Pedersen, builds a two-layer theoretical framework for understanding liquidation cascades in crypto markets.
11.2.1 Soros's theory of reflexivity
George Soros first systematically advanced the theory of reflexivity in The Alchemy of Finance [6]. Unlike traditional economics, which assumes that supply and demand curves are independent and jointly determine price, Soros held that in social systems involving thinking participants there is a two-way feedback mechanism between participants' perceptions and the actual state of affairs. Soros decomposed this feedback mechanism into two basic functions: the cognitive function and the participating function. In the cognitive function, participants try to understand their environment, and information flows from the world to thought; in the participating function, participants act on their understanding in an attempt to change the environment, and information flows from thought to the world [7].
In the traditional equilibrium framework, these two functions are treated as independent: price merely reflects reality passively. Under the reflexivity framework, however, the two functions are intertwined and mutually causal. When the market price changes (reality changes), it affects traders' risk perception and sentiment through the cognitive function (perception changes); traders adjust their positions on the basis of the new perception (for example, by actively selling or adding margin), and this behavior is converted, through the participating function, into actual buying and selling pressure in the market (action changes reality); these trades in turn push the price further in some direction, closing the loop.
In perpetual futures markets, this reflexivity framework can be formalized as a set of coupled difference equations. Let denote the market's collective cognitive state at time (which can be operationalized as an observable variable such as a market sentiment index, the funding rate, or the long-short ratio), the asset price, and the liquidation order flow at time . The cognitive function maps price changes into perception updates:
where denotes the strength of price changes' influence on perception (in crypto markets, given the immediacy of information diffusion, is markedly higher than in traditional markets), and is an exogenous information shock. The participating function maps the cognitive state into price changes, but in perpetual futures markets it must incorporate the mechanical, forced execution of the liquidation engine:
where denotes the influence on price of perception-driven voluntary trading, is the market-impact coefficient of the participating function, and is the mechanical price impact of the liquidation engine—a rigid participating function specific to crypto markets that does not exist in the traditional Soros framework. A note on dimensional conventions: in this equation and are price levels (in dollars), so and here carry price dimensions (dollars). They describe the same impact mechanism as the identically named dimensionless coefficients and that act on the dimensionless log return in Section 11.3.3, and they merely adopt different scalings because the dependent variable is defined differently (price level versus log return); the two should not be equated numerically. When the system is in a steady state (, ), the two equations converge to equilibrium; when a price decline triggers liquidation (), the liquidation impact depresses the price further, the price decline in turn updates perception and triggers more liquidations, and the coupling of the two equations drives the system along a divergent path.
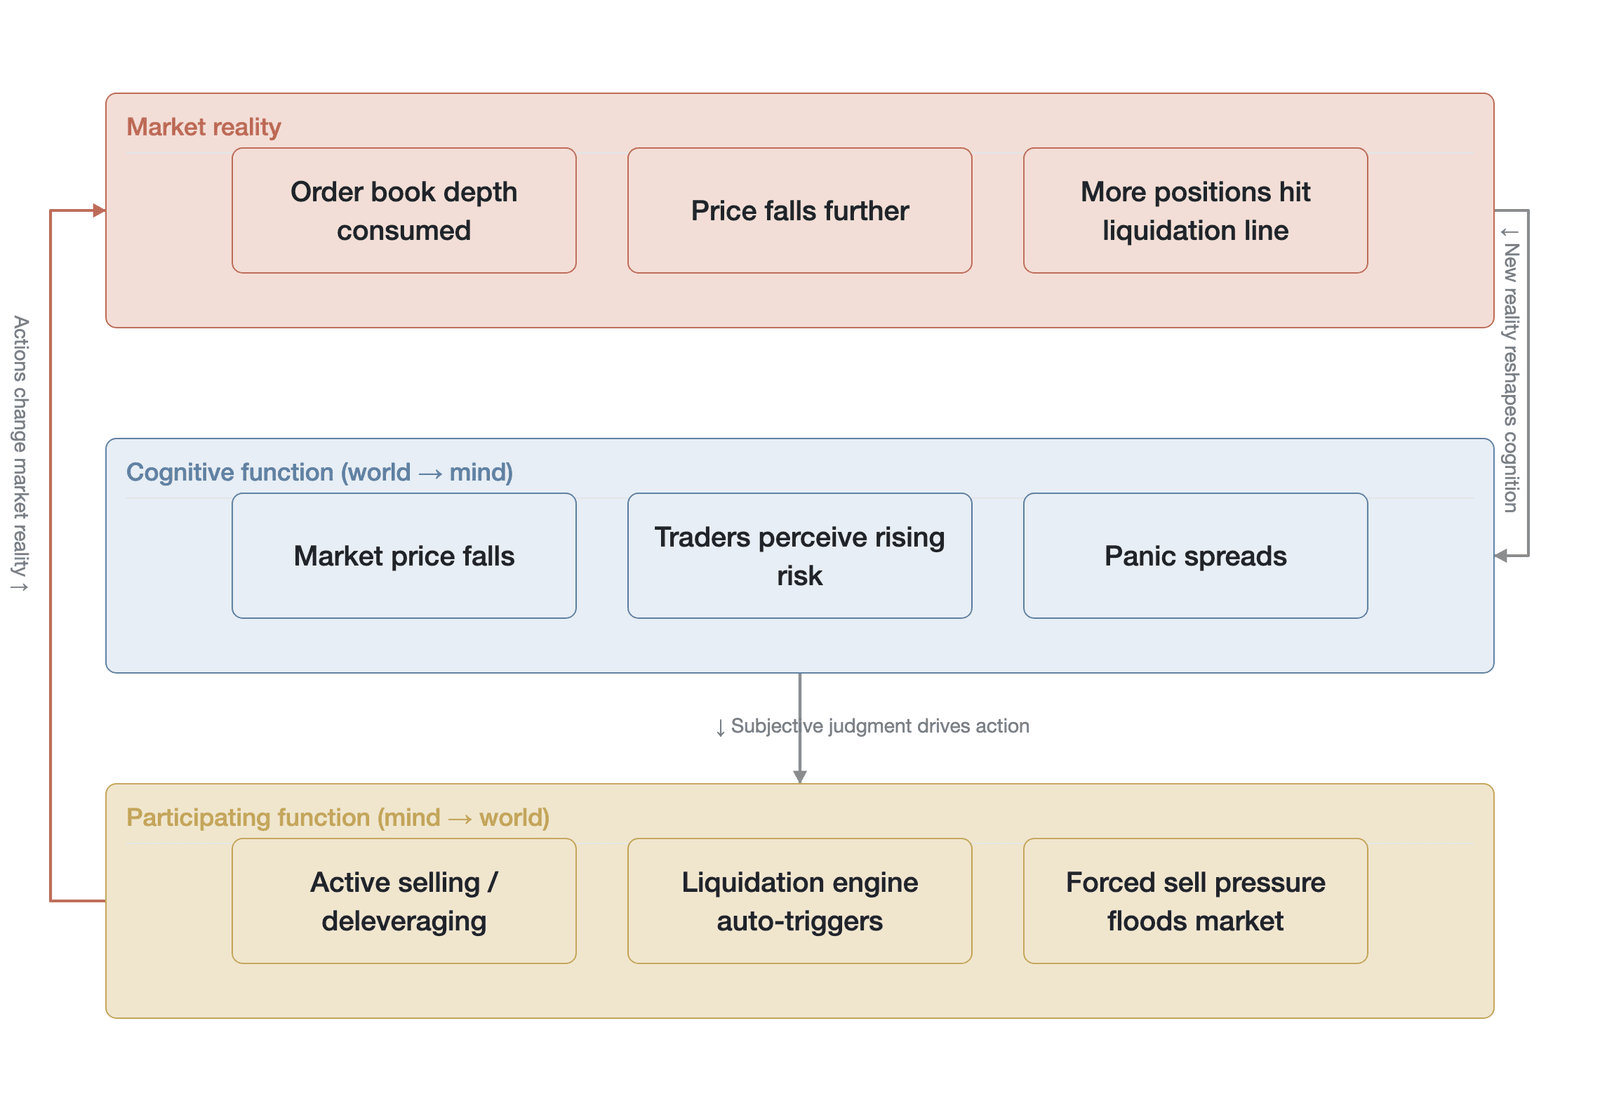
Figure 11-8. The reflexivity feedback loop of leverage and liquidation (based on the Soros framework)
As shown in Figure 11-8, in the crypto derivatives market this reflexivity is greatly amplified by the automated liquidation engine. Acting as a hard-coded "participating function," the liquidation engine forcibly converts under-collateralized positions into market orders, directly consuming order-book depth and depressing the price, shaping a harsher market reality and pushing the system away from equilibrium into a self-reinforcing divergent state. The core difference the figure reveals is this: the "participating function" of a traditional market must be mediated by human judgment (assessing risk, deciding to cut positions, choosing timing), and these steps introduce time delays and behavioral heterogeneity that constitute a natural damping of positive feedback; in crypto markets, by contrast, the participating function is hard-coded directly into the smart-contract logic of the liquidation engine, and its execution is deterministic, instantaneous, and unconditional, with no buffer space for human intervention. This positive-feedback loop therefore has no natural attenuation mechanism, and each cycle may release greater selling pressure than the last, so that the system, absent external intervention, keeps evolving toward divergence.
11.2.2 The liquidity spiral model
If Soros's theory of reflexivity provides a macro philosophical framework, the model of Brunnermeier and Pedersen lays bare the mutually reinforcing relationship between an asset's market liquidity (how easily the asset can be converted to cash) and a trader's funding liquidity (how easily the trader can obtain funds) [8]. They show that when an external shock hits, these two forms of liquidity form a vicious circle through two mechanisms: the loss spiral and the margin spiral.
The loss spiral describes an equity effect. When an asset's price falls, leveraged traders holding a long position in it suffer a loss of equity. To maintain a given leverage ratio or meet regulatory requirements, they are forced to sell part of the asset. This selling impacts the market price and drives the price down further, triggering fresh equity losses and another round of selling. Consider a concrete transmission process: when a long trader using 10x leverage holds a $100,000 BTC position, a 5% price decline shrinks their $10,000 of equity to $5,000, and their actual leverage jumps from 10x to 20x; to restore leverage to its target level, the trader must sell about $50,000 of the position, and this forced sale itself exerts downward pressure on the market price, subjecting other leveraged traders to the same predicament.
The margin spiral describes a collateral-constraint effect. When a price decline is accompanied by rising volatility, funding providers (such as brokers and exchanges) raise margin requirements to control risk. This means the trader's existing collateral can borrow less than before. To make up the funding gap, the trader must sell more assets, which not only depresses the price further but may also trigger greater volatility, leading margin requirements to be raised again. In crypto markets this mechanism is especially aggressive: during high-volatility periods, exchanges dynamically raise maintenance margin rates or lower collateral factors, and such adjustments often affect a large number of accounts simultaneously within a very short time, creating collective forced-deleveraging pressure driven by the change in risk-control rules itself.
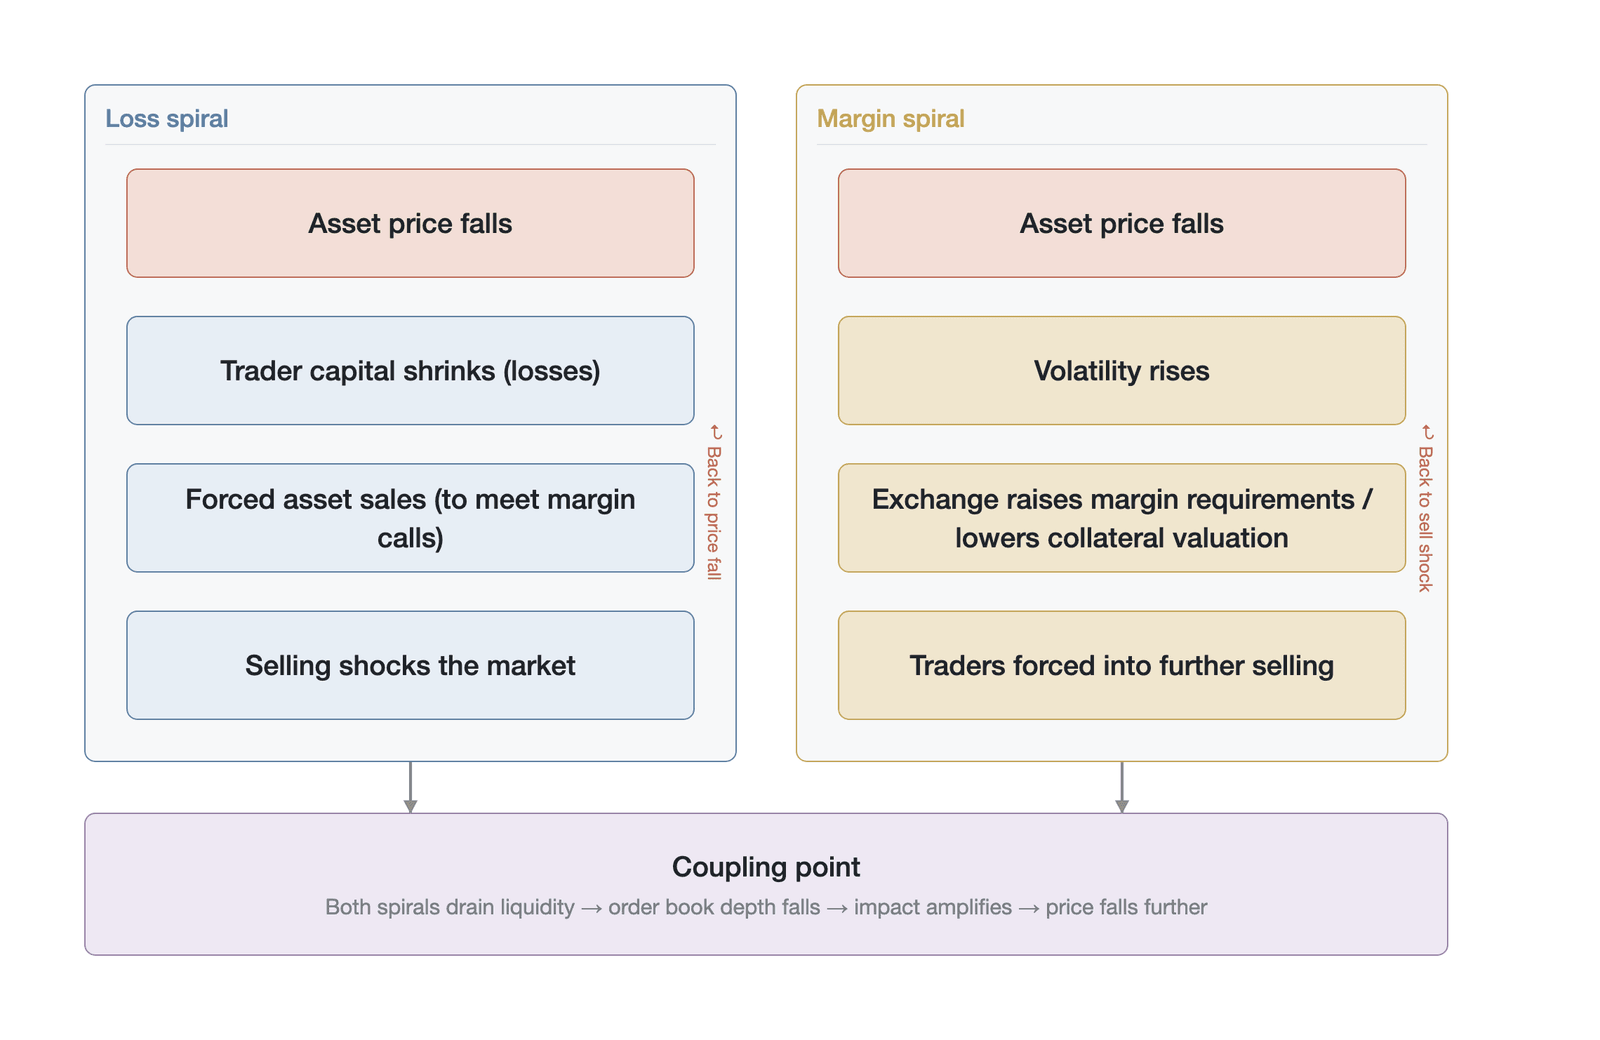
Figure 11-9. The coupling mechanism of the loss spiral and the margin spiral
As shown in Figure 11-9, these two spirals often occur simultaneously and couple with each other during a crisis: a price decline both directly cuts capital (the loss spiral) and raises margin requirements by pushing volatility higher (the margin spiral), and together they generate enormous forced-selling pressure that rapidly consumes order-book depth. The model of Brunnermeier and Pedersen proves mathematically that, under certain conditions, the margin mechanism itself is a source of market instability. The key is this: margin adjustments in traditional markets settle daily and involve manual review, so the two spirals often unfold sequentially and can be separated in time, providing a window for identification and intervention; in crypto markets, margin is computed in real time, so the two are activated synchronously on the same time scale and amplify each other. The mathematical consequence of this synchrony is that the joint effect is not additive but multiplicative—the selling pressure produced by the loss spiral lowers market liquidity, and lower liquidity makes each unit of selling in the margin spiral produce a more violent price impact, and vice versa.
11.2.3 The applicability to perpetual futures
Perpetual futures in crypto-asset markets constitute an extreme testing ground for the two-layer theory above. Compared with traditional financial markets, the crypto derivatives market pushes reflexivity to its limit through its mechanism design.
Table 11-2 compares the core differences in liquidation mechanisms between traditional finance and crypto perpetual futures:
| Dimension | Traditional finance (e.g., securities margin trading, traditional futures) | Crypto perpetual futures (e.g., Binance, Bybit) |
|---|---|---|
| Margin assessment | Brokers/clearinghouses settle daily (T+0 or T+1), with manual review | Smart contract/liquidation engine monitors in real time (millisecond level) |
| Grace period | A margin call is usually issued, allowing top-up within T+1 to T+3 | Zero grace period; forced closure the instant the maintenance margin line is touched |
| Liquidation execution | Traders close manually or brokers execute in batches, considering market impact | The engine takes over automatically, typically dumping to market via market orders or better-than-market limit orders |
| Lender of last resort | The central bank can inject liquidity through the discount window, breaking the spiral | No lender of last resort; reliance only on a limited insurance fund or auto-deleveraging |
| Spiral evolution speed | Days to weeks (e.g., the 1998 LTCM crisis, the 2008 subprime crisis) | Seconds to minutes (e.g., 3.12 in 2020, 5.19 in 2021, 10.10 in 2025) |
Table 11-2. Comparison of liquidation mechanisms between traditional finance and crypto perpetual futures (Data source: compiled by the author)
Notably, the table summarizes the spiral-evolution speed of traditional finance as "days to weeks," which applies mainly to the traditional deleveraging process that relies on human decision-making and daily settlement; when traditional markets likewise introduce highly automated execution, the phenomenon of time compression is not unique to crypto. The U.S. stock market "flash crash" of May 6, 2010, is a case in point: the Dow Jones Industrial Average plunged nearly 1,000 points (about 9%) in roughly 36 minutes and then rebounded over roughly the same span, and its underlying dynamics are highly isomorphic with a crypto liquidation cascade—automated algorithmic execution replacing human judgment, liquidity providers systematically withdrawing quotes as volatility intensified, and positive feedback forming between selling pressure and the liquidity vacuum. The exchange-traded fund (ETF) flash crash of August 24, 2015, further confirmed this pattern, when the prices of hundreds of ETFs deviated from net asset value by 20% to 30% within minutes of the open. The key difference, however, lies in the interruption mechanism: the limit up-limit down (LULD) rule introduced in the United States after the 2010 flash crash, together with earlier circuit-breaker rules such as Rule 48, can halt trading and forcibly break the spiral when a price deviates beyond a threshold, and this external "time wedge" provides a window for liquidity to recover and information to be digested; the crypto perpetual futures market, to this day, lacks any equivalent market-wide circuit breaker, trading proceeds around the clock, the liquidation engine runs continuously, and once positive feedback begins there is no external force to arrest it.
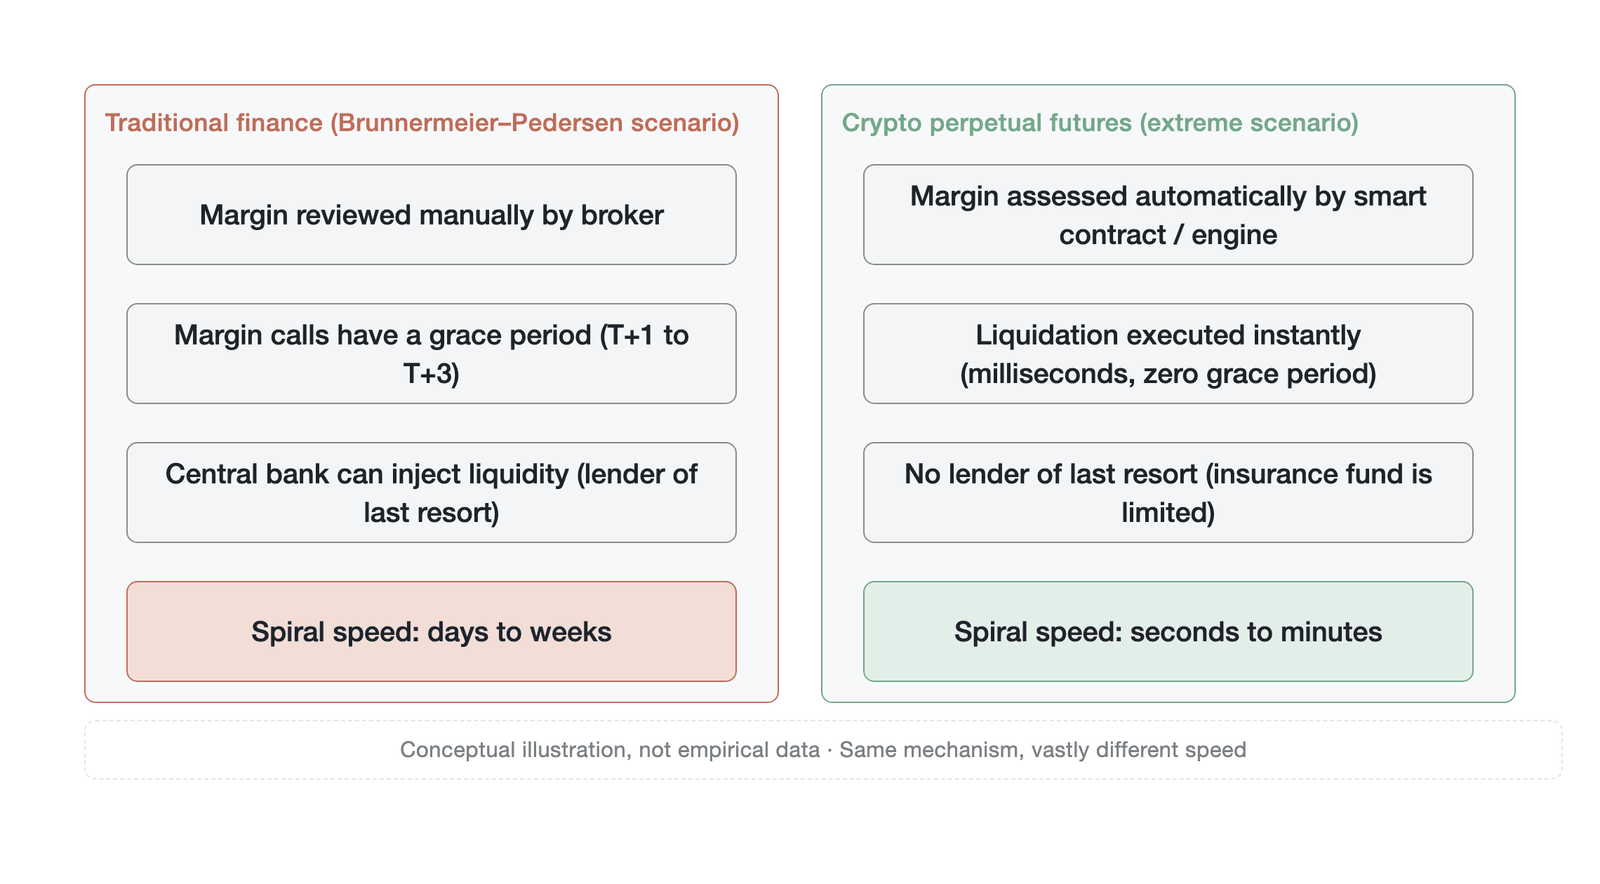
Figure 11-10. Comparison of spiral speed between traditional finance and crypto perpetual futures (conceptual illustration, not empirical data)
As Table 11-2 and Figure 11-10 show, in crypto markets the "loss spiral" and "margin spiral" of the Brunnermeier-Pedersen model are compressed to the millisecond level. Without the buffer of human intervention or the backstop of a lender of last resort, the feedback loop between price declines and liquidation selling has no damping at all. This homogenization and automation of the mechanism make the "participating function" Soros described entirely deterministic and mechanical. When the market is in a highly leveraged state, a tiny price disturbance can topple the first domino and evolve into a systemic liquidation cascade.
Historical data clearly confirm this. Figure 11-11 shows the ten largest liquidation events in crypto history, ranked by total 24-hour liquidations.
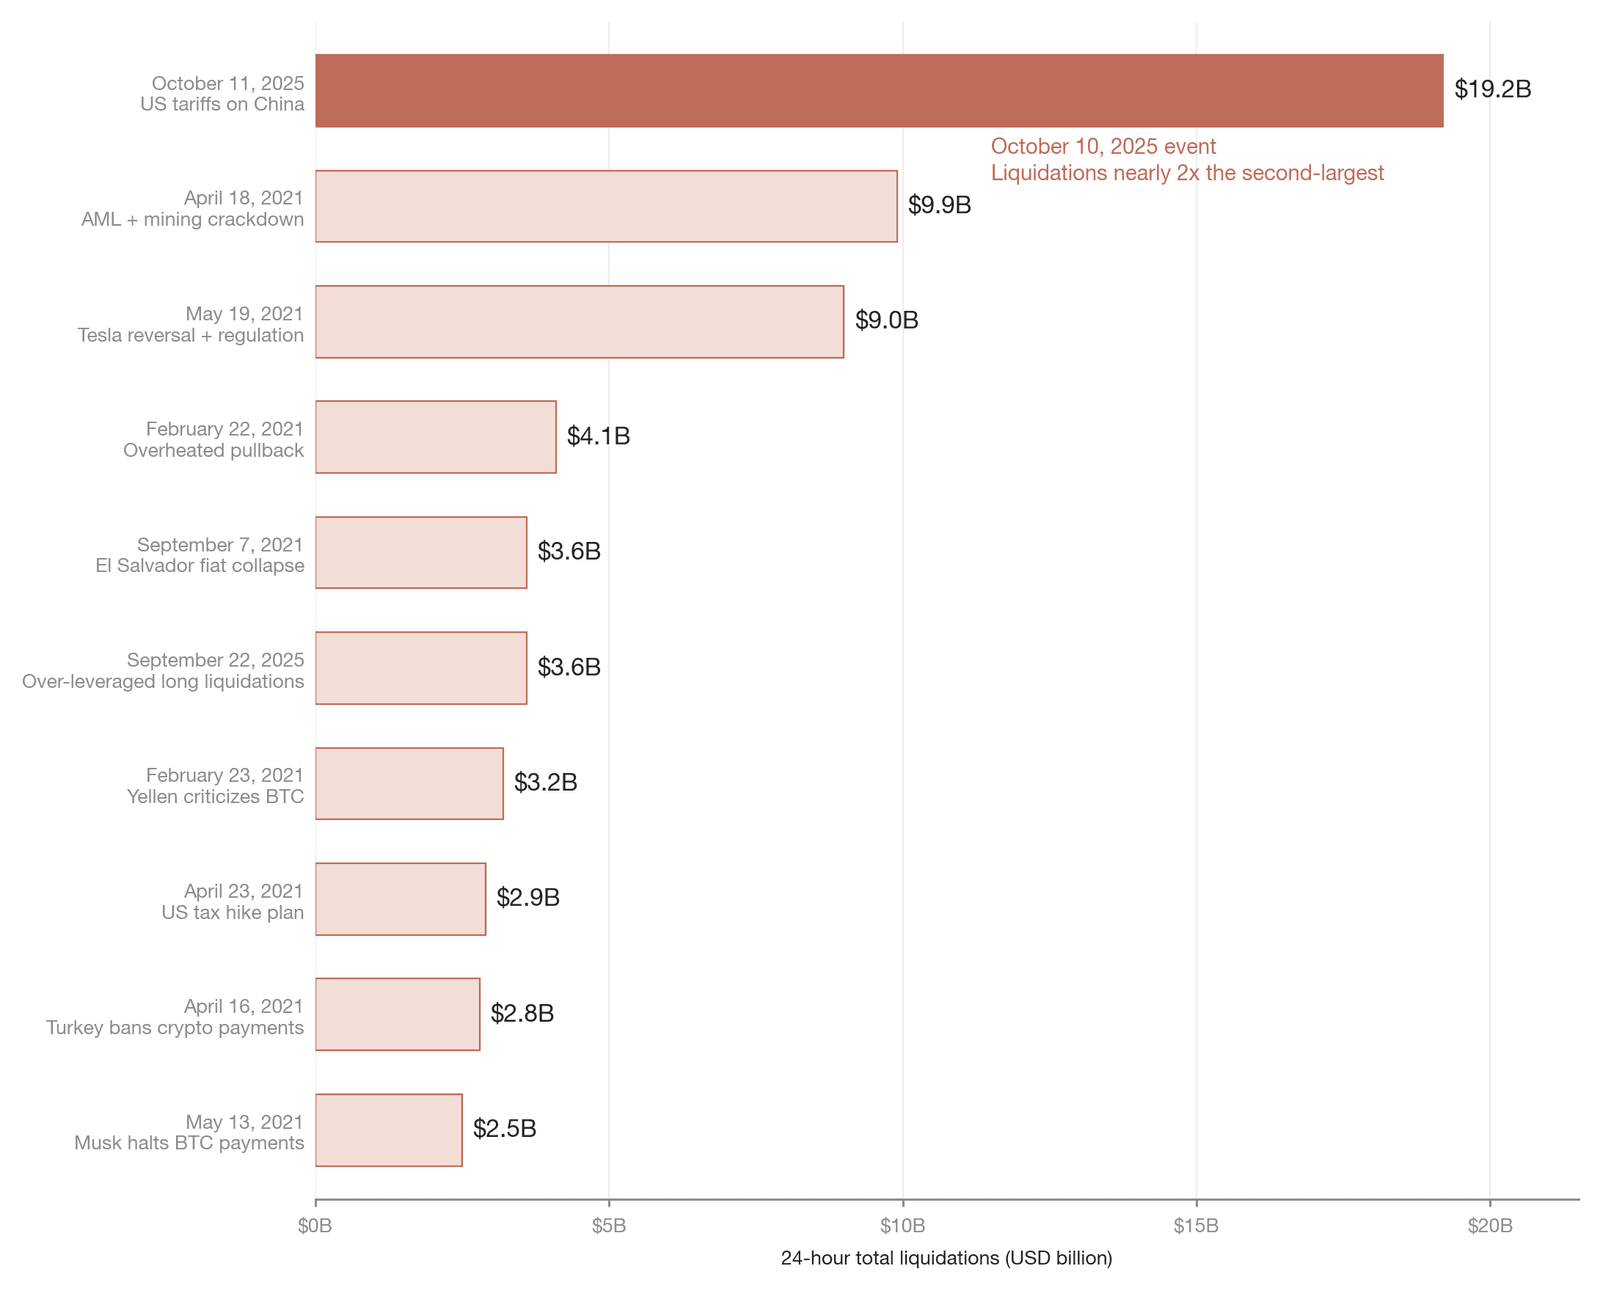
Figure 11-11. Major liquidation events in crypto history (Data source: CoinGlass [9], as of October 2025; the top 10 ranked by 24-hour liquidations; because of exchanges' API reporting caps, the CoinGlass basis historically underestimates and its absolute figures are conservative, so orders of magnitude should be emphasized)
As shown in Figure 11-11, the liquidation event of October 10–11, 2025, set a historical record, with total single-day liquidations of about $19.1 billion (on CoinGlass's exchange basis; constrained by a rate limit that pushes only one liquidation data point per second, this value is a lower bound, and the true notional scale may be higher), nearly double the second-ranked event (April 18, 2021) [9]. In this crash triggered by macro news, the microstructure signatures—Bitcoin's sharp plunge, more than 1.62 million accounts liquidated (about 87% of them long), order-book depth evaporating by more than 99% within minutes, and spreads widening by more than a thousandfold (see the chapter opening and Section 11.9.2 for data) [1]—are precisely the result of reflexivity being amplified to its extreme under the automated liquidation mechanism.
The endogenous reflexivity framework above describes the transmission mechanism of the liquidation cascade, but the system's baseline fragility is modulated to a great extent by macro liquidity conditions. The high open interest and extreme funding rates that constitute the cascade's "fuel" tend to accumulate preferentially in a risk-on macro environment—periods of a weakening dollar index, an accommodative Federal Reserve monetary policy, and narrowing global credit spreads. In such easing cycles, abundant external liquidity not only fuels the swelling of leverage demand but also temporarily sustains higher order-book depth by attracting incremental capital to make markets, thereby suppressing the triggering and propagation of cascades. Conversely, when the macro environment shifts from risk-on to risk-off (for example, a sudden spike in expectations of Fed tightening, or a geopolitical shock that triggers a global flight to safety), trigger sensitivity rises markedly, because the contraction of external liquidity simultaneously weakens market makers' risk-bearing capacity and arbitrageurs' capital supply. This means that in a macro-easing period, even when market microstructure indicators (such as the OI/market-cap ratio and the funding-rate level) have reached levels comparable to those of historical crash events, the cascades that actually occur tend to be fewer and milder; whereas in a period of macro tightening, even a lower degree of microstructure fragility can brew a severe cascade. A complete cascade-risk assessment model therefore cannot rely on endogenous market-structure indicators alone but must be calibrated conditional on macro state variables. The subsequent analysis in this chapter focuses on the endogenous transmission mechanism, but readers should remain aware throughout of this implicit premise of macro conditionality.
11.3 The liquidation reflexivity equation
The liquidation cascade is not an accidental event. Under specific market microstructure conditions, the occurrence of a cascade is a mathematical inevitability. This section formalizes the positive-feedback process of liquidation into a concise difference equation, revealing the critical condition that drives a cascade out of control.
11.3.1 Liquidation order flow
In market microstructure theory (e.g., Kyle, 1985 [10]), price changes are driven by order flow. Ordinary order flow is random and involves information asymmetry, and its direction is two-sided. Liquidation order flow, however, is a distinctive kind of passive order flow. Its direction is fully determined: when a price decline triggers long liquidations, the liquidation engine necessarily sends sell orders to the market; when a price rise triggers short liquidations, it necessarily sends buy orders. This one-sidedness means that liquidation orders cannot be hedged internally and must be absorbed entirely by market makers or contrarian traders. On top of this, they form a liquidity devourer that is extremely insensitive to price. The liquidation engine's primary task is to close positions as quickly as possible to avoid the systemic risk (socialized losses) caused by bankruptcy. It therefore typically uses market orders or limit orders with an extremely high slippage tolerance. This execution logic means that liquidation orders consume order-book liquidity regardless of cost and constitute a pure demander of liquidity.
11.3.2 The three-step mapping
We can decompose the liquidation-cascade process into three successive mapping steps. The trigger mapping describes how a price change drives the margin balance of some positions below the maintenance margin level and thereby triggers liquidation. Next comes the quantity mapping, in which the triggered positions are converted into actual liquidation order flow . Building on this, the impact mapping shows how the liquidation order flow hits the current order-book depth and produces a new price change .
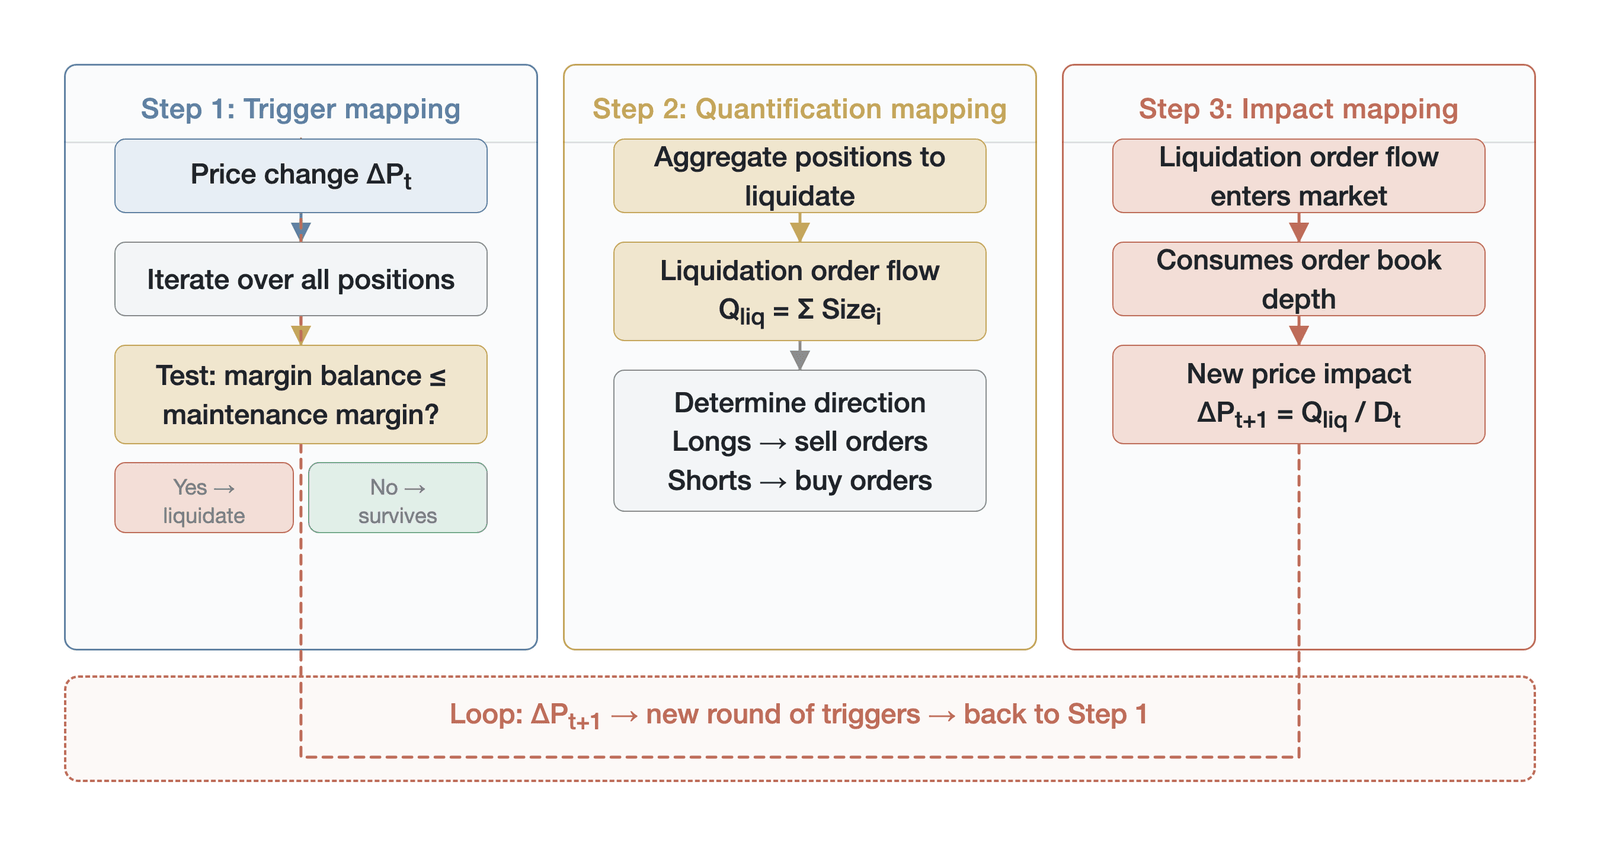
Figure 11-12. The three-step mapping from a price change to the next round's price change
As shown in Figure 11-12, if has the same direction as and is large enough to trigger new liquidations, this loop continues. The figure decomposes the loop into three mapping steps with clear economic meaning. The first step is the trigger mapping, whose core question is which positions' margin balances will fall below the maintenance margin line under a given price decline and thus be captured by the liquidation engine; the output of this step depends on the distribution density of leverage multiples and the degree of clustering of liquidation prices. The second step is the quantity mapping, which converts the triggered positions into actual market order flow, whose scale is determined jointly by the notional value of the liquidated positions and the liquidation engine's execution strategy. The third step is the impact mapping, which describes the actual effect these liquidation order flows have on the price once they enter the order book—an effect that depends not only on the absolute scale of the order flow but, more importantly, on the effective depth of the order book at the time. The loop arrow in the figure represents precisely the self-reinforcing nature of this process: the new price change produced in the third step constitutes the input to the first step of the next round, that is, the new trigger condition. As long as the price change output by each round is large enough to activate new liquidation positions, this three-step mapping keeps iterating.
11.3.3 The divergence condition
To formalize this process, we define the following variables. denotes the magnitude of the price change in round (taken as a dimensionless log return, which for small moves is approximately equal to a percentage). represents liquidation sensitivity, the proportion of leveraged positions that a unit price change can trigger for liquidation, which depends on the distribution density of leverage in the market. is the total scale of leveraged positions in the market (such as open interest; note that from this section onward refers specifically to the leverage stock/notional, distinct from the that denotes the liquidation price in Section 11.1.1, and the two must not be confused). is the price-impact coefficient. is the effective order-book depth in round . Here should be understood as the net effective depth after cross-exchange integration—that is, the system-level depth net of the friction costs arbitrageurs incur to move liquidity across platforms—rather than the order-book depth of a single exchange. During a cascade, because arbitrageurs cannot redistribute order flow across exchanges quickly enough, the system's overall effective depth is markedly smaller than the simple sum of the individual exchanges' order-book depths. To ensure the dimensionlessness of the feedback gain, the dimensions of the variables are stipulated as follows: is taken as a dimensionless log return; and are both measured in dollar notional; is defined as "the proportion of liquidatable notional triggered per unit log-price change, as a share of total notional" (with dimensions of 1/log return); and is the impact elasticity, "the log-price change produced per unit dimensionless order-flow/depth ratio" (dimensionless). On this basis, is measured in dollars, is dimensionless, and is a dimensionless quantity, so that comparison with the critical value of 1 is meaningful.
Based on the three-step mapping above, we can derive the liquidation volume in round , , as:
Once this liquidation volume enters the market, the new price impact it produces, , is:
Substituting the first equation into the second, we obtain the liquidation reflexivity equation:
Letting the feedback gain be , the equation simplifies to:
This concise difference equation reveals that the fate of the cascade depends entirely on the magnitude of the feedback gain . Under the convergence condition (), the new price impact produced in each round is smaller than the last, the system gradually absorbs the shock, and the price stabilizes after some fluctuation. Under the divergence condition (), the new price impact produced in each round is larger than the last, the shock is continually amplified, and the system enters an out-of-control cascade-collapse state until leverage is fully cleared ( falls sharply) or external liquidity intervenes ( rises sharply).
The reflexivity equation above with a constant , however, produces unbounded exponential divergence, which is physically unrealistic, since a price cannot fall below zero and the leverage pool is continually depleted as liquidation proceeds. A more complete model must endogenize : , where decreases with each round of liquidation, that is, . This correction transforms the system from a linear divergence process into a nonlinear difference equation: in the initial phase, because is still ample relative to , and the system exhibits divergence; but as liquidation continually consumes the leverage stock, declines round by round, eventually crossing the critical line and decaying into the convergence range. In other words, a liquidation cascade is essentially an initially divergent but conditionally self-terminating dynamic process. The recursion above characterizes only the decay of the numerator (the leverage stock), whereas the denominator also plunges endogenously during a cascade (see Section 11.3.4); only when the depletion rate of the leverage stock ultimately exceeds the deterioration rate of the effective depth does decline monotonically, cross 1, and self-terminate. If depth collapses very fast, may rise before it falls, and the system experiences a more violent overshoot before self-terminating. The total overshoot of the price depends on how many rounds of iteration the system passes through before crosses 1, and this number of iterations is determined jointly by the initial leverage concentration and the depth-to-liquidation-volume ratio. The larger the initial and the more concentrated the leverage distribution within a narrow price range, the more divergent iterations the system passes through before self-terminating, and the more severe the cumulative destruction. This self-termination mechanism connects directly to the systematic analysis of cascade-termination conditions in Section 11.5.4.
In addition, it should be noted that the linear price-impact model in the impact mapping above is itself a first-order approximation. The empirical market microstructure literature shows that the price impact of normal order flow follows a square-root law (Bouchaud et al., 2009), that is, price impact is proportional to the square root of order-flow size. But liquidation flow is not normal order flow: it is concentrated, one-sided, and price-insensitive, and it often penetrates multiple order-book price levels at once, so its actual impact may exhibit superlinear (convex) characteristics. This means that in a liquidation-dense range, the leverage density required to reach the divergence threshold may be lower than the linear model predicts, so the system's actual fragility is underestimated by the linear framework.
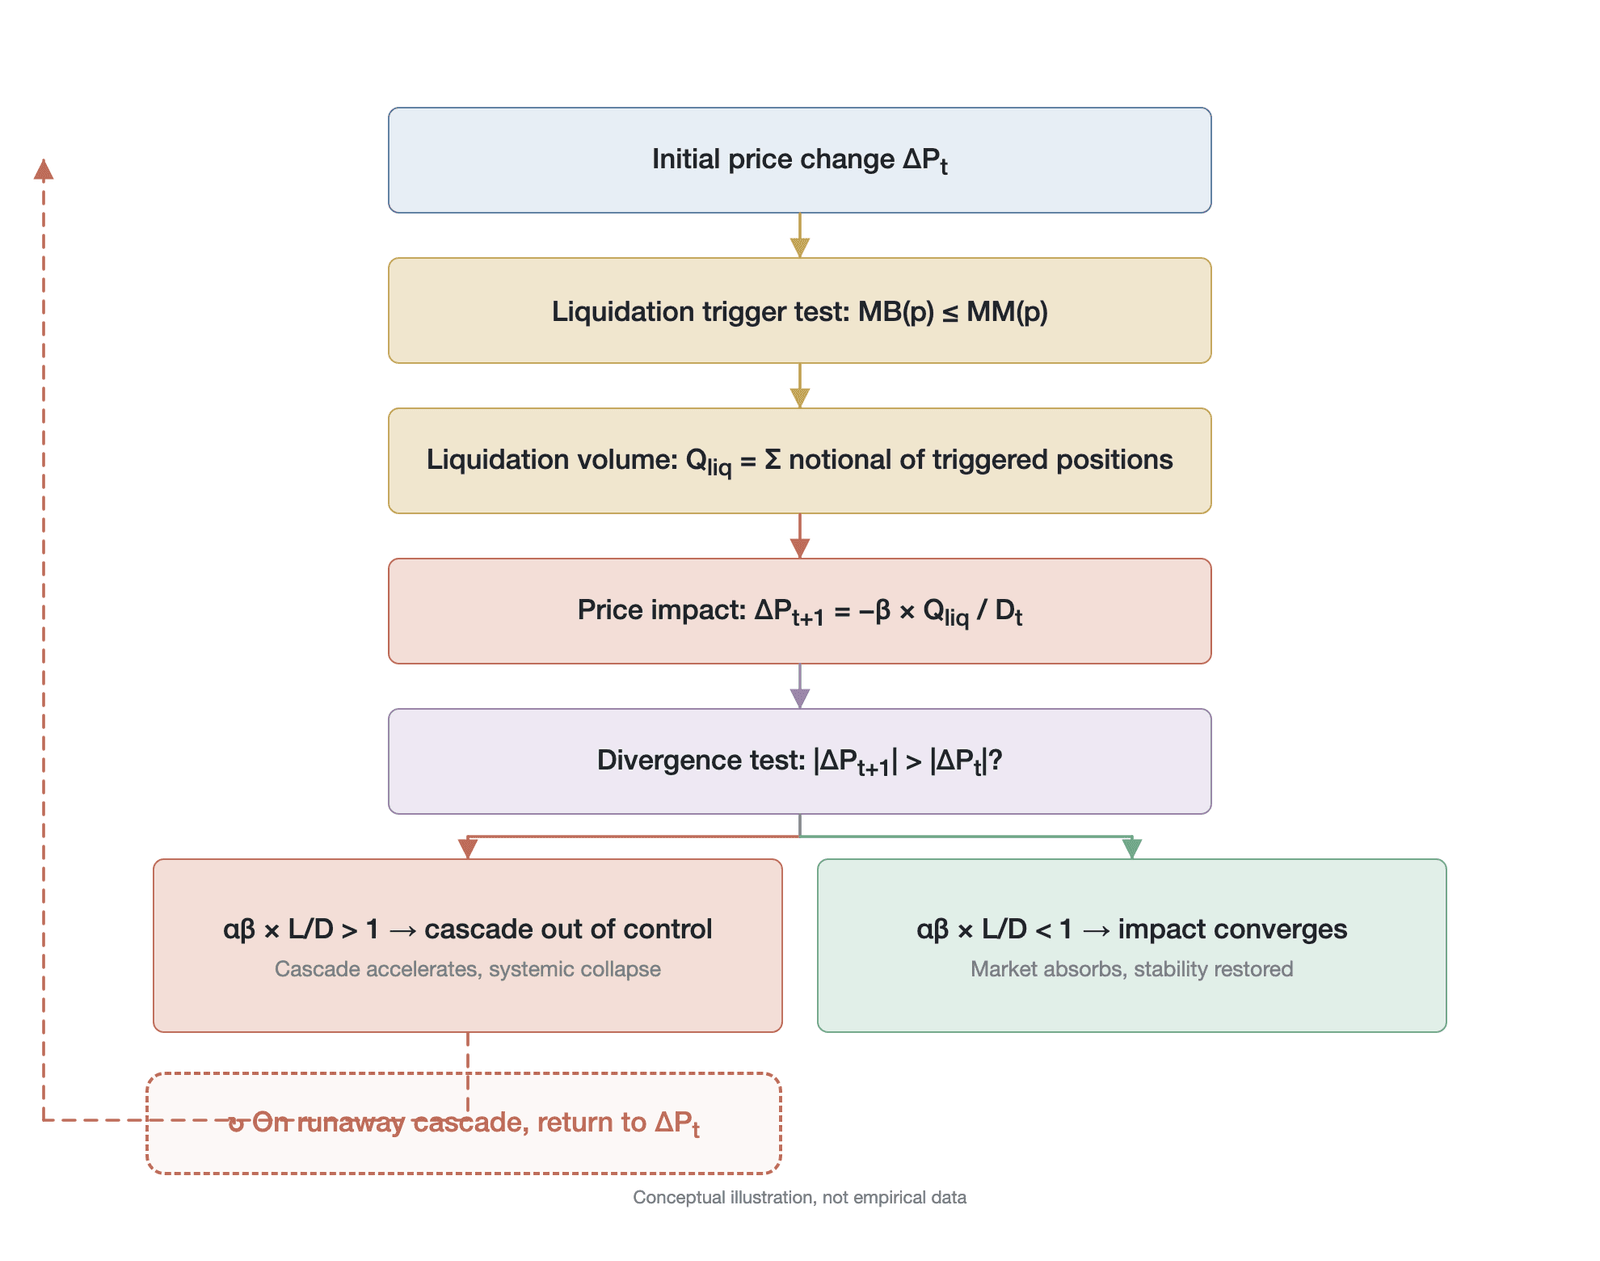
Figure 11-13. The positive-feedback loop and divergence condition of the reflexivity equation (conceptual illustration, not empirical data)
As shown in Figure 11-13, the figure's core is to reveal a key bifurcation structure: when , the price impact of each round of liquidation attenuates round by round, the initial disturbance is absorbed after a finite number of iterations, and the system behaves as a stable negative-feedback equilibrium; when , each round's shock is larger than the last, the price sequence diverges exponentially, and the system enters a self-reinforcing cascade-amplification path (irreversible by a small disturbance before leverage is cleared, but not never-terminating; see the conditional self-termination analysis in Section 11.3.3). Every component of is a function of market conditions: in a bull market the continual accumulation of leveraged positions increases and together, while rising volatility prompts market makers to withdraw liquidity and causes to contract sharply, so the same market can transition smoothly from the steady state to the divergence region as leverage accumulates and liquidity ebbs. This explains why a liquidation cascade always appears to erupt "suddenly" to an outside observer: the system may already have been operating on the edge of danger for a considerable time before crossing , but when is slightly below 1 it still displays apparent stability, and fragility is almost unobservable before the threshold is breached.
11.3.4 Three sources of nonlinearity
In real crypto markets, the variables in the liquidation reflexivity equation are not linear. The equation above assumes that liquidation sensitivity and order-book depth are constants, but this simplification is severely distorted in actual markets, because the threshold-clustering effect of liquidation prices, the high homogeneity of trader behavior, and the endogenous withdrawal of liquidity by market makers in times of crisis together create multiple discontinuities and positive-feedback acceleration mechanisms. It is precisely the following three sources of nonlinearity that give liquidation cascades their characteristic sudden eruption and highly destructive nature. The research of Danielsson, Shin, and Zigrand shows that the procyclicality of leverage is itself a core driver of endogenous risk [11].
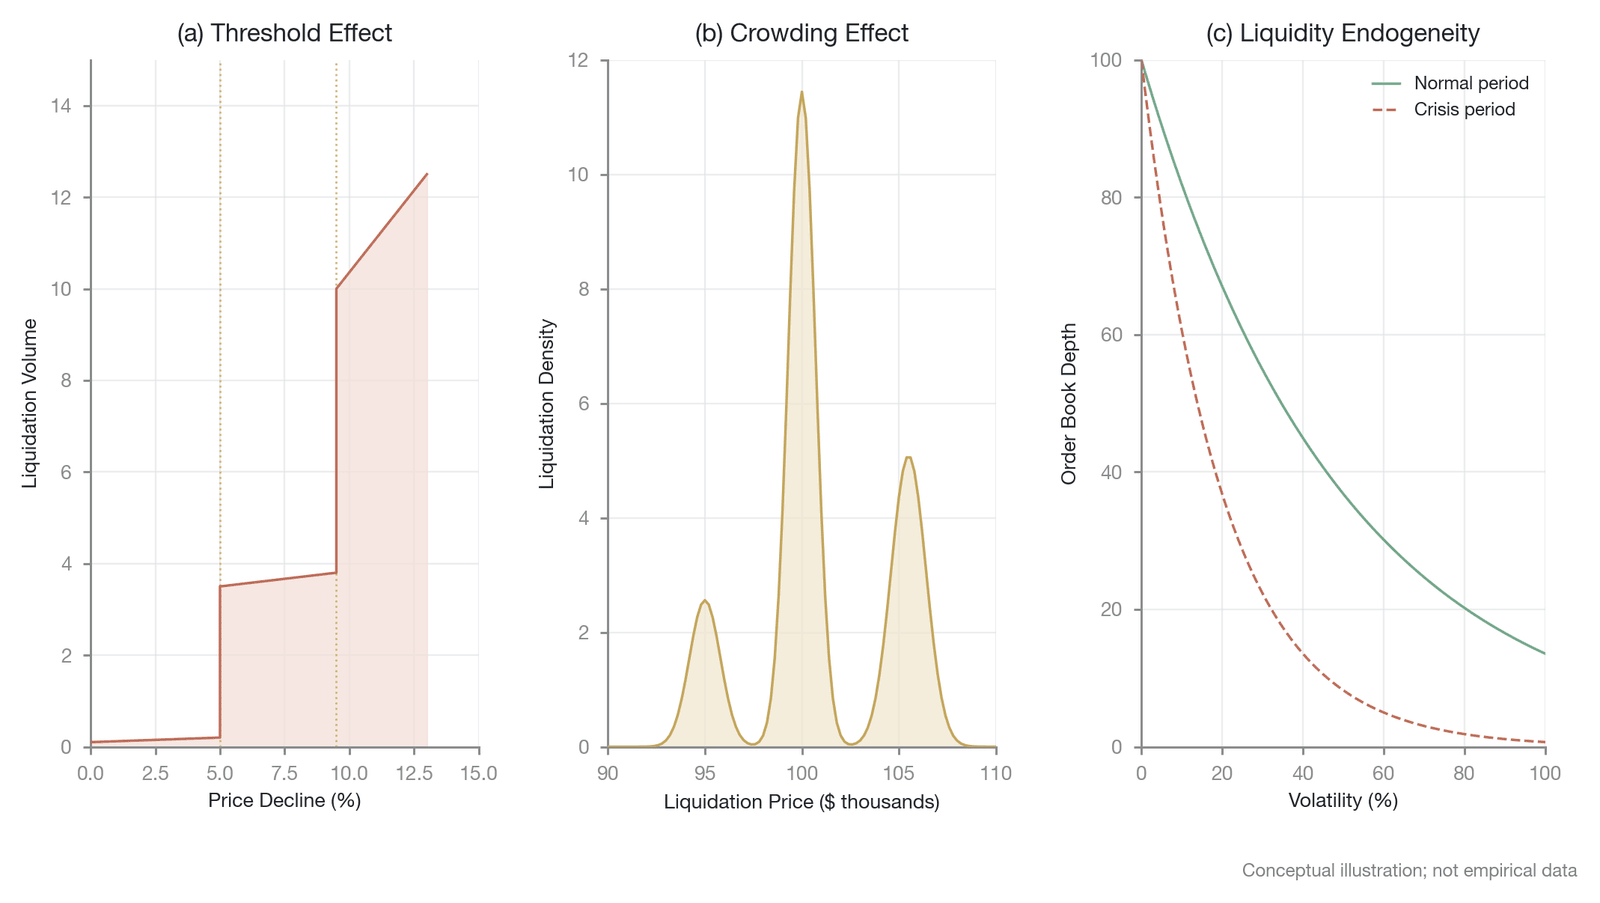
Figure 11-14. The three sources of nonlinearity in a liquidation cascade (conceptual illustration; qualitative axes; not empirical data)
As shown in Figure 11-14, the figure characterizes the three sources of nonlinearity in liquidation reflexivity. The first is the threshold effect: liquidation does not occur smoothly as the price falls; every leveraged position has a precise maintenance margin rate (such as 0.5%), the position exerts no selling pressure on the market before the price reaches the threshold (a latent state), and once the threshold is breached, the entire notional value of the position is instantly converted into a market sell order. This discontinuous jump from "zero" to "a huge amount" can drive the derivative of liquidation volume with respect to price () toward infinity in a specific range. The second is the crowding effect: retail traders and quantitative strategies tend to favor integer leverage multiples (such as 10x, 20x, 50x) and to open positions near key round-number price levels or technical support levels, and this has multiple psychological microfoundations—the anchoring effect drives traders to use integer leverage and round-number price levels as reference points; the coordination effect of real-time social media (the "key levels" shared on Crypto Twitter and in Telegram groups) amplifies herd behavior; the informational-cascade mechanism (Bikhchandani, Hirshleifer, and Welch, 1992) [12] leads later entrants to treat peers' opening of positions at the same price as evidence of price support; and the representativeness heuristic ("this support level held in the past, so it will hold again") further entrenches an excessive reliance on historical levels. Because position information in traditional markets is private and social amplification is far less immediate and transparent than in crypto communities, both behavioral homogeneity and the clustering density of liquidation prices are markedly lower there. This clustering forms "liquidation-dense zones," and when the price falls into one, spikes sharply and generates a massive liquidation order flow instantly. The third is the endogeneity of liquidity: order-book depth is not an exogenous constant; in normal times market makers provide ample liquidity, but when prices swing violently and liquidations occur frequently, market makers face enormous adverse-selection and inventory risk and rationally choose to widen spreads or withdraw their orders outright, so that effective depth falls sharply precisely when the system most needs liquidity to absorb selling pressure, and this "procyclicality" further amplifies the price-impact coefficient . The multiplicative superposition of the three nonlinearities (a spike in × a plunge in ) allows the feedback gain to jump from below 1 to far above 1 in an extremely short time, driving the market out of control in an instant.
This nonlinear mechanism also answers the paradox posed at the opening of this chapter—why individual prudence produces precisely systemic fragility at the aggregate level. The causal bridge has three parts. First, the stop-loss orders that individuals set out of prudence, like leverage liquidation prices, tend to cluster near round-number levels and technical support levels, and the two superimpose on the price axis, jointly raising in the liquidation-dense zone. Second, under unified margin and correlations approaching 1 in a crisis, the effective portfolio-level leverage of a "safe" 5x–10x notional leverage is far higher than its notional value (see Section 11.7.5), so that prudent individuals contribute far more liquidation sensitivity at the system level than they realize. Third, the voluntary sell orders triggered by individual stop-losses have exactly the same direction as the forced sell orders of the liquidation engine and are released simultaneously, which in effect further amplifies . Thus it is precisely the risk-management actions of countless individuals—microscopically "correct"—that, under the structural coupling of unified margin, liquidation-price clustering, and procyclical liquidity withdrawal, aggregate into a macroscopically high , high liquidation concentration, and low , causing systemic risk to emerge endogenously from individual prudence.
11.3.5 The cascade risk index
To quantify this divergence risk in actual trading and risk control, we can construct an operational indicator based on the reflexivity equation: the cascade risk index (CRI).
The precise definitions of the sub-components are as follows. Leverage density is measured by the ratio of open interest (OI) to the asset's circulating market capitalization, that is, . When this ratio exceeds 0.3, it indicates that the derivatives market's notional exposure is approaching one-third of the underlying asset's market cap and that the leverage level has entered a warning range. Liquidation concentration uses the liquidation heatmap to quantify the share of liquidatable notional value clustered within a specific range below the current price (usually taken as 5%) as a proportion of total open interest, that is, (where is the notional value of position , is its liquidation price, is the current mark price, and is the indicator function). This indicator reflects the relative scale of the liquidation order flow that might be triggered by a 5% price decline. Available depth cannot be read from the current static snapshot of the order book alone; it should instead be assessed as the "stress depth" that market makers can maintain under a specific volatility-stress scenario—that is, the effective bid depth the order book can still provide within 2% below the price when volatility spikes to its historical 99th-percentile level.
Based on the definitions above, we can retrospectively calibrate the CRI for four major liquidation events in crypto history, providing an empirical calibration benchmark for the indicator's warning thresholds.
| Event | OI/market cap | Liquidation concentration (5%) | Stress depth ($100 million) | Estimated CRI | Actual cascade severity |
|---|---|---|---|---|---|
| March 12, 2020, "Black Thursday" | 0.18 | 0.12 | 0.8 | 0.027 | Severe (~$6 billion liquidated) |
| May 19, 2021, "5.19 crash" | 0.25 | 0.15 | 1.2 | 0.031 | Severe (~$8.6 billion liquidated) |
| August 5, 2024, "yen carry-trade unwind" | 0.28 | 0.18 | 1.5 | 0.034 | Moderate (~$10.2 billion liquidated, rapid recovery) |
| October 10, 2025, "10.10 event" | 0.35 | 0.22 | 0.4 | 0.193 | Extreme (~$19 billion liquidated) |
Table 11-3. Retrospective CRI calibration for major historical liquidation events (Data source: author's estimates, derived from public data)
The table above reveals two key patterns. First, the estimated CRI of the "10.10 event" is an order of magnitude higher than in the three preceding events, and its core driver was not a proportionate rise in leverage density or liquidation concentration but a sharp contraction of stress depth, from $150 million in August 2024 to just $40 million—meaning the market lacked sufficient liquidity buffer to absorb selling pressure under the same liquidation shock. Second, the absolute value of the CRI must be read in light of the historical evolution of market size: as the total volume of the crypto derivatives market grows, absolute liquidation volume is markedly amplified even when the change in a relative indicator (such as OI/market cap) is limited. The CRI's warning thresholds should therefore be dynamically calibrated to market size.
As a risk indicator, however, the CRI has several limitations that warrant caution. First, on dimensional consistency: the numerator of the CRI is the product of two dimensionless ratios, while the denominator is stress depth priced in absolute dollars, which means the CRI's value changes mechanically as market volume grows and lacks an intrinsic standardization mechanism comparable across periods. Second, Table 11-3 contains only four data points spanning five years, a sample too small for robust statistical inference or for constructing warning thresholds with confidence intervals; this is essentially a retrospectively calibrated descriptive analysis, not a cross-validated predictive model. Third, the event of August 5, 2024, constitutes an anomaly worth examining closely: its estimated CRI (0.034) is higher than that of May 19, 2021 (0.031), yet its actual cascade severity was clearly lower and the market recovered markedly faster. This discrepancy suggests that the differences in the speed of external intervention and in the macro transmission path that the CRI fails to capture (the yen carry-trade unwind had a clear exogenous source and was self-limiting) may be more decisive than microstructure fragility itself in determining a cascade's ultimate destructiveness. On balance, the CRI should be improved in the direction of a conditional indicator—that is, by introducing macro state variables (such as the dollar index and credit spreads discussed in Section 11.2.3) as modulating factors on top of the microstructure variables, so that the same CRI value maps to different risk probabilities under different macro environments.
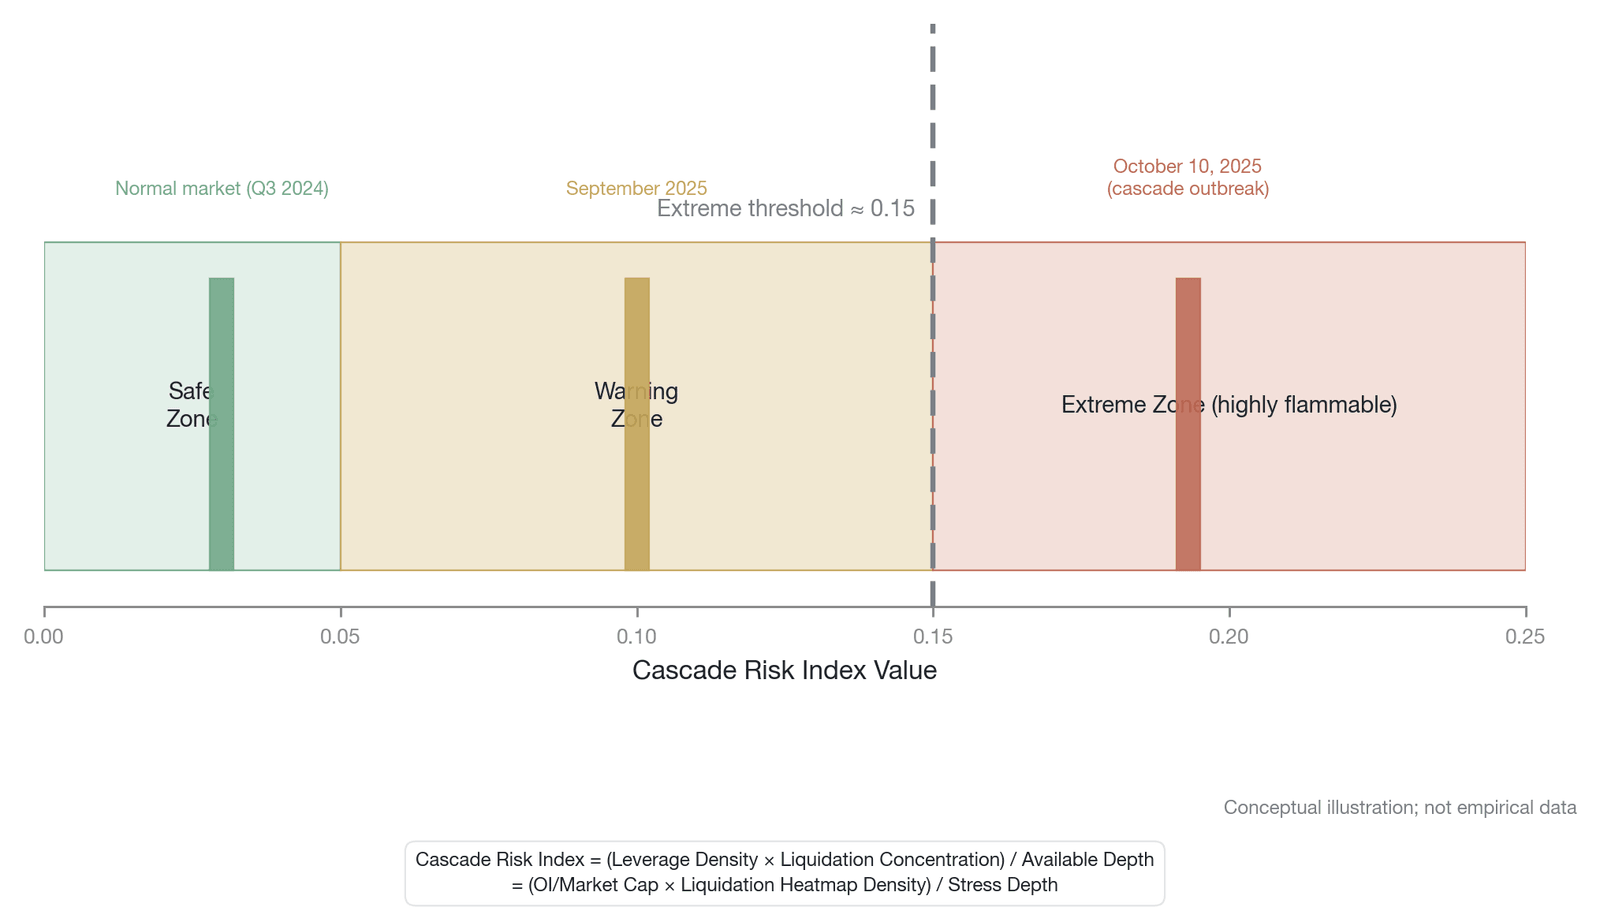
Figure 11-15. Visualization of the cascade risk index (the CRI is an exploratory indicator constructed by the author, based only on retrospective calibration of four historical events and not dimensionally standardized; the threshold bands in the figure are a conceptual illustration, not cross-validated, operational risk-control thresholds)
As shown in Figure 11-15, the CRI can serve as an exploratory, descriptive indicator for monitoring market fragility—though it must be stressed that it is a crowding proxy inspired by the feedback gain G, not yet dimensionally standardized, not the same construct as G, and not sharing the same critical value. Based on the retrospective calibration of four historical events in Table 11-3 (with estimated CRI values falling in the range of about 0.027–0.193), an empirical relative banding can be offered: in the safe range (about < 0.05) the market has enough resilience to absorb local shocks; the warning range (about 0.05–0.15) indicates that leverage is overcrowded and the market is in a subhealthy state, as when the funding rate became extreme in September 2025; and in the extreme range (about > 0.15, into which the October 10, 2025, event's calibration of about 0.193 falls), the system is highly flammable, and any minor negative catalyst can ignite a systemic cascade. Note that this banding is based only on the retrospective, descriptive calibration of four data points, that its warning thresholds and predictive power await large-sample validation, and that it should not be treated as a cross-validated, operational risk-control threshold.
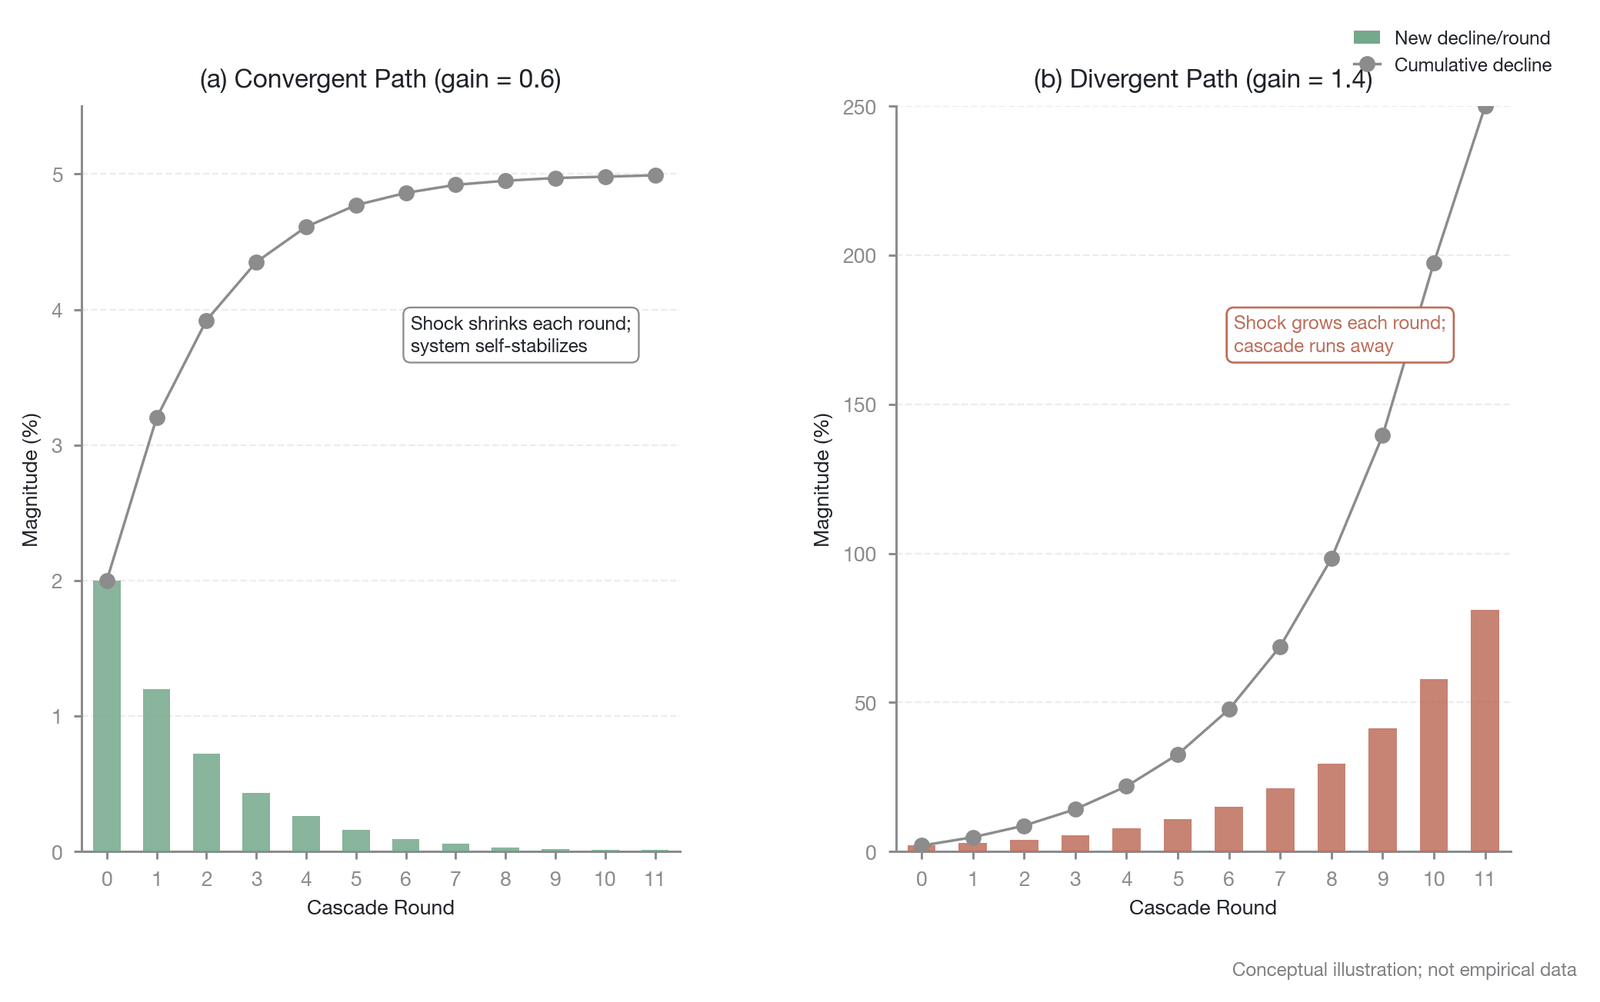
Figure 11-16. Simulation of cascade dynamics—convergent versus divergent paths (dynamic simulation; conceptual illustration; not empirical data)
As shown in Figure 11-16, the dynamic simulation reveals the starkly different evolutionary paths of the feedback gain G on either side of the critical value of 1: on the convergent path (), although the initial shock triggers liquidations, the incremental decline in each round attenuates rapidly, and the system recovers on its own after a few iterations with a limited cumulative decline; on the divergent path (), a tiny initial shock is continually amplified, the incremental decline in each round grows exponentially, and the result is ultimately a cliff-edge drop and the complete destruction of leverage. This shows that in a highly leveraged crypto market, the core of risk management lies not in predicting when the initial shock will arrive but in monitoring the system's fragility (the CRI is qualitatively positively correlated with G and can serve as an approximate cue to fragility, but G > 1 is the strict divergence criterion derived from the difference equation) and avoiding exposure to the market when the conditions for divergence are in place.
11.4 The coupling of the funding rate and leverage
In the market microstructure of perpetual futures, liquidation is the most direct and most violent manifestation of reflexivity, reshaping the price directly through an instantaneous "hard shock." This hard shock, however, does not occur out of nowhere; behind it lies a second reflexivity loop, subtler and slower but no less consequential: the chronic coupling of the funding rate, the basis, and leverage demand. The previous section's liquidation reflexivity equation described the instantaneous transmission of a liquidation cascade, whereas this section analyzes how system fragility is gradually accumulated before a liquidation erupts. The funding-rate mechanism does not directly create forced order flow, but by continuously affecting holding costs and leverage demand, it fundamentally alters the market's "flammability" and prepares the necessary soil for a liquidation cascade.
11.4.1 The margin-erosion effect
The funding rate was originally designed as a stabilizer that anchors the price to spot, but in a high-leverage environment it inevitably reveals its other face as a "chronic cash flow." For the paying side, the funding rate constitutes a continuous margin-consumption mechanism that steadily erodes the account's margin balance. This consumption is hard to notice in everyday trading, because it does not depend on violent swings in the market price but occurs mechanically with the passage of time. The direct consequence of this chronic erosion is that it dynamically raises the effective liquidation price, so that a position originally in the safe range imperceptibly moves close to the edge of liquidation. This process can be understood through a quantitative example. Amid extreme bull-market sentiment, the funding rate reaches 0.1% every 8 hours (about 109% simple annualized, about 198% compound annualized), a level recorded both at the peak of the 2021 bull market and on the eve of the October 2025 event [13]. A trader opens a 1 BTC long at the $100,000 price level with 10x leverage. The initial margin is $10,000, with a maintenance margin rate of 0.5% (i.e., $500).
Even if the market price stays exactly at $100,000, the position's margin balance is rapidly consumed within a short time simply because of funding payments. At this extreme rate, $300 of funding must be paid each day ($100 every 8 hours). At around day 31, the margin balance is fully depleted to the maintenance margin level, triggering liquidation. More dangerously, as margin decreases, its effective liquidation price moves up gradually from an initial level of about $90,500, eventually approaching the entry price. From the perspective of behavioral finance, this gradual erosion has a distinctive psychological stealth. The mental-accounting theory of Thaler (1999) [14] points out that traders tend to record funding-rate expenditures and position P&L in separate mental accounts, thereby underestimating the combined consumption effect of the two on the same margin pool. Prospect theory, meanwhile, predicts that small, high-frequency repeated losses are qualitatively different in psychological perception from a one-time loss of the same total amount; the funding rate deducted every 8 hours acts as a "small incision" whose cumulative effect is far below the trader's perception threshold, forming a "boiling frog" cognitive trap in which the continuous erosion of margin has pushed the position to the edge of liquidation before it is even perceived.
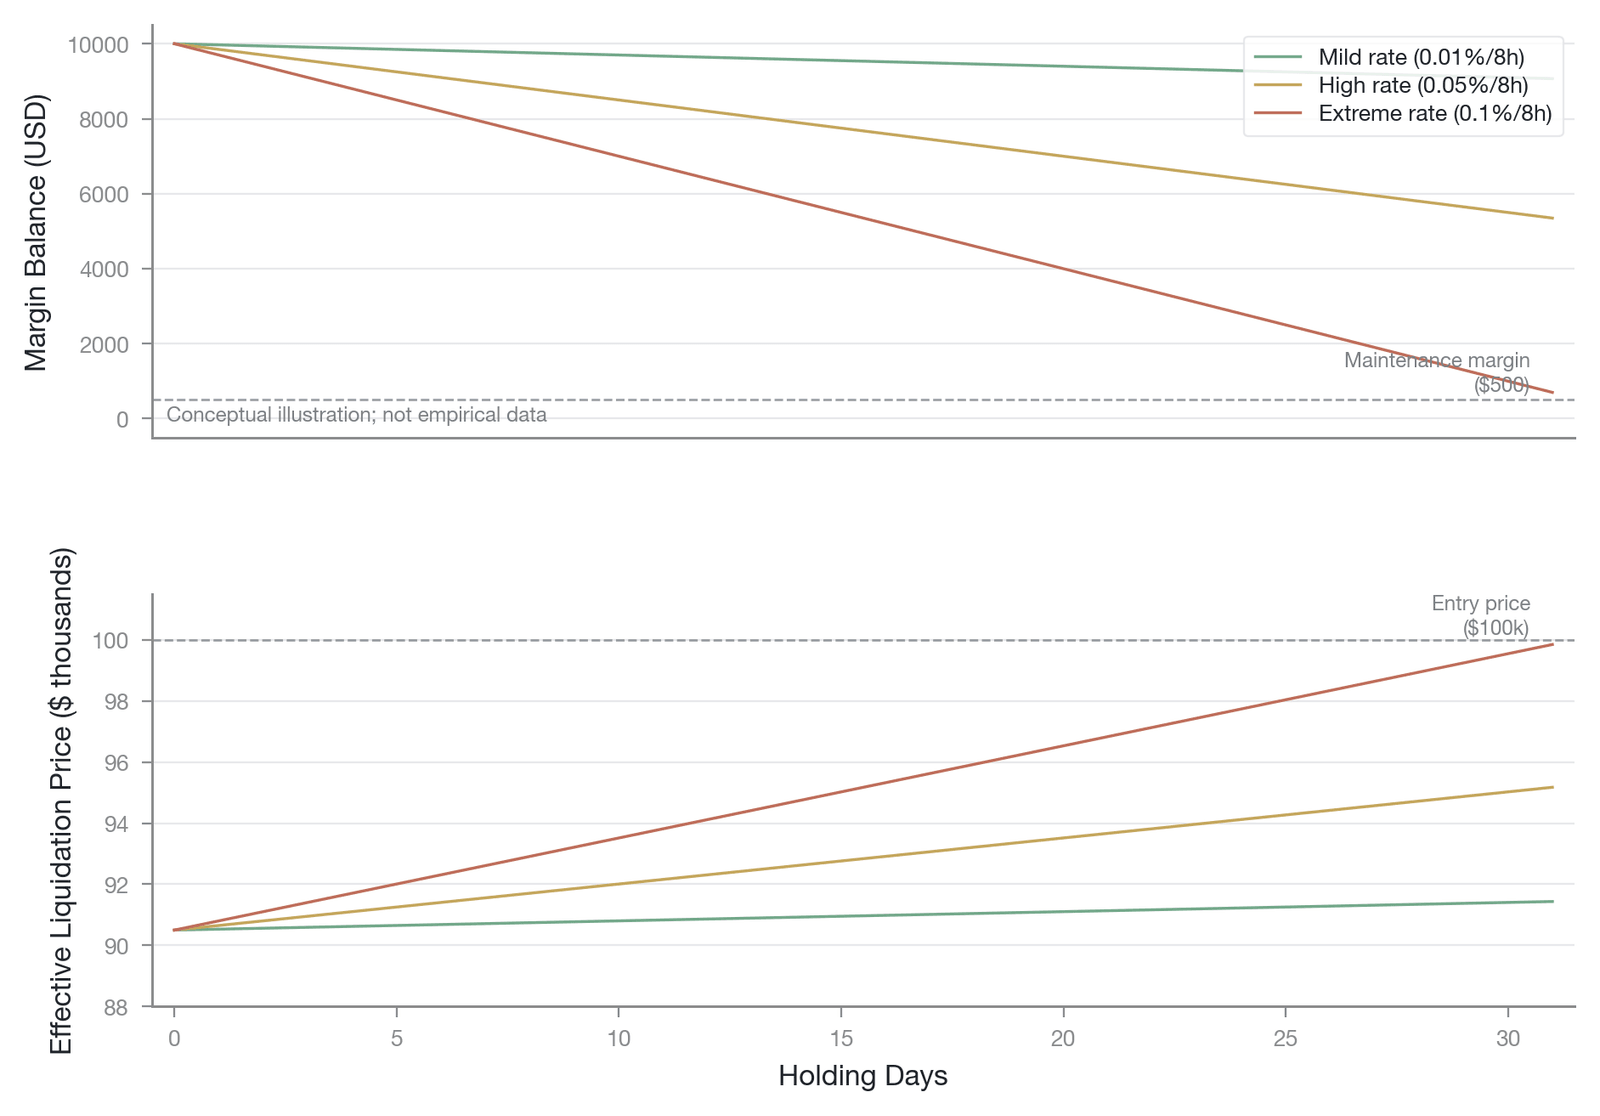
Figure 11-17. The erosion effect of the funding rate on the margin balance and the liquidation price (a numerical example based on an assumed rate; conceptual illustration; not empirical data)
The amplifying effect of the leverage multiple on this erosion process is nonlinear. Figure 11-18 shows the number of days required for positions at different leverage multiples to have their liquidation buffer fully depleted at the same funding rate (0.05% per 8 hours, i.e., about 55% simple annualized, about 73% compound annualized). A position at 100x leverage faces liquidation risk from rate erosion in only about 4 days, whereas a position at 5x leverage can withstand more than 60 days of rate consumption.
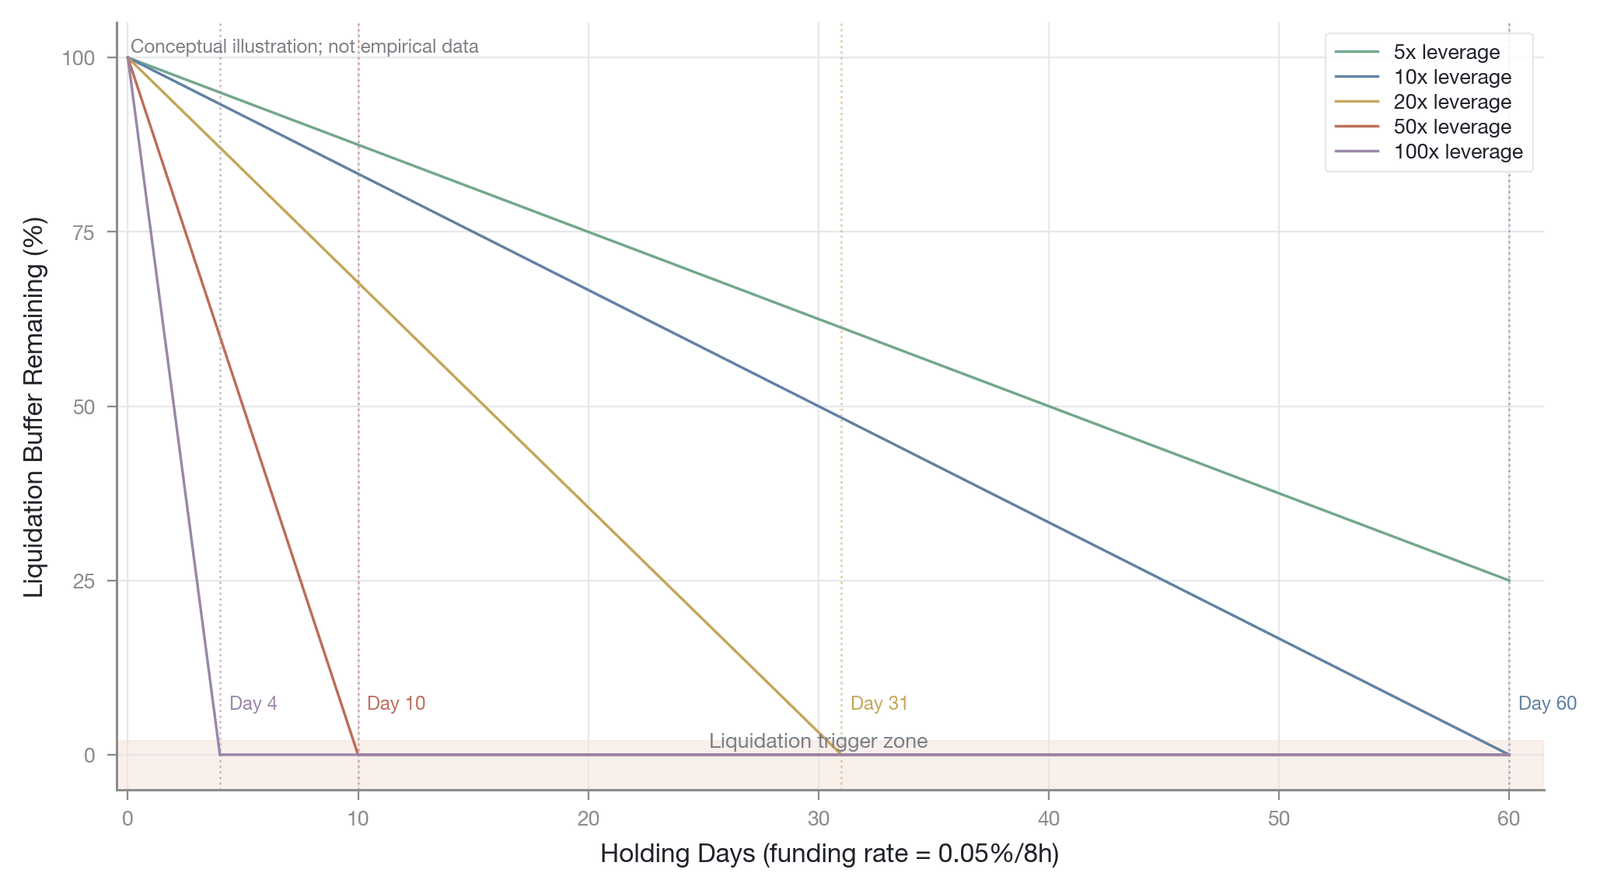
Figure 11-18. The cumulative erosion effect of the funding rate at different leverage multiples (a numerical example based on an assumed rate; conceptual illustration; not empirical data)
This constitutes a gradual process of risk accumulation. The funding rate is not only a pricing of the use of leverage but also a countdown on the account's survival time. Moreover, the funding-rate mechanism itself contains a negative-feedback regulatory function: a high holding cost theoretically forces some leveraged longs to close voluntarily and simultaneously attracts arbitrageurs to enter through a "buy spot, short perpetual" strategy. This economic incentive is meant to push the market back toward equilibrium. This self-correcting design, however, relies on a key assumption: that arbitrageurs are both able and willing to carry out basis arbitrage. When this assumption is broken under extreme market conditions, the funding-rate mechanism degenerates from a "stabilizer" into an "accelerator."
11.4.2 The failure of basis arbitrage
In the normal market state, there is a healthy negative-feedback loop between the funding rate and basis arbitrage. When bullish sentiment runs high and drives the perpetual price above the spot price, the funding rate turns positive and keeps climbing. This attracts arbitrageurs: they short perpetual futures and go long spot, thereby depressing the perpetual price, narrowing the basis, and eventually returning the funding rate to a normal level. This loop is the core of the perpetual price's anchoring mechanism. During the transition from a normal period to a stress period, however, this negative-feedback mechanism can face three serious failure conditions that render the "stabilizer" ineffective.
Funding constraints are the primary factor in arbitrage failure. In an environment of extreme panic or credit tightening, arbitrageurs' funding costs rise sharply, and they may even face an inability to obtain funding at all. As the liquidity spiral model of Brunnermeier and Pedersen points out [8], when "funding liquidity" dries up, arbitrage is not only unprofitable but arbitrageurs themselves may even be forced to join the selling as they deleverage. At such times, far from acting as a force that stabilizes the market, they become drivers of greater volatility. During the "Black Thursday" event of March 12, 2020, even though the perpetual basis briefly fell to an extreme level below −30%, arbitrageurs were unable to enter because the funding market had frozen completely [4]. The crypto market, moreover, has no central-bank lender of last resort of the kind the traditional financial system provides. Once funding constraints tighten, no external mitigation mechanism exists, and the binding force of a liquidity drought is correspondingly far stronger than in traditional markets.
Inventory risk is the second constraint. When market volatility is extremely high, the cost of managing the price-fluctuation risk of a spot position becomes extremely expensive. Even if the basis between perpetual futures and spot appears to offer ample profit, arbitrageurs may choose to stay on the sidelines because they cannot effectively hedge the risk of a plunge on the spot leg. This arbitrage opportunity—present in theory but unobtainable in practice—allows the basis to remain anomalous for a long time. Shleifer and Vishny (1997) call this the "limits of arbitrage" [15]: even when there is an obvious pricing deviation, risk aversion and capital constraints prevent arbitrageurs from correcting it. At the same time, the cost of delta hedging also rises sharply, because in extreme conditions the implied volatility of the options market spikes in tandem, making the cost of hedging tail risk through options prohibitive.
Infrastructure-level constraints are especially prominent in the decentralized-exchange environment. Extreme conditions are often accompanied by network congestion and spiking gas fees, which sharply compress the profit margin of arbitrage. At the same time, MEV activities such as sandwich attacks and transaction-ordering manipulation increase execution risk. The delays and security hazards of cross-chain bridges also limit cross-platform arbitrage efficiency. During the "yen carry-trade unwind" of August 5, 2024, API latency at multiple exchanges exceeded several seconds, making cross-platform arbitrage strategies nearly impossible to execute [16]. On the Ethereum network in particular, gas fees can spike 10- to 50-fold during extreme events, directly eroding the arbitrage profit margin and turning an otherwise profitable basis trade into a net loss after execution costs.
Beyond these three failure conditions, there are two further failure mechanisms that are equally critical in practice but less systematically analyzed. The first is funding-rate-reversal risk. Spot-perpetual basis arbitrage (long spot, short perpetual futures) earns a profit in normal markets by collecting a positive funding rate, but when a market crash triggers large-scale long liquidations, the funding rate can flip sharply from positive to deeply negative. At that point, the short position turns from a rate collector into a rate payer, and the arbitrageur faces a double penalty: the mark-to-market loss on the perpetual short (a temporary paper loss from price fluctuation, or margin pressure from an extreme widening of the basis) compounded by the continuous consumption of a negative funding rate. This double pressure may force the arbitrageur to close the short position that had been playing a stabilizing role, and closing a short is a buy operation, which reduces the hedging force against selling pressure on the perpetual side; at the same time, to rebalance delta, the arbitrageur may simultaneously sell the long position on the spot leg, thereby transmitting a shock originally confined to the perpetual futures market directly into the spot market. This mechanism reveals the direct link between Section 11.4.2 and Section 11.4.3: the failure of arbitrage means not only the passive absence of a stabilizing force but potentially the active transformation of a stabilizing force into a destabilizing one. The second is cross-exchange capital fragmentation. Executing basis arbitrage requires capital to be pre-distributed across multiple exchanges so that hedged positions can be established simultaneously on different platforms. During extreme events, however, exchanges may freeze or delay withdrawals, blockchain confirmation times may stretch from a normal few minutes to 10 to 60 minutes, and fiat deposit-and-withdrawal channels may close in tandem. Even if an arbitrageur has ample capital in aggregate, they cannot redeploy funds across platforms within a cascade window on the order of 40 minutes. This geographic and infrastructure-level capital fragmentation means that the system's effective arbitrage capital is far smaller than the nominal available capital, and the actual ceiling on arbitrage-absorption capacity is determined by the weakest link rather than by total capital.
When these constraints all take effect at once, the basis can widen sharply into deeply negative (or extremely positive) territory while arbitrageurs' absorption capacity rapidly decays. At this point, a high funding rate can no longer effectively suppress overheated leverage demand and instead becomes the critical factor that drives high-leverage positions into liquidation (Figure 11-19 contrasts two states: the effective operation of negative feedback in a normal period and the runaway of positive feedback in a stress period).
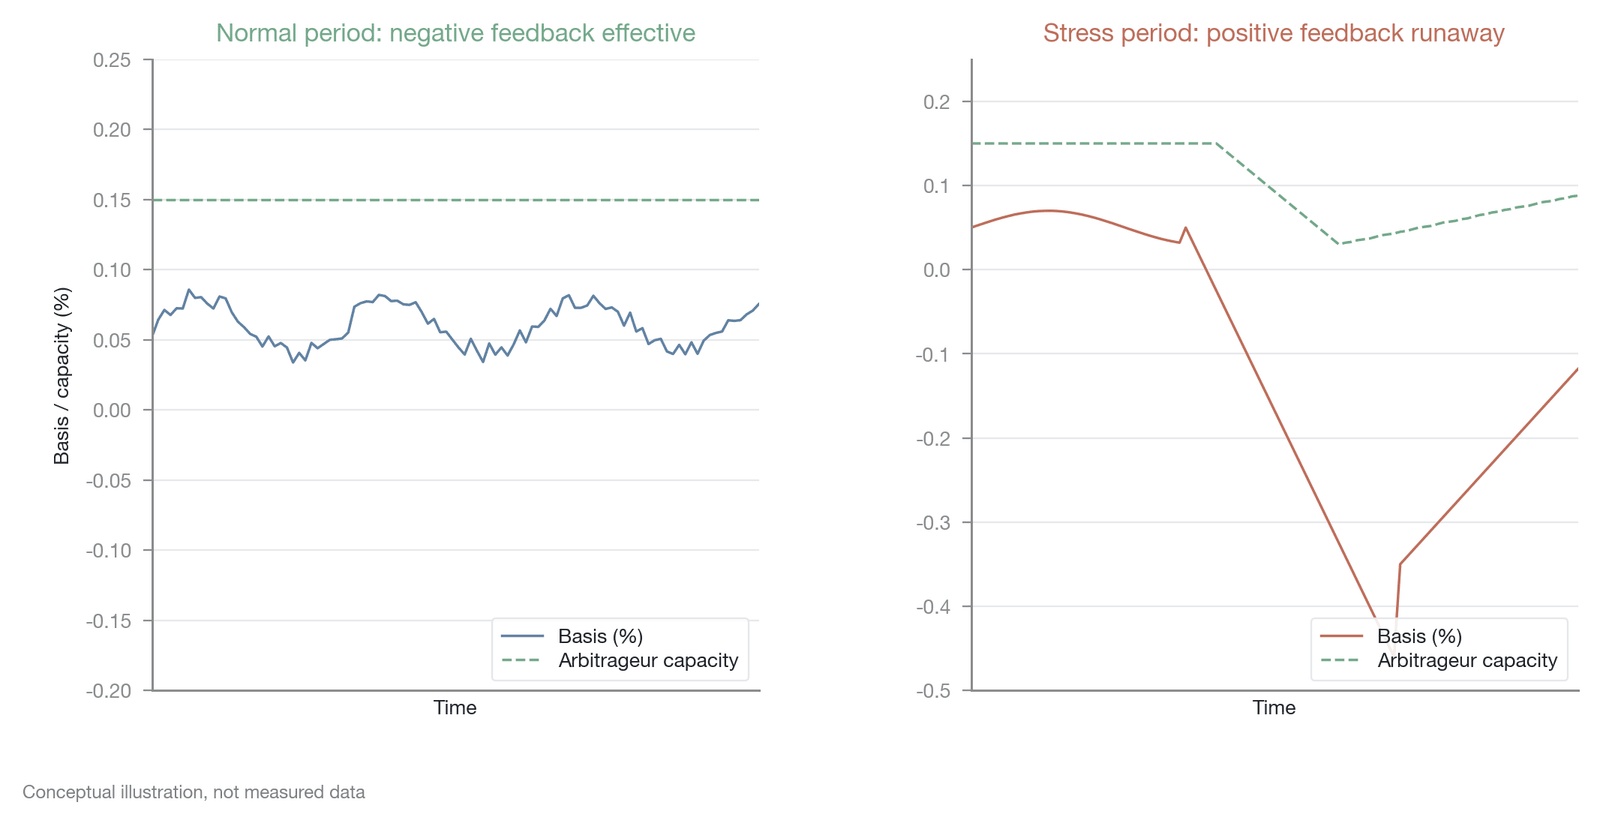
Figure 11-19. Comparison of the basis-arbitrage mechanism in normal and stress periods (conceptual illustration, not empirical data)
Figure 11-20 uses a flowchart to contrast how the arbitrage mechanism operates in normal versus stress periods.
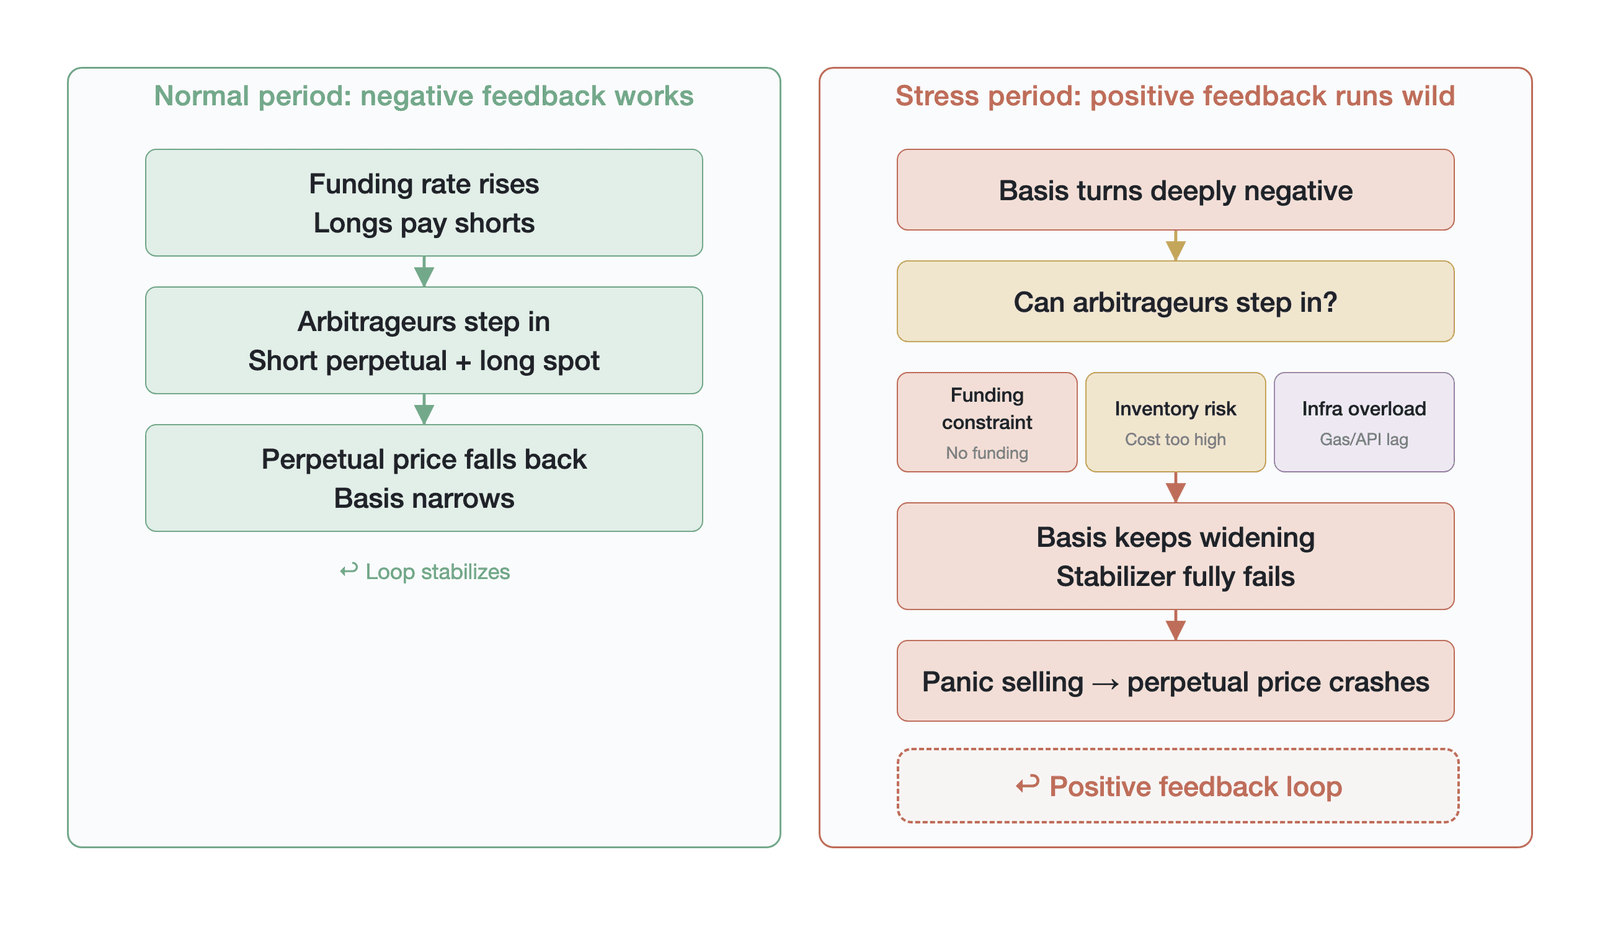
Figure 11-20. The process mechanism of basis-arbitrage failure
The core insight the flowchart conveys is that under normal market conditions arbitrageurs play the role of a negative-feedback stabilizer: when the basis deviates from a reasonable range, arbitrageurs' entry trades push it back toward equilibrium, closing the feedback loop and maintaining the anchoring relationship between the perpetual price and the spot price. Under stress conditions, however, three constraints activate simultaneously—funding constraints (arbitrageurs cannot obtain enough margin or borrowed funds), inventory risk (holding a spot hedge position faces violent mark-to-market losses), and infrastructure overload (exchange delays, API failures, on-chain congestion)—forcing arbitrageurs to withdraw or preventing them from entering at all. When the executor of negative feedback is absent, the basis deviation is no longer corrected but instead keeps widening through panic contagion and a liquidity-siphoning effect, and the entire feedback loop turns from negative to positive. This shift in mechanism provides the direct precondition for the compound rate-liquidation positive feedback discussed in the next section: it is precisely because of arbitrageurs' systemic failure during a stress period that an extreme deviation in the funding rate can keep accumulating without being corrected by market forces.
11.4.3 The compound rate-liquidation positive feedback
The chronic erosion of the funding rate and the instantaneous shock of the liquidation mechanism do not operate in isolation; they are tightly coupled through their shared core variable, margin, forming a compound positive-feedback chain that weaves indirect pressure together with direct shock. This loop constitutes the most dangerous systemic-dynamics feature of perpetual futures markets.
This loop usually begins with a rate-extremization phase: in a strong one-sided trend, the funding rate stays at an extreme level. This high rate is deducted from the position holder every 8 hours (or, at some exchanges, every hour), continuously consuming their margin balance. This process systematically narrows the liquidation distance of all positions in the same direction, quietly "accumulating fragility" for the coming liquidation cascade. Because the system has been continuously consumed by the rate and has become extremely fragile, a tiny price reversal that would not otherwise be enough to spark a crisis (for example, a normal 2% pullback) is now sufficient to touch the liquidation line of positions that the rate has pushed to the edge, triggering the first batch of forced closures. The selling pressure from the first batch of liquidations drives the price down further and triggers more liquidations, and the liquidation reflexivity equation begins to diverge. As large-scale liquidation is executed, the market's position imbalance changes drastically, causing the funding rate to flip sharply—for example, from an extreme positive value to an extreme negative one in an instant. This sharp flip is not only a mechanical reaction of the market structure but also sends a strong signal to the entire market that "the trend has changed." This prompts the remaining longs to close voluntarily in a panic, joining forces with the liquidation engine's forced selling. In the end, high leverage is thoroughly cleared out, open interest plunges, and the system resets violently.
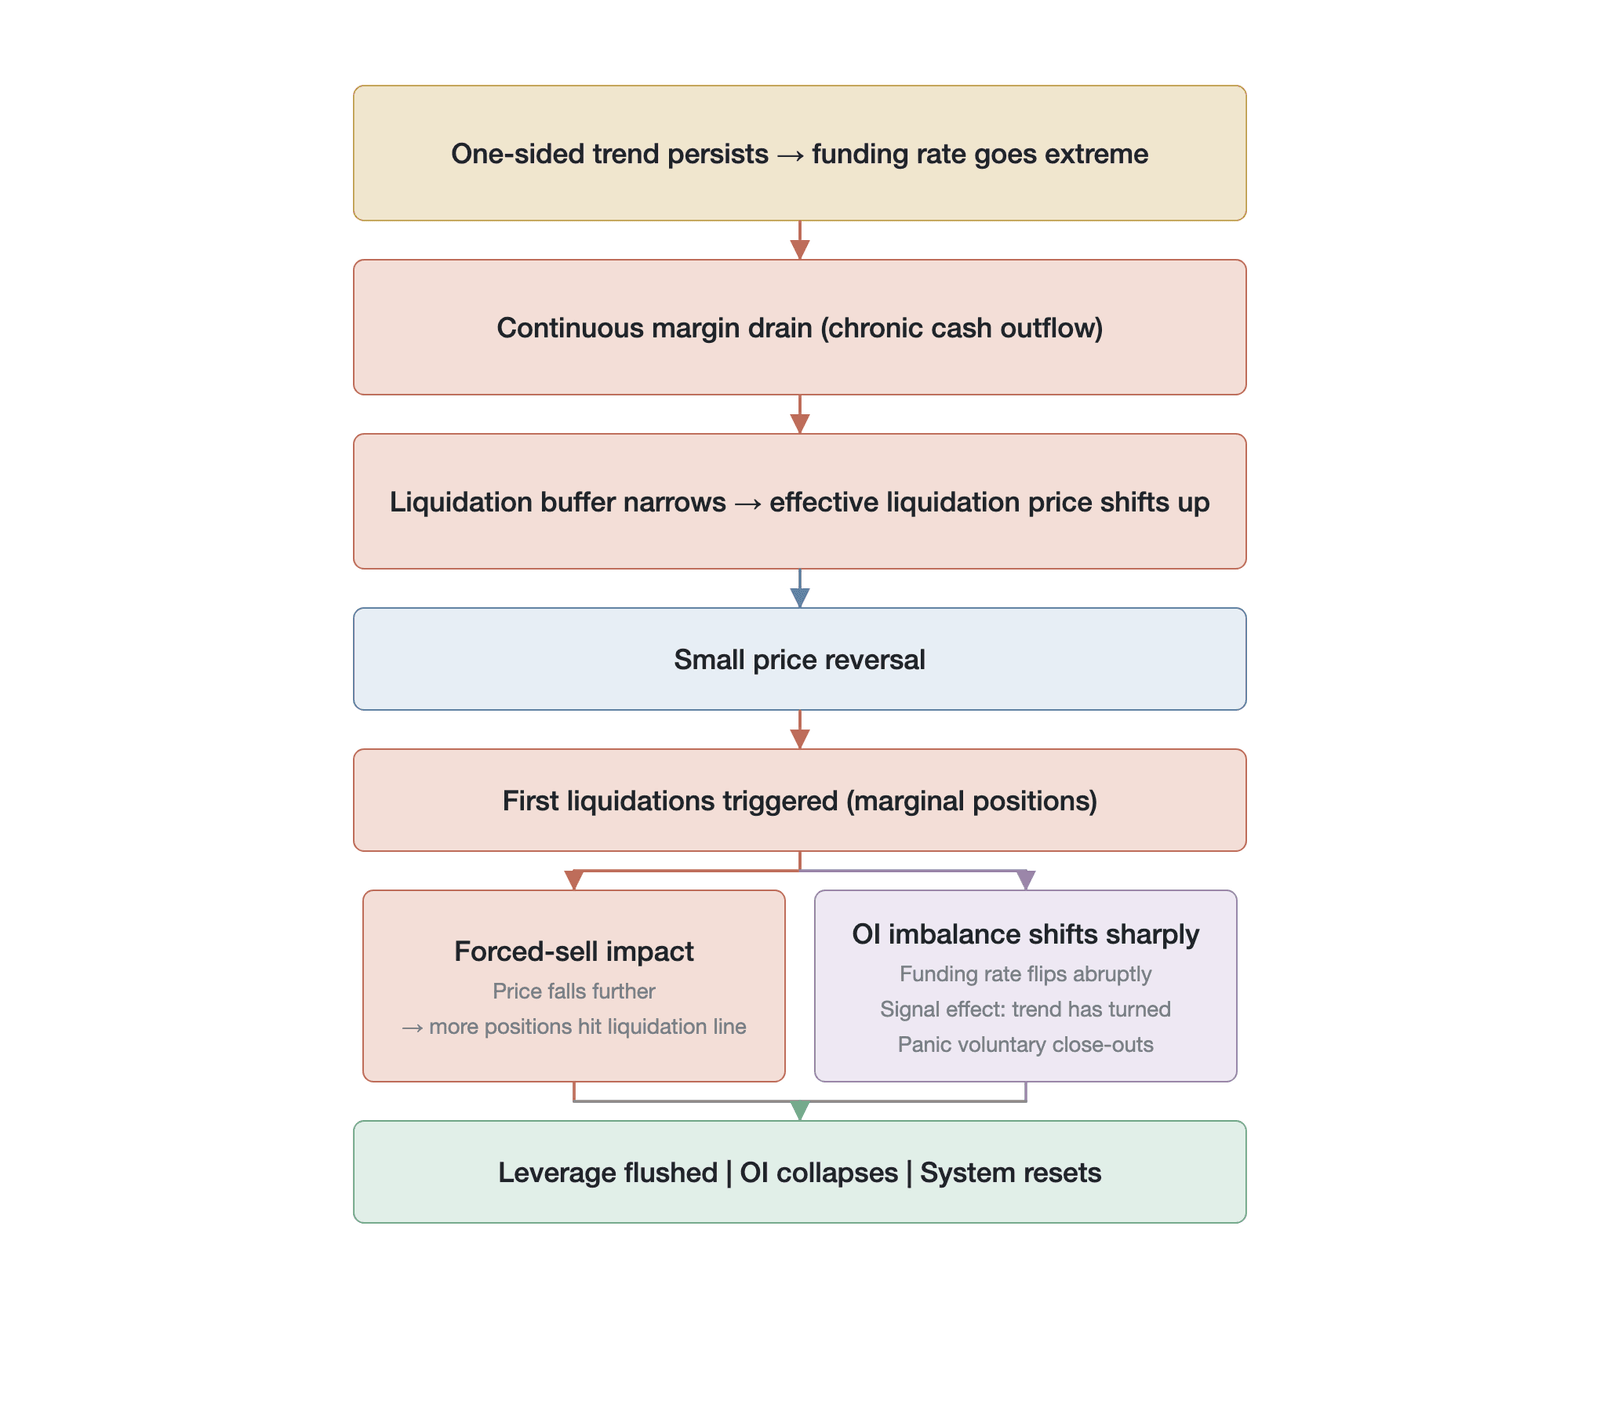
Figure 11-21. The compound rate-liquidation positive-feedback loop
In this nested loop, the "extreme termination path" is far more common than the "mild path." The mild path requires the price to stop moving in one direction before liquidations are triggered on a large scale, which is an extremely narrow condition in a system that has long been eroded by a high rate. By contrast, rate extremization itself accumulates potential energy for the liquidation cascade, and once the price reverses, this potential energy is released all at once. As the "10.10 event" of October 2025 demonstrated, the fundamental cause of a systemic collapse is often not the macro signal that triggers it but the extreme rate consumption of the preceding weeks, which is precisely what degrades the system from a robust metastable state into an extremely fragile, flammable one [17].
A counterfactual exercise helps quantify the contribution of rate erosion to the scale of the cascade. On the eve of the "10.10 event," the funding rate on BTC perpetual futures was about 30% annualized, which means the margin of a 10x-leverage long was eroded by about 1.2 percentage points over two weeks, compressing the liquidation distance of many positions from more than 5% to less than 3%. Had the rate been at a mild 10% annualized (the normal state for most of 2024), the margin erosion over the same holding period would have been only about 0.4 percentage points, and the vast majority of positions eroded to the edge would still have retained an ample liquidation buffer. On this basis, in the counterfactual 10%-rate scenario, the scale of positions liquidated in the initial trigger phase would have been reduced by about 40% to 50%. This range estimate is sensitive to the assumptions about the shape of the leverage distribution and the holding period; if leverage concentration were higher or the average holding time longer, the actual reduction could deviate from this range. Because of the nonlinear amplification of the liquidation reflexivity equation (each round's liquidation volume determines the next round's trigger scale), the total liquidation scale of the cascade might have shrunk by about 35% to 45%, that is, to about $10.5 billion to $12.5 billion. This counterfactual exercise is a partial-equilibrium analysis: a lower funding rate would itself change the equilibrium open interest and market makers' willingness to supply liquidity, placing the entire market microstructure in a different initial state. Moreover, the mapping from initial trigger scale to total cascade scale is highly nonlinear, and its amplification factor depends on the specific shape of the liquidation density function (that is, whether the distribution of liquidated positions on the price axis is a concentrated "fat tail" or a dispersed "thin layer"), a distributional feature that directly determines the cascade's acceleration and duration. This estimate shows that the long-run accumulation effect of the funding rate has an influence on the cascade's ultimate destructiveness of the same order of magnitude as the trigger shock itself, and that rate governance should be regarded as a core element of systemic-risk management rather than merely an auxiliary tool for anchoring the market price.
The funding rate and the liquidation mechanism—one slow and one fast, one hidden and one visible—together forge the endogenous systemic risk of perpetual futures markets.
11.5 The four phases of a liquidation cascade
A liquidation cascade is not a crash achieved in one step but a dynamic process with a clear evolutionary path. It typically passes through four logically progressive phases: trigger, propagation, amplification, and termination. In each phase a different mechanism dominates the market's direction, and identifying the key signals of these phase transitions not only provides observable clues for understanding extreme events but also offers a theoretical basis for risk warning and intervention. This section integrates the liquidation reflexivity equation (Section 11.3) and the rate-coupling effect (Section 11.4) discussed earlier into a complete dynamic narrative, using the "10.10 event" of 2025 as the primary reference case.
Table 11-4 summarizes the key decision indicators and thresholds for the four phases, providing an operational reference framework for identifying in real time which phase a cascade is in.
| Phase | CRI range | LIAR range | Feedback gain | OI change | Depth change | Dominant mechanism |
|---|---|---|---|---|---|---|
| Trigger | 0.8–1.2 | > 1.0 | < 1.0 | < −5% | < −30% | Exogenous shock + marginal liquidations |
| Propagation | 1.2–2.0 | 0.5–1.0 | ≈ 1.0 | −5% to −15% | −30% to −70% | Liquidation reflexivity loop activates |
| Amplification | > 2.0 | < 0.5 | ≫ 1.0 | −15% to −35% | > −90% | Multi-mechanism resonance; depth goes to zero |
| Termination | Falls back to < 1.0 | Recovers to > 1.0 | < 1.0 | Stabilizes | Slow recovery | Leverage cleared + external buying |
Table 11-4. CRI/LIAR decision thresholds and key indicators for the four phases of a liquidation cascade (Note: LIAR, the liquidation-impact absorption rate, ≈ available depth / liquidation volume per unit time, which is approximately inversely proportional to the feedback gain ; the two are based on different measures—LIAR uses instantaneous visible depth and uses cross-exchange effective depth—so they are placed side by side as independent diagnostic columns. The CRI column in this table is an illustrative standardized scale, on a different basis from the unstandardized raw estimates in Table 11-3, so the empirical banding of Section 11.3.5 cannot be applied to it directly. The indicators in this table are contemporaneous phase diagnostics, not forward-looking warnings.) (Data source: constructed by the author)
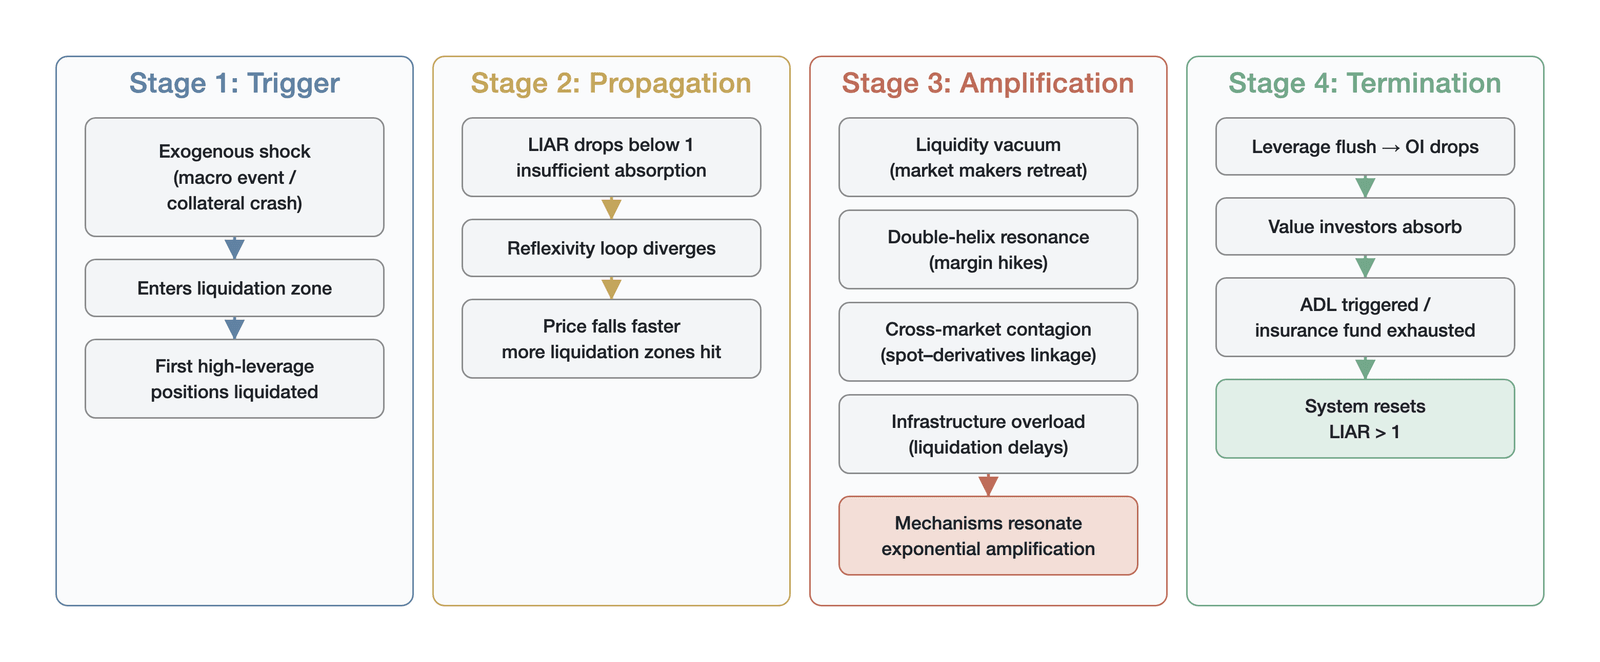
Figure 11-22. Overview of the four-phase liquidation-cascade process
11.5.1 The trigger phase
The starting point of a liquidation cascade is usually an exogenous market shock. This shock need not be large in itself; its key role is to break the system's prior metastable state and push the market price precisely toward the first significant liquidation-dense zone. Here the relationship between the trigger factor and the underlying fragility must be clearly distinguished: the trigger factor is a necessary but by no means sufficient condition, and what really determines whether a shock is absorbed or amplified is the degree of structural fragility the system has already accumulated before the shock arrives—including leverage density, the concentration of liquidation prices, and the thickness of the liquidity buffer.
The sources of trigger factors are highly diverse. A trigger may be a piece of macroeconomic news (such as the unexpected report about the trade dispute in the "10.10 event"), a violent move in the price of a related asset (such as a plunge in an important collateral asset or a brief stablecoin depeg), or even a malicious attack on a weak point in market liquidity (such as "oracle manipulation"). Table 11-5 summarizes the trigger factors and key characteristics of several major liquidation-cascade events in recent years.
| Event | Trigger factor | 24-hour liquidations | BTC max drawdown | Main cascade duration |
|---|---|---|---|---|
| March 12, 2020, "Black Thursday" | COVID-19 panic + global sell-off of risk assets | ~$6 billion | ~39% | ~48 hours |
| May 19, 2021, "5.19 crash" | China's regulatory policy + Musk's remarks | ~$8.6 billion | ~30% | ~12 hours |
| June 13, 2022, "Luna aftershock" | Chain liquidations of Three Arrows Capital/Celsius | ~$4.8 billion | ~17% | ~24 hours |
| August 5, 2024, "yen carry-trade unwind" | Bank of Japan rate hike + global unwinding of carry trades | ~$10.2 billion | ~15% | ~8 hours |
| October 10, 2025, "10.10 event" | Unexpected escalation of the trade dispute | ~$19 billion | ~14.5% (spot; perpetual wicks of about 16%–17%) | ~1.5 hours |
Table 11-5. Comparison of major liquidation-cascade events in recent years (Data source: CoinGlass [9], CoinGecko [3], Amberdata [2]). Note: the 24-hour total liquidations for each event use different sources and statistical bases (single-exchange versus market-wide, single-day versus multi-day, and notional versus actual liquidations differ substantially), and the 2020/2021 figures are aggregate estimates with high range uncertainty, so cross-event comparisons should emphasize orders of magnitude rather than precise values
A thought-provoking trend can be observed in the table above: as the crypto derivatives market has grown, the visible forced-liquidation notional of liquidation cascades has kept climbing while the duration of the cascades has shortened markedly. The "10.10 event" of 2025 set a new record for single-day liquidations in only about 1.5 hours (see the chapter opening), indicating that both the leverage density and the liquidation efficiency of the market are rising sharply and that the reaction window left to traders and risk-control systems is narrowing.
In the trigger phase, the market's reaction is usually local. Only the traders with the highest leverage and the most extreme risk appetite are liquidated. At this point, overall market liquidity is still ample, and the forced-closure orders produced by the liquidation engine can be absorbed smoothly by the market. The price decline is relatively linear, and the system has not yet entered an out-of-control state. Whether the trigger phase evolves into the more serious propagation phase depends on one key dynamic balance: whether the selling pressure from the first wave of liquidations exceeds the market's normal absorption capacity. If market depth is sufficient to take on this selling, the shock is dissolved in this phase; if the selling pressure is too great, the system inevitably slides into the next phase. In terms of the LIAR indicator introduced in this chapter, the trigger phase corresponds to the range in which LIAR is still greater than 1—that is, market depth can still take on the liquidation selling pressure. What distinguishes an event that dissolves on its own in the trigger phase from one that ultimately evolves into a systemic cascade is whether the first round of liquidations pushes LIAR below the critical value. Historical data show that in the "yen carry-trade unwind" of August 2024 LIAR briefly fell below 1 in the trigger phase and then quickly recovered, whereas in the "10.10 event" of 2025 LIAR, once it fell below 1, kept accelerating downward and never turned back.
11.5.2 The propagation phase
To quantitatively assess the critical point of phase transition, we introduce a core decision variable: the liquidation-impact absorption rate (LIAR). The design advantage of LIAR is that it integrates both the demand side (liquidation volume per unit time) and the supply side (available order-book depth) of the liquidity equation, making it a more comprehensive measure of system stress than a bare open-interest/market-cap ratio or a simple depth indicator.
LIAR = available order-book depth within a specific price range / liquidation volume per unit time
When LIAR > 1, the market has enough liquidity to absorb the current liquidation shock. Although the price may fall, its rate of decline is relatively controllable, and the liquidation cascade tends to converge. When LIAR < 1, however, liquidation volume has overwhelmed the market's immediate absorption capacity. At this critical point, the price begins to accelerate downward, the divergence condition of the liquidation reflexivity equation described in Section 11.3 is satisfied, and the positive-feedback loop is formally activated. The system state undergoes a jump into the highly destructive amplification phase. LIAR is essentially a real-time phase-diagnostic indicator, not a forward-looking warning signal. By the time LIAR falls below 1, the cascade is already under way, and the collapse of order-book depth is itself an endogenous product of the liquidation process rather than an exogenous condition independent of it. LIAR's denominator (available order-book depth) contracts sharply after liquidation begins as market makers withdraw their orders, which means the indicator reflects the current system state rather than the future trajectory. A truly forward-looking improved version should use estimated depth under a stress scenario (for example, assuming that X% of visible resting orders are withdrawn under the shock of adverse order flow, which is typical market-maker behavior when facing toxic liquidation flow) and compute the ratio of remaining depth to expected liquidation volume under that condition, so as to identify the system's fragility before a cascade actually begins.
The essence of the propagation phase is its contagiousness: the price decline caused by the first wave of liquidations does not stay in place but pushes the market price toward the next liquidation zone—potentially larger and more densely distributed—like the first link of a chain reaction, setting off a second and a third wave of liquidations. In this phase, the reflexivity loop between leverage and liquidation begins to replace fundamental information as the core force dominating the price's trajectory. The market's price movements are no longer driven by fundamental information but dominated by the leverage-clearing process. Figure 11-23 uses four panels to show, respectively, the dynamic evolution of price, open interest, per-minute liquidation volume, and the LIAR indicator across the full trigger-propagation-amplification-termination process (based on the data pattern of the 10.10 event of 2025).
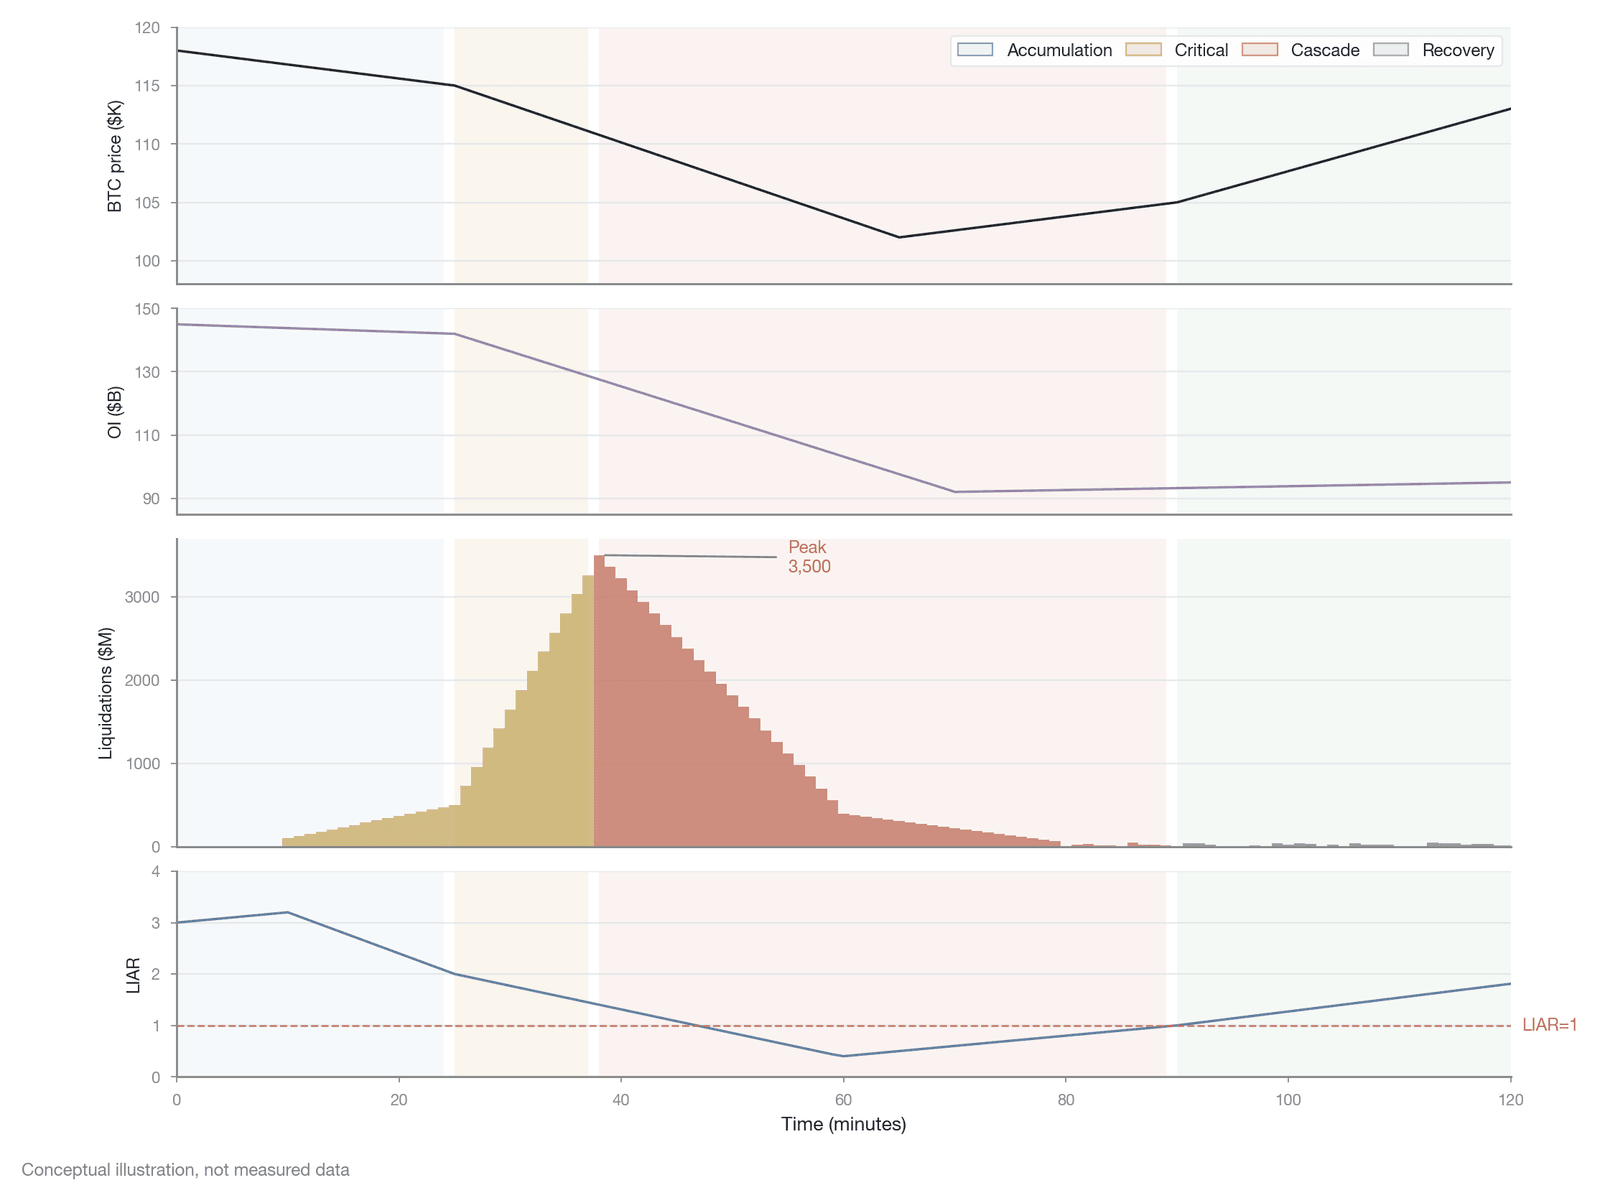
Figure 11-23. A four-phase dynamic model of the liquidation cascade (conceptual illustration: a stylized dynamic model by the author based on the data pattern of the "10.10 event" of 2025, not tick-by-tick empirical data)
11.5.3 The amplification phase
When LIAR stays below 1, the system enters the most destructive phase of the entire cascade: the amplification phase. Now a single loss spiral evolves into a resonant superposition of multiple amplification mechanisms, sharply magnifying what was a controllable risk into a systemic crisis, with multiple amplification mechanisms acting simultaneously and superimposing in resonance.
As liquidation orders continue to consume the buy orders on the order book mechanically, market makers, facing a sharply expanding risk exposure and extremely high uncertainty, choose to withdraw their quotes (i.e., "procyclical liquidity supply"). This causes order-book depth to fall sharply and bid-ask spreads to widen markedly. Subsequent liquidation orders face enormous slippage on execution, with actual fill prices far below the mark price. This slippage itself constitutes an additional huge loss that further erodes traders' margin and may even lead to bankruptcy (i.e., losses exceeding all posted margin). During the "Black Thursday" crash of March 2020, BitMEX's BTC perpetual futures briefly wicked to about $3,600 on March 13 (an instantaneous low at a single venue), a discount of about 12% to the spot price—an extreme manifestation of the liquidity vacuum [4].
The violent price fluctuations simultaneously trigger the "margin spiral" of the Brunnermeier and Pedersen model [8]. To control risk, an exchange's automated risk model may dynamically raise maintenance margin requirements or lower the collateral factor on collateral. This suddenly subjects positions that had been safe to margin-call pressure, forcing traders to close voluntarily. This active selling resonates with the liquidation engine's passive sell orders, jointly intensifying the market's selling pressure. Under a unified margin system this effect is especially pronounced: when the volatility metric rises sharply, the system automatically raises margin requirements for all instruments, subjecting a large number of previously safe positions to margin-call pressure at once.
Under the unified margin system, a plunge in one asset weakens the credit base of the entire account, forcing the liquidation of positions in otherwise unrelated assets. At the same time, arbitrageurs' behavior rapidly transmits the selling pressure of one exchange to the whole market, forming cross-exchange contagion. In addition, the liquidation of perpetual futures depresses the futures price and turns the basis negative, prompting arbitrageurs to sell spot (closing the spot long in their arbitrage position) and thereby transmitting the crisis from the derivatives market to the spot market, forming a cross-market reflexivity loop. This mechanism explains why, during a liquidation cascade, the spot market's decline is often highly synchronized with the derivatives market and can even exhibit the anomaly of spot leading the fall. Determining the causal direction between spot and perpetual futures during a cascade, however, requires rigorous lead-lag analysis methods (such as the Hasbrouck information-share model or the Granger causality test). In the 10.10 event, the causality was most likely two-way: the liquidation selling pressure of perpetual futures and the panic selling of the spot market reinforced each other, forming a closed positive-feedback loop, which makes clear causal attribution methodologically very difficult in the absence of high-frequency data decomposition.
The carrying capacity of infrastructure is far from a secondary technical constraint in cascade dynamics; it is one of the primary determinants of the cascade's trajectory. During an active cascade, which infrastructure component fails first (the API gateway, the liquidation queue, or the matching engine) determines the cascade's actual evolutionary path. In BitMEX's service outage of March 2020 (March 13), matching and liquidation stalled for about 25 minutes (officially attributed to a DDoS attack), producing an enormous gap between actual execution prices and theoretical trigger prices and thereby sharply amplifying bankruptcy losses [4]. Some exchanges are reported to have deliberately slowed their matching engines in extreme conditions, using this as a de facto circuit breaker. Although this practice may objectively have had a protective effect in curbing the cascade, it raised serious questions of market fairness, because it constituted an implicit intervention that gave some participants (for example, institutions able to trade through over-the-counter channels) an asymmetric advantage over retail traders who depend on the exchange engine. Infrastructure capacity is therefore not merely an engineering problem but a key variable determining whether a cascade is contained within a controllable range or evolves into a catastrophic collapse.
In extreme conditions, an exchange's trading engine may lag, API responses may slow, and the front-end interface may fail to load. Traders cannot add margin, adjust positions, or set stop-losses in time. More seriously, the liquidation engine itself may become congested as requests surge, delaying liquidation execution. During the delay, the price has often already fallen to a lower level, further amplifying the actual loss.
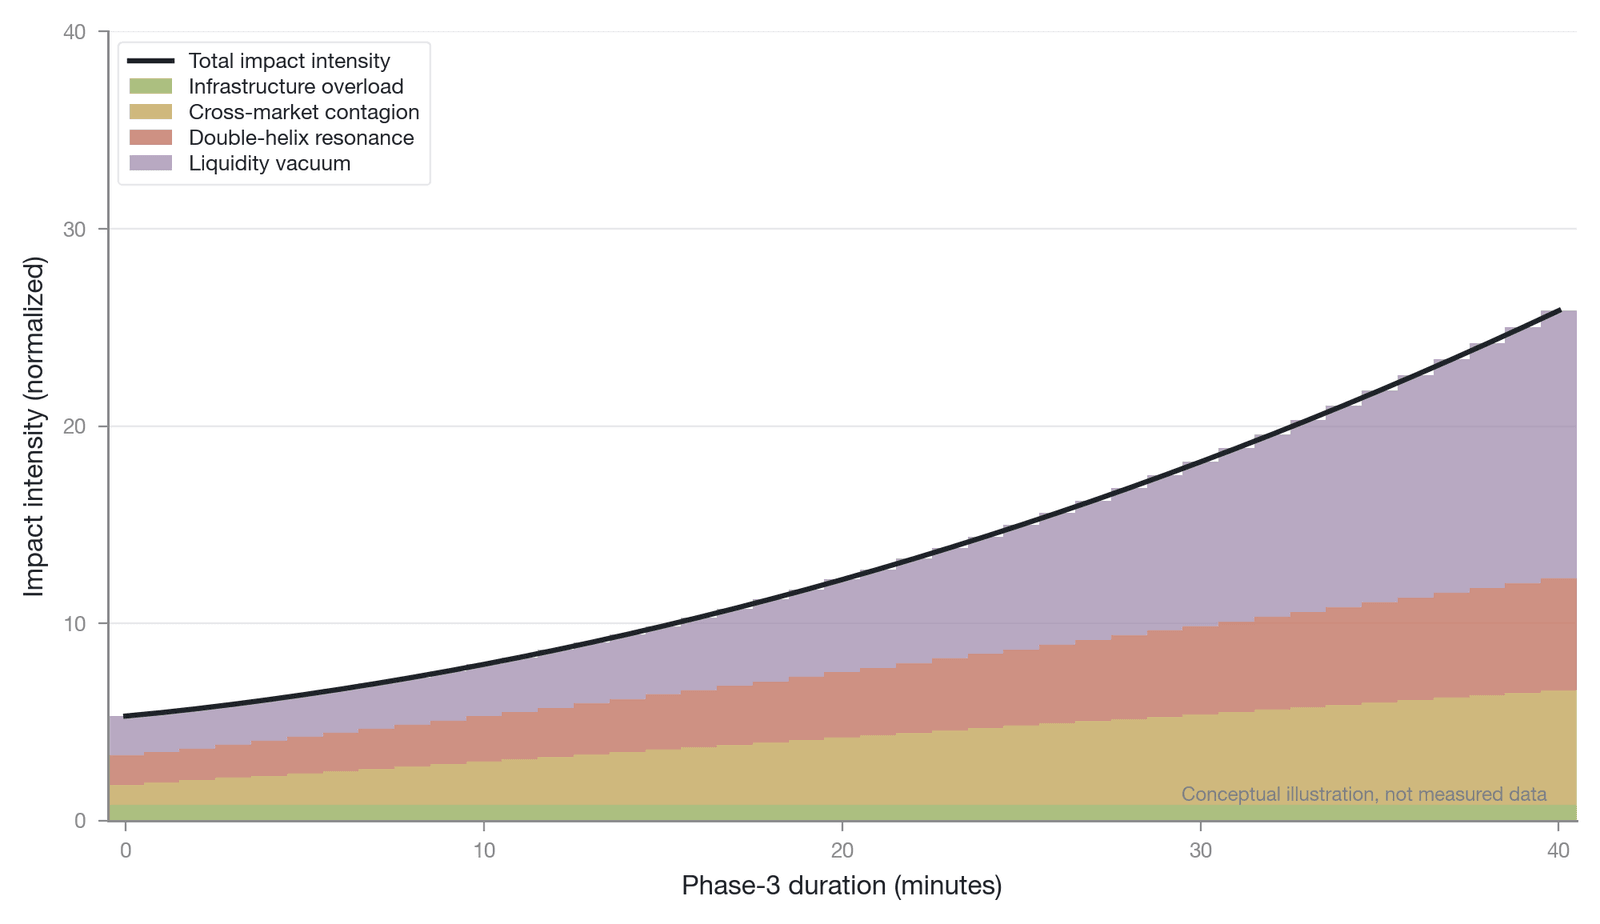
Figure 11-24. The resonant superposition of four mechanisms in the amplification phase (conceptual illustration, not empirical data)
To clearly delineate the risk level the system is in, we can divide the interaction state of the perpetual futures and spot markets into three categories, as shown in Table 11-6. This classification framework helps to assess in real time whether the market is sliding from a normal state toward a dangerous one.
| Market state | Basis characteristics | Arbitrage activity | Feedback type | Order-book depth behavior | LIAR indicator |
|---|---|---|---|---|---|
| Normal state | Narrow fluctuation (< 0.1%) | Active, full absorption | Negative feedback, self-correcting | Ample, normal level | > 2.0 |
| Stress state | Significant widening (0.1%–0.5%) | Under pressure, partial withdrawal | Positive feedback beginning to appear | Declining, down 30%–60% | 0.5–1.0 |
| Extreme state | Violent deviation (> 0.5%) | Withdrawal, near standstill | Positive feedback fully out of control | Evaporation, more than 90% gone | < 0.2 |
Table 11-6. Three interaction states of the perpetual futures and spot markets (Data source: compiled by the author)
11.5.4 The termination phase
A liquidation cascade does not continue indefinitely. Once the market has passed through this violent phase, it enters the termination phase. A cascade, however, usually ends not because the market has found a new fundamental equilibrium but because the leverage available to be liquidated has already been exhausted. This is a violent but effective forced-deleveraging mechanism.
The termination of a cascade is usually the joint work of several mechanisms. Among them, leverage clearing is the most natural way to terminate. Once the vast majority of high-risk leveraged positions have been force-closed, subsequent price declines can no longer trigger enough new liquidation volume. At this point, selling pressure drops abruptly, the LIAR indicator recovers back above 1, and the loss spiral stops operating. During this process, market-wide open interest falls sharply. In the "10.10 event" of 2025, according to Amberdata, open interest in crypto perpetual futures fell from a peak of about $146.6 billion to a trough of about $109.9 billion (a peak-to-trough decline of about −25.03%; this basis is Amberdata's aggregate perpetual OI across the venues it covers, accessed on June 23, 2026), marking a large-scale clearing of leverage [2].
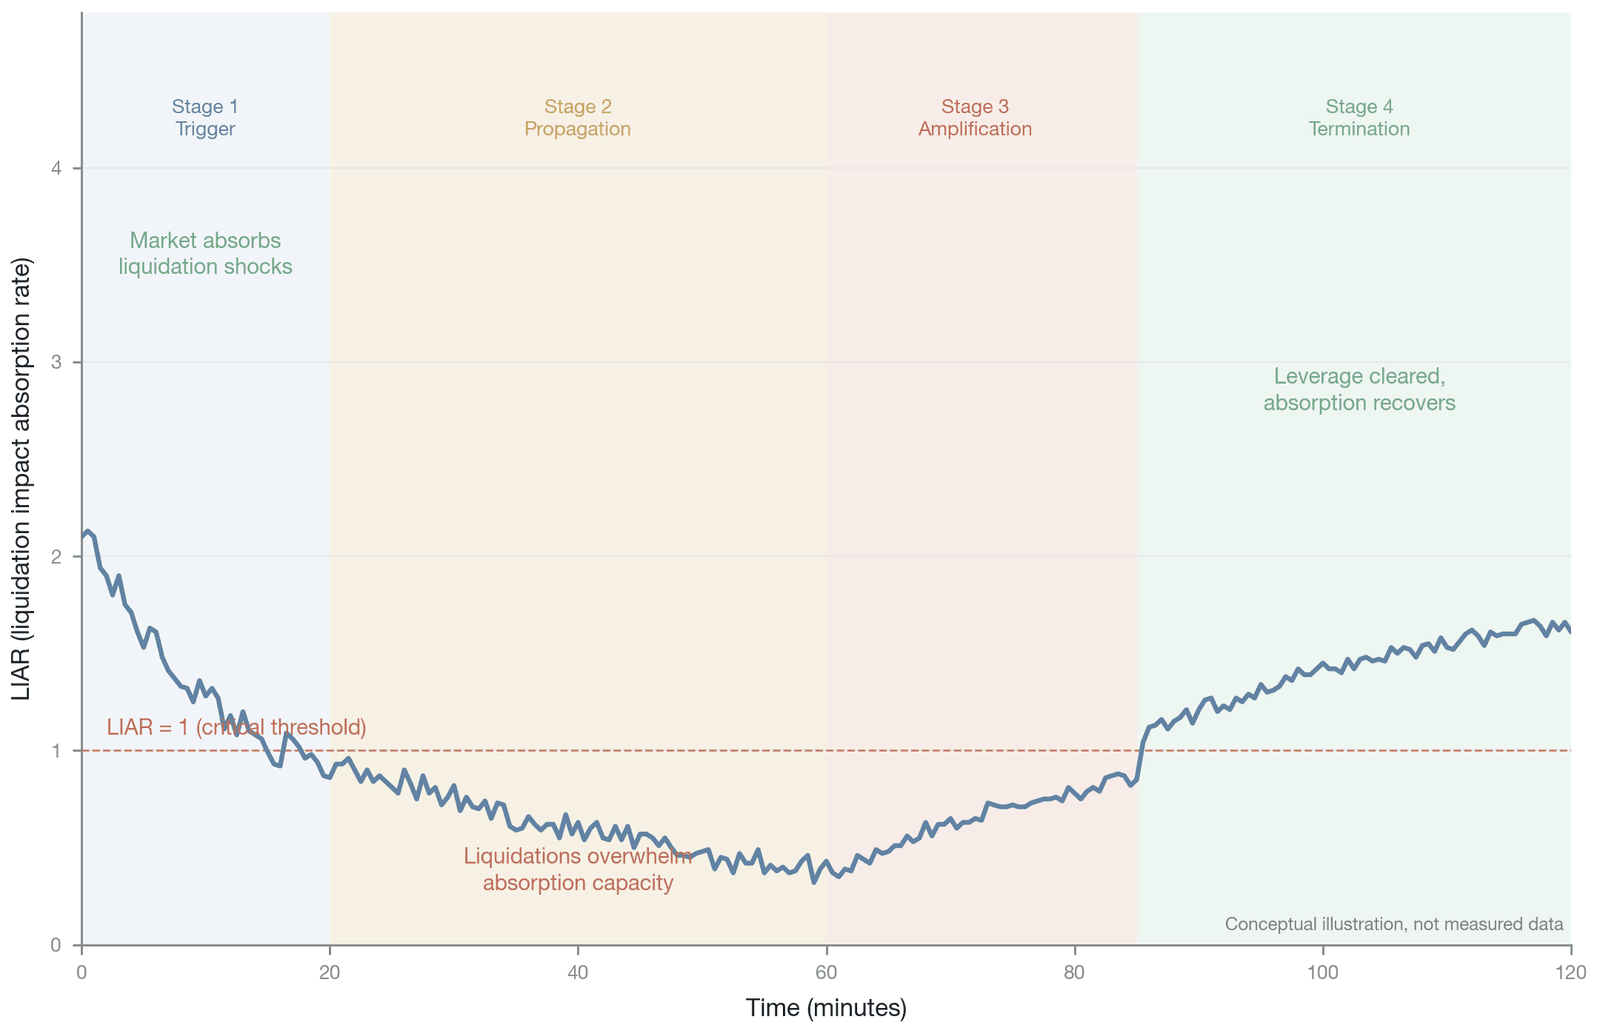
Figure 11-25. The dynamic evolution of LIAR across the four phases of a liquidation cascade (LIAR is an indicator constructed by the author; conceptual illustration, not empirical data)
As the figure shows, LIAR falling below 1 marks the activation of the reflexivity loop (the propagation phase), remaining below 0.2 marks the extreme state of the amplification phase, and recovering back above 1 marks the termination of the cascade.
When the price falls, driven by irrational liquidation selling, far below the fair value recognized by long-term investors, the entry of external buying also helps the market stabilize. These value investors provide deep absorbing liquidity that effectively soaks up the remaining liquidation selling pressure. In on-chain markets, this phenomenon manifests as the on-chain behavior of "whale addresses" buying heavily at the bottom of a crash. On-chain data analysis can track the fund flows of these large addresses in real time, and when a cohort of addresses holding more than 1,000 BTC shows accelerating net inflows during a rapid price decline, it often foreshadows the formation of bottom-absorbing force. This contrarian buying by "smart money" provides a natural price floor for panic selling.
The termination of a cascade also has a behavioral dimension that goes beyond mechanical leverage clearing. Panic selling follows a specific temporal pattern (an initial freeze response, then concentrated selling, and finally the exhaustion of the capacity for emotional selling), a process that runs independently of the mechanical liquidation cycle. Defining all whale-address buying at the bottom of a cascade as the value investing of "smart money" warrants careful critical scrutiny: some large-address activity at a cascade's bottom involves strategic price manipulation (buying to trigger a short squeeze), the release of social-media signals (publicly announcing purchases to influence market sentiment), or the building of reputational capital, rather than a deep judgment about the asset's fundamental value. The actual bottoming process often passes through a vacuum period in which no effective two-sided market exists—neither sufficient buy-side liquidity nor sustained sell-side pressure—and the market gradually finds a temporary equilibrium amid extremely shrunken trading volume.
Moreover, the narrative of orderly value buying at the bottom of a cascade contradicts the actual execution environment in significant ways. During an active cascade, an exchange's API interface frequently becomes unresponsive or imposes strict rate limits, making order submission extremely difficult or even impossible. Deposit and fund-transfer mechanisms may be suspended, preventing new capital from entering the market. Extreme bid-ask spreads (peaking at 26.43 basis points in the 10.10 event) mean that any buy order submitted as a market order will suffer enormous slippage losses. Most critically, professional market makers choose to withdraw rather than enter during a cascade, because the adverse-selection problem of liquidation flow is extremely severe, and any buy order resting on the order book is systematically eaten by the continually declining forced sell orders. A true bottom often forms in a vacuum period in which neither side provides meaningful liquidity, rather than through an orderly handoff from forced sellers to voluntary buyers.
An exchange's manual intervention can likewise arrest a cascade. In extreme cases, an exchange may take various intervention measures, such as temporarily raising maintenance margin requirements to suppress the impulse to open new leverage, or, in some highly contested cases, triggering a brief circuit breaker (suspending trading) to stem the spread of panic. Some exchanges also temporarily lower the maximum leverage multiple or impose trading restrictions on specific contracts.
After bankruptcy losses exhaust the insurance fund, auto-deleveraging is activated as the final resort, force-closing the positions of profitable parties to cover the bankruptcy losses and preserve system solvency (its ranking mechanism and fairness disputes are detailed in Section 11.6.3). The large-scale triggering of ADL usually marks the end of the most dangerous and chaotic phase of a liquidation cascade.
Viewed from the standpoint of system dynamics, the entire four-phase process reveals a clear regularity: the destructiveness of a liquidation cascade depends not primarily on the size of the trigger shock but on the degree of fragility of the system before the shock arrives. A system long eroded by extreme funding rates, with very high leverage density and a highly concentrated liquidation-dense zone, can erupt into a devastating cascade even in the face of a tiny exogenous disturbance. Conversely, a system with moderate leverage, a dispersed liquidation distribution, and ample liquidity can smoothly absorb even a large exogenous shock. This is precisely the core proposition this chapter has repeatedly stressed: the reflexivity of leverage and liquidation is the most important source of endogenous risk in the crypto derivatives market.
11.6 The impossible trinity of liquidation design
In on-chain derivatives and crypto-asset perpetual futures markets, the liquidation mechanism is the last line of defense for maintaining system solvency. Unlike traditional financial markets, which handle risk through a clearinghouse's default waterfall and manual intervention, liquidation in crypto markets relies entirely on preset algorithms and smart contracts. This algorithmic character means that the design of the liquidation mechanism faces severe trade-offs. Research shows that a strict mathematical boundary exists within automated deleveraging and liquidation mechanisms: the "impossible trinity of liquidation design" [18].
11.6.1 The three design objectives
In designing a liquidation engine, any exchange or DeFi protocol tries to achieve the following three core objectives simultaneously:
The optimal-execution theory of Almgren and Chriss shows that executing a large order involves a fundamental trade-off between market impact and timing risk [19]. The design of a liquidation engine faces essentially the same dilemma, but under harsher constraints, because liquidation must be completed in an extremely short time and cannot choose its timing. Against this backdrop, the conflict among the three design objectives becomes especially sharp. Certainty means the liquidation mechanism must be able to ensure that the system remains solvent under any extreme market condition—that is, when a trader's account equity falls below the maintenance margin requirement, the system must be absolutely certain of being able to close the position and prevent bad debt (bankruptcy); this is the cornerstone of an exchange's survival, and a lack of certainty leads to systemic insolvency. Impact minimization means the negative effect of liquidation on market price and liquidity should be as small as possible, because large-scale forced closures release enormous selling (or buying) pressure into the market, drive the price further from fundamentals, and can thereby trigger the liquidation of more accounts in a "positive-feedback loop"; impact minimization therefore requires the liquidation engine to digest risk positions smoothly. Fairness means the liquidation process should be fair to all market participants and, in particular, must not deprive innocent traders (such as profitable ones) of their legitimate gains without cause; in an ideal state, risk should be borne by the party that took it on (the liquidated party) or absorbed by a system-established insurance fund, rather than arbitrarily shifted to other participants in the system.
11.6.2 The conflict among objectives
There is a deep structural conflict among these three objectives that makes it impossible to achieve all of them perfectly in a single mechanism at the same time. Recent theoretical research on auto-deleveraging mechanisms has even given a formal proof of an impossibility theorem from the perspectives of game theory and mechanism design [18].
The conflict between certainty and impact minimization is the most intuitive. To guarantee 100% certainty, the system often needs to sell all positions at market immediately when liquidation is triggered. This cost-agnostic selling, however, inevitably causes an enormous market impact. Conversely, if the system chooses to process positions slowly and in batches to minimize impact, then in extreme conditions of violent price fluctuation this delay may cause a position to go bankrupt before it is fully closed, thereby undermining certainty.
At the same time, the conflict between certainty and fairness is especially prominent in extreme conditions. When routine liquidation cannot be executed and the insurance fund is exhausted, the system's only option to preserve its own certainty (avoiding insolvency) is to activate auto-deleveraging, forcibly closing profitable traders' positions to cover the losing side's bad debt. Although this preserves the system's certainty, it severely harms the fairness owed to profitable traders, forcing them to bear a risk that was never theirs.
Further analysis shows that the conflict between impact minimization and fairness manifests in the process of risk transfer. If, to avoid slamming large positions directly onto the market (impact minimization), the system chooses to transfer these positions to specific liquidity providers or market-making vaults, it is in effect concentrating unknowable tail risk onto that group of participants. When the market keeps deteriorating, these backstops may face a devastating blow, which is essentially also an unfair allocation of risk to a specific group.
Notably, this impossible trinity is not a wholly new discovery of crypto markets. The central counterparty (CCP) clearinghouses of traditional financial markets face the same fundamental tension in their mechanism design among certainty, impact minimization, and fairness (Duffie and Zhu, 2011 [20]; Pirrong, 2011 [21]). A CCP absorbs losses layer by layer through a default-waterfall mechanism and, under the constraints of a legal framework, achieves relatively clear rules for risk allocation (the layered structure of the central counterparty and the default waterfall is discussed in Chapter 1). The crypto derivatives market, however, faces harsher constraints on three dimensions. First, there is no legal-level loss-mutualization framework: a traditional CCP's loss-sharing mechanism relies on legally binding agreements among clearing members and on regulatory authorization, whereas the relationship between a crypto exchange and its users is established only through terms of service, lacking an equivalent legal basis for multilateral risk mutualization. Second, there is no central bank as a lender of last resort providing liquidity support: when a traditional CCP faces systemic pressure, the central bank can inject liquidity through emergency lending facilities to prevent cascading defaults, whereas the crypto market has no equivalent external liquidity-injection mechanism. Third, the time scale of margin calculation is compressed from a traditional CCP's intraday or overnight settlement to real-time, position-by-position updates, so that the entire process from detecting a shortfall to executing liquidation is compressed from hours to milliseconds, largely eliminating any possibility of manual intervention or mediation.
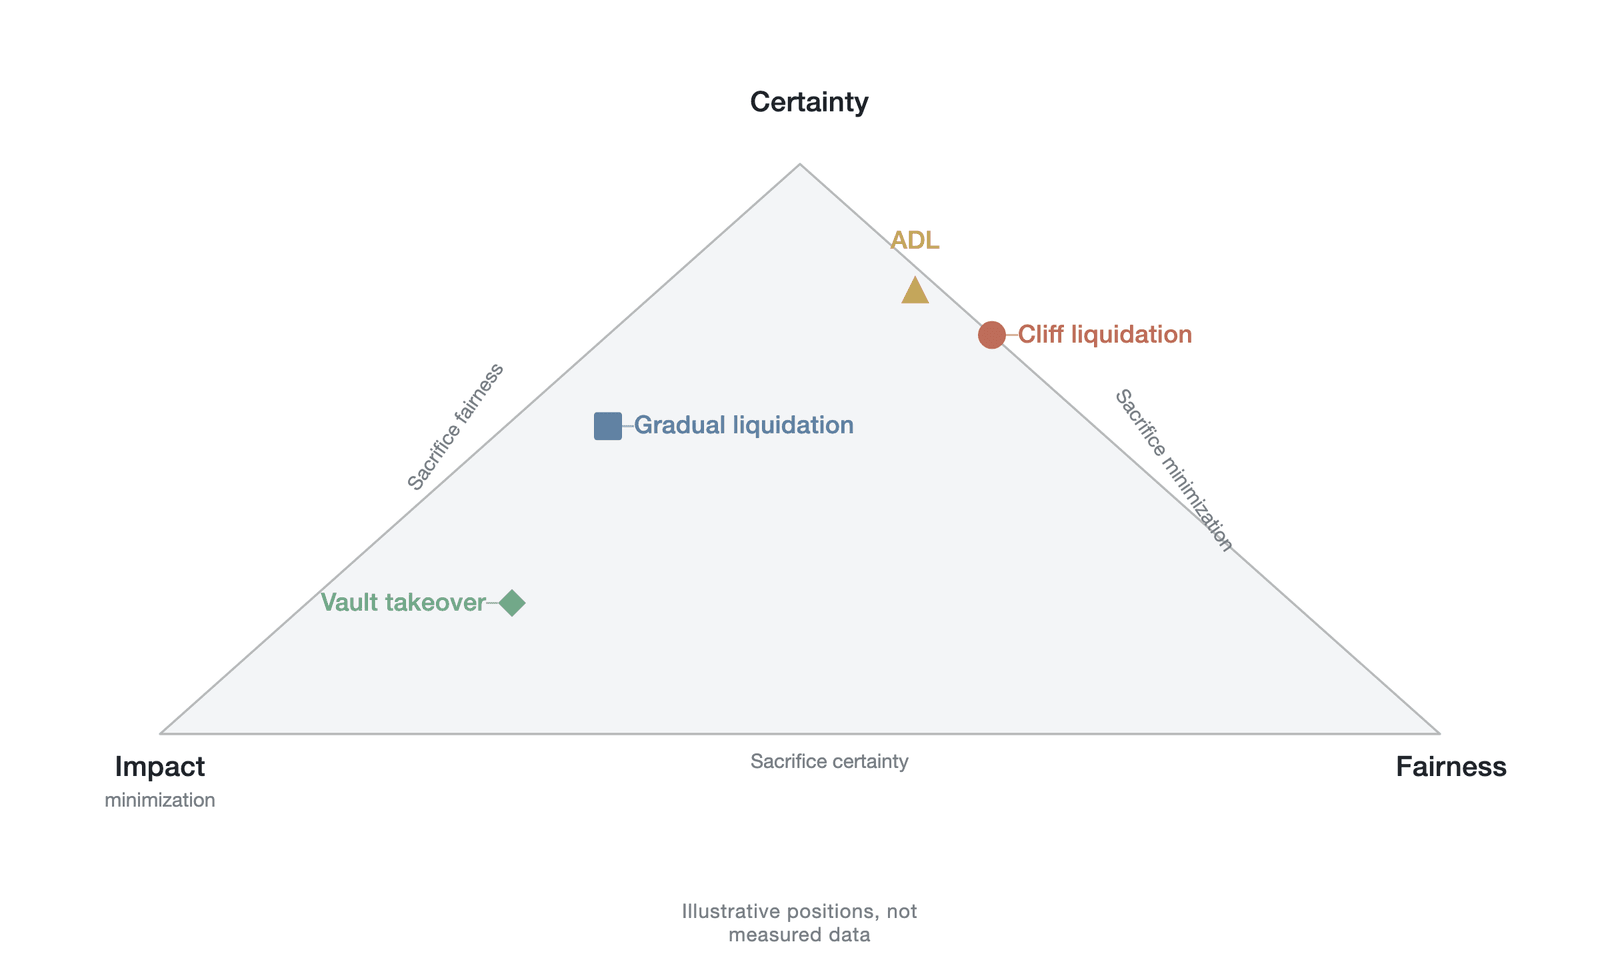
Figure 11-26. The impossible trinity of liquidation design—the positioning of the four liquidation modes (conceptual illustration, not empirical data)
11.6.3 The four liquidation modes
Faced with the impossible trinity, different exchanges and protocols make different trade-offs according to their own positioning and technical architecture, giving rise to four typical liquidation modes:
Cliff-edge liquidation is common at early crypto exchanges and some DeFi protocols (the mechanism is detailed in Section 11.1.3). It strikes a balance between certainty and fairness: it strictly follows the principle that "whoever defaults is liquidated" and executes decisively, but at the cost of abandoning impact minimization entirely, so it readily triggers a deep price cliff and a liquidation cascade when liquidity is scarce. Progressive liquidation is adopted by most modern centralized exchanges, exemplified by Binance and OKX (the mechanism is detailed in Section 11.1.3) [22]. It reduces positions by a fixed proportion or in a stepped fashion, mitigating market impact to some degree and being relatively fairer to the liquidated party, but it also sacrifices some certainty (the price may keep deteriorating and drive the remaining position into bankruptcy). The vault-backstop mode is a new mode that has emerged in recent years at decentralized perpetual futures exchanges such as Hyperliquid (the mechanism is detailed in Section 11.1.3) [23]. It transfers liquidated positions to a market-making vault composed of liquidity providers (such as the HLP vault) to be digested gradually, achieving impact minimization to a great degree but severely sacrificing fairness, because vault investors are forced, without their knowledge, to bear the tail risk of high-leverage traders' high-risk assets. Auto-deleveraging is the extreme mechanism that exists as the last line of defense (the mechanism is detailed in Section 11.1.3): when bankruptcy has already occurred and cannot be covered by routine means, the system forcibly closes the positions of the profitable side, ranked by "most profitable, highest leverage," to hedge the bad debt, pushing certainty to the extreme at the cost of shattering fairness completely. In the extreme conditions of October 10, 2025, research shows that Hyperliquid triggered the first cross-margin auto-deleveraging in its operating history, of which about $653 million was overshoot beyond the actual bankruptcy shortfall (about $23 million), corresponding to an additional loss of about $45 million to $52 million for profitable traders [18] (this quantitative conclusion comes from Chitra's preprint and awaits cross-validation against on-chain data and peer review). The judgment of "overuse," however, requires further precision. Key questions include: at the moment ADL was triggered, did the insurance fund still have sufficient solvency to cover the bankruptcy losses? Did the ADL ranking algorithm (usually a weighted ranking based on profit percentage and effective leverage) have a bias in actual execution? Were the threshold parameters that trigger ADL adequately calibrated and backtested in advance? The answers to these questions will determine whether the event's nature is an inherent flaw in the system design or a technical error in parameter calibration. From a legal standpoint, in traditional financial markets forcibly closing a position that is correct in its directional judgment and in a profitable state would immediately provoke legal challenges; the losses to the profitable side caused by the overshoot above constitute quantifiable, concrete damages, and affected traders would in principle have the right to claim compensation. The adequacy and legal validity of the risk disclosure about the ADL mechanism in the exchange's terms of service will be the core factor determining the ultimate direction of this dispute.
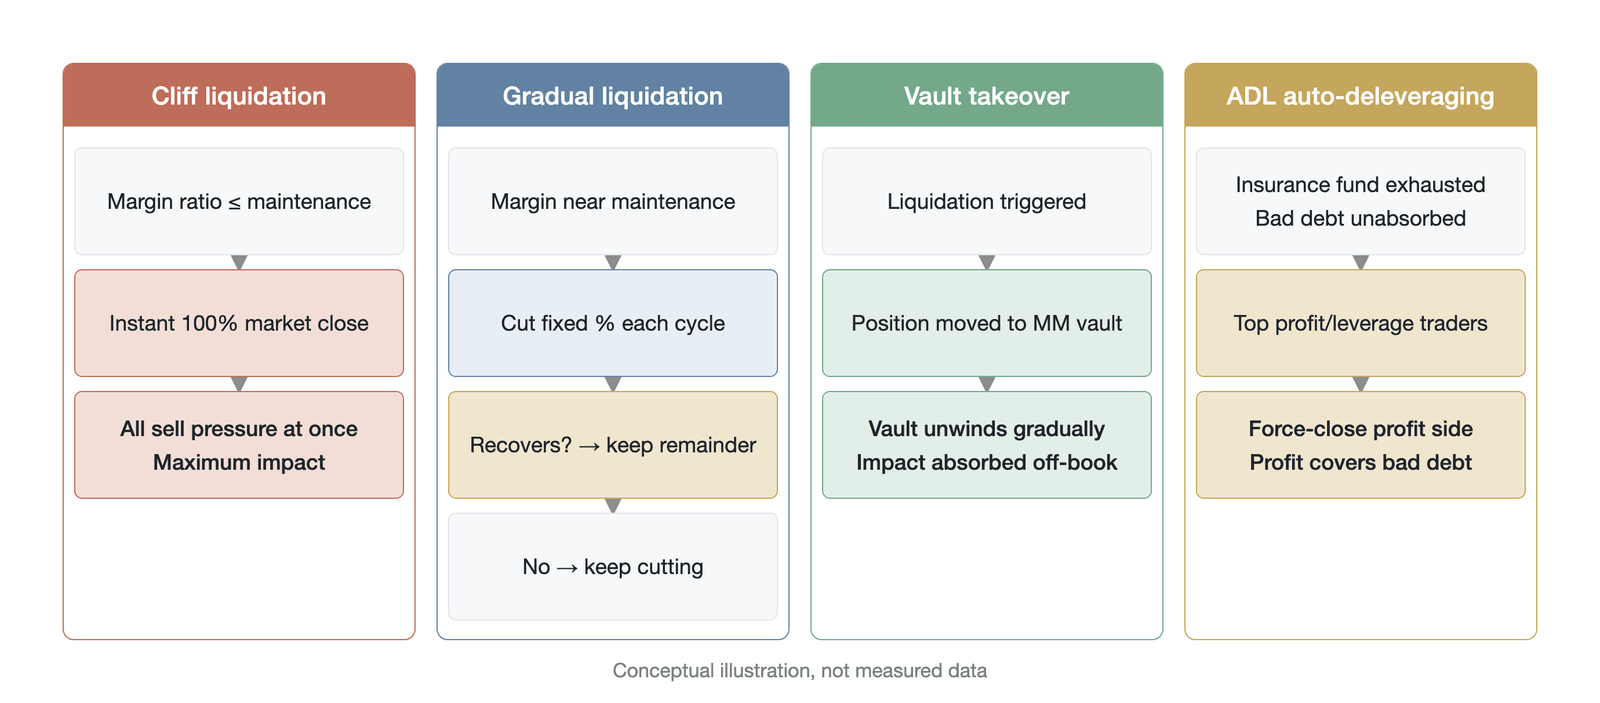
Figure 11-27. Comparison of the execution processes of the four liquidation modes
11.6.4 Strategic liquidation
The inherent design flaws of the liquidation mechanism often give rise to an attack behavior known as "strategic liquidation." Attackers exploit the mechanical nature of the liquidation engine, deliberately manipulating the price to trigger others' liquidations and profiting from it. The feasibility and manifestation of this attack differ across liquidation modes.
Under cliff-edge liquidation, strategic liquidation is most feasible: an attacker need only commit a relatively small amount of capital to push the price to a key support/resistance level, triggering large-scale liquidation orders that then self-reinforce and drive the price far from fair value, so that the attacker can buy at the low and reap a rich profit. By contrast, under progressive liquidation, because positions are released in batches, an attacker must apply continuous pressure to sustain the liquidation cascade, which markedly raises the cost of the attack and lowers the expected profit potential. The common feature of these two attack modes is that the attacker triggers the mechanical response of the liquidation mechanism through direct price manipulation, differing only in the force required and the duration.
Under the vault-backstop mechanism, the attack vector of strategic liquidation shifts from price manipulation to risk offloading, evolving into "attacking the vault." For example, in the Hyperliquid whale incident of March 12, 2025, a whale trader deliberately built a huge high-risk position and triggered liquidation by withdrawing margin, causing the HLP vault to bear a loss of about $4 million and setting off a subsequent panic withdrawal [24]. The JELLY incident on the 26th of the same month was another, more complex kind of attack: the attacker used the external spot market and oracle transmission to force the HLP vault to take on the short risk of a memecoin, with a peak unrealized loss of about $12 million to $13.5 million, which ultimately turned into a small surplus or a limited loss after validators intervened. Both incidents exploited the structural exposure of the vault to absorbed risk, but their attack paths and profit-and-loss bases differed. Under the ADL mechanism, strategic liquidation manifests as a more insidious distortion of participant behavior: fearing being force-closed by the system, profitable traders may close early or deliberately lower their leverage to avoid the ADL ranking, and this preventive "ADL-avoidance" behavior drains liquidity from the market and instead hastens the market's collapse. Attacks under the vault-backstop and ADL modes both essentially exploit structural loopholes in the risk-redistribution logic of the liquidation mechanism, achieving the attack's aim by distorting the system's incentives; the JELLY-style path additionally layers on external price manipulation and oracle transmission.
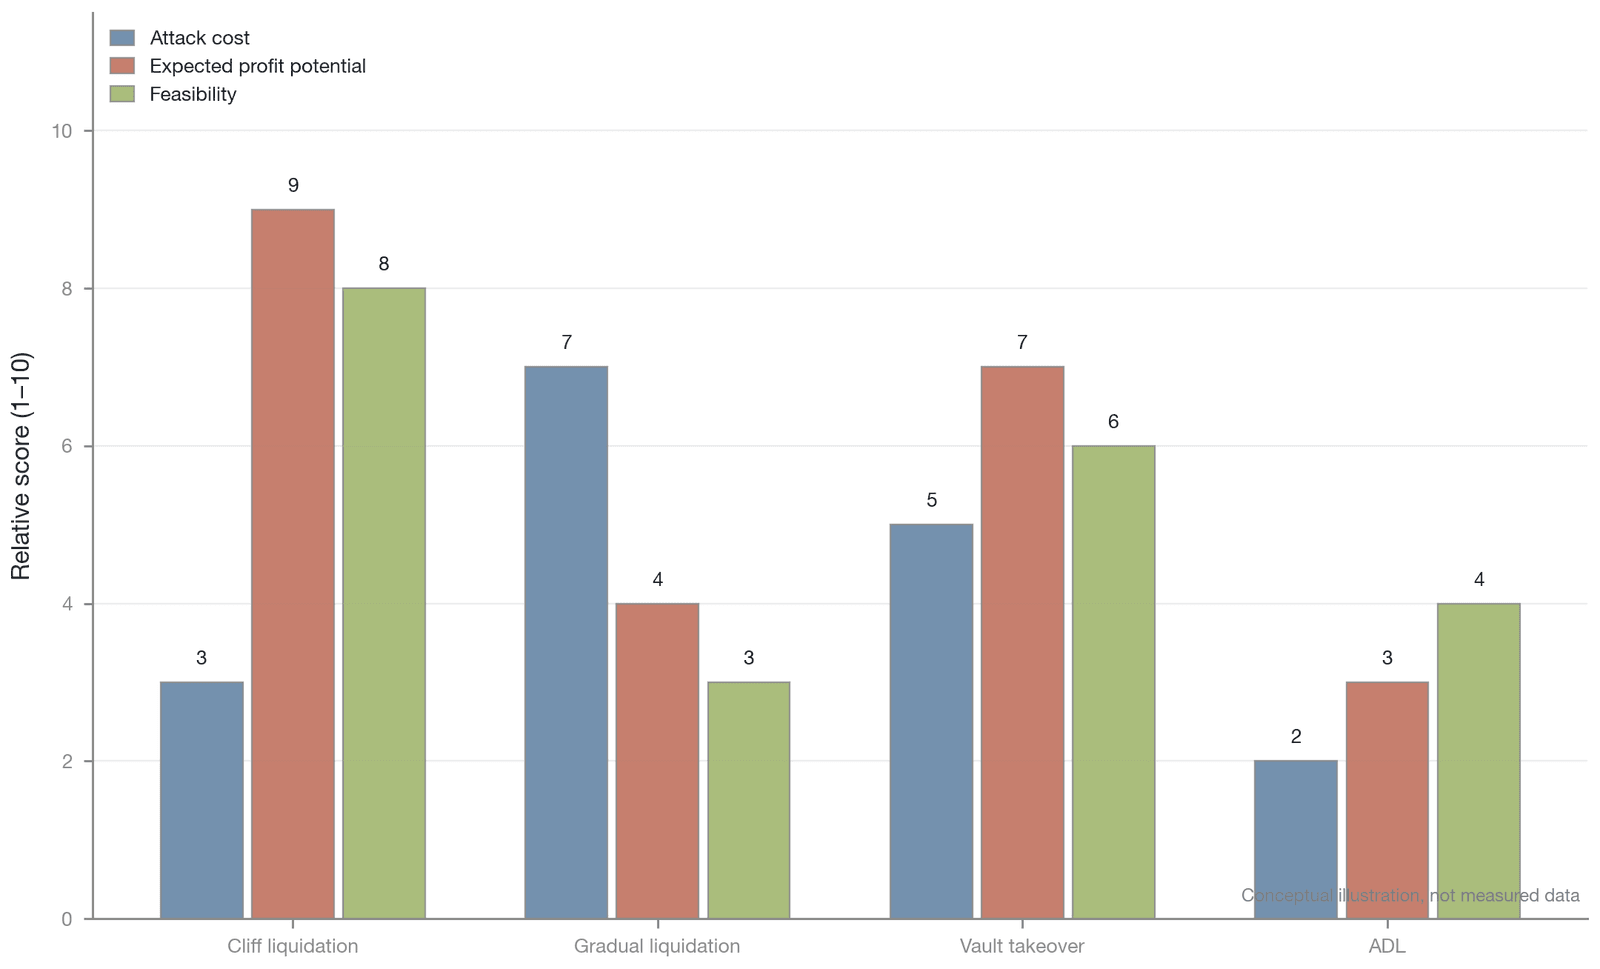
Figure 11-28. Comparison of the cost, profit, and feasibility of strategic liquidation across the four modes (conceptual illustration; qualitative relative values; not empirical data)
The comparison in Figure 11-28 shows that as the liquidation mode evolves from cliff-edge to vault-backstop, the direct feasibility of strategic liquidation declines, but the attack vector shifts from price manipulation to offloading risk onto the vault. Under the auto-deleveraging mode, the form of strategic liquidation further evolves into a preventive distortion of participant behavior: the profitable side exits the market early to avoid being force-closed, which instead accelerates the contraction of liquidity. This finding shows that the choice of liquidation mode affects not only the system's immediate stability but also the long-run behavioral incentives of participants.
A game-theoretic analysis of strategic liquidation must incorporate the modulating role of legal deterrence as an external constraint. In traditional financial markets, deliberately manipulating the price to trigger others' liquidations falls within the scope of several legal frameworks: U.S. SEC Rule 10b-5 classifies it as a form of securities fraud, the EU Market Abuse Regulation (MAR) expressly lists market manipulation as a criminal offense, and the CFTC has already engaged in enforcement in the crypto space—for example, Avraham Eisenberg's strategic manipulation of Mango Markets in 2022 led to his arrest in December of that year and his conviction by a jury in April 2024 (although this criminal conviction was overturned by the Southern District of New York in May 2025, and only the civil suits by the CFTC and the SEC are currently proceeding—this reversal itself confirms the weakening of legal deterrence by anonymity and cross-jurisdictional arbitrage discussed below). These legal precedents show that legal deterrence markedly alters the game-theoretic equilibrium of strategic liquidation: in a pure game-theoretic model, a rational attacker will choose to attack as long as the expected payoff exceeds the execution cost; legal deterrence, by introducing an expected penalty cost (including fines, imprisonment, and reputational loss), raises the effective cost of the attack and thereby shrinks the parameter space of profitable attacks. This deterrent effect, however, is markedly weakened in crypto markets by anonymity and cross-jurisdictional arbitrage.
In the DEX environment, strategic liquidation faces a distinctive information-structure problem. Because all position data are recorded on a public blockchain, an attacker can precisely compute the liquidation price and maintenance margin level of every account and thus precisely trigger a target liquidation with minimal capital outlay. This "glass box" of complete information transparency contrasts sharply with the privacy of position information at a centralized exchange. On a CEX, an attacker can only roughly infer the location of a liquidation-dense zone through the liquidation heatmap or public aggregate data, whereas the on-chain visibility of a DEX removes this information barrier, making the planning and execution of strategic liquidation more precise and lower-cost.
11.6.5 The nested double trinity
The impossible trinity of liquidation design does not exist in isolation; it is in fact nested within the design trade-offs of the service-provider layer. Chapter 5's service-provider impossible trinity takes "performance, transparency, and decentralization" as its three vertices; for the purpose of characterizing the cross-layer transmission of liquidation and leverage, this section reparameterizes it, from the perspective of systemic risk, into the derived outer triple of "decentralization, capital efficiency, and security" (capital efficiency being expressed as the pursuit of high leverage and high performance, and security as the guarantee of solvency and verifiability) to constrain the inner liquidation trinity. There is a strong cross-layer tension between these two trinities.
The pursuit of capital efficiency inevitably leads platforms to offer higher leverage. High leverage means traders' safety cushion is extremely thin, which directly makes liquidation events more frequent and larger in scale. This forces the liquidation mechanism to tilt toward certainty in its design, thereby intensifying the conflict within the liquidation trinity. In other words, there is an almost unavoidable causal chain between capital efficiency and system fragility: for every order-of-magnitude increase in leverage, the density of the liquidation-dense zone grows superlinearly, and the squeeze the certainty constraint exerts on fairness and impact minimization intensifies accordingly.
At the same time, the pursuit of decentralization means the system lacks a centralized arbiter with an unlimited balance sheet (such as a traditional clearinghouse) to serve as a backstop. Without the possibility of external capital injection, the system can only resolve bankruptcy through internal rules (such as ADL), which inevitably touches the bottom line of fairness.
These factors point jointly to the conclusion that the pursuit of security requires the system to build a thick insurance fund or market-making vault to safeguard solvency. This inclines the system toward modes such as the vault backstop to achieve impact minimization. As noted above, however, this mode in fact concentrates and transfers risk, and once tail risk exceeds the vault's capacity, the system's overall security instead collapses in an instant. This nested relationship shows that risk management in the crypto derivatives market is an extremely complex systems-engineering problem, in which optimizing any single dimension can trigger unpredictable chain reactions in others.
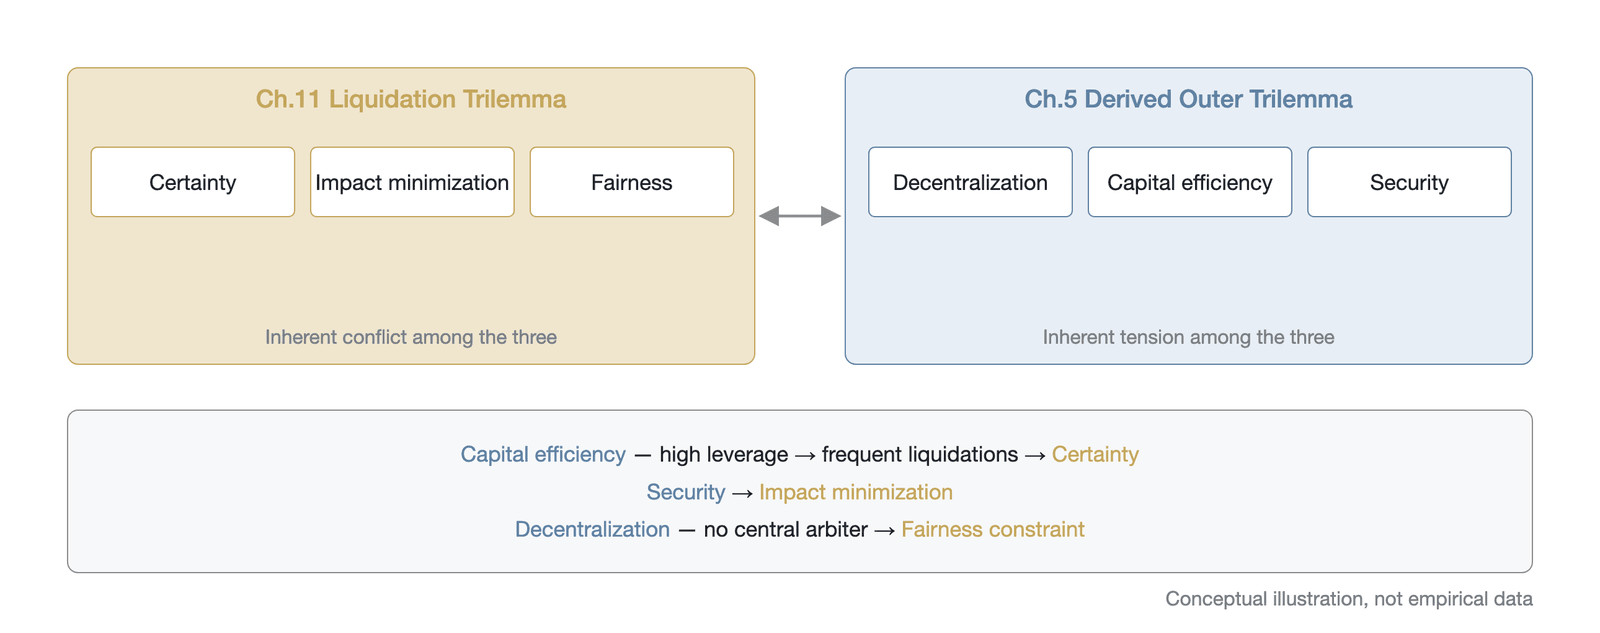
Figure 11-29. The nesting relationship between the impossible trinity of liquidation design and the service-provider impossible trinity (conceptual illustration; the outer trinity's decentralization/capital efficiency/security is a derived reparameterization of Chapter 5's service-provider impossible trinity from the perspective of systemic risk, not Chapter 5's original three vertices of performance/transparency/decentralization)
As shown in Figure 11-29, the parameter choices of the outer trinity (decentralization, capital efficiency, security) directly constrain the feasible region of the inner trinity (certainty, impact minimization, fairness): when the outer trinity tilts toward capital efficiency, the density of high-leverage positions rises, the inner trinity is forced to tilt toward certainty, and the space for fairness and impact minimization narrows in tandem. This nesting means that risk management in the crypto derivatives market is not a single-dimensional parameter optimization but a systems-engineering problem under multi-layer constraints.
The actual binding boundary of this impossible trinity is being reshaped by external regulatory forces, forming a dynamic process that might be called "regulatory reflexivity." The EU Markets in Crypto-Assets Regulation (MiCA) established the first comprehensive crypto-asset framework, but crypto derivatives themselves are excluded from MiCA and fall under the Markets in Financial Instruments Directive (MiFID II); the European Commission's 2026 review of MiCA is only beginning to examine crypto leveraged contracts and derivatives exposure (as of mid-2026 this remains a regulatory gap rather than an established leverage cap). The UK Financial Conduct Authority (FCA), meanwhile, expressly banned the sale of crypto derivatives to retail investors through PS20/10 (effective January 6, 2021), and Japan and Hong Kong have each set leverage caps. Against this trend, the 125x leverage offered by some exchanges relies to a great extent on regulatory arbitrage—that is, operating in jurisdictions that regulation has not yet reached or where enforcement is weak. Regulatory intervention itself, however, also faces a deep reflexivity paradox: if regulators choose to forcibly lower the maximum leverage or require additional margin during a period of high open interest, this consumer-protection measure may itself become a cascade trigger, as a large stock of positions opened at high leverage is forced to close under the new margin requirements, and the resulting concentrated selling pressure superimposes on the mechanical response of the liquidation engine, an effect dynamically isomorphic with a cascade triggered by an exogenous price shock. There is therefore an inherent conflict in the time dimension between the goal of consumer protection and the goal of preventing systemic risk: in the long run, lowering the leverage cap undoubtedly reduces system fragility; but in the choice of implementation timing, if it falls during a period of high leverage stock, the protective measure may itself create the very systemic crisis it seeks to prevent.
11.7 The time-compression effect
In traditional financial markets, deleveraging is usually a slow process measured in days, weeks, or even months. In the crypto-asset derivatives market, and especially the perpetual futures market, however, this process is extremely compressed to the level of minutes or even seconds. This "time-compression effect" not only fundamentally changes the dynamics of market microstructure but also renders the traditional risk-management paradigm ineffective in the face of crypto markets.
11.7.1 A cross-market comparison
By reviewing the major deleveraging events in financial history, we can clearly see this dramatic change in time scale.
In traditional finance, the 1998 collapse of Long-Term Capital Management (LTCM) took about three months to substantially complete its deleveraging and asset-liquidation process, with the Federal Reserve's intervention [25]. The financial tsunami triggered by the 2008 bankruptcy of Lehman Brothers took months to years to unwind its complex derivatives positions [26]. Even the high-leverage blowups of recent years, such as the 2021 collapse of Archegos Capital, took about three days to force-close its main positions [27]. In the 2022 UK pension liability-driven investment (LDI) crisis, facing a surge in UK gilt yields, pension funds took about two weeks to top up margin and sell assets [28].
In traditional markets, a standard margin call usually gives a trader T+1 to T+5 business days to replenish funds or close positions on their own. This time-buffer mechanism plays the role of a system stabilizer with a decisive influence on system stability. Take the 1998 LTCM crisis: within a single weekend, the Federal Reserve organized a consortium of 14 banks and, after a full three days of intensive negotiation, ultimately arranged $3.6 billion in rescue financing. This crisis-response process, centered on manual coordination, was extremely slow by the standards of crypto markets, yet it gave the parties ample room for information exchange and negotiation of interests, allowing a coordinated systemic rescue to be formed. This response mode, which relies on human intermediation, however, has no structural basis in a permissionless market: there is no central coordinator to convene the parties, no enforceable negotiation framework, and no legal force to bind the parties to honor rescue commitments.
By contrast, in the crypto derivatives market, during the "3.12" crash of 2020 the market's deleveraging was mostly concentrated within 24 hours. By the extreme liquidation event of October 10, 2025, according to market-data analytics firms, nearly $20 billion in leveraged positions were liquidated within a single day, as described at the opening of this chapter (see Section 11.9.2 for the complete microstructure data), while the most central destruction was concentrated within a 40-minute window, and the peak liquidation rate accelerated 86-fold above the normal level [2]. In this same crisis, according to Chitra's preprint, Hyperliquid's auto-deleveraging mechanism force-closed about $2.1 billion of positions within about 12 minutes (this was the first cross-margin ADL trigger in its operating history) [18].
From the months and weeks of traditional finance to the minutes and tens of seconds of crypto markets, the time scale of deleveraging has been compressed by roughly to times (this is a mid-range estimate based on a traditional typical of T+3 to a few weeks and a crypto typical on the order of minutes; taking the extreme endpoints of months → seconds yields about times, and days → minutes about times).
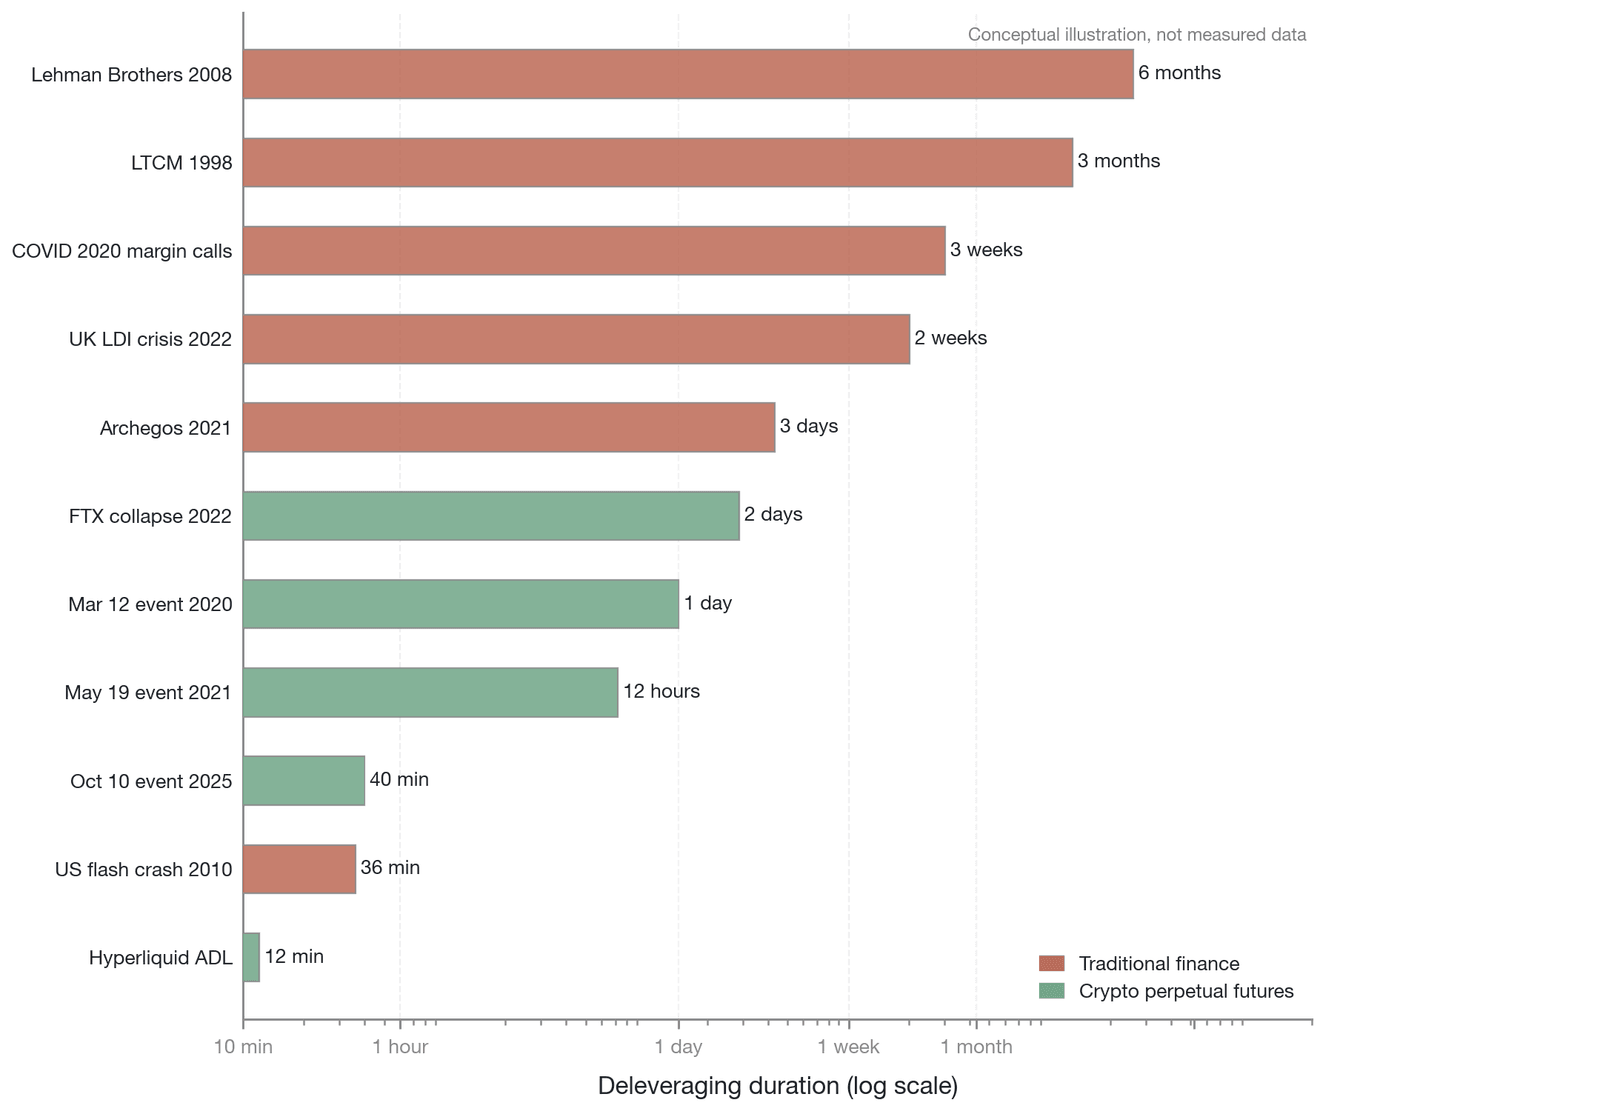
Figure 11-30. Comparison of the deleveraging timeline between traditional finance and perpetual futures (logarithmic scale; deleveraging durations are an illustrative comparison of typical orders of magnitude, not precise measurements)
11.7.2 Four driving forces
This extreme time compression is no accident but is jointly determined by the underlying architecture and rule design of the crypto derivatives market. Specifically, four core driving forces produce this phenomenon:
Around-the-clock operation with no buffer mechanism means the crypto market trades continuously, 24/7/365, with no close, no weekend break, and no official price limits or circuit breakers. There is also a fundamental difference between the price-anchoring mechanisms of perpetual futures and traditional futures: traditional futures have a hard, discrete anchor (delivery at expiry forces futures and spot to converge), whereas perpetual futures rely only on the funding rate as a soft, continuous anchor that can fail or even reverse under extreme stress (such as the funding-rate-reversal risk analyzed in Section 11.4), allowing a basis deviation to persist indefinitely in the absence of a hard delivery constraint, so that panic and liquidation selling pressure in a crisis cannot be cooled by a market close. Automated liquidation hard-codes the liquidation logic into the matching engine or an on-chain smart contract, and once the oracle price feed reaches the maintenance margin threshold, it triggers closure unconditionally within milliseconds, with none of the traditional market's room for manual notification, negotiation, and grace. The contagiousness of cross-margin arises because a unified account allows the paper profit of one asset to collateralize the loss of another, raising capital efficiency in calm times but, in extreme conditions, making portfolio risk determined by the highest-risk constituent asset—as in the October 2025 event, when the plunge of long-tail assets such as WLFI dragged down the account's overall margin ratio and triggered the forced sale of core assets such as Bitcoin and Ethereum [27], greatly accelerating the liquidation process. The transparent order book and the liquidity vacuum arise because liquidation lines can be precisely anticipated by professional market makers: foreseeing the arrival of large-scale liquidations, rational market makers instantly withdraw their buy orders to avoid "toxic orders," so that on October 10 the liquidity of key trading pairs evaporated by more than 99% within minutes and spreads widened by three orders of magnitude (see Section 11.9.2, Table 11-7) [2], and a small number of liquidation orders could cut through the remaining depth and trigger deeper liquidations.
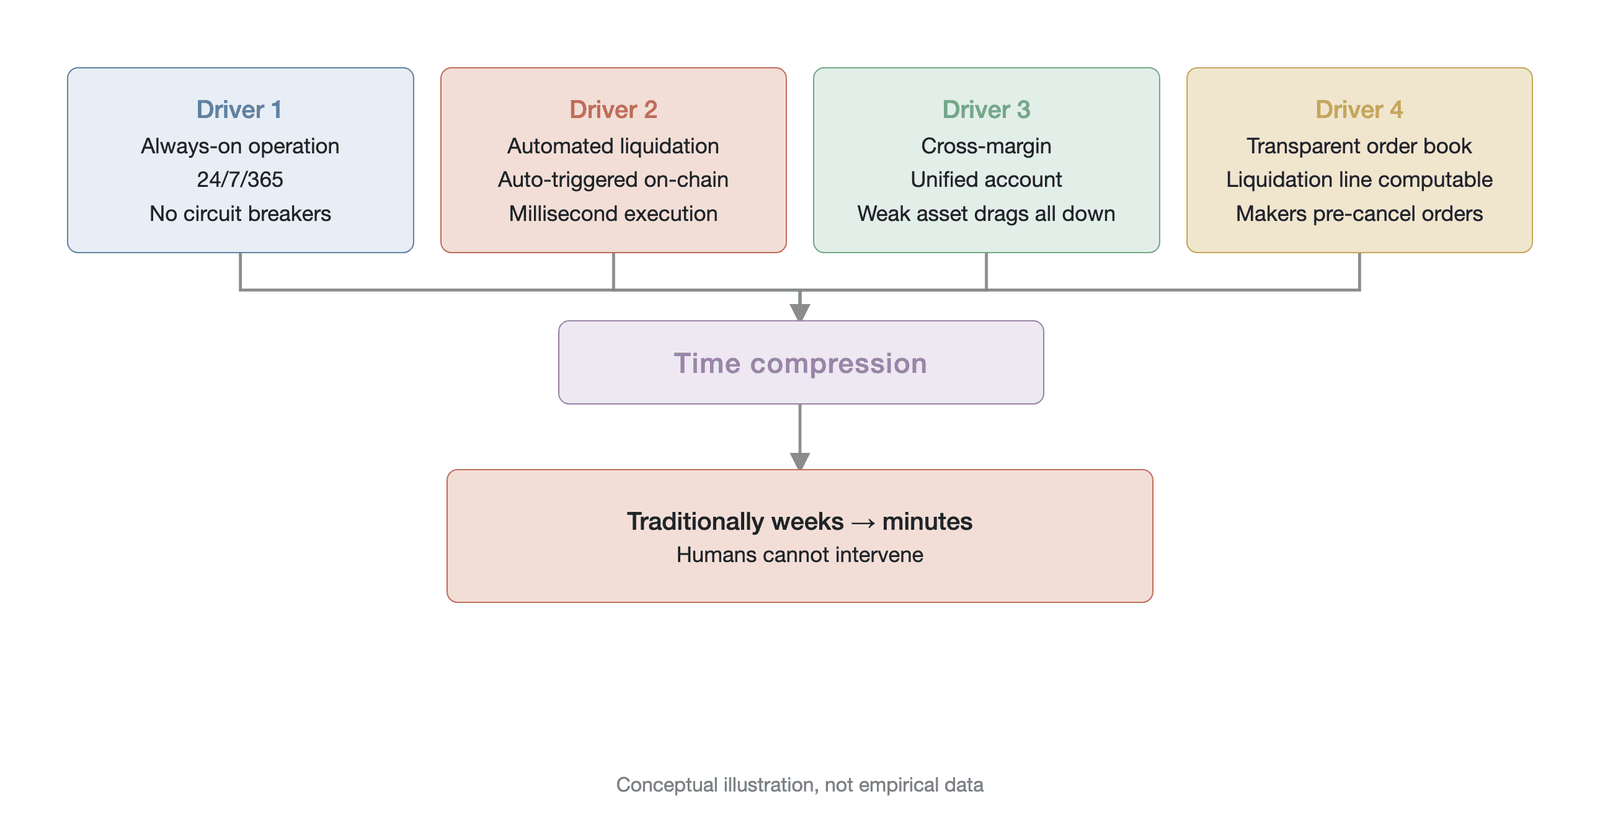
Figure 11-31. The four driving forces of time compression and their transmission mechanisms
11.7.3 The mismatch between decision-making and execution
The time-compression effect brings a serious consequence: a fundamental mismatch between the latency of human decision-making and the speed of machine execution.
In the traditional risk-control framework, after receiving an alert of abnormal market movement, a risk-management team must go through a series of steps—data verification, risk assessment, decision-making, fund allocation, and order issuance. Even for a top-tier, well-trained institution, this process takes at least tens of minutes to hours. Even an algorithmic trading firm that has deployed pre-programmed risk-control thresholds usually needs 30 to 60 seconds in extreme conditions to judge whether an abnormal move is a data error, a local exchange anomaly, or a genuine market event—and this delay already exceeds the entire duration of the most destructive phase of the 10.10 cascade crisis. We roughly estimate that a human risk-control team's ceiling for effective response and fund deployment in an emergency is about $50 million per hour.
As the October 10, 2025, event demonstrated, however, during the eruption of the liquidation cascade the system's equivalent liquidation rate reached $10.39 billion per hour; and within the peak 60 seconds it reached the extreme equivalent rate of about $192.6 billion per hour (this is the equivalent rate obtained by linearly extrapolating the peak-minute liquidation volume to an hourly basis; it lasted only about one minute and is not a sustainable rate). This means the speed of machine liquidation was hundreds or even thousands of times faster than the fastest human response.
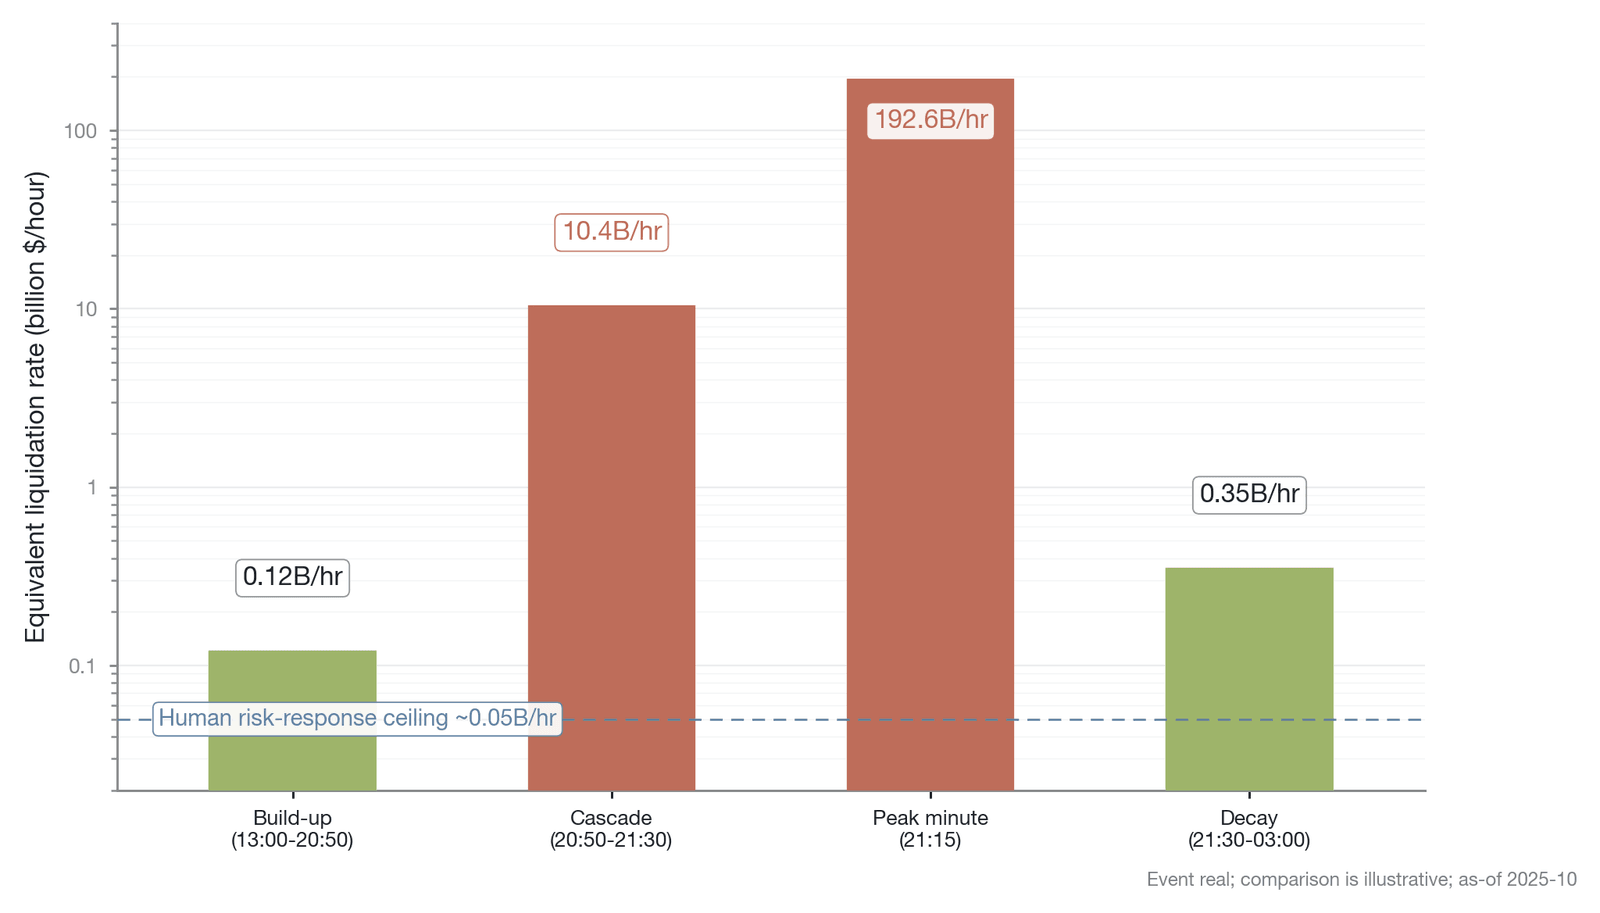
Figure 11-32. Comparison of the liquidation rate and the decision-response speed in the "10.10 event" (Data source: Amberdata [2], as of October 2025; the liquidation rate has multiple bases that should not be conflated: about $3.21 billion per minute at the peak minute, about $10.39 billion per hour averaged over the 40-minute cascade, and about $192.6 billion per hour from the linear extrapolation of the peak minute, which lasted only about 1 minute and is not a sustainable rate; the human response latency is an illustrative representative value)
11.7.4 Implications for risk control and regulation
The time-compression effect is not only a technical feature of market microstructure; it poses far-reaching challenges to the risk-control methodology and future regulatory path of the crypto derivatives market.
The definition of "effective leverage" must be reconstructed. Traditional risk-control models often calculate the safety cushion on the basis of static margin rates and historical volatility. In an environment of time compression and instantaneous liquidity evaporation, however, nominal leverage is meaningless. The real risk depends not only on directional exposure but, more importantly, on the liquidity depth of the collateral basket under extreme conditions. As research points out, "the market trades at the margin, not at the mean" [27]. Risk-control models must introduce dynamic, nonlinear liquidity-penalty factors to simulate whether a position is still safe in a scenario where order-book depth has shrunk by more than 90%.
At the same time, guarding against single points of failure directly determines the system's survivability. When infrastructure becomes unreliable in extreme conditions, concentrating all positions, collateral, and oracle price feeds at a single exchange (even a decentralized one) becomes a fatal single point of failure. For example, when an exchange's internal stablecoin price depegs because of a local liquidity drought, a liquidation engine based on that local price will mercilessly liquidate a cross-market hedge portfolio that would be entirely healthy from a global perspective [27]. Multi-centered oracle price feeds, redundant allocation of funds across exchanges, and automated programmatic hedging therefore become must-haves for the survival of professional institutions.
From the standpoint of systemic risk and regulation, the time-compression effect requires us to rethink the applicability of circuit breakers in crypto markets. Although the pure spirit of decentralization rejects any human intervention in trading, when the execution speed of the liquidation engine far exceeds the market's capacity for self-repair, some form of algorithm-level circuit breaker or volatility-based dynamic liquidation-delay mechanism may be a necessary compromise to prevent a "flash crash" from evolving into a systemic crisis. The actual effect of circuit breakers in traditional markets, however, is far from uncontested. The research of Goldstein and Kavajecz (2004) [29] reveals the "magnet effect" of circuit breakers: when the price approaches the circuit-breaker threshold, traders expect trading to be suspended and therefore accelerate their selling to avoid being locked into an unfavorable position, and this behavior instead pushes the price toward the circuit-breaker line faster, making the circuit breaker itself an amplifier of volatility rather than a damper. The theoretical root of this "magnet effect" can be traced to Subrahmanyam's (1994) [30] early analysis of how a circuit-breaker threshold distorts traders' intertemporal order placement. In the crypto market's fragmented exchange environment, this problem is further complicated: if a single exchange unilaterally suspends trading, its immediate effect is to drive order flow to competing platforms that are still trading, rather than genuinely arresting the cascade, and the selling pressure does not disappear because one exchange has suspended trading but is merely released in concentration on other platforms. A market-wide coordinated suspension could in theory solve this problem, but it is in deep conflict with the decentralized nature and permissionless operating principle of crypto markets. A more feasible alternative is therefore a dynamic liquidation-throttling mechanism: rather than suspending trading itself, it lowers the execution rate of the liquidation engine when cascade conditions are detected (for example, limiting the volume of liquidation orders processed per unit time to a certain proportion of the available order-book depth), thereby slowing the acceleration of the positive-feedback loop while keeping the market open. This design provides a time window for liquidity to recover and market makers to re-enter, without interrupting the price-discovery function.
11.7.5 The structural protections of traditional margin markets
The extremity of the time-compression effect in the crypto derivatives market becomes even sharper when contrasted with the structural protection mechanisms of traditional margin markets. Through decades of institutional evolution, traditional financial markets have built multi-layered braking mechanisms that jointly constitute a structural buffer preventing the deleveraging process from running out of control.
On liquidity depth, the order-book depth of traditional futures markets is usually tens or even hundreds of times that of crypto markets. Take the S&P 500 index futures of the Chicago Mercantile Exchange (CME): their visible order-book depth in normal times can reach the level of billions of dollars, and even in the extreme conditions of March 2020 they maintained a minimum depth of hundreds of millions of dollars. A liquidity pool of this magnitude means that the price impact produced by one or a few large liquidation orders on execution is effectively diluted, and a self-reinforcing cascade feedback is hard to form. A cross-market comparison of absolute depth should be standardized by open interest or average daily volume to yield a meaningful relative-liquidity measure. Although the absolute depth of the crypto perpetual futures market is far lower than that of S&P 500 futures, its depth ratio relative to OI may reveal a more precise measure of fragility. An especially analytically valuable comparison case is CME Bitcoin futures: they trade the same underlying asset as crypto perpetual futures but run on traditional market infrastructure, with well-developed circuit breakers, regulated market-maker obligations, margin grace periods, and a clearinghouse's multi-layer default waterfall. Comparing the price behavior of CME Bitcoin futures with that of crypto perpetual futures in the same macro-shock event therefore makes it possible to isolate the net contribution of market microstructure differences to cascade dynamics while effectively controlling for the underlying asset's risk factors.
Circuit breakers are the most direct means by which traditional markets arrest time compression. When a price falls by a preset threshold within a short time (such as 5%, 7%, or 13%), the exchange forcibly suspends trading for 5 to 15 minutes. This pause gives market participants a time window to reassess information, add margin, and adjust strategies, effectively interrupting the positive-feedback loop between panic selling and mechanical liquidation.
In traditional markets, the prime broker acts as a credit-intermediary layer between traders and the clearinghouse. When a client faces margin-call pressure, the prime broker can provide short-term financing grace based on the client's overall credit standing and long-term relationship, allowing the client to adjust positions in an orderly way over hours or even days rather than being forced to close immediately in the worst market conditions. This elastic layer, constituted by interpersonal relationships and credit judgment, is entirely absent from the purely algorithm-driven crypto market.
In addition, the asset diversification of a traditional-market portfolio is far greater than in crypto markets. The correlations among equities, bonds, commodities, and foreign exchange are low in normal times, and even when correlations rise in a crisis, they are unlikely to reach close to 1 simultaneously. By contrast, the correlations of the vast majority of crypto assets with Bitcoin show an empirical tendency to converge rapidly toward 1.0 during a crisis. Although the precise correlation values vary by event, time window, and asset class, this high directional synchrony recurs across successive major cascade events. Correlation, however, measures consistency in the direction of price movements, not symmetry in their magnitude: in the 10.10 event, BTC's maximum drawdown was 14.5%, while the drawdown depth of some DeFi tokens reached more than 70%. The apparent contradiction between high correlation and starkly different drawdown magnitudes can be reconciled by the following mechanism: all assets fell in the same direction (hence the high correlation), but the less liquid assets bore a disproportionate price impact because of their shallower order-book depth, higher leverage concentration, and the faster withdrawal of market makers. This means that under the cross-margin system there is almost no effective risk diversification: the entire portfolio behaves, in direction, like a single high-leverage position in one asset, while in magnitude it is dominated by the least liquid constituent asset.
11.8 The information paradox and mechanism-induced volatility
A liquidation event carries both information and noise in the order book, and market makers cannot separate the two; the systemic overreaction that results constitutes an efficiency constraint peculiar to perpetual futures markets. This section first defines the information paradox of liquidation, then analyzes the adverse-selection dilemma of market makers, and finally proposes the concept of mechanism-induced volatility and its differences across modes.
11.8.1 The information paradox of liquidation
In the market microstructure of perpetual futures, a liquidation event constitutes a distinctive cognitive puzzle, which we call the information paradox of liquidation. This paradox is not only an extension of microstructure theory but also a core key to understanding the extreme volatility of crypto-asset markets. When we observe a liquidation order in the order book, it in fact carries two starkly different attributes at once: an information attribute and a noise attribute. The research of Bouchaud, Farmer, and Lillo shows that order flow's impact on price has a long-memory character, and the influence of large one-sided order flow accumulates over time [31]. The information attribute originates in the liquidated trader's misjudgment, but this statement requires a more precise classification. Liquidated positions can in fact be distinguished, by their information content, into three starkly different cases. The first is a genuine fundamental misjudgment: the trader was indeed wrong about the direction of the asset's value, the price movement reflects a negative update to fundamentals, and in this case the liquidation order carries valid information about the asset's true value, on which market makers should adjust their expectation of fair value. The second is a correct fundamental judgment but excessive leverage: the trader's medium-to-long-term judgment about price direction may be entirely correct, but because they used too high a leverage multiple, even a normal 2% market fluctuation is enough to trigger their maintenance margin line; this liquidation is pure leverage noise and carries no fundamental information. The third is an unrelated liquidation caused by cross-margin contagion: under the unified margin system, a trader's loss on some unrelated asset erodes the account's overall margin balance, causing forced closure of a position in another instrument on which the trader's directional judgment was correct and whose fundamentals have not deteriorated. This third case constitutes pure structural noise; the liquidation is entirely unrelated to any fundamental information about the asset and is merely a by-product of the margin system's design. In the actual operation of the crypto derivatives market, the latter two cases (leverage noise and structural noise) very likely dominate in number, which means the signal-to-noise ratio in liquidation order flow is far lower than in the informed-trading-driven order flow of traditional markets. The core difficulty is that these two attributes manifest identically in the order book. Whether it is a desperate sale caused by deteriorating fundamentals or a mechanical close triggered by excessive leverage, both appear in the matching engine only as ruthless market sell orders. At centralized exchanges, liquidation orders are in fact technically identifiable: Binance's forceOrder WebSocket stream, for example, lets market participants distinguish liquidation orders from voluntary orders in real time. The real paradox market makers face, therefore, is not the inability to identify a liquidation order itself but the inability, even knowing that an order is a liquidation, to decompose it into signal and noise: which of the three cases above does it belong to? Does it reflect valid fundamental information, is it the mechanical consequence of excessive leverage, or is it a structural by-product of cross-asset contagion? This deep information asymmetry places market makers in a dilemma.
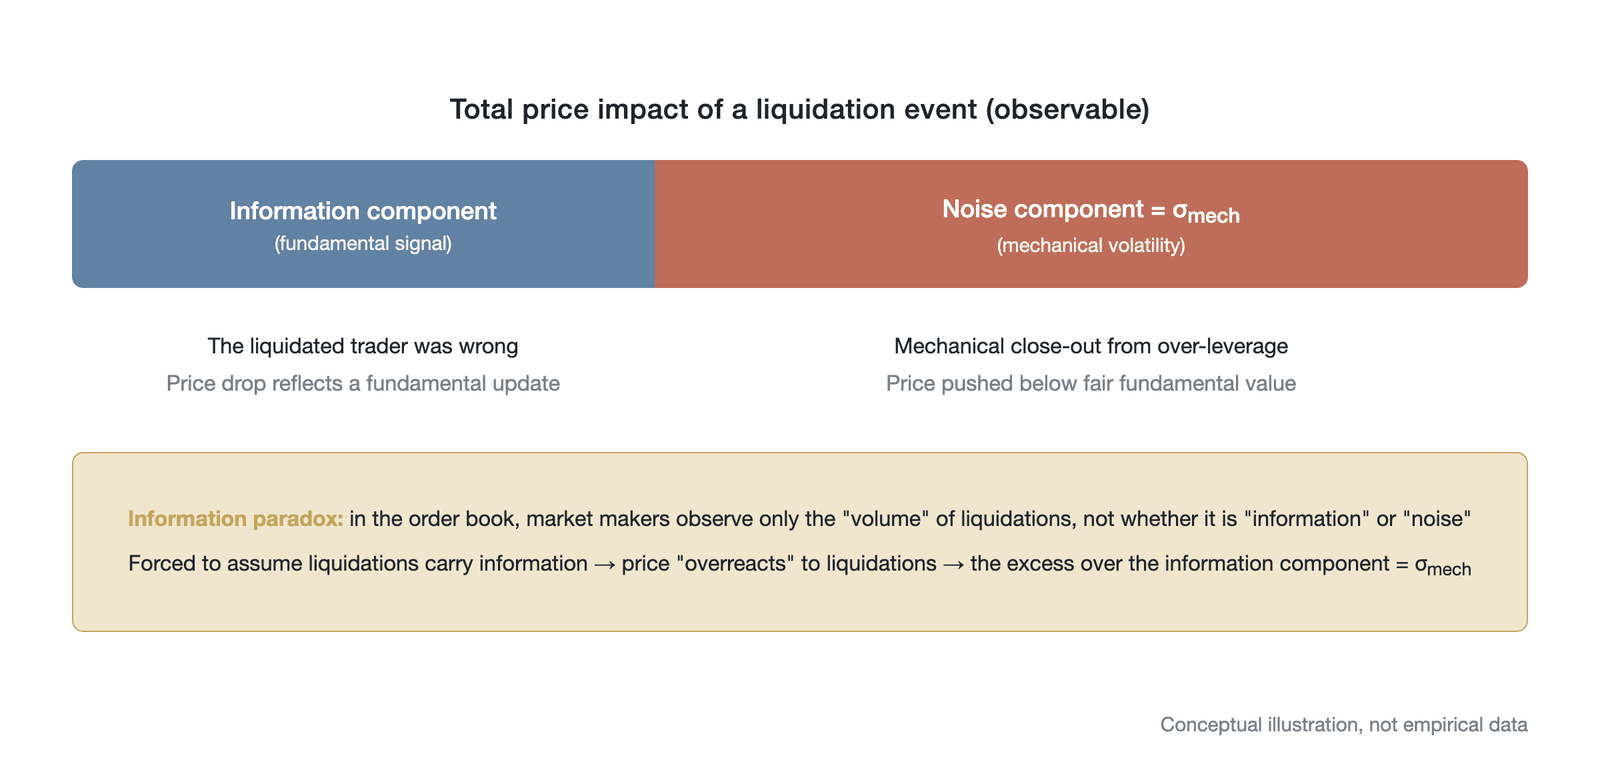
Figure 11-33. Decomposition of the information and noise superimposed in a liquidation order (conceptual illustration, not empirical data)
11.8.2 The adverse-selection dilemma of market makers
Under the microstructure framework proposed by Kyle (1985) [10], when facing informed traders, market makers can infer the information content in order flow from its characteristics and adjust their quotes accordingly. In the Kyle model, market makers gradually adjust the price to the level that reflects the asset's expected value by observing the size and timing characteristics of orders, and the premise of this inference process is that there is a strategic information motive behind the orders. Liquidation orders, however, carry no such strategic information; they are mechanically triggered by the exchange's risk engine at preset price levels and lack the tentative or strategic character of an informed trader, so the standard information-inference framework loses its basis for application. Faced with this massive volume of orders that cannot be distinguished as information or noise, market makers are forced to adopt an extremely conservative strategy. To protect themselves from potential adverse-selection risk, market makers must assume that at least some of these liquidation orders contain unknown negative information.
This forced conservative assumption leads to a systemic consequence: the overreaction of prices to liquidation events. To avoid risk, market makers widen bid-ask spreads substantially and withdraw liquidity, so that liquidation orders, in cutting through the order book, cause a decline far greater than their information content warrants. This rational self-protection by market makers manifests at the macro level as an irrational market plunge. When the dust settles and we look back afterward, we find that the portion of the price decline beyond the information component was purely manufactured by the liquidation mechanism itself, and we define this as mechanism-induced volatility.
11.8.3 Mechanism-induced volatility
Mechanism-induced volatility is price volatility produced by the liquidation mechanism that reflects no change in fundamental information; it is the core indicator of the degree to which the liquidation system interferes with the market's price-discovery efficiency. This concept is logically similar to the excess volatility Shiller (1981) [32] identified in the stock market, but with one key distinction: the excess volatility Shiller described originates in investors' behavioral biases during valuation, whereas mechanism-induced volatility in the crypto derivatives market is produced by the structural interaction between leverage and automated liquidation, which makes it a predictable and, in principle, measurable component of total price variance. The sources of mechanism-induced volatility can be further decomposed into two components that are conceptually distinguishable but closely intertwined in practice: (a) mechanical-liquidation overshoot, the nonlinear price impact produced by the liquidation engine's forced sell orders when liquidity is thin, a purely algorithm-driven, information-free price deviation; and (b) behavioral-panic overshoot, the panic selling that traders who have not been liquidated undertake voluntarily out of fear after observing a sharp price drop and large-scale liquidations. Take the 10.10 event: at the peak moment 93.5% of sell orders were market orders produced by forced liquidation, which means about 6.5% of the selling pressure came from voluntary panic selling. Although 6.5% seems small, when order-book depth has already collapsed to below 1% of its normal level, even this small portion of voluntary selling produces a significant additional price impact. In the strict sense, "mechanism-induced volatility" should cover only component (a), the price deviation directly manufactured by the liquidation engine; component (b) belongs to the behavioral chain reaction and is essentially a second-order response to mechanical liquidation. As a preliminary measure, we can compare price volatility during liquidation-intensive periods with that during non-liquidation periods and, after controlling for other factors such as macro news, attribute the additional volatility difference to mechanism-induced volatility.
The magnitude of mechanism-induced volatility is closely related to the liquidation mode an exchange adopts. Because cliff-edge liquidation dumps the entire position onto the market at market price in an instant, it injects the most noise and produces the most violent mechanism-induced volatility. Progressive liquidation, by reducing positions in batches, injects the noise dispersed over a longer time window, so its mechanism-induced volatility is at a moderate level. Although the auto-deleveraging mechanism is extremely unfriendly to the profitable counterparty, its precise, targeted closing has limited impact on the public market price, so its mechanism-induced volatility is small. And vault-backstop liquidation internalizes the risk position so that the noise does not enter the public order book at all, producing the least mechanism-induced volatility.
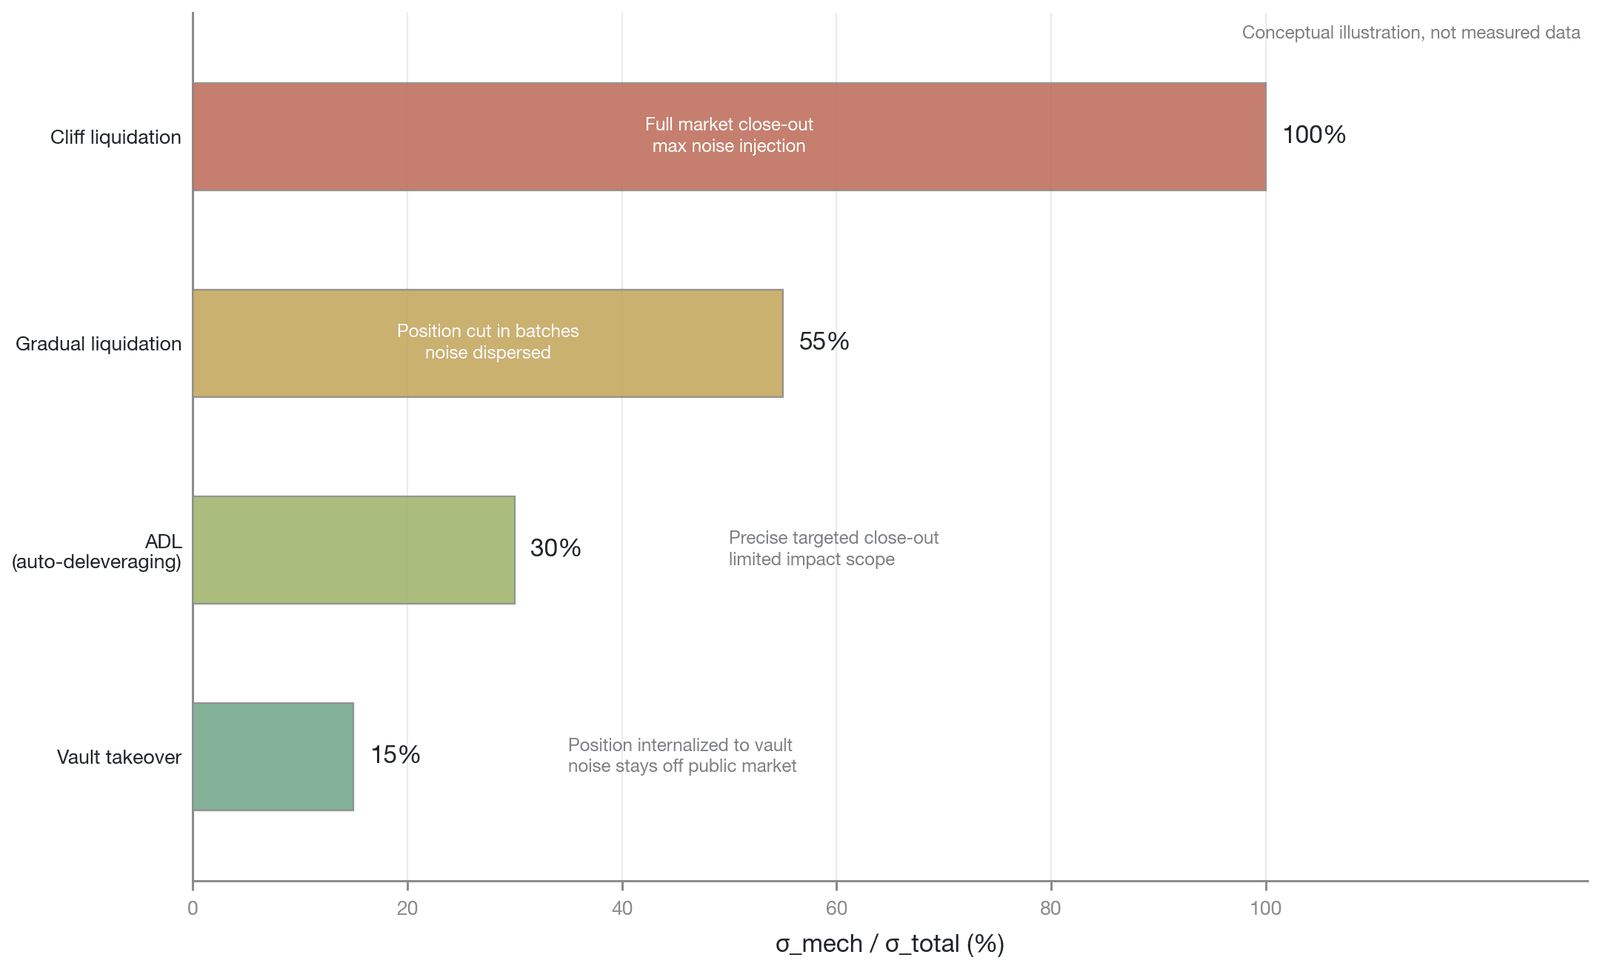
Figure 11-34. The relative magnitude of mechanism-induced volatility under different liquidation modes (conceptual illustration; qualitative relative values; not empirical data)
The information paradox and mechanism-induced volatility have important implications for the price-discovery efficiency and market quality of perpetual futures markets. It shows that during liquidation-intensive periods, the price of perpetual futures systematically deviates from the asset's fundamental value. Mechanism-induced volatility in fact constitutes a hard ceiling on the informational efficiency of perpetual futures. However precise the oracle, as long as high leverage and forced-liquidation mechanisms exist, this endogenous mechanism-induced volatility cannot be eliminated. When assessing the quality of crypto-asset markets, therefore, we must incorporate mechanism-induced volatility into our analytical framework as an efficiency constraint peculiar to perpetual futures. It reminds us that the price seen in extreme conditions often reflects the fragility of the market structure more than the asset's true intrinsic value.
11.9 A reflexivity dissection of the "10.10 event"
The "10.10 event" is a complete empirical test of this chapter's theoretical framework. This section reconstructs, in turn, the system's pre-crisis fragility, the micro process of the trigger and cascade, the cross-asset contagion path, and the empirical validation of the four-phase model and mechanism-induced volatility.
11.9.1 The system's pre-crisis fragility
The crypto-asset market crash that erupted on October 10, 2025—the "10.10 event"—provides a perfect empirical test scenario for all the theoretical tools discussed in this chapter. It was the largest single-day liquidation event in the history of crypto derivatives, with total 24-hour liquidations estimated by institutions at more than three times those of "Black Thursday" in March 2020 [17] [3] (note: sources differ substantially in how they measure the total liquidations of the March 2020 event; the complete microstructure data appear in Section 11.9.2). Many market commentators simply blamed it on the shock of macro geopolitical news, but a close dissection of the event's microstructure reveals a more fundamental truth. The macro news was merely the exogenous catalyst that triggered the cascade; the fragile leverage structure inside the crypto-asset market, the cross-contagion of the unified margin system, and the mechanical execution of the liquidation engine were the fundamental causes that amplified a controllable price pullback into a systemic implosion.
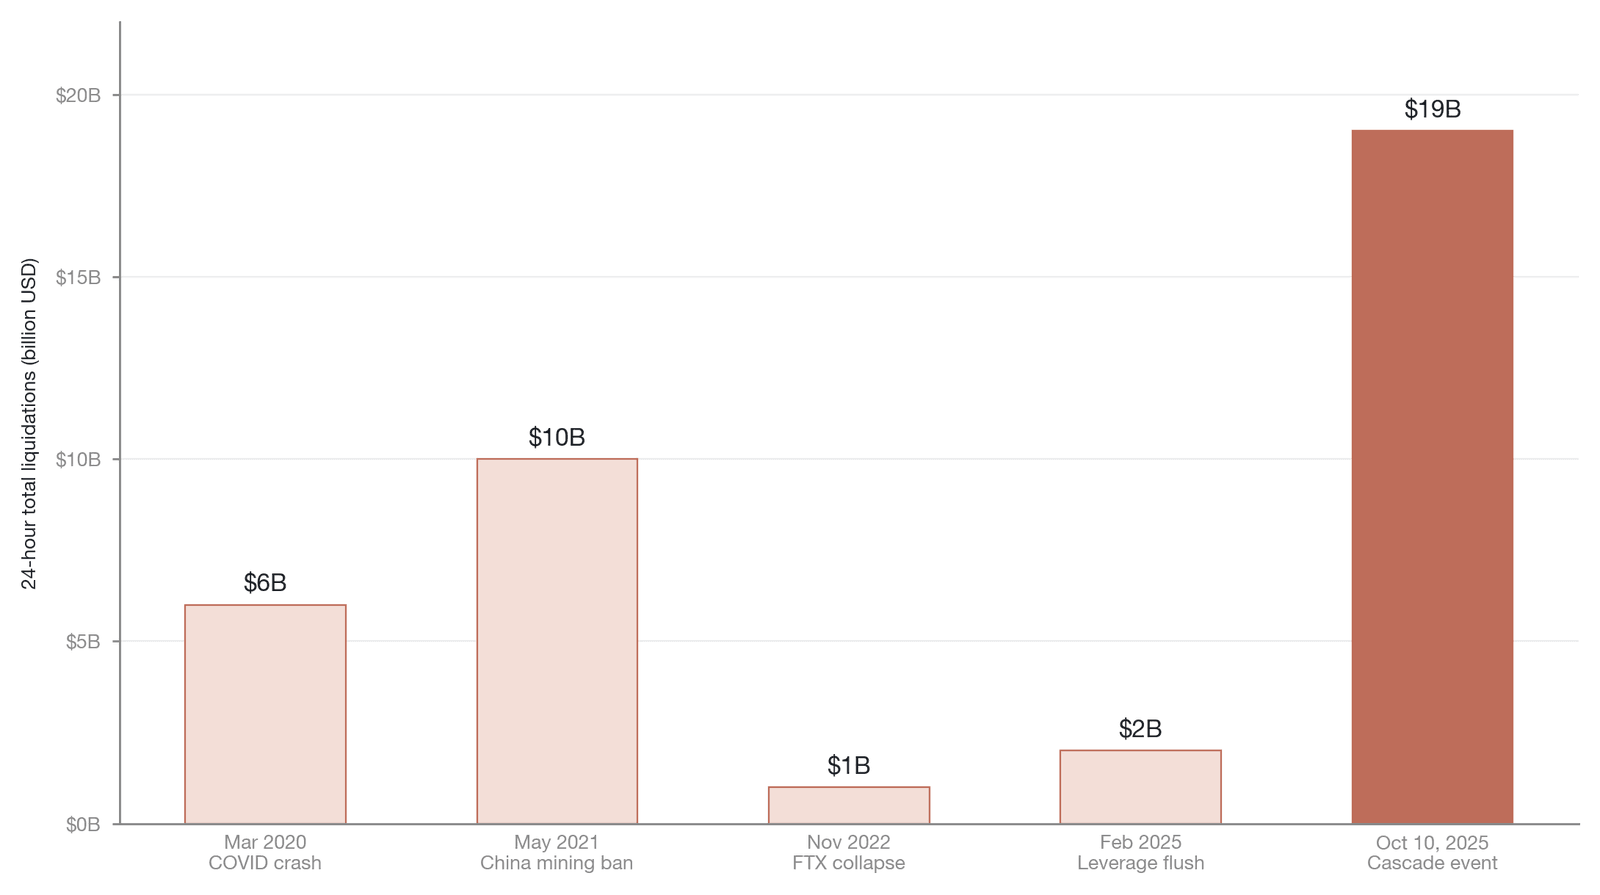
Figure 11-35. Comparison of the scale of historical liquidation events (Data source: CoinGlass [9], as of October 2025; the values are representative rounded milestones—China's mining ban of May 2021 was about $8 billion to $10 billion, with CoinGlass's canonical figure about $8.6 billion; because of API reporting caps, the CoinGlass basis historically underestimates and its absolute figures are conservative, so orders-of-magnitude comparison should be emphasized)
On the eve of the crisis, the crypto-asset market was already in a highly taut metastable state. Total open interest in perpetual futures at major venues had reached a record of about $146.6 billion (on Amberdata's basis, not a full market-wide basis) and displayed an extreme long-dominated character [2]. Because of the market's preceding sustained rise, one-sided crowding was extremely high, the ratio of open interest to market cap had climbed to a historical high, and positions using high leverage above 25x accounted for a significant share. More dangerously, the funding rate had already completed the process of "accumulating fragility." Before October 6, according to FTI Consulting's post-crash analysis, the funding rate on Bitcoin and Ethereum perpetual futures (driven mainly by the Ethereum market) rose from about 10% annualized to nearly 30% (corresponding to about 0.027% per 8 hours; the figure does not specify whether it is a market-wide weighted or a single-exchange basis) [27]. This extreme positive rate meant that longs had to keep paying shorts a high holding cost, which imperceptibly kept consuming longs' maintenance margin and systematically pulled their liquidation prices upward, making the entire market extremely sensitive to downside risk. The liquidation heatmap showed that a massive number of liquidation trigger points had clustered in the narrow band 5% to 10% below the price at the time, and the cascade risk index had entered a dangerous divergence range.
The macro event that triggered this cascade (the announcement of a 100% tariff on Chinese imports) did not act on the crypto-asset market alone; it simultaneously struck traditional risk assets such as equities, foreign exchange, and commodities. During the six-hour window in which Bitcoin fell 6.8% before the cascade erupted, macro hedge funds rebalanced their portfolios by treating crypto-asset exposure as part of a broader risk-reduction strategy, and this cross-market outflow very likely contributed significantly to the initial selling pressure. Analyzing the co-movement of S&P 500 index futures, the USD/CNY exchange rate, and the gold price over the same time window would help decompose the initial trigger factor into a crypto-market-endogenous component and a cross-market capital-flow component, though such an analysis is beyond the scope of this chapter.
11.9.2 The trigger and the cascade
The crisis was triggered at 14:57 UTC on October 10, when U.S. President Trump announced on social media that a 100% tariff would be imposed on Chinese imports [3]. This macro catalyst immediately set off a global sell-off in risk assets. The price of Bitcoin began to slide slowly from a high of $121,500 and fell to around $114,000 over the following six hours, a decline of about 6.8% [2]. Although painful, the decline in this phase was still within the range of normal price discovery, and the market showed no sign of systemic collapse. This six-hour decline, however, gradually eroded the margin buffer of high-leverage positions and pushed the price toward the liquidation-dense zone.
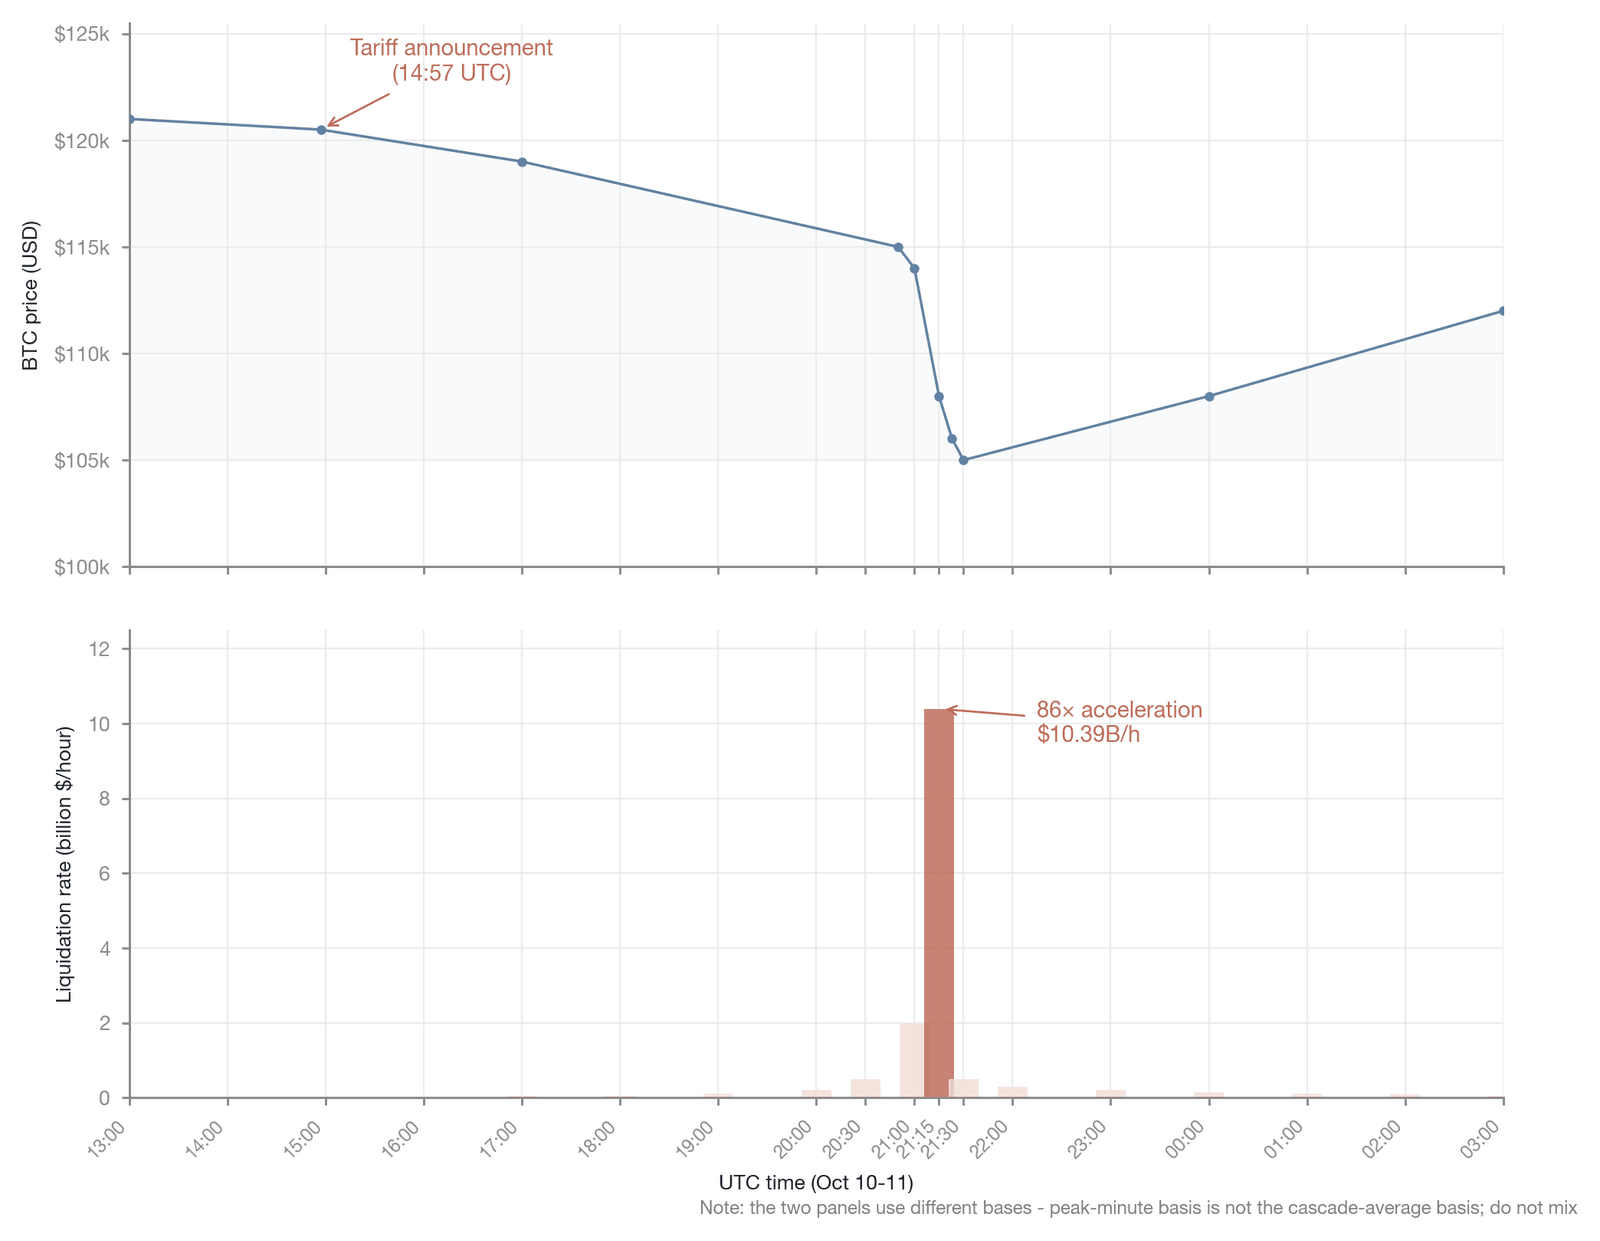
Figure 11-36. Timeline of price and the liquidation rate in the "10.10 event" (Data source: Amberdata [2], as of October 2025)
The cascade crisis began at 20:50 UTC, when the price hit a key liquidity-vacuum zone and the liquidation cascade was formally triggered. Over the following 40 minutes, the market experienced the fastest mechanical deleveraging in the history of crypto derivatives. The liquidation rate surged instantly from a mild $120 million per hour before the cascade to $10.39 billion per hour, an acceleration of a full 86-fold [2]. In the peak minute at 21:15, as much as $3.21 billion of positions were liquidated within 60 seconds, of which 93.5% were forced closures of longs [2]. This purely algorithmic execution speed completely deprived human traders of any time window to intervene or add margin.
Table 11-7 summarizes the changes in four key microstructure indicators before and after the cascade, showing the comprehensive deterioration of the market infrastructure within 40 minutes.
| Indicator | Before cascade (8-hour average) | During cascade (40-minute average) | Magnitude of change |
|---|---|---|---|
| Liquidation rate | $120 million/hour | $10.39 billion/hour | Accelerated 86x |
| Order-book depth | $103.6 million | $170,000 | Contracted 99.8% |
| Bid-ask spread | 0.02 bps | 26.43 bps (peak) | Widened 1,321x |
| Open interest | $146.6 billion | $109.9 billion | Evaporated 25% |
Table 11-7. Comparison of key microstructure indicators before and after the cascade in the "10.10 event" (Data source: Amberdata [2])
In this 40-minute liquidity black hole, the microstructure data reveal the complete collapse of the market infrastructure. According to Amberdata, the visible order-book depth of major exchanges fell off a cliff from $103.64 million to a mere $170,000, and more than 99.8% of liquidity contracted sharply precisely when it was most needed [2]. The pre-cascade depth figure of $103.64 million here reflects visible resting limit orders. In practice, the effective liquidity of the crypto market also includes substantial hidden depth (iceberg orders and algorithmic market makers quoting with high-frequency placements and cancellations), and under normal market conditions this hidden liquidity is typically 3 to 5 times the visible depth. During a cascade, this hidden liquidity disappears even faster than visible orders, because algorithmic market makers pause their quoting algorithms within milliseconds once they detect adverse-selection flow. Therefore, from total liquidity including hidden and refresh components down to the residual $170,000, the collapse in actual effective depth was very likely close to 99.95%, which makes the cascade dynamics more extreme than the visible order-book data alone would present. At the same time, the bid-ask spread of Bitcoin perpetual futures widened explosively from an extremely tight 0.02 basis points to 26.43 basis points, an increase of 1,321-fold [2]. This deterioration of the microstructure meant that every new liquidation order, in cutting through the order book, produced far greater price slippage than usual, thereby triggering more liquidations at lower prices and forming a classic positive-feedback spiral.
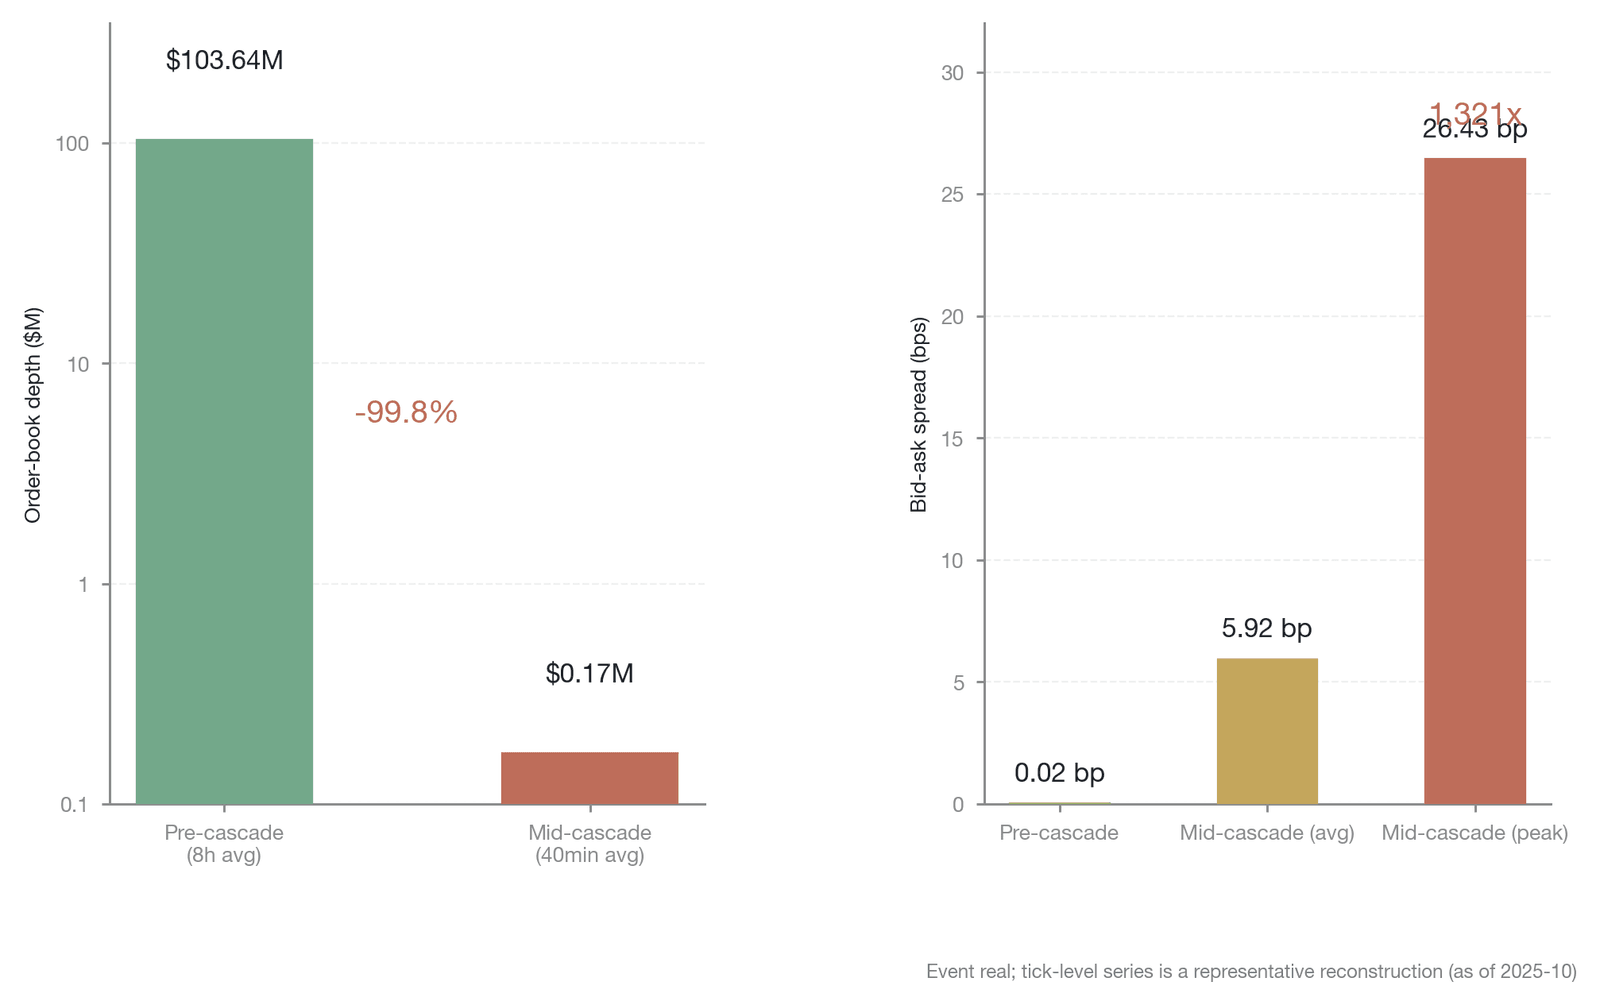
Figure 11-37. Order-book depth and the bid-ask spread in the "10.10 event" (Data source: Amberdata [2], as of October 2025; the endpoints—depth of about $103.6 million → $170,000 and spread of 0.02 → 26.43 basis points—are Amberdata's measured top-of-book values for BTC perpetual futures, while the point-by-point series is a representative reconstruction)
11.9.3 Cross-asset contagion and collateral collapse
The destructiveness of this crisis was reflected not only in the plunge of a single asset but, even more, in its ultra-rapid cross-market, cross-asset contagion. The unified margin system played the role of the key amplification mechanism here. When the fall in Bitcoin's price triggered liquidations, an exchange's risk engine not only closed Bitcoin positions but also indiscriminately sold off the high-risk altcoins in the account to make up the margin shortfall. As a result, although Bitcoin ultimately fell only about 14.5%, Ethereum fell 12.2%, while the maximum drawdown of DeFi blue-chip assets such as UNI and AAVE approached 70% [2]. This asymmetric cross-asset shock carries important structural information. The DeFi tokens' decline far exceeding Bitcoin's was very likely the result of several superimposed factors: compared with Bitcoin perpetual futures, altcoin perpetual futures have markedly thinner order-book depth, which means an equal amount of liquidation selling pressure produces a proportionally amplified price impact; leverage concentration on altcoin perpetual positions is higher; DeFi tokens are disproportionately used as collateral in unified margin accounts, thereby triggering collateral-driven forced selling; and market makers withdraw liquidity from illiquid pairs faster and more completely. A formal quantitative decomposition of these contributing factors would substantially advance our understanding of the structure of cross-asset contagion.
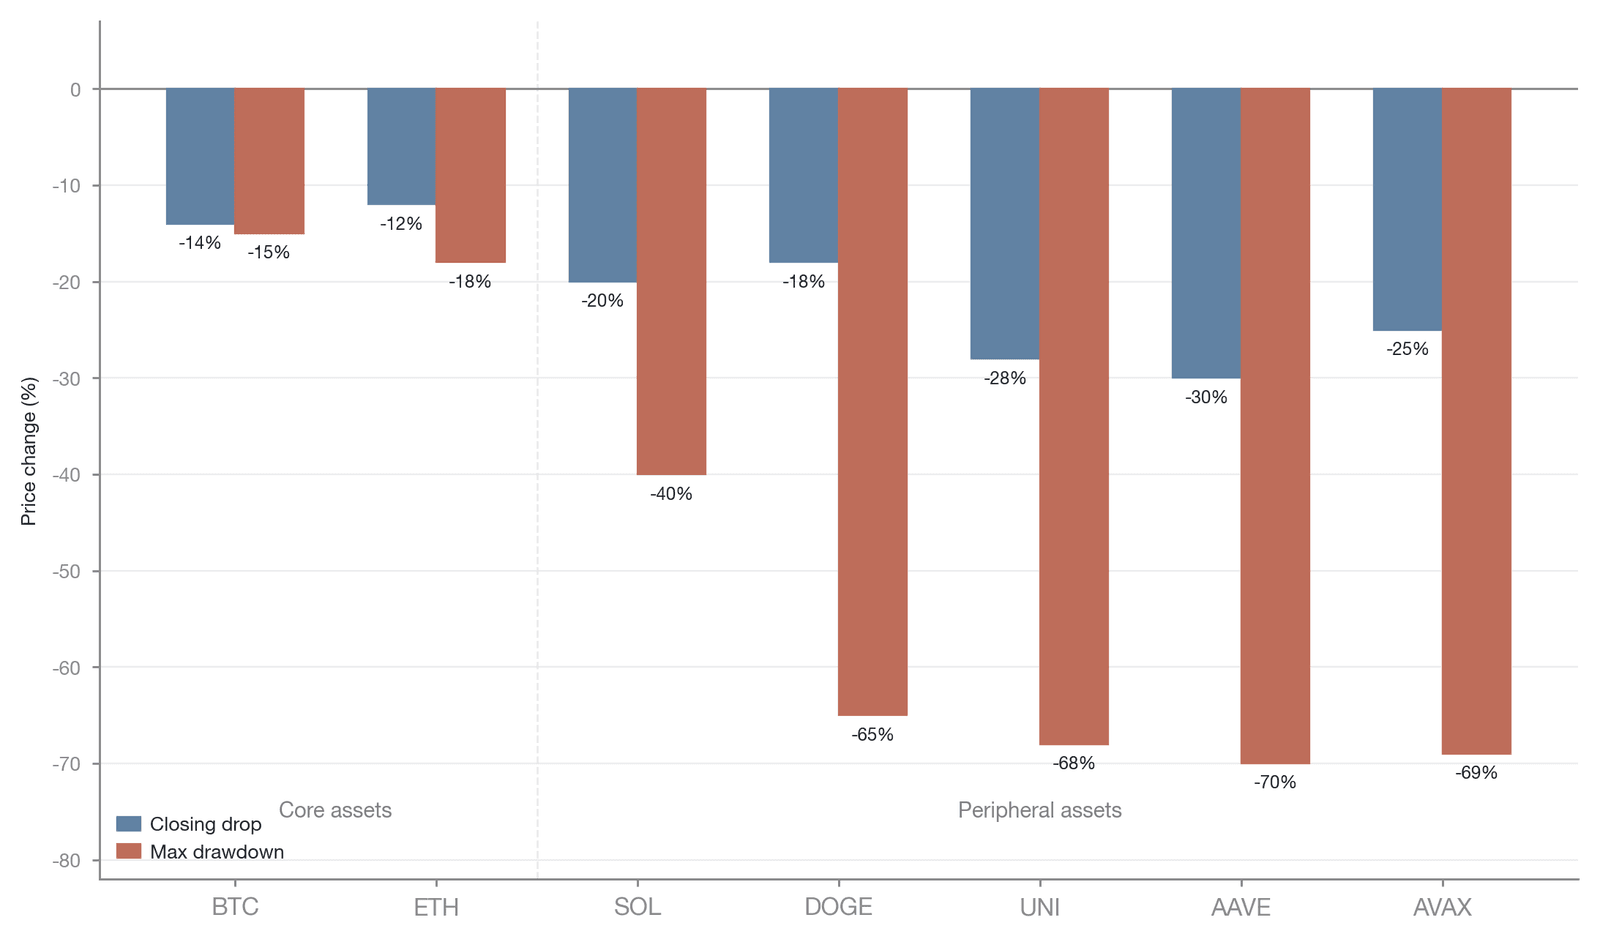
Figure 11-38. Comparison of price declines across multiple assets (as of October 2025; "closing decline" and "maximum drawdown/intraday low" are two different bases that should not be read interchangeably; SOL's closing decline is a representative rounded figure, with a verified value of about −24% and an intraday low that at one point exceeded −40%; the specific declines for each asset follow the main text of Section 11.9.3)
Collateral collapse was the most striking link in this cross-market contagion. As a high-yield synthetic dollar stablecoin, USDe was used by many traders as margin for contract trading at the time [3]. When the liquidity crisis erupted, USDe encountered severe selling pressure on Binance, and its price briefly depegged and plunged to $0.65, a discount of as much as 35% to its $1 peg [3]. This was mainly a local liquidity event at the single venue of Binance: over the same period, USDe deviated by less than 100 basis points on Curve, fell only to about $0.92 on Bybit, and decentralized venues largely maintained the peg on hundreds of millions of dollars of liquidity; the Ethena protocol maintained about $66 million in excess collateral throughout, its minting and redemption functions operated normally, and it processed more than $2 billion in redemptions within 24 hours, showing that the 35% discount did not reflect the true solvency risk of its delta-neutral strategy but was a pricing distortion in a single low-liquidity trading pair [3]. Because the exchange's margin system directly used the local internal oracle price feed, the plunge in USDe left countless previously safe accounts instantly insolvent, setting off a fierce secondary liquidation wave. Liquid staking tokens such as BNSOL and WBETH met a similar fate, and this double blow—collateral value and asset price plunging at the same time—constituted two mutually nested positive-feedback loops.
The collapse of USDe exposed the structural risk of using a yield-bearing stablecoin as margin collateral. Unlike traditional stablecoins (such as USDT and USDC) backed by fiat reserves or short-term Treasuries, USDe maintains its peg through a delta-neutral strategy (holding a long position in spot crypto assets—mainly BTC and ETH and their liquid staking derivatives—and shorting an equivalent position in the corresponding perpetual futures, plus some stablecoin and cash reserves). This means that USDe's stability itself depends on the normal functioning of the perpetual futures market, which is precisely the link that collapsed first in the crisis. When the 10.10 event erupted, the short hedge positions underlying USDe faced huge funding-rate payments (as the rate turned sharply negative), and its redemption mechanism could not be executed in time when market liquidity dried up, producing a discount of as much as 35% between the secondary-market price and the theoretical net asset value. The exchange failed to lower USDe's margin collateral factor in time during the event, meaning that USDe valued 1:1 was still counted toward margin at face value, and the system responded only passively after the price had collapsed; here a distinction should be drawn between "no haircut applied at all" (treating it as equivalent to USDT) and "a haircut that existed but was insufficient," two cases with fundamentally different implications for the direction of risk-management recommendations. This lag reveals a fundamental flaw in the current margin system's assessment of collateral risk: adjustments to the collateral factor are discrete and lagging, whereas changes in collateral's market value are continuous and instantaneous. As noted, USDe's depeg of as much as 35% was mainly a pricing distortion in a single low-liquidity Binance trading pair rather than Ethena's true solvency risk; if so, then the exchange's internal pricing oracle in fact constituted a single point of failure—using a single low-liquidity trading pair as the collateral-valuation mark for the entire unified margin system—and its failure to adjust the collateral factor in real time when the depeg occurred also raises serious questions about the exchange's duty of prudent care and the legal recourse of harmed users. For any yield-bearing asset ultimately backed by a derivatives strategy, its suitability as margin collateral needs to be re-examined on the basis of liquidity and redemption capacity under extreme stress scenarios, rather than relying only on historical volatility under normal market conditions.
At the deepest point of the crisis, the procyclical effect of the auto-deleveraging mechanism dealt a further blow to the market. When the risk reserve was exhausted and not enough liquidity could be found in the market to take on the liquidated long positions, the exchange activated auto-deleveraging. This mechanism forcibly closed short positions that were correct in their directional judgment and profitable. This not only inflicted serious losses on the professional market makers running delta-neutral strategies but, more alarmingly, eliminated the largest potential buying force in the market—because these shorts would otherwise have bought to close as the price fell to low levels, providing precious bottom liquidity to the market. The intervention of auto-deleveraging further weakened the market's remaining liquidity, causing the price to stall further at the bottom.
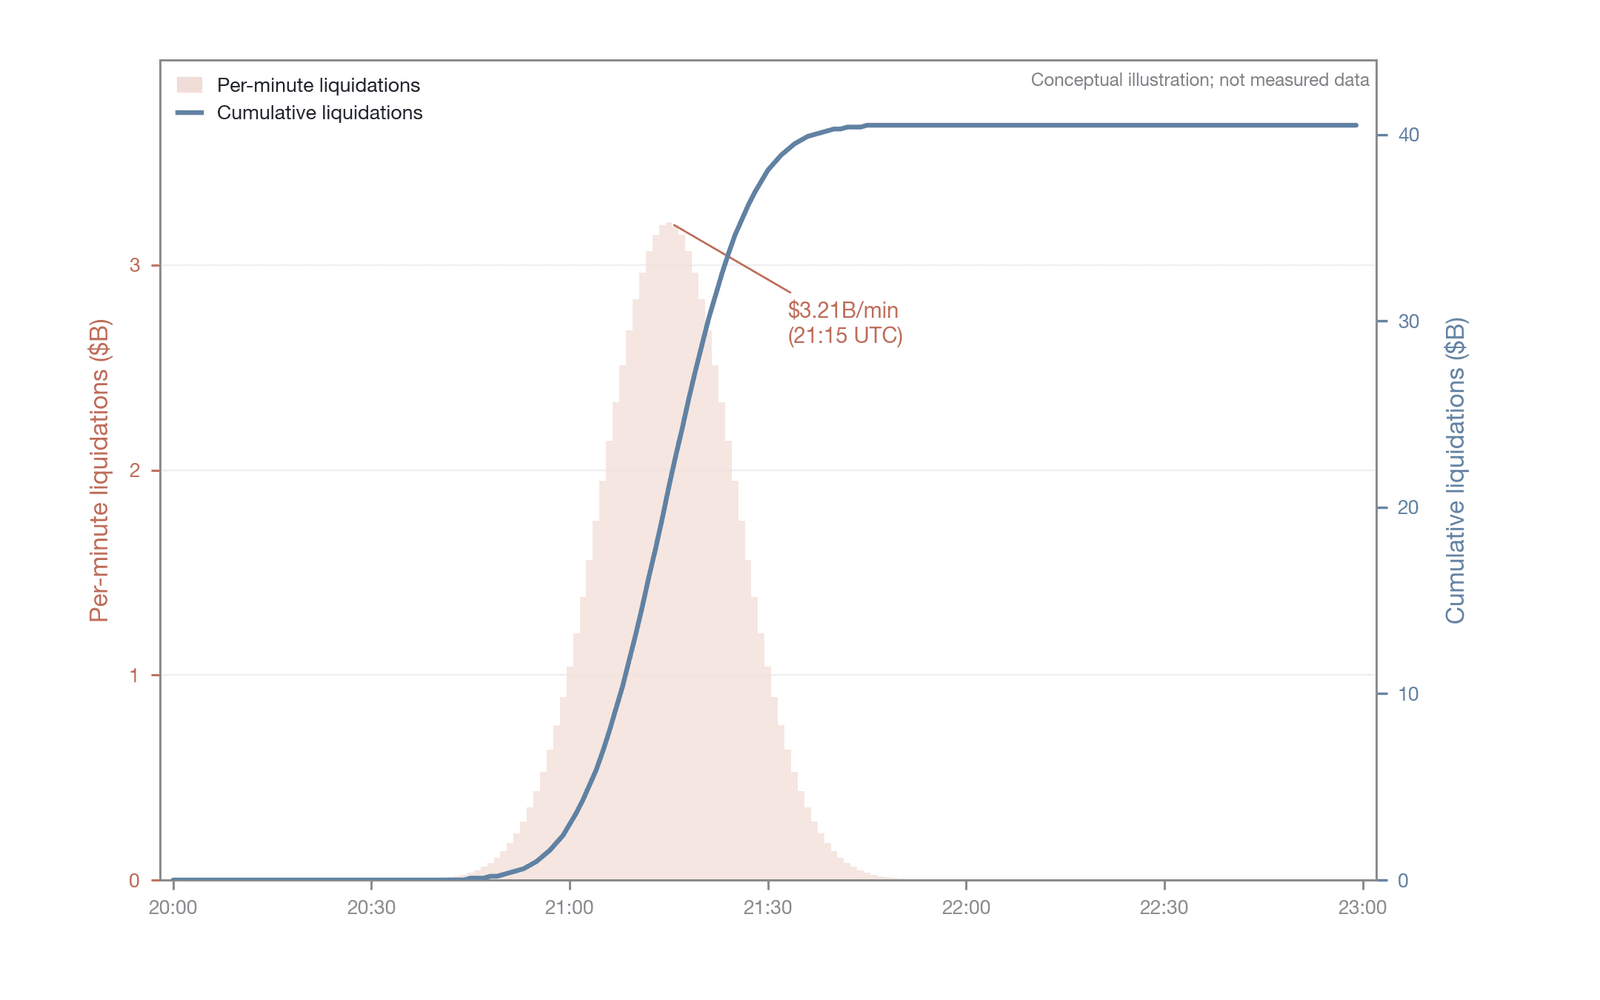
Figure 11-39. The dynamic relationship between the liquidation rate and cumulative liquidation volume (an illustration of the liquidation-cascade model, not tick-by-tick empirical data from the "10.10 event," and distinct from Figure 11-36)
Figure 11-39 overlays the liquidation rate with cumulative liquidation volume, revealing two key dynamic features of the cascade process: the peak of the liquidation rate occurs at the inflection point of the cumulative-liquidation-volume curve, corresponding to the system's jump from the propagation phase to the amplification phase; and the sharp fall-back in the liquidation rate is not due to external intervention but to the fact that the liquidatable high-leverage positions have largely been cleared and the system's own "fuel" is exhausted. This asymmetric pulse shape (slow accumulation, instantaneous eruption, rapid decay) constitutes the typical temporal signature of a crypto-market liquidation cascade.
11.9.4 Empirical validation of the four-phase model
Using the liquidation reflexivity equation and the four-phase model proposed in this chapter, we can systematically reconstruct the entire process of the "10.10 event." In the trigger phase, macro news caused an initial decline of 6.8%. Entering the propagation phase, the price hit the liquidation-dense zone, the reflexivity engine activated, and the liquidation-impact absorption rate fell below 1. In the amplification phase, the time-compression effect appeared, 70% of the destructiveness was released within a mere 40 minutes [2], and multiple resonances drove depth to zero. Finally, in the termination phase, as open interest plunged 25% and liquidatable leveraged positions decreased sharply, the cascade finally stopped.
The price trajectory after the crisis also provides strong empirical support for the mechanism-induced volatility discussed earlier. After the cascade slammed Bitcoin's price down to a low of $104,800, as the mechanical selling pressure exhausted itself, the price rebounded quickly over the following day and stabilized near $113,000. This price difference of nearly $8,000 constitutes a direct measure of the overshoot the liquidation mechanism injected into the market. As analyzed in Section 11.8.3, this overshoot comprises two components at once: mechanical-liquidation overshoot (the nonlinear price impact of the liquidation engine's forced sell orders in the liquidity vacuum, corresponding to about 93.5% of the sell orders at the peak moment being forced closures) and behavioral-panic overshoot (the voluntary panic selling of traders who had not been liquidated after they observed the cascade, corresponding to about 6.5% of the voluntary selling pressure, whose marginal price impact was equally significant under the already collapsed depth). Attributing the entire $8,000 price difference wholesale to "pure mechanism-induced noise" is reasonable in order of magnitude, but strictly speaking it requires further distinguishing the respective contributions of these two components.
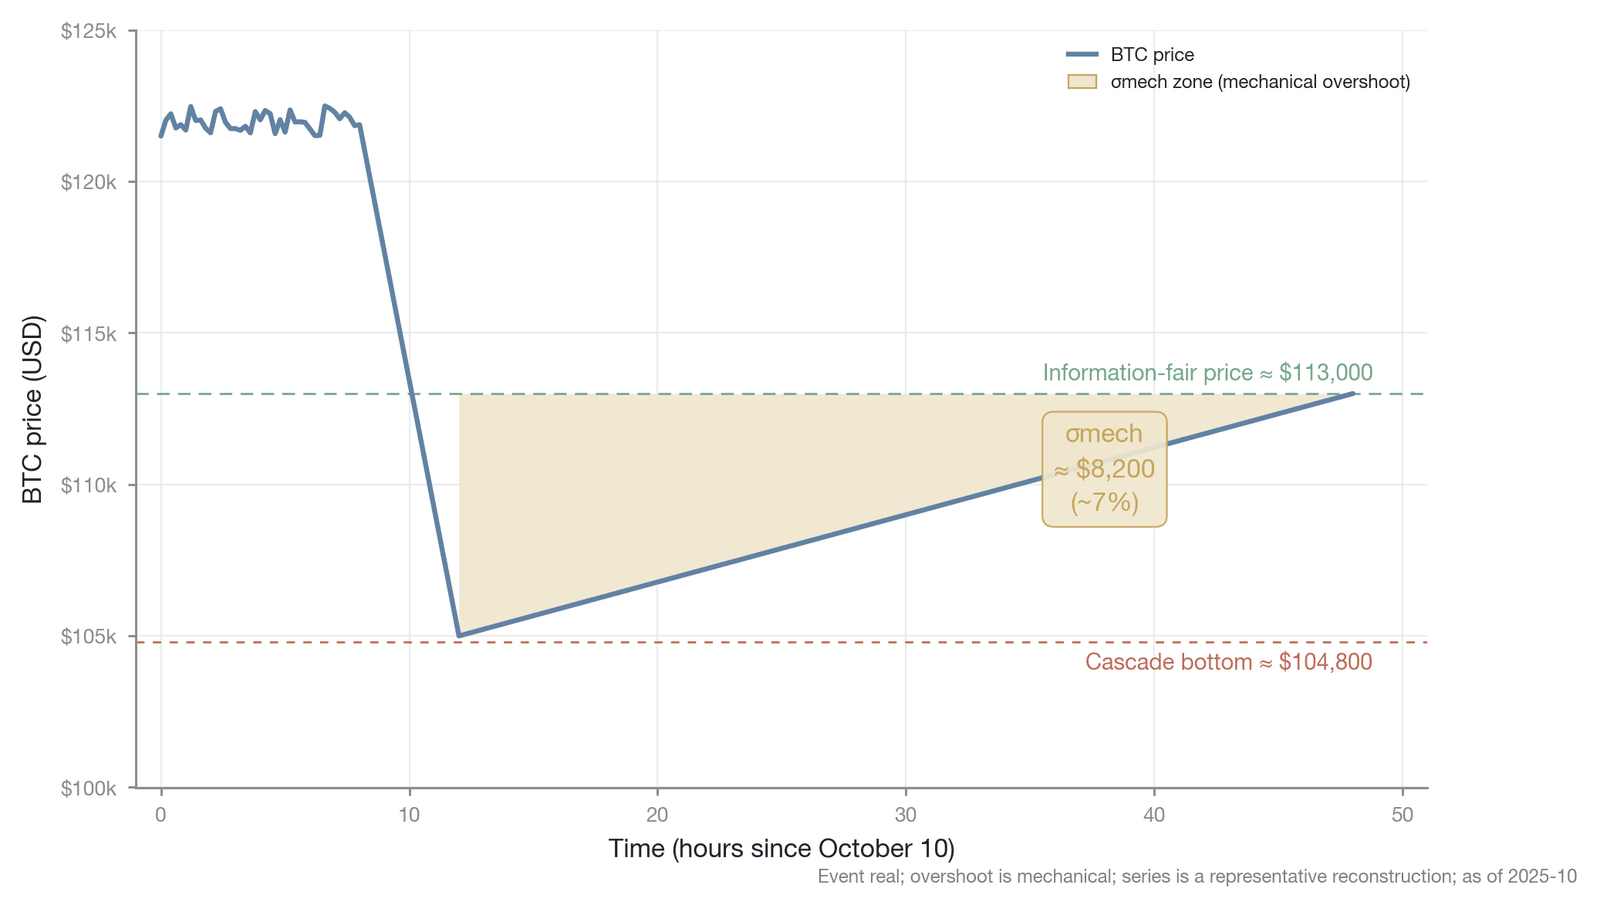
Figure 11-40. Empirical validation of mechanism-induced volatility—price overshoot and rebound (Data source: Amberdata [2], CoinGecko [3], as of October 2025; the endpoints of about $104,800/$113,000 are empirical, while the mechanism-induced overshoot σ ≈ $8,200, about 7%, is the author's model decomposition and a rough upper bound)
The rapid rebound path of the price after the cascade's termination in Figure 11-40 provides an approximate measure of mechanism-induced volatility: the price difference from the low of $104,800 to the stable range of $113,000 accounts for nearly half of the total decline during the cascade (about 46% based on the intraday high of about $122,500, or about 49% based on the trigger-moment high of about $121,500, the ratio depending on which high is used). Equating this ratio directly with the "share of mechanism-induced volatility," however, requires caution about several methodological limitations. First, using the post-crisis recovery price as a proxy for "fundamental fair value" is itself biased, because the recovery-period price may be affected by short-covering buying pressure, the narrowing of spreads after market makers re-enter, and post-crisis new information (such as signals of a policy response), deviating from the true valuation of the moment just before the crisis. Second, this ratio should be regarded as a rough upper bound on mechanism-induced volatility rather than a precise measure, because the overshoot contains both a mechanical-liquidation-overshoot component and a behavioral-panic-overshoot component (as in Section 11.8.3, with about 93.5% forced liquidation and 6.5% voluntary panic selling at the peak, the latter still producing a non-negligible price impact under the already collapsed depth). A more robust alternative measure would compare the difference in decline between perpetual futures and spot over the same window (perpetual futures should systematically overshoot because of the liquidation mechanism), or compare the difference in decline between a crypto asset and a traditional asset with similar macro sensitivity but no cascade-liquidation mechanism. Rough as it is, this ratio still provides a valuable order-of-magnitude benchmark for assessing the market-efficiency loss of different liquidation modes.
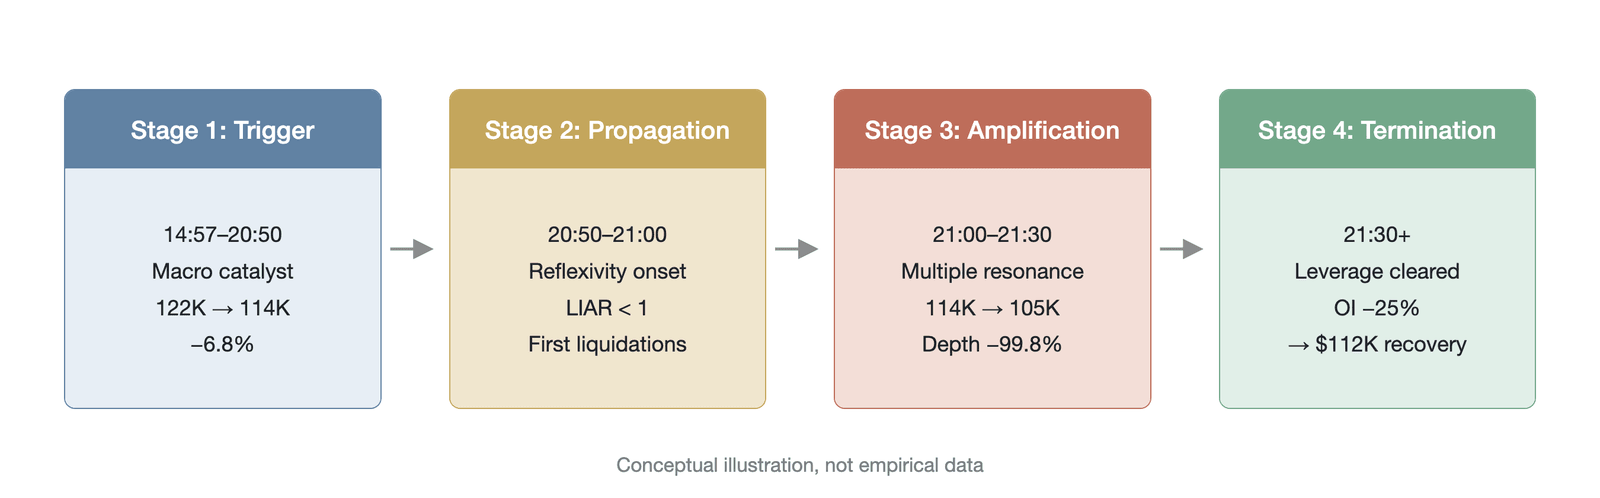
Figure 11-41. Mapping of the four-phase model onto the "10.10 event" (event data as of October 2025; the phase boundaries in the figure are drawn by the model)
As shown in Figure 11-41, superimposing this chapter's four-phase model onto the actual data of the "10.10 event" validates the consistency between theory and empirical observation: the six-hour slow decline of the trigger phase (14:57–20:50 UTC), LIAR falling below 1 in the propagation phase (20:50–21:05), depth going to zero and spreads widening more than a thousandfold in the amplification phase (21:05–21:30; see Table 11-7), and the liquidation rate falling back after OI plunged 25% in the termination phase all closely match the model's phase divisions and transition conditions. This shows that the liquidation reflexivity equation has some explanatory power, while the cascade risk index, as an exploratory proxy for fragility, still requires large-sample testing to establish its warning value.
11.10 Chapter summary
Through a systematic analysis of the liquidation mechanism of perpetual futures, this chapter has revealed the core structural paradox in the microstructure of crypto-asset markets: the liquidation mechanism was designed to eliminate bad debt and maintain system solvency, but under extreme market conditions it turns into the main amplification mechanism of systemic risk. This transformation stems not from a single code flaw but is rooted in the endogenous interaction of leverage, liquidity, and automated execution. This chapter's analytical framework centers on the endogenous microstructure while also revealing the modulating role of macro liquidity conditions on baseline fragility, the amplifying effect of behavioral-finance mechanisms in clustering and panic, and the external constraint that the legal and regulatory dimension imposes on mechanism design.
The five theoretical tools this chapter constructs deconstruct this dynamic process along different dimensions. The liquidation reflexivity equation formalizes the two-way causal relationship between liquidation and price, showing that when liquidation selling pressure exceeds the order book's absorption capacity, the price decline is no longer driven by fundamentals but dominated by the liquidation mechanism itself. The impossible trinity of liquidation design further indicates that in a decentralized or highly fragmented market, capital efficiency, liquidation smoothness, and system safety cannot be achieved simultaneously, and existing exchanges generally pursue capital efficiency at the expense of liquidation smoothness, creating the structural conditions for cascade collapse. The time-compression effect explains why the deleveraging process in crypto markets is completed on a time scale of minutes: the millisecond execution speed of smart contracts and matching engines deprives traditional risk-management measures of their response window. The theory of the information paradox and mechanism-induced volatility quantifies the degree to which liquidation events distort price-discovery efficiency: unable to distinguish informational selling from mechanical closing in the order book, market makers are forced to adopt overly defensive strategies and, at the macro level, manufacture a price overshoot beyond the change in fundamentals. The compound positive-feedback model of the funding rate and liquidation reveals how extreme funding rates systematically accumulate fragility before a liquidation erupts by continuously consuming longs' maintenance margin.
The "10.10 event" provides a complete empirical validation of this analytical framework. The macro shock was amplified step by step through the weaknesses of the microstructure, the unified margin system turned in the crisis from a capital-efficiency tool into a conduit for cross-asset contagion, and the forced intervention of auto-deleveraging further weakened the market's remaining capacity to supply liquidity.
These findings have practical significance at different levels. Traders' risk management needs to go beyond monitoring individual positions and incorporate systemic liquidity conditions and leverage crowding into its assessment framework. In a highly reflexive market, an individual's leverage not only reflects their own risk appetite but also constitutes a micro-contributing factor to system fragility. Even if an individual adopts a conservative hedging strategy, they may still suffer collateral liquidation under cross-margin and auto-deleveraging mechanisms. Market-infrastructure construction, for its part, needs to place systemic-risk management at the core of product design; specifically, multi-node liquidity-weighted oracles, progressive liquidation curves, and elastic risk-reserve mechanisms are key paths to reducing cascade risk. At the regulatory level, static capital-adequacy requirements or leverage caps are no longer sufficient to cope with dynamic risk, and the regulatory focus needs to shift toward systemic-risk monitoring based on real-time data; an early-warning system that captures order-book depth changes, cross-market funding-rate anomalies, and liquidation-concentration indicators in real time is a precondition for intervening before a crisis takes shape.
The intrinsic paradox of the liquidation mechanism essentially reflects the fundamental tension between efficiency and stability in crypto-asset markets. Having understood how liquidation turns from a risk-management tool into a risk-amplification mechanism, we arrive at the next core question: when the liquidation engine has exhausted market liquidity and auto-deleveraging can no longer cover the margin shortfall, where is the system's final line of defense? This leads to the subject of the next chapter: the insurance fund. The capital structure of the insurance fund, its replenishment mechanism, and its capacity to bear stress under extreme conditions will determine the systemic resilience of the crypto-asset derivatives market.
References
[1] Ali, Z. (2025). Anatomy of the Oct 10–11, 2025 crypto liquidation cascade: Macroeconomic triggers, market microstructure, and systemic risk lessons. SSRN Electronic Journal.
[2] Marshall, M. (2025). How \$3.21B vanished in 60 seconds: October 2025 crypto crash explained through 7 charts. Amberdata Research Blog. https://blog.amberdata.io/how-3.21b-vanished-in-60-seconds-october-2025-crypto-crash-explained-through-7-charts (archived at web.archive.org)
[3] CoinGecko. (2026). What is October 10th? Crypto's 10/10 mass market liquidation event. https://www.coingecko.com/learn/october-10-crypto-crash-explained (archived at web.archive.org)
[4] BitMEX Research. (2020). The 12 March 2020 Bitcoin crash. https://blog.bitmex.com/the-12-march-2020-bitcoin-crash/ (archived at web.archive.org)
[5] Acemoglu, D., Ozdaglar, A., & Tahbaz-Salehi, A. (2015). Systemic risk and stability in financial networks. American Economic Review, 105(2), 564–608. https://doi.org/10.1257/aer.20130456
[6] Soros, G. (1987). The alchemy of finance. Simon and Schuster.
[7] Soros, G. (2009). General theory of reflexivity [Lecture series]. Central European University.
[8] Brunnermeier, M. K., & Pedersen, L. H. (2009). Market liquidity and funding liquidity. The Review of Financial Studies, 22(6), 2201–2238. https://doi.org/10.1093/rfs/hhn098
[9] CoinGlass. (2025). Cryptocurrency liquidation history data. https://www.coinglass.com/LiquidationData (archived at web.archive.org)
[10] Kyle, A. S. (1985). Continuous auctions and insider trading. Econometrica, 53(6), 1315–1335. https://doi.org/10.2307/1913210
[11] Danielsson, J., Shin, H. S., & Zigrand, J.-P. (2012). Procyclical leverage and endogenous risk. Working Paper, London School of Economics.
[12] Bikhchandani, S., Hirshleifer, D., & Welch, I. (1992). A theory of fads, fashion, custom, and cultural change as informational cascades. Journal of Political Economy, 100(5), 992–1026. https://doi.org/10.1086/261849
[13] Binance. (n.d.). Introduction to Binance Futures funding rates. https://www.binance.com/en/support/faq/detail/360033525031 (archived at web.archive.org)
[14] Thaler, R. H. (1999). Mental accounting matters. Journal of Behavioral Decision Making, 12(3), 183–206. https://doi.org/10.1002/(sici)1099-0771(199909)12:3<183::aid-bdm318>3.0.co;2-f
[15] Shleifer, A., & Vishny, R. W. (1997). The limits of arbitrage. The Journal of Finance, 52(1), 35–55. https://doi.org/10.1111/j.1540-6261.1997.tb03807.x
[16] Coinalyze. (n.d.). Aggregated cryptocurrency futures market data. https://coinalyze.net/ (archived at web.archive.org)
[17] CoinShares. (2025). Billions in crypto liquidations: Inside October's \$19B crash. https://coinshares.com/insights/knowledge/billions-in-liquidations-what-happened/ (archived at web.archive.org)
[18] Chitra, T. (2025). Autodeleveraging: Impossibilities and optimization. arXiv preprint arXiv:2512.01112v2. https://doi.org/10.48550/arXiv.2512.01112
[19] Almgren, R., & Chriss, N. (2001). Optimal execution of portfolio transactions. Journal of Risk, 3(2), 5–39. https://doi.org/10.21314/jor.2001.041
[20] Duffie, D., & Zhu, H. (2011). Does a central clearing counterparty reduce counterparty risk? Review of Asset Pricing Studies, 1(1), 74–95.
[21] Pirrong, C. (2011). The economics of central clearing: Theory and practice. ISDA Discussion Paper Series, No. 1.
[22] Binance. (2025). How does the liquidation process work on Binance. https://www.binance.com/en/support/faq (archived at web.archive.org)
[23] Hyperliquid. (2025). Hyperliquid activates cross-margin auto-deleveraging. https://hyperliquid.xyz (archived at web.archive.org)
[24] WisdomTree Prime. (2025). The great whale slap: How a whale offloaded \$4M in losses to Hyperliquid's HLP vault.
[25] Shirreff, D. (1998). Lessons from the collapse of hedge fund, Long-Term Capital Management.
[26] Investopedia. (2024). Lehman Brothers collapse explained: Causes and legacy. https://www.investopedia.com
[27] Kubali, V. (2025). Crypto crash Oct 2025: Leverage meets liquidity. FTI Consulting. https://www.fticonsulting.com/insights/articles/crypto-crash-october-2025-leverage-met-liquidity (archived at web.archive.org)
[28] Bank of England. (2023). An anatomy of the 2022 gilt market crisis.
[29] Goldstein, M. A., & Kavajecz, K. A. (2004). Trading strategies during circuit breakers and extreme market movements. Journal of Financial Markets, 7(3), 301–333. https://doi.org/10.1016/j.finmar.2003.11.003
[30] Subrahmanyam, A. (1994). Circuit breakers and market volatility: A theoretical perspective. Journal of Finance, 49(1), 237–254. https://doi.org/10.1111/j.1540-6261.1994.tb04427.x
[31] Bouchaud, J.-P., Farmer, J. D., & Lillo, F. (2009). How markets slowly digest changes in supply and demand. In T. Hens & K. R. Schenk-Hoppé (Eds.), Handbook of financial markets: Dynamics and evolution (pp. 57–160). North-Holland. https://doi.org/10.1016/b978-012374258-2.50006-3
[32] Shiller, R. J. (1981). Do stock prices move too much to be justified by subsequent changes in dividends? American Economic Review, 71(3), 421–436.