This chapter examines how price benchmarks shape market microstructure, serving not merely as technical tools but as implicit governance mechanisms. Consider a long position in Ethereum perpetual futures with a notional value exceeding $2 million and 50× leverage. The system set the position's liquidation price at $3,502.00. When the market crashes abruptly, the trading terminal displays five different prices at once: a last traded price of $3,501.50, a mid price of $3,505.00, an index price of $3,505.20, a mark price of $3,505.15, and an oracle price of $3,506.00. The last traded price indicates that the position should be liquidated; the mark price shows that it remains safe; and the oracle price implies an ample margin buffer. In the first instant of the crash, the basis component within the exponential moving average (EMA) has not yet reflected the widening negative basis, which explains why the mark price still hugs the index price rather than deviating downward. The maximum spread among these five numbers is only $4.50, yet in a high-leverage environment this micro-level difference directly determines the survival of a large financial position. The mark price, however, determines only the timing of the liquidation trigger, not the execution price of the liquidation. Under extreme conditions, the liquidation engine closes the position via market orders against an order book whose depth has severely contracted, and the actual execution price may fall far below the mark price at the moment of triggering. This gap between the mark price and the execution price—the execution slippage—often far exceeds the construction error of the mark price itself during systemic sell-offs, and the resulting loss is ultimately borne by the insurance fund and the auto-deleveraging (ADL) mechanism.
During the extreme market conditions of October 2025, the last traded price of Bitcoin on a major perpetual futures platform flash-crashed from approximately $122,500 to approximately $116,400 within 3 minutes, then rebounded to approximately $120,000 within 2 minutes [1]. Over this 5-minute window, the mark price—computed by EMA smoothing over a multi-exchange price index—declined slowly to a trough of approximately $120,300 before beginning to recover. A significant gap of approximately $3,900 separated the trough of the mark price from the trough of the last traded price. This meant that all long positions with liquidation thresholds above approximately $120,300 were spared forced closure. The EMA smoothing mechanism effectively protected these traders during this transient price spike. Had the mark price been configured with a shorter time window, or had it tracked the last traded price directly, it could have triggered an additional liquidation cascade exceeding $1 billion [1].
Within a 5-minute interval, the choice of a single smoothing parameter determined the fate of billions of dollars in open interest. This parameter is by no means a neutral technical setting; it is a governance decision embedded deep in the exchange's algorithmic architecture and carrying major economic consequences. Traditional finance offers an important precedent for the inherent risks in benchmark design. The scandal surrounding the London Interbank Offered Rate (LIBOR), exposed in 2012, showed that a seemingly objective interest-rate benchmark underpinning roughly $350 trillion in financial contracts had been systematically manipulated by the very institutions responsible for calculating it [2]. In cryptocurrency markets, the average daily trading volume of crypto derivatives has reached the level of hundreds of billions of dollars, and the liquidation logic governing this vast volume depends entirely on the mark price and the index-construction methodology. The fragility of these benchmarks is not merely theoretical: the Mango Markets attack of October 2022 demonstrated how an attacker could extract approximately $116 million within roughly half an hour by manipulating the oracle price in a low-liquidity market [3]. Moreover, during the extreme market volatility of May 19, 2021, position liquidations in the crypto derivatives market exceeded $8 billion within 24 hours, which shows how central benchmarks are to triggering liquidation cascades [4].
This chapter deconstructs the architecture and governance of price benchmarks in cryptocurrency markets. The analysis first establishes a unified framework that decomposes any price benchmark into its computational and institutional specifications. It then examines the governance implications of index construction, the inherent trilemma in mark price design, and the structural bottleneck introduced by oracle networks. By investigating how these engineered prices shift from passive measurement tools into active governance variables, the chapter reveals the microstructure consequences of benchmark design. Building on a detailed analysis of failure modes, attack surfaces, and historical liquidation cascades, the chapter ultimately proposes six design principles for building robust price-benchmark governance.
14.1 The price lineage and dual specifications
Price is not a single concept but a continuous lineage extending from micro-level execution records to macro-level governance benchmarks. The evolution from a transaction price to a governance price is not merely a simple mathematical transformation; it is a process of systematic information refinement, noise filtering, and institutional authorization. Along this lineage, each additional layer of processing increases the price's robustness and institutional authority while decreasing its immediacy and informational granularity. Figure 14-1 presents, from top to bottom, the complete processing chain from the last traded price to the oracle price, annotating the information-filtering mechanism at each layer.
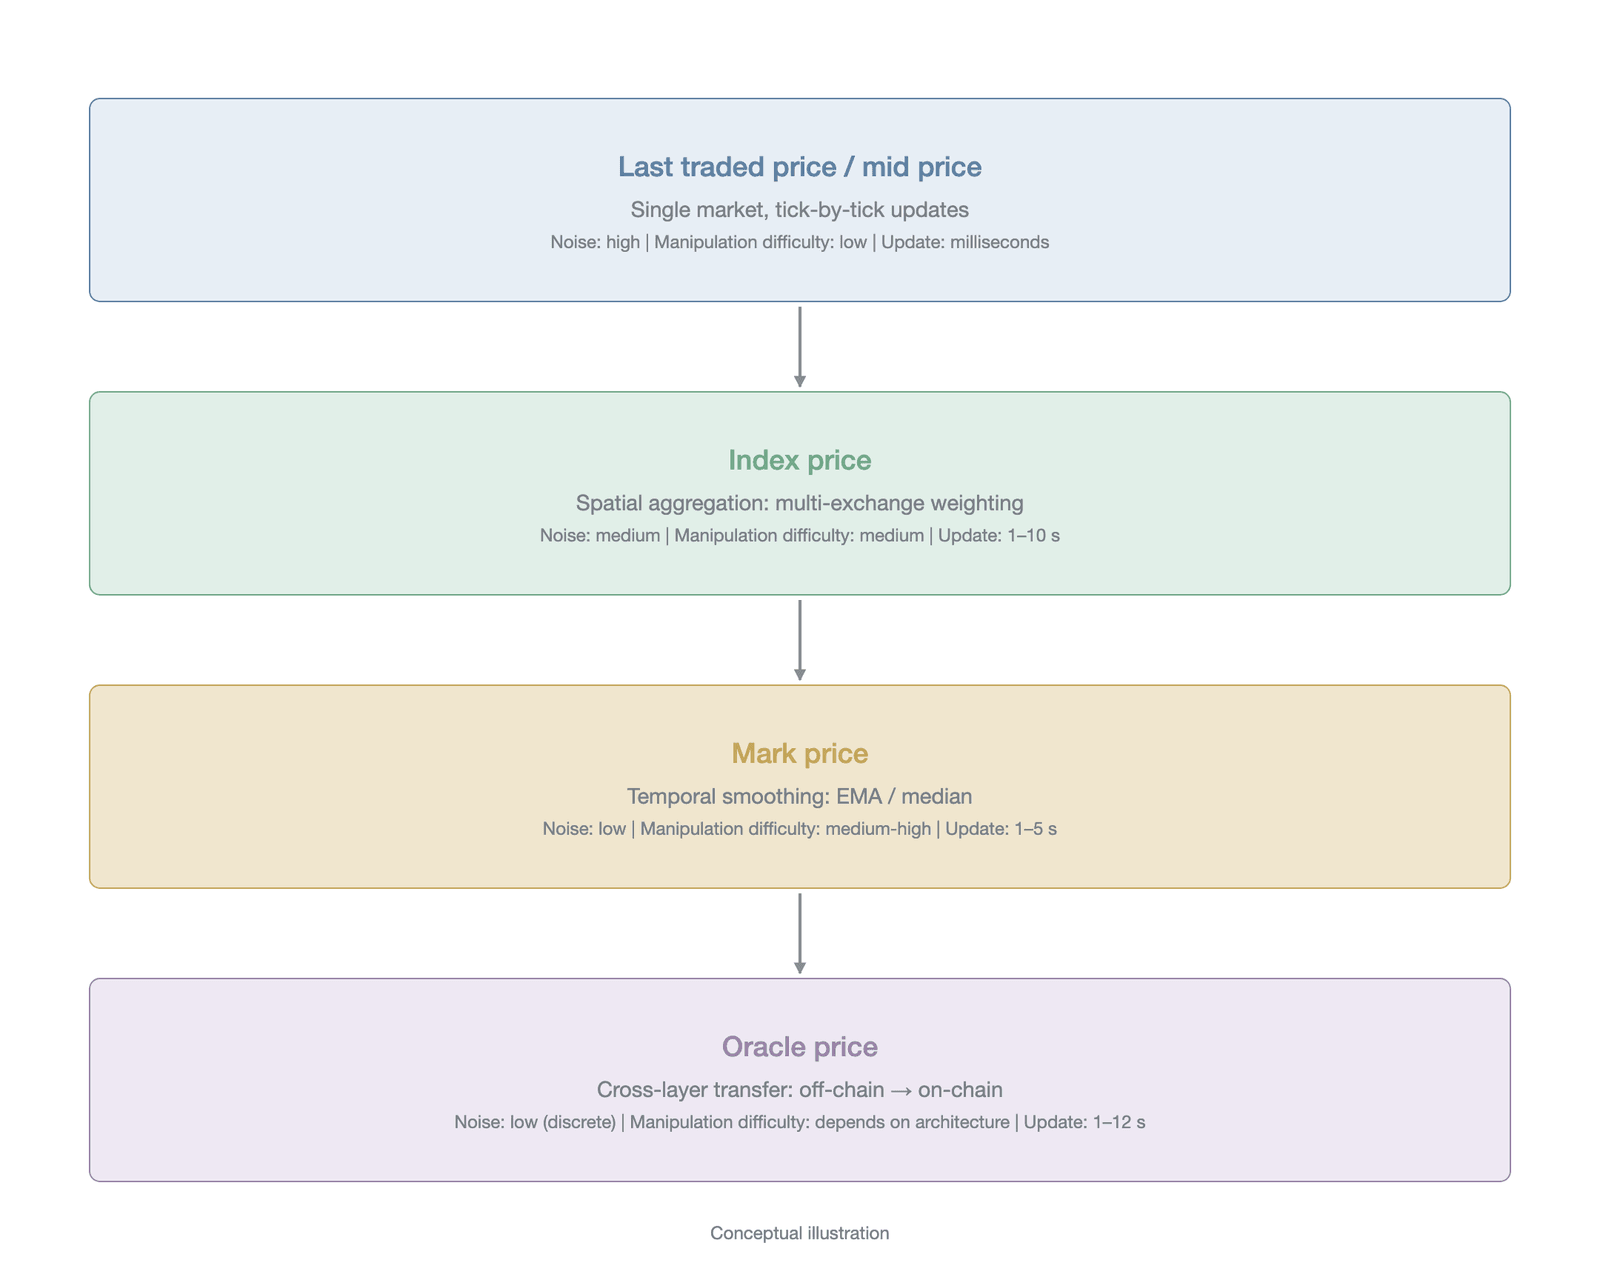
Figure 14-1. Price lineage and the information-refining chain
Any robust price benchmark must be defined simultaneously by its computational specification (which prescribes the mathematical method of calculation) and its institutional specification (which establishes the authority for management and audit)—a dual analytical framework developed in detail at the end of this section.
14.1.1 The transaction-price layer
The last traded price represents the exact price at which the most recent trade actually occurred in a given market. Its core attribute is immediate authenticity, reflecting an undeniable, completed exchange between assets. This price serves as the frontier of price discovery, providing the most immediate signal of market activity [5]. Its event-driven nature, however, means that it updates only when a trade executes and is prone to stalling during periods of insufficient liquidity. Furthermore, the last traded price is highly susceptible to idiosyncratic noise, such as erroneous orders, transient liquidity gaps, or aggressive market orders against a thin order book. For this reason, major cryptocurrency exchanges explicitly prohibit using the last traded price as the basis for triggering liquidation, so that traders are not needlessly liquidated by transient market anomalies [6].
The mid price is computed as the arithmetic mean of the best bid and best ask on the current order book. Unlike the event-driven last traded price, the mid price is state-driven, updating continuously as the order book evolves. This continuous updating provides a smoother representation of market state than the last traded price. In Hyperliquid's robust price index architecture, for example, the mid price is one of the three core inputs that determine the mark price [7]. Despite its continuity, the mid price remains constrained by its reliance on a single market. During periods of extreme volatility, as market makers withdraw liquidity, the bid-ask spread can widen sharply, causing the mid price to lose representativeness and potentially jump to irrational levels. A simple arithmetic mid price can deviate from true fair value when the resting order sizes at the top of the book are severely asymmetric. Some exchanges and market makers therefore adopt a size-weighted microprice as a more accurate estimate of fair value, but this refinement comes at the cost of greater computational complexity and data dependence. Both the last traded price and the mid price share the features of originating in a single trading venue, high immediacy, and substantial noise. They represent the raw, unprocessed facts of the market and serve as the foundational inputs for all subsequent benchmark construction.
14.1.2 The benchmark-price layer
The index price forms the foundation of the benchmark-price layer, using spatial aggregation to construct a more representative fair value. This process aggregates trading data from multiple spot exchanges that are geographically and operationally independent. This aggregation rarely uses a simple arithmetic mean. When computing the index price, for example, an exchange typically takes a weighted average of the constituent prices and automatically caps any single-exchange price that deviates too far from the median, mitigating the impact of local anomalies [8]. The core advantage of the index price is its manipulation resistance: an attacker attempting to manipulate the index must simultaneously distort the prices of multiple high-liquidity spot markets, a task whose cost and complexity far exceed those of manipulating a single derivatives market [9].
The mark price introduces temporal smoothing on top of the index price's spatial aggregation, making it the core governance price for derivatives risk management. Nearly all major centralized and decentralized exchanges treat the mark price as the sole determinant for computing unrealized profit and loss (unrealized P&L), assessing margin adequacy, and triggering liquidation [10] [8]. The basic logic is consistent across platforms: they anchor to an externally, spatially aggregated price and apply a smoothing mechanism such as an EMA or a median filter to absorb the short-term volatility inherent in derivatives markets [7]. The mark price is not merely a price but a deterministic trigger that prescribes the specific conditions under which a trader's position will be forcibly closed.
14.1.3 The on-chain price layer
The oracle price represents the third layer of the price lineage; it performs the function of transmitting aggregated price information from off-chain centralized exchanges (CEXs) to on-chain smart contracts. This transmission is facilitated by a decentralized network of validators that securely broadcast the price data onto the blockchain. The fundamental characteristic of the oracle price is its discrete, block-level update frequency, which fundamentally alters market microstructure dynamics. The blockchain's discrete public clock creates an environment in which traders no longer compete primarily on latency but instead play a predictive game around the state of the next oracle update [11]. This description applies primarily to DeFi protocols on general-purpose chains such as traditional Ethereum. On high-performance app-chains such as Hyperliquid and dYdX v4, block times have shrunk to the order of 200 to 400 milliseconds, making latency competition once again a central microstructure issue on these platforms.
This discrete update mechanism provides natural immunity to millisecond-scale price manipulation: even if an attacker succeeds in distorting the spot price for a fleeting instant, the on-chain protocol remains unaffected as long as the manipulation does not persist into the next oracle update cycle. This architecture, however, introduces a new type of risk: during extreme market volatility, the oracle price may lag significantly behind the real-time off-chain price, causing the on-chain protocol's risk assessment to diverge from actual market conditions. This lag can cause delayed liquidations or mispriced collateral, exposing DeFi protocols to systemic fragility [12].
14.1.4 The information-refining chain
The evolution across these three price layers is a process of progressive refinement and institutional empowerment. Table 14-1 compares the transaction price, benchmark price, mark price, and on-chain price across five dimensions: generation method, update frequency, noise level, difficulty of manipulation, and governance decision-maker. The table reveals a progressive pattern: as the price layer evolves from the transaction price to the on-chain price, the update frequency falls from the millisecond scale to the block level, the noise level declines, and the difficulty of manipulation rises—but governance authority also shifts from dispersed market participants to concentrated compiling institutions or protocols.
| Dimension | Transaction price | Benchmark price (index) | Mark price | On-chain price (oracle) |
|---|---|---|---|---|
| Generation method | Order-book matching | Multi-source weighted aggregation | Index plus basis smoothing | Oracle-network relay |
| Update frequency | Tick-by-tick (millisecond) | 1–10 seconds | 1–5 seconds | Block-level (1–12 seconds) |
| Noise level | High | Medium | Low | Low but discrete |
| Difficulty of manipulation | Low (single market) | Medium (requires multi-market coordination) | Medium-high | Depends on oracle architecture |
| Governance decision-maker | Market makers and traders | Exchange or index committee | Exchange or protocol | Oracle network or DAO |
Table 14-1. Comparison of microstructure characteristics across the layers of the price lineage (Data source: compiled by the author)
Beyond these four explicit price layers, the funding rate constitutes an implicit derived price signal. The funding rate is not a direct quote but a function of the basis between the mark price and the index price, reflecting how the perpetual futures market prices directional exposure. When the funding rate is positive, longs pay a holding cost to shorts, implicitly expressing the market's valuation of the current contract premium; when the funding rate is negative, the direction reverses. Although the funding rate does not directly participate in liquidation decisions as the four price layers above do, it regulates the long-short balance through economic incentives and thereby indirectly affects the speed of convergence between the mark price and the index price. It therefore occupies a derived tier in the price lineage, sitting between the mark price and the on-chain price; its governance implications are developed in detail in Section 14.6.2.
The chain begins with the last traded price and the mid price, which represent the market's raw, event-driven facts, characterized by high noise but maximal immediacy. The spatial aggregation of the index price filters out the idiosyncratic noise of individual trading venues, producing a consensus price. The temporal smoothing of the mark price adds a buffer against transient shocks, yielding a robust governance price suitable for risk management. Finally, the oracle price carries these refined benchmarks across the network boundary, delivering them to on-chain protocols as discrete pulses. Each step of processing entails a fundamental trade-off: as robustness and manipulation resistance rise, the sensitivity and immediacy of the information decline. This trade-off is not a technical defect but the central proposition of benchmark governance design.
14.1.5 Computational and institutional specifications
To evaluate any price benchmark comprehensively, a dual analytical framework comprising a computational specification and an institutional specification must be applied. The computational specification addresses the question of how the price is calculated, covering the choice of data sources, the allocation of weights, the handling of outliers, the update frequency, and the parameters of the smoothing algorithm [8] [7]. These technical specifications determine the benchmark's statistical properties, including its noise level, degree of lag, and manipulation resistance.
The institutional specification, in turn, addresses the governance and accountability structures surrounding the benchmark. It defines the benchmark's intended use cases—such as computing margin, triggering liquidation, or determining the funding rate—because different applications demand markedly different levels of precision and error tolerance. It identifies the managing entity, distinguishing a centralized risk-management department from a decentralized oracle network, which directly affects the source of credibility and the potential conflicts of interest. The institutional specification also stipulates the procedures for modifying the benchmark, such as adjusting index constituents or weights, as well as the contingency protocols for handling data-source failures or extreme market events. Understanding the institutional specification is essential to recognizing the true function and systemic risk of a price benchmark, because a small deviation in a benchmark used to trigger billions of dollars in liquidations has fundamentally different consequences from a deviation in a purely informational price feed.
14.2 Price benchmarks as implicit governance
In crypto-asset markets, price is often regarded as a neutral mathematical outcome, an objective reflection of supply and demand interacting on the order book. However, once a particular price is extracted, processed, and established as the benchmark for derivatives liquidation, collateral valuation, or protocol triggers, it sheds its purely descriptive function and becomes a governance instrument with coercive force. In the terms of institutional economics, this transformation maps onto Williamson's (1985) [13] transaction-cost governance framework: the construction of a price benchmark involves highly asset-specific data (the order-book information unique to each exchange), and this specificity creates a hold-up problem—once a derivatives market depends on a particular index-construction rule, the switching cost of changing the benchmark locks market participants into the existing governance structure. At the same time, North's (1990) [14] institutional-analysis framework reveals the nature of a price benchmark as a formal institutional constraint: the benchmark's construction rules, outlier-handling thresholds, and degradation strategies constitute a set of institutional arrangements that govern economic exchange, and their evolutionary trajectory—from the informal expert judgment of the LIBOR era to the rule-based benchmarks promoted by the International Organization of Securities Commissions (IOSCO)—follows the general pattern of a transition from informal to formal institutions. Under the framework of incomplete-contract theory, no finite set of algorithmic rules can anticipate every possible market state; consequently, the allocation of residual control rights—the modification power discussed in this section—becomes an unavoidable core problem in benchmark governance design. This section reconceptualizes the price benchmark as an implicit governance mechanism, arguing that defining how price is computed is itself a power structure that allocates market benefits and risks. Examining the functional role of these benchmarks, their inherent power dimensions, and the LIBOR manipulation case in traditional finance as a historical reference, it traces the systemic fragility that the multiple conflicts of interest in crypto markets produce, and argues that a multi-price system, understood as an institutionalized stratification, is the inevitable result.
14.2.1 Three engineered prices
In crypto derivatives markets and DeFi protocols, what traders directly confront is often not a single spot-market execution price but highly engineered prices—namely the price index, mark price, and oracle price defined in Section 14.1. Rather than restating the computational construction of the three, this section focuses on revealing their shared governance attribute: each form is optimized for a specific market friction, and its design choices directly embody the compiler's governance preference between price discovery and risk control.
In the case of the price index, its compiler exercises the power to define what counts as the real market. Exchanges included in the index receive an endorsement of their pricing authority, while liquidity excluded from it is treated as noise or an unreliable signal.
The mark price introduces buffering mechanisms such as a moving average or the funding-rate basis; this design is essentially a protective governance intervention. By delaying its confirmation of the market's latest price, the exchange or protocol sacrifices the timeliness of price discovery in exchange for the overall liquidation stability of the system.
The oracle price, in turn, must cross a trust boundary to anchor its result in a smart contract. An oracle network must not only solve the problem of data-source accuracy but also defend against economic attacks on its price-feed nodes; its governance therefore resides not only in the data-aggregation algorithm but, more deeply, in the staking-and-slashing mechanism for validators and the economic game of decentralized consensus. These three price forms are not neutral measurement tools; they are concrete expressions of specific governance objectives, determining who faces liquidation and who gains arbitrage room under extreme market conditions.
14.2.2 The four dimensions of power in price computation
To view a price benchmark as implicit governance is to deconstruct the exercise of power hidden behind the mathematical formulas. This power is not expressed explicitly through voting or proposals but is embedded implicitly in code and algorithms, taking concrete form in four dimensions of control: the power of selection, the power of weighting, the power of exclusion, and the power of modification. The power of selection determines which data sources are eligible to participate in generating the price. In the highly fragmented crypto market, spot exchanges differ enormously in liquidity depth, compliance standards, and infrastructure stability. By setting admission thresholds, the benchmark compiler is in effect rating the market. When an index announces, for instance, that it will include a given exchange's spot price in its calculation, it not only enhances that exchange's reputation but also turns its order book into an underlying asset for derivatives pricing. Conversely, stripping a data source of its eligibility means severing its influence over the derivatives market.
The power of weighting determines the distribution of pricing influence among the data sources. An equal-weighting model implies equal trust in all data sources, whereas a model weighted by trading volume or liquidity depth concentrates pricing power in the leading platforms. This allocation of weights directly affects the cost of manipulating the benchmark. If a poorly liquid exchange is assigned a disproportionately high weight, an attacker can influence the vast derivatives market with only a modest amount of capital by ramping the spot price on that platform.
The power of exclusion is the benchmark system's emergency circuit-breaker against extreme anomalies. When a data source's price deviates from the median beyond a set threshold, the algorithm triggers exclusion or truncation logic. The choice of this trigger threshold reflects the governor's demarcation between normal volatility and abnormal noise. An overly sensitive exclusion mechanism may discard a critical data source during genuine, violent market swings, while an overly sluggish setting may allow erroneous data to contaminate the entire benchmark.
The power of modification is the discretionary space that the benchmark compiler reserves outside the rule framework. When facing an unforeseeable black-swan event or a structural change such as a hard fork of the underlying asset, the compiler has the right to intervene in the calculation method on an emergency basis. Although the existence of this power provides the system with necessary flexibility, it also creates potential room for insider rent-seeking and self-dealing. These four dimensions of power intertwine to constitute the implicit governance structure of a price benchmark, turning seemingly objective numbers into the outcome of a multi-party game of interests.
Figure 14-2 compares the price deviations of different benchmarks during the Bitstamp flash crash of May 2019. The spot price on the single platform Bitstamp fell by approximately 20% within minutes, whereas the Brave New Coin index, which used data from multiple exchanges, showed a decline of only approximately 13% to 16%. The gap between the two illustrates how decisively the number of index constituents shapes manipulation resistance.
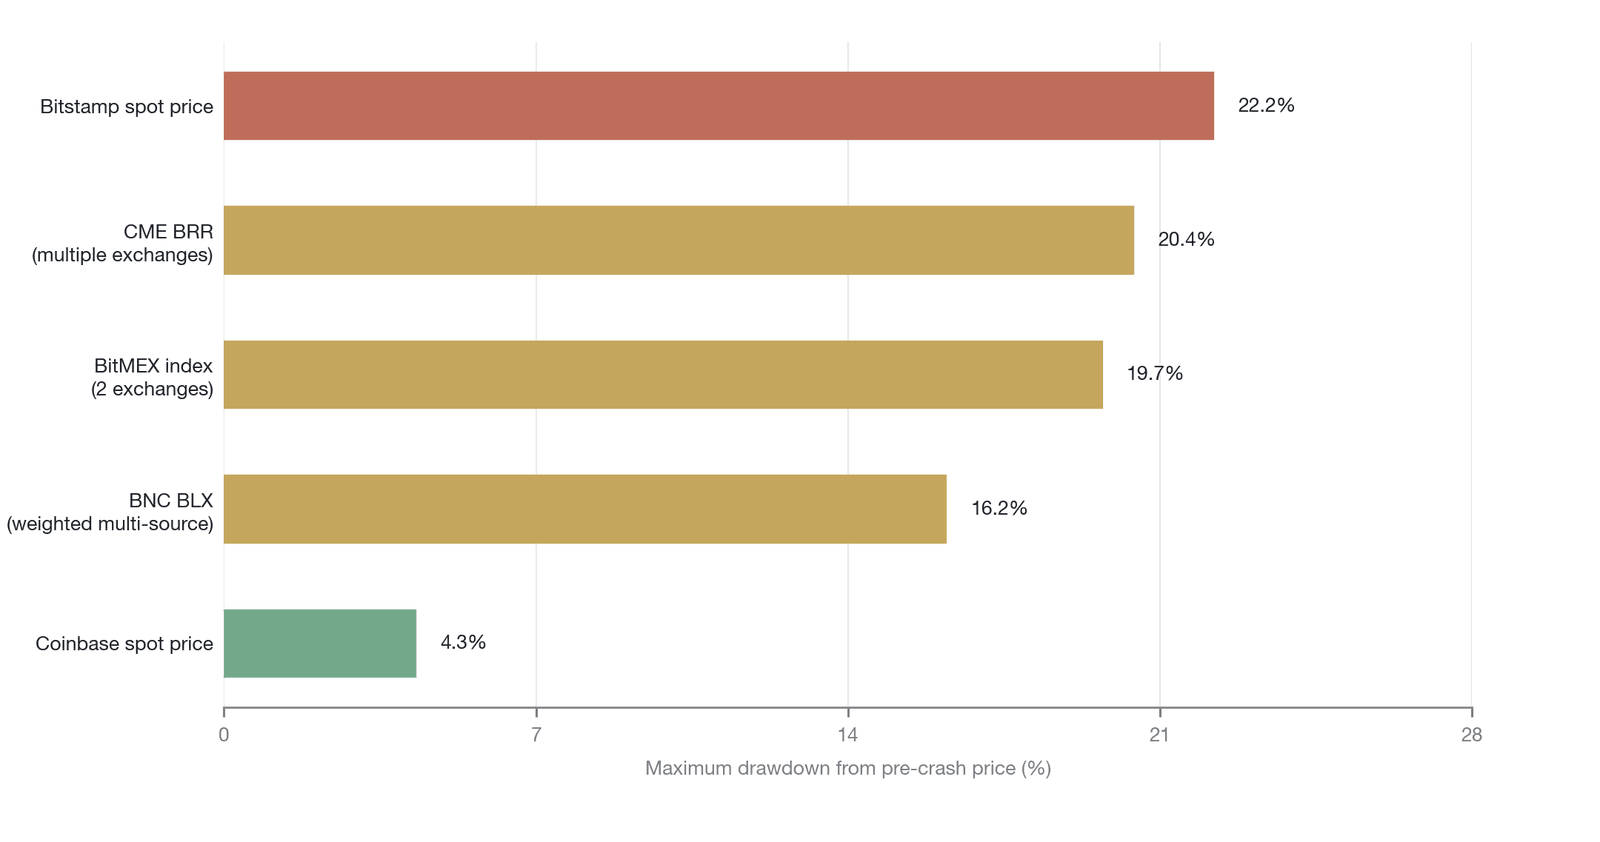
Figure 14-2. Comparison of price deviations across benchmarks during the Bitstamp flash crash
Note: The pre-crash price of $7,944 has been verified against primary records; the deviation magnitudes for each benchmark in the figure are cited from or derived from Brave New Coin's analysis and serve only as an illustrative comparison.
14.2.3 The historical lessons of LIBOR
To fully understand the fragility of a price benchmark as a governance instrument, one must revisit the most severe benchmark-manipulation event in the history of traditional finance: the LIBOR scandal. This historical reference provides a necessary frame for analyzing the structural risks of current crypto-market price benchmarks. LIBOR was once the most widely used benchmark interest rate in the global financial system, underpinning financial derivatives and loan contracts with a notional value as high as $350 trillion [15]. Yet this number, regarded as a core benchmark of financial markets, was ultimately proven to have been systematically manipulated over a long period by a small number of submitting banks.
The collapse of LIBOR did not stem from mere moral failure but from a systemic failure of its inherent governance structure. First, the benchmark's generation relied heavily on the expert judgment of a handful of large banks rather than on real underlying market transaction data. This quote-based mechanism, grounded in subjective valuation, offered significant scope for manipulation in the absence of transparency and external audit. Second, the submitting banks held vast positions in derivatives markets, and their trading desks' profits were directly tied to minute movements in the benchmark rate. This institutionalized conflict of interest gave the banks a strong incentive to manipulate the final benchmark rate by submitting false quotes in order to profit their own trading positions.
When IOSCO and national regulators intervened to investigate and drive reform, they found that the core problem lay in the loss of control over power in the benchmark's construction [16]. The central demand of the reform was to shift from quotes based on subjective judgment to anchoring on real transaction data, and to establish strict benchmark governance and conflict-of-interest firewalls [2]. The lesson of LIBOR is that any price benchmark that lacks transparency, harbors serious conflicts of interest, and affects enormous financial interests will inevitably become a target for attack and manipulation. The fundamental reason LIBOR manipulation persisted for so long was that the benchmark rested on banks' subjective quotes rather than on actual transaction data. Crypto-market index prices are typically anchored to real on-chain or off-chain execution records, and this difference in informational foundation makes the same kind of systematic false quoting harder to achieve in the crypto context. Nevertheless, the core lesson of the LIBOR scandal—that the interweaving of concentrated governance power and conflicts of interest inevitably distorts a benchmark—reappears in crypto markets in an even more concentrated form through the three-in-one structure. From the perspective of comparative institutional analysis, the manipulation risk facing crypto-market price benchmarks more closely resembles the manipulation patterns of foreign-exchange fixings or commodity-benchmark window trading—that is, distorting the benchmark result through real trades within a specific time window. This lesson carries important significance for crypto derivatives markets, which depend so heavily on engineered prices.
14.2.4 Conflicts of interest in crypto markets
If the LIBOR scandal revealed the destructive power of benchmark manipulation in traditional finance, then the structure of the current crypto derivatives market embodies an even higher degree of systemic risk. In the traditional financial system, the benchmark compiler, the exchange, and the clearinghouse are typically separate entities, whereas in crypto markets a centralized exchange often combines all three roles. This three-in-one structure produces highly concentrated conflicts of interest, exposing the implicit governance of price benchmarks to significant moral hazard.
First, a crypto exchange is simultaneously the compiler and the user of the price index. It independently decides the index's constituents, weights, and outlier-handling rules while applying those indices to the perpetual futures and delivery futures on its own platform. More critically, the exchange is also the operator of the liquidation engine and the manager of the risk reserve. When the market swings violently, the exchange holds the power to decide, by adjusting the mark price algorithm, whether to trigger large-scale liquidations. This power affects not only users' profits and losses but also, more directly, the exchange's own liquidation revenue and systemic risk exposure.
The quality of the underlying spot data in crypto markets is itself deeply contentious. Numerous studies show that many unregulated crypto exchanges engage in serious wash trading and volume inflation, severely distorting publicly reported trading volumes [17]. If the compilation of a price index relies excessively on these contaminated data sources, or fails to effectively strip out fake liquidity when allocating weights, then the derivatives market built upon it stands on an unreliable data foundation. The flash crash on a leading exchange in 2019 occurred precisely because a derivatives platform's price index relied excessively on a single spot exchange, so that a local selling pressure in the spot market was amplified into a chain of liquidations in the derivatives market, causing hundreds of millions of dollars in forced closures [9]. This structural fragility shows that crypto-market price benchmarks face not only the risk of manipulation by external attackers but also the immense pressure of internal governance failure.
This three-in-one structural conflict of interest has drawn the attention of the world's major financial regulators. Article 72 of the European Union's Markets in Crypto-Assets (MiCA) regulation sets out explicit requirements for crypto-asset service providers to identify, prevent, manage, and disclose conflicts of interest [18]; the systematic principles specifically addressing the isolation of conflicts of interest in benchmark administration were established in IOSCO's 2013 Principles for Financial Benchmarks [16], and IOSCO's 2023 Policy Recommendations for Crypto and Digital Asset Markets likewise set out general norms for the conflict-of-interest governance of crypto service providers [19]. This means that the benchmark governance power many exchanges currently wield on their own may, in the future, shift from a voluntary design choice to a mandatory legal obligation; Chapter 26 discusses this regulatory evolution in detail.
14.2.5 The inevitability of a multi-price system
Facing the inherent governance dilemmas and structural risks of price benchmarks, crypto markets did not pursue a single, perfect, universal price but instead evolved a multi-price system. This system is not design redundancy but an institutionalized stratification arising from a mathematical incompatibility between the fundamental requirements that different financial functions place on price attributes. In market microstructure theory, price discovery and risk control are two objectives pointing in sharply different directions [5]. Price discovery requires a benchmark to be extremely sensitive to marginal changes in market information, able to reflect the latest supply-demand imbalance rapidly. Yet this sensitivity inevitably introduces microstructure noise and short-term volatility. Conversely, risk control—such as derivatives liquidation and collateral valuation—requires a benchmark to be highly robust, able to filter out transient anomalous swings and prevent the system from falling into a self-fulfilling spiral of chained liquidations.
This inconsistency of objectives dictates that the spot last traded price, the price index, and the mark price must exist in stratified layers. The spot price bears the function of price discovery, allowing arbitrageurs to eliminate spreads across different markets; the price index, through cross-market weighting, provides a relatively smooth fair-value reference; and the mark price, by introducing a time-weighted average or basis limits, further sacrifices timeliness to serve as the terminal safeguard of risk control. This multi-price system is essentially a governance compromise the market reaches between sensitivity and robustness. It acknowledges that no single calculation method can satisfy the needs of all financial scenarios at once, and therefore, through institutionalized stratification, it allocates risks and benefits along different dimensions to the market participants best suited to bear them. The evolution of this implicit governance mechanism marks the emergence of a distinctive microstructure logic in crypto markets as they confront the challenges of complex financial engineering.
14.3 The five governance links of index construction
The construction of a price index is not a purely technical computation but a systematic engineering of a series of governance decisions. From raw market trade data to the final fair price that serves as the derivatives pricing benchmark, the data must pass through multiple filtering, weighting, and smoothing mechanisms. This section deconstructs the process into five governance links: source admission, the weighting scheme, outlier handling, update smoothing, and stress degradation. These five links are tightly coupled, together forming the defensive system and power structure of the price benchmark. The design choices at each link shape the benchmark's manipulation resistance, its market sensitivity, and how gains and losses are distributed under extreme conditions. By dissecting these five links one by one, we reveal the microstructure consequences behind index construction and explore how an index evolves, in reverse, from reflecting prices into a financial infrastructure that steers prices.
14.3.1 Overview of the five governance links
In crypto derivatives markets, the generation of a price index is a highly engineered process whose core objective is to extract, from spot markets rife with noise, manipulation risk, and fragmented liquidity, a fair value that both derivatives traders and the liquidation engine can trust. This extraction process can be conceptualized as a governance framework composed of five consecutive links—the five governance links.
The five governance links unfold in sequence along the direction of data processing. The starting point is source admission, which determines which spot exchanges' order-book and trade data are eligible to enter the index's computation pool; through screening for compliance, liquidity, and technical stability, it excludes low-quality or high-risk markets. Once the eligible sources are determined, the weighting scheme allocates pricing influence among the admitted exchanges; whether it uses volume weighting, equal weighting, or a hybrid tiered model, the weighting scheme directly determines the index's sensitivity to the fluctuations of different markets. Next comes the outlier-handling link, whose function is to monitor and filter extreme deviations in the data sources in real time; by setting a median-deviation threshold or trimming extreme values, it prevents a single exchange's flash crash or malicious manipulation from contaminating the overall index. The outlier-filtered data then enter the update-smoothing stage, which applies primarily to the generation of the mark price; by introducing a time-weighting or moving-average mechanism, it processes the index a second time to buffer sharp short-term fluctuations and prevent the derivatives market from falling into a chain of liquidations triggered by microstructure noise. The terminal link is stress degradation—the system's emergency mechanism when facing an extreme disaster, such as the outage of multiple major exchanges or a widespread failure of data sources. It defines how the system transitions smoothly from multi-source aggregation to single-source reliance, or even, in the most extreme case, activates circuit-breaker protection. These five links are tightly interconnected, and the parameter settings of each represent a governance trade-off the compiler makes between price discovery and system stability.
Figure 14-3 summarizes the five governance links of index construction and the microstructure transmission mechanism.
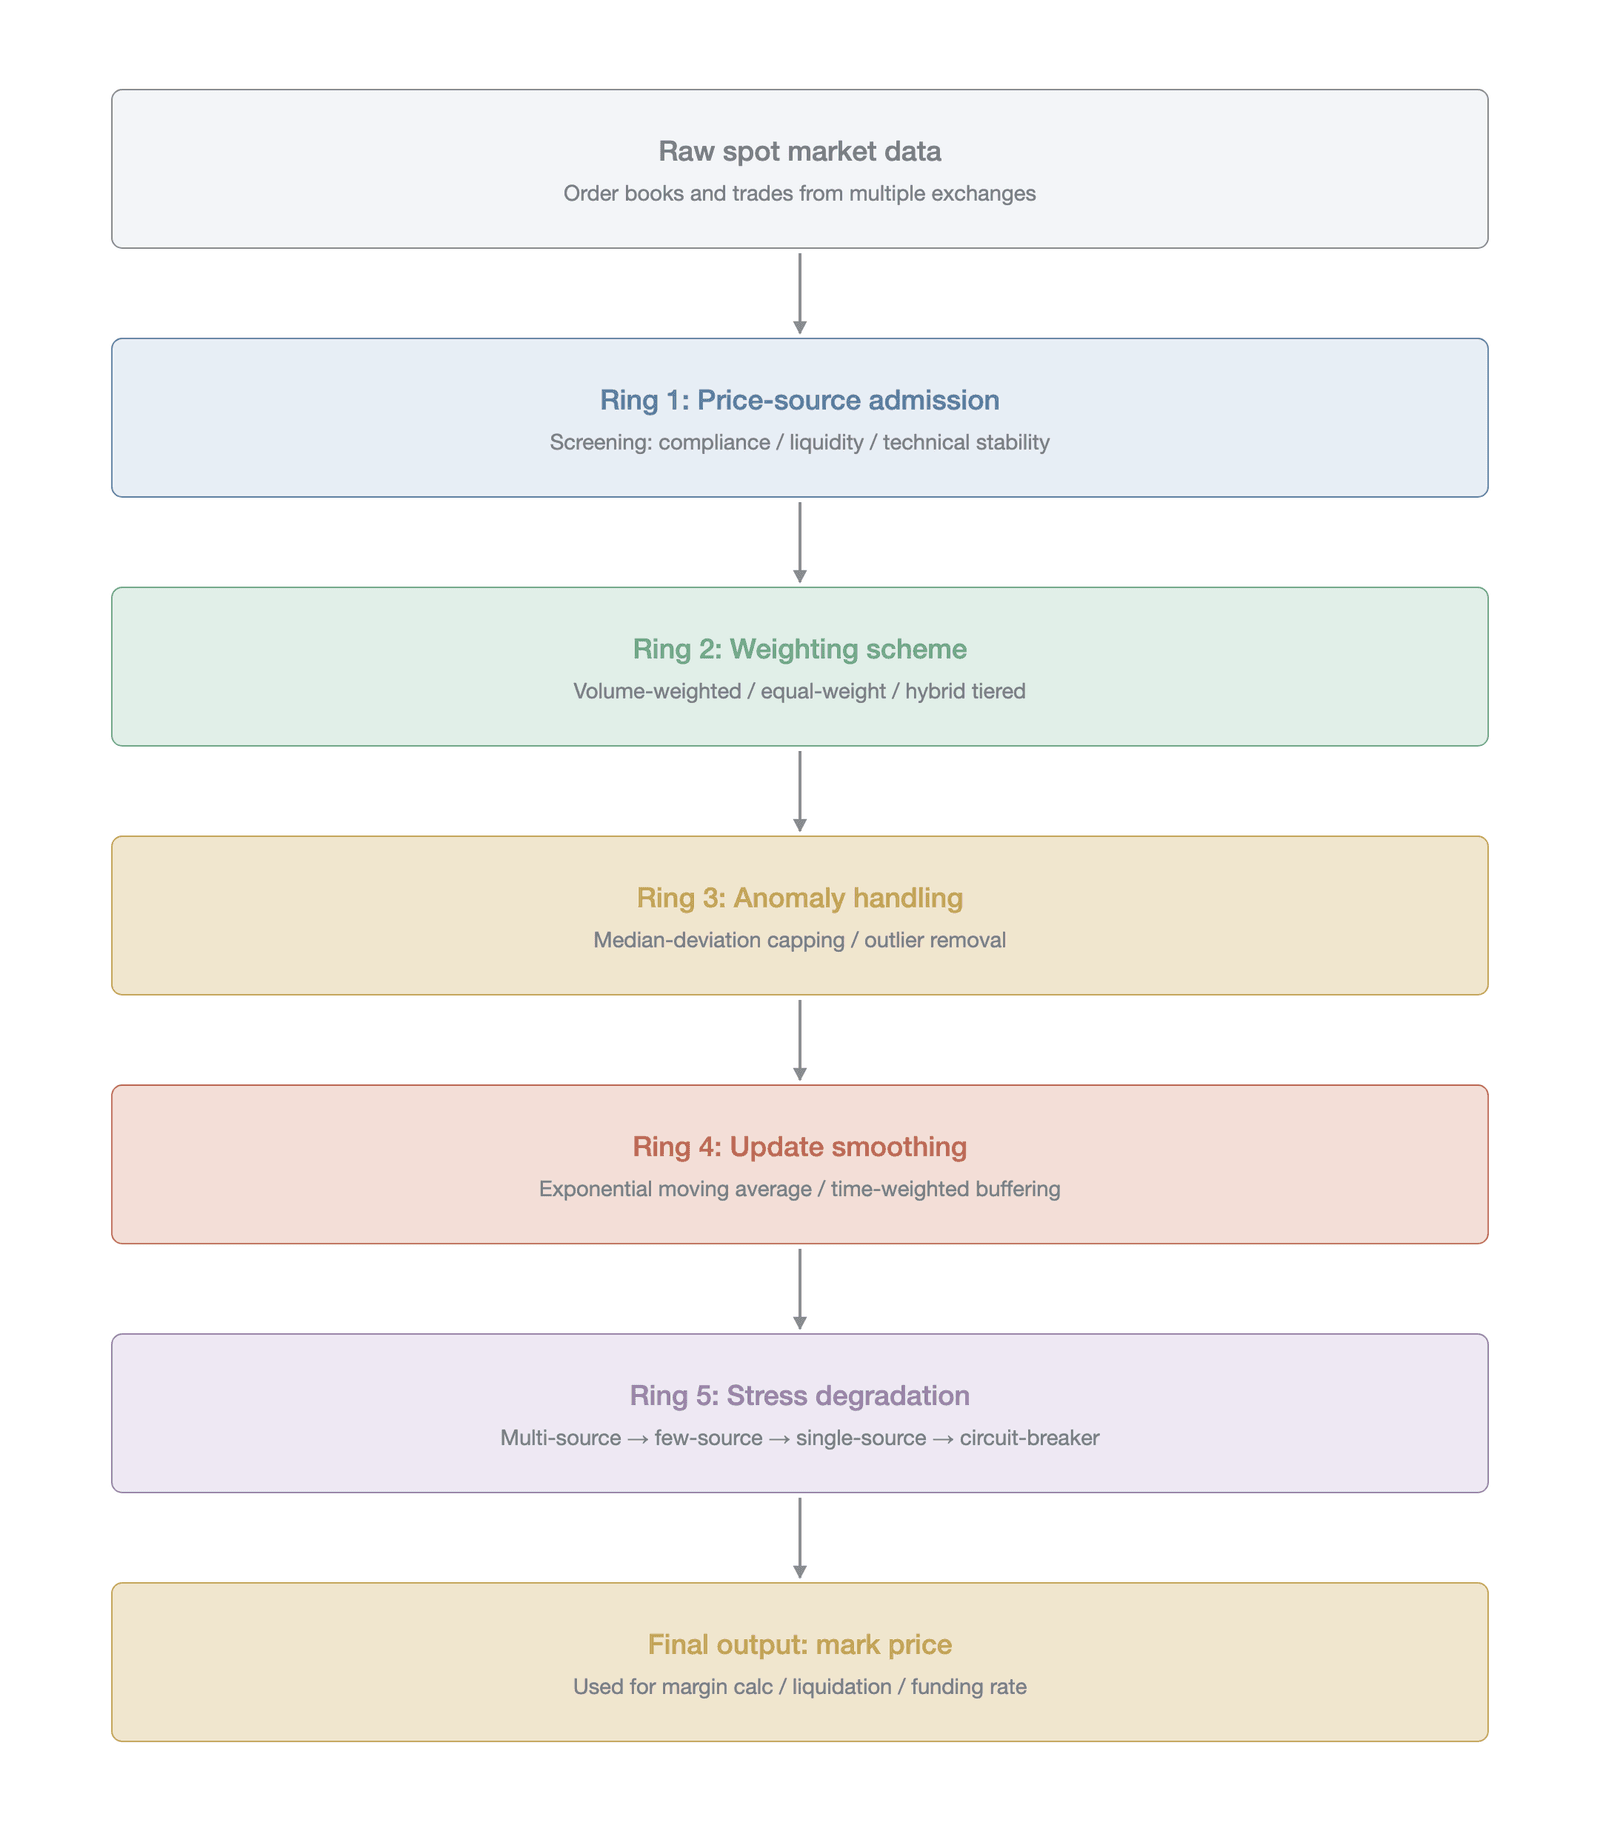
Figure 14-3. The five governance links of index construction and the microstructure transmission mechanism
The figure clearly displays the serial dependency among the five links: the decisions of source admission directly constrain the candidate set for the weighting scheme, the threshold parameters of outlier handling determine the quality of the data entering the update-smoothing stage, and the trigger conditions of stress degradation depend on the degree of redundancy in the first four links. Any parameter adjustment in a single link propagates downstream along this chain structure, ultimately affecting the timing and precision of liquidation triggering.
14.3.2 Source admission
Source admission is the first line of defense in index construction and the link with the most pronounced governance implications. In traditional financial markets, the underlying data for a benchmark typically come from strictly regulated exchanges or large market makers, so their data quality carries a natural compliance endorsement. Crypto markets, however, exhibit high fragmentation and regulatory-arbitrage characteristics, and different exchanges vary significantly in liquidity depth, trading rules, and anti-manipulation mechanisms. Deciding which exchanges to include as index constituents is therefore essentially the process of granting these platforms pricing authority.
A compiler typically establishes a complex set of admission criteria, including but not limited to minimum volume requirements, order-book bid-ask spread limits, the stability of the application programming interface (API), and compliance status. Some leading index compilers, for instance, explicitly exclude from their constituent pool any exchange suspected of serious wash trading or lacking basic anti-money-laundering measures [20]. This admission mechanism not only protects the accuracy of the index but also exerts a significant normative effect on the entire crypto ecosystem. A spot exchange included in a mainstream derivatives index tends to attract more market makers and arbitrage capital, further boosting its liquidity, whereas an excluded exchange may face the marginalizing risk of liquidity depletion.
Source admission, however, also faces severe governance challenges. The first is the too big to fail dilemma. If a leading exchange with a dominant market share suffers a compliance crisis or technical failure, the index compiler faces a dilemma: excluding it may cause the index to lose its most representative price signal, while retaining it may inject enormous systemic risk into the derivatives market. Second, excessive concentration of sources can create a single point of failure. When a derivatives platform's index relies excessively on a single or a very small number of spot exchanges, an attacker need only concentrate capital on manipulating the weak link of that spot market to reap outsized profits in the derivatives market. A decentralized oracle manipulation incident in 2022 arose precisely because its price-feed mechanism relied excessively on a single, highly illiquid decentralized exchange (DEX), allowing the attacker to manipulate the underlying asset's price at extremely low cost and thereby drain the protocol's reserves [6]. As global regulatory frameworks gradually take shape, jurisdictional compliance status is becoming an emerging screening dimension for source admission. Under regimes such as Japan's Financial Services Agency (FSA) registration regime, the Monetary Authority of Singapore (MAS) licensing regime, and Hong Kong's Securities and Futures Commission (SFC) virtual-asset-trading-platform licensing regime, constructing an index for regulated participants using price data from unlicensed exchanges may itself face compliance challenges. In late 2022, Avraham Eisenberg was arrested by the U.S. Department of Justice for manipulating the oracle price on Mango Markets, and in April 2024 a jury found him guilty of charges including commodities fraud; that conviction, however, was vacated in May 2025 by the U.S. District Court for the Southern District of New York under Rule 29 of the Federal Rules of Criminal Procedure (on the grounds of improper venue and insufficient evidence on the elements of fraud, with the prosecution having filed an appeal), so its legal characterization remains unsettled [21]. This reversal itself reveals the high degree of uncertainty in the criminal prosecution of on-chain manipulation, both as to venue and as to establishing the elements of fraud, and it means that the expected legal-cost term in the cost-benefit equation of manipulation analyzed in Section 14.5.8 remains subject to significant uncertainty. Source admission is therefore not merely a technical screen but a profound act of governance over the distribution of market liquidity and the concentration of risk.
14.3.3 Weighting schemes
Once the eligible sources are determined, the next core question is how to allocate pricing weight among these data sources. There is no absolutely correct mathematical answer to the design of a weighting scheme; each method is an expression of specific assumptions about market microstructure characteristics and of governance preferences. The most intuitive approach is the volume-weighted model, which allocates weights according to each exchange's spot trading volume over a recent period. The underlying logic of this model is that liquidity equals representativeness: the larger a market's trading volume, the more effective its price-discovery function, so it should dominate the index. In crypto markets, however, volume data are often prone to contamination by wash trading. If the index compiler fails to identify and strip out fake volume effectively, the volume-weighted model instead transfers pricing power to inferior exchanges that manufacture fake liquidity through wash trading.
To overcome the shortcomings of volume weighting, some indices adopt an equal-weighting model. This model assumes that all exchanges passing the admission test have equal pricing efficacy, thereby avoiding an excessive concentration of pricing power in a single giant. The equal-weighting model has an advantage in guarding against a single point of failure at a leading exchange, but it also has an obvious weakness: when the market swings violently, poorly liquid small exchanges tend to exhibit larger price deviations, and under an equal-weighting model these anomalous swings exert a disproportionate disturbance on the overall index.
A growing number of leading derivatives platforms have adopted a hybrid tiered model [22]. This model jointly considers multiple dimensions such as trading volume, order-book depth, and price deviation. When computing weights, for example, it looks not only at historical volume but also samples the resting depth on the bid and ask in real time; at the same time, if one exchange's latest price deviates from the median of all constituent exchanges, its weight may be dynamically reduced or even set to zero. By introducing a dynamic feedback mechanism, this hybrid model allows the index to reflect the consensus of mainstream liquidity under normal market conditions while rapidly isolating the risk of anomalous nodes under extreme conditions. This sophisticated weight design is essentially a governance practice in which the compiler, through algorithmic rules, finely regulates the strategic behavior of market participants.
Figure 14-4 contrasts the differences among major derivatives platforms in the number of price sources and the methods of outlier handling.
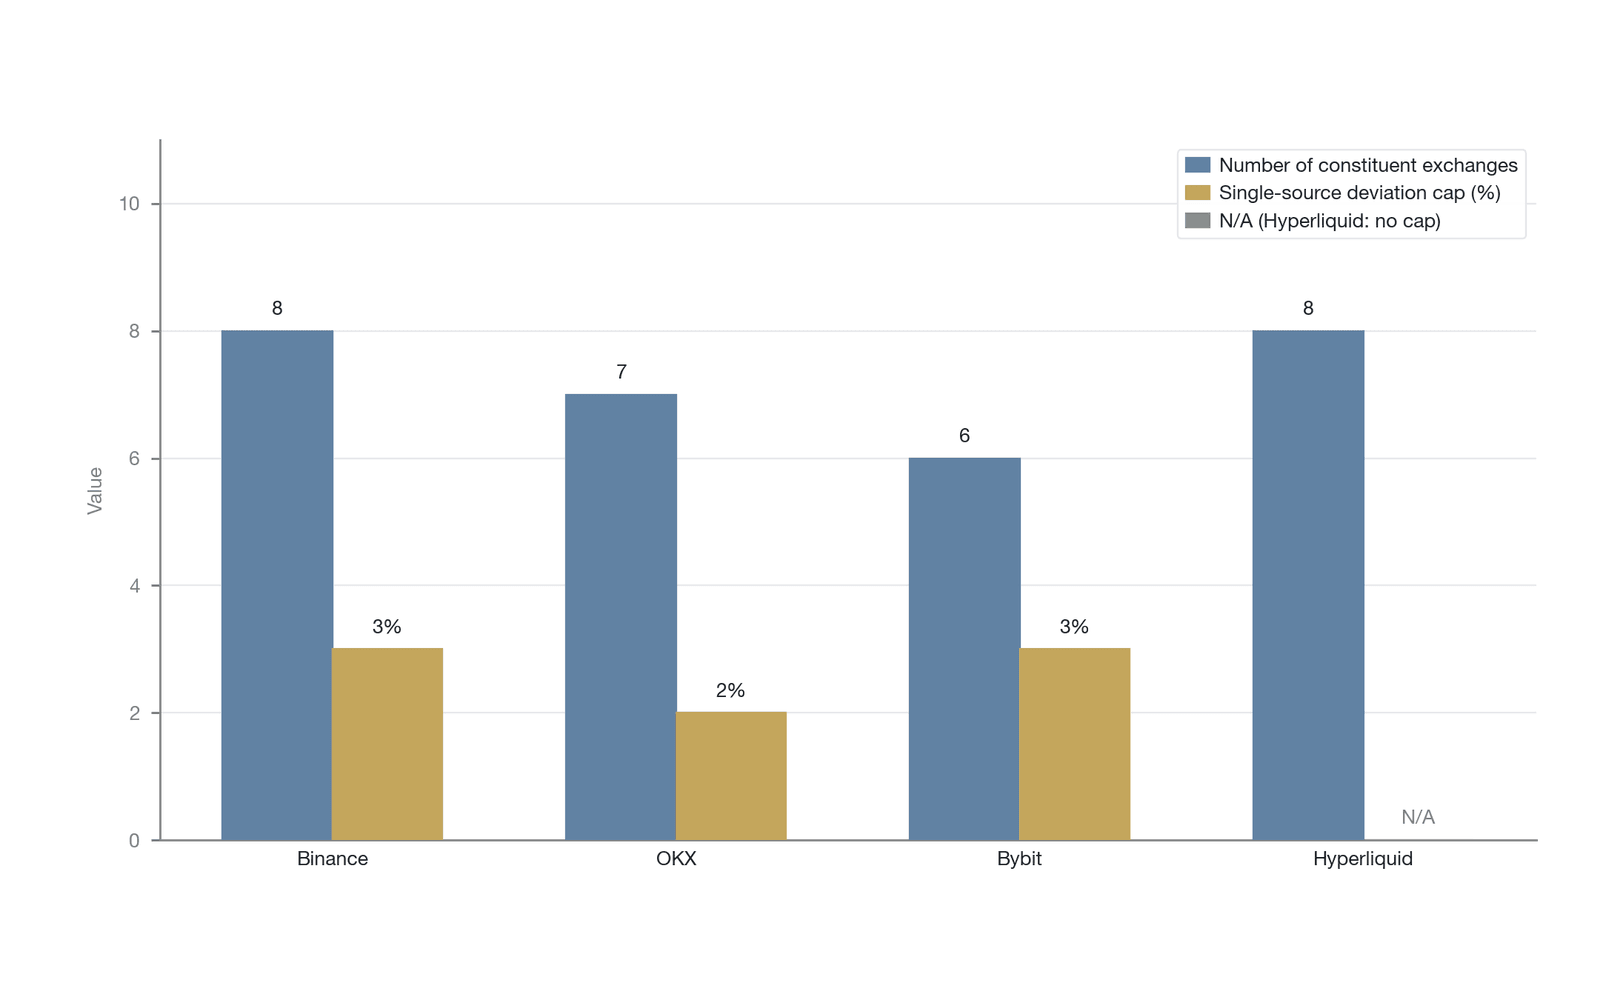
Figure 14-4. Comparison of index-construction methods across major derivatives platforms
Note: The number of constituent exchanges and the single-source deviation clamp threshold in the figure were compiled by the author from each platform's official documentation (as of March 2026); construction rules change over time, and the definitive configuration is whatever each platform's latest documentation states. In addition, the number of constituent exchanges in this figure and the number of price sources in Table 14-2 are metrics on different bases (the former is the count of constituent exchanges included in index construction, the latter is the number of price sources referenced beneath the mark price), so any discrepancy between the two values is not a contradiction.
The figure shows that platforms differ by several times in the number of price sources, which directly determines the level of robustness each index has when facing a single-exchange anomaly. Platforms that use more price sources typically pair them with more complex outlier-exclusion logic, whereas platforms with fewer sources tend to compensate by relying on stronger median-truncation mechanisms. This differentiated construction strategy reflects each platform's governance trade-off between operational complexity and manipulation resistance.
14.3.4 Outlier handling
In the process of aggregating multi-source data, outlier handling is an indispensable governance link. Because exchanges differ in liquidity depth, network latency, and market-maker strategies, it is common for one constituent exchange's price to deviate momentarily at a particular instant. The core task of the outlier-handling mechanism is to strike a delicate balance between filtering microstructure noise and preserving genuine market signals.
The most common outlier-handling method is a median-based deviation limit. The system computes the median of all constituent exchanges' prices in real time and sets an allowable deviation threshold (for example, 2% or 3%). If one constituent exchange's price exceeds this threshold, the system does not adopt that extreme price directly but instead clamps it to the threshold boundary [8]. If the median is $10,000 and the deviation cap is 3%, for instance, then even if one exchange's price surges to $11,000, the system will treat it as only $10,300 when computing the index. This clamping mechanism effectively prevents a single exchange's wick from damaging the overall index.
The design of the outlier-handling mechanism, however, is fraught with governance challenges. If the deviation threshold is set too narrow, the system may misjudge a genuine, drastic market change as anomalous noise. When the market faces a systemic shock (such as a major macro event or the release of a regulatory policy), different exchanges will inevitably react at different speeds because of their liquidity differences. Overly strict outlier handling may cause the index to lag behind the real market price at a critical moment, thereby inviting arbitrage attacks on the derivatives market. Conversely, if the threshold is set too wide, it cannot effectively guard against extreme deviations caused by malicious manipulation or technical failure. Outlier handling is therefore not merely a statistical trimming operation but an institutionalized expression of the governor's tolerance for market volatility.
14.3.5 Update smoothing
After price aggregation and outlier filtering, the index often needs to undergo update smoothing to further adapt to the risk-control needs of derivatives markets, thereby generating the final mark price. The core tools of smoothing include algorithms such as the EMA, the median filter, and the time-weighted average price (TWAP), each with different characteristics in noise filtering and the amount of latency it introduces. The fundamental reason for introducing a smoothing mechanism is that the liquidation logic of derivatives markets has an inherent self-exciting feature: when the market price briefly touches a certain level, it may trigger the forced closure of a large number of leveraged positions, and these closing orders flood the market as market orders, pushing the price further in the adverse direction and triggering still more liquidations, forming a positive-feedback loop. The smoothing mechanism breaks this loop by artificially slowing the update speed of the mark price: a transient price spike, buffered by the moving average, causes only a mild displacement of the mark price [7], giving leveraged traders an adjustment window in which to post additional margin or wait for liquidity to recover. Yet the smoothing mechanism trades timeliness for stability: during the smoothing period, a basis necessarily exists between the mark price and the spot price, providing room for arbitrageurs, and it also means that in a one-sided move the derivatives market's price signal always lags the spot market. The choice of smoothing parameters therefore directly reflects the governor's value orientation between protecting leveraged traders and maintaining pricing efficiency. The quantitative analysis of EMA latency and its liquidation consequences is developed in detail in Section 14.4.3.
14.3.6 Stress degradation
The final governance link in index construction is the stress-degradation mechanism. Ideally, multi-source aggregation can provide a stable and representative price benchmark. Yet crypto-market infrastructure remains relatively fragile, and extreme events such as exchange outages, network blockages, or API failures occur from time to time. When multiple constituent exchanges lose connectivity simultaneously, or when a momentary evaporation of market liquidity causes quotes to fail on a large scale, the index system must have a contingency plan to ensure that the derivatives market is not paralyzed by the loss of its pricing benchmark.
The stress-degradation mechanism is typically designed as a progressive degradation strategy. When some data sources fail, the system first attempts to reallocate weights, transferring the weight of the failed nodes to the remaining normal nodes. If too many nodes fail and the remaining constituent exchanges are insufficiently representative, the system may trigger a second level of degradation—for example, interpolating with historical prices or estimating by reference to the trajectory of other comparable indices.
The degradation strategy above harbors a key assumption: that source failure is detectable—that is, the system can clearly distinguish between the states of a source being unavailable and a source providing data. In the security literature on distributed systems, however, the more dangerous case is Byzantine failure, in which a data source is still operating normally and continuously outputting prices, but its output has been maliciously or erroneously shifted. A sophisticated attacker would not take an exchange offline (which would trigger an obvious degradation process); instead, the attacker might maintain a small but systematic price shift in a heavily weighted constituent exchange, keeping the anomalous price within the median-deviation threshold so that the outlier-handling mechanism does not identify it. When the deviation threshold described in Section 14.3.4 is set at 2% to 3%, a persistent shift below that threshold will be treated as normal volatility and fully incorporated into the index calculation. Defending against this attack requires going beyond simple threshold detection to introduce statistical anomaly tests across time windows and consistency checks across data sources.
In the most extreme case, when all external data sources are unavailable, the system must activate its last line of defense. Some exchanges adopt a last-price protection mechanism: in the absence of an external reference, they temporarily use the derivatives contract's own last traded price as the interim benchmark for computing unrealized P&L and triggering liquidation [11]. Although this single-source degradation is extremely dangerous and prone to internal manipulation, it is the only choice for keeping the market running when the system faces total failure. The design of the stress-degradation mechanism depends on the governor's crisis-management capability under extreme uncertainty. It determines whether, when disaster strikes, the system chooses a rigid circuit-breaker halt to protect the accuracy of the price, or a compromising degradation to maintain the continuity of trading.
14.3.7 Microstructure consequences
Taking the five governance links of index construction together, one microstructure phenomenon deserves attention: in crypto markets, a price index is no longer merely a measurement tool that objectively reflects prices but has evolved into a financial infrastructure that can, in reverse, steer prices. This reflexivity effect is transmitted mainly through market-maker behavior and arbitrage mechanisms.
First, the design of the index's constituents and weights directly shapes market makers' hedging strategies. Because the pricing and liquidation of derivatives depend heavily on the index, market makers must hedge their exposure on the spot market when providing derivatives liquidity. To minimize basis risk, market makers tend to conduct their hedging trades on the heavily weighted constituent exchanges. This behavioral logic causes liquidity to concentrate further in the leading constituent exchanges, continually reinforcing their pricing power in the spot market. The allocation of index weights thus becomes, in effect, the core variable that steers the market's decisions about where liquidity flows.
Second, the index's outlier-handling and smoothing mechanisms create specific arbitrage opportunities. When the spot market swings violently while the mark price has not yet fully caught up because of the moving-average buffer, arbitrageurs are quick to exploit this deterministic lag. By taking offsetting positions between the spot and derivatives markets, they seek to profit from the process by which the mark price ultimately reverts to the spot price. Although this arbitrage activity objectively promotes the convergence of prices across markets, at the microstructure level the influx of arbitrage capital also exerts a significant impact on the spot market's order book and, under specific conditions, can even amplify the spot market's volatility.
Empirical research supports the reflexivity effect described above. Makarov and Schoar's (2020) [23] study of cross-exchange arbitrage in cryptocurrency markets shows that the speed at which price spreads between exchanges are eliminated is positively correlated with an exchange's weight in mainstream indices: the higher an exchange's weight, the faster arbitrage capital flows in and the more rapidly spreads converge, which corroborates precisely the mechanism by which index weights, in reverse, shape the distribution of spot-market liquidity by steering the flow of hedging and arbitrage capital. The causal interpretation of this correlation, however, warrants caution. A high-liquidity exchange is both more likely to be included in an index and given a higher weight and naturally has a faster spread-elimination speed, and liquidity, as a common driver, may simultaneously determine both the weight and the arbitrage speed. To identify rigorously the causal effect of index weight on arbitrage activity would require a natural-experiment design that uses index-constituent adjustment events as exogenous shocks. More fundamentally, when a price index is widely adopted and becomes the settlement benchmark for tens of billions of dollars in derivatives contracts, it becomes a systemically important financial infrastructure in its own right [12]. Any small rule adjustment to that index—whether adding or removing a constituent exchange or modifying the 1% deviation threshold—triggers an enormous redistribution of wealth in the derivatives market. Index construction is therefore no longer a purely quantitative engineering task but a governance practice involving a multi-party game of interests. In this process, the power to define how price is computed has become the most consequential and least transparent governance power in the crypto financial system.
14.4 Mark price and liquidation triggering
The mark price is not a market execution price in the traditional sense but the core trigger within a derivatives exchange's risk-control system. It determines the conditions under which a trader's position will be forcibly liquidated, and its design faces a trilemma among accuracy, robustness, and timeliness. The EMA smoothing mechanism offers protection against short-term manipulation but can create a retroactive-liquidation trap in violent reversals. Each method of computing the mark price is essentially an expression of the exchange's governance preference across different market-risk scenarios, directly shaping the microstructure consequences of liquidation events.
14.4.1 The institutional status of the mark price
In crypto derivatives markets, the mark price is granted the highest institutional status, reflected in its designation as the sole benchmark for three core risk-control functions. The mark price is the absolute benchmark for computing unrealized P&L: the floating profit and loss displayed in a trader's account is not based on the last traded price but is determined by the mark price. This design defines a trader's book wealth at any given moment, thereby protecting the trader from the psychological interference of ultra-short-term order-book noise and preventing the sharp book swings caused by a single anomalous trade from triggering irrational behavior.
The mark price is also the basis for computing the margin ratio. Major exchanges all use the mark price to compute position value and the margin ratio, with the core aim of preventing users from being liquidated within a short window because the last traded price has been maliciously manipulated. When market liquidity dries up momentarily or suffers a large directional shock, the last traded price on the order book may deviate sharply, whereas the mark price—built from global data—can remain relatively stable, ensuring the fairness of margin computation. In a high-leverage environment, even a 0.5% price deviation is amplified into a 25% change in the margin ratio at 50× leverage, so the stability of the mark price becomes a key safeguard against systemic misjudgment.
Above all, the mark price is the sole arbiter that triggers liquidation. Whether a position is liquidated is judged by one criterion alone: whether the mark price reaches the liquidation price. However violently the last traded price swings, the liquidation procedure will not start as long as the mark price stays above the safety line. This fair price marking principle, pioneered by BitMEX [10], decouples the liquidation trigger from the instantaneous execution price of any single exchange, effectively isolating derivatives positions from the destructive impact of local liquidity crises; it has now become the industry-standard risk-control paradigm. The fair price marking paradigm pioneered by BitMEX has been extended further within the unified-margin systems of contemporary mainstream exchanges: the mark price not only determines liquidation triggering and unrealized P&L but also affects the cross-asset offsetting calculation of portfolio margin, the ordering of auto-deleveraging, and the adjustment of dynamic risk limits. BitMEX's documentation explicitly delimits the scope of fair price marking: it affects only the computation of the liquidation price and unrealized P&L, whereas realized profit and loss (realized P&L) is still based on the actual execution price [10]. The institutional authority of the mark price within the liquidation mechanism is the institutional empowerment at the heart of its role as a governance price. It is not merely a technical parameter but a key node of power allocation within the entire risk-control system, ultimately determining whose positions will be liquidated and whose assets will be protected.
14.4.2 The mark price trilemma
The design of the mark price faces a fundamental trilemma: accuracy, robustness, and timeliness cannot all be optimized at once. Let t be the true fair price at time (measured as the volume-weighted median across multiple exchanges), the mark price function, {\text{attack}} the mark-price shift induced by a single-exchange price manipulation , and the latency (in seconds) with which the mark price reflects new information. Accuracy requires minimizing t|], robustness requires minimizing {\epsilon} |\Delta M_{\text{attack}}(\epsilon)|, and timeliness requires minimizing . In an information-theoretic sense, these three objectives form a trade-off on the Pareto frontier: any mark price function can optimize only two of them at once, and the third is inevitably sacrificed.
Figure 14-5 shows the different design orientations of major trading platforms within the mark price trilemma.
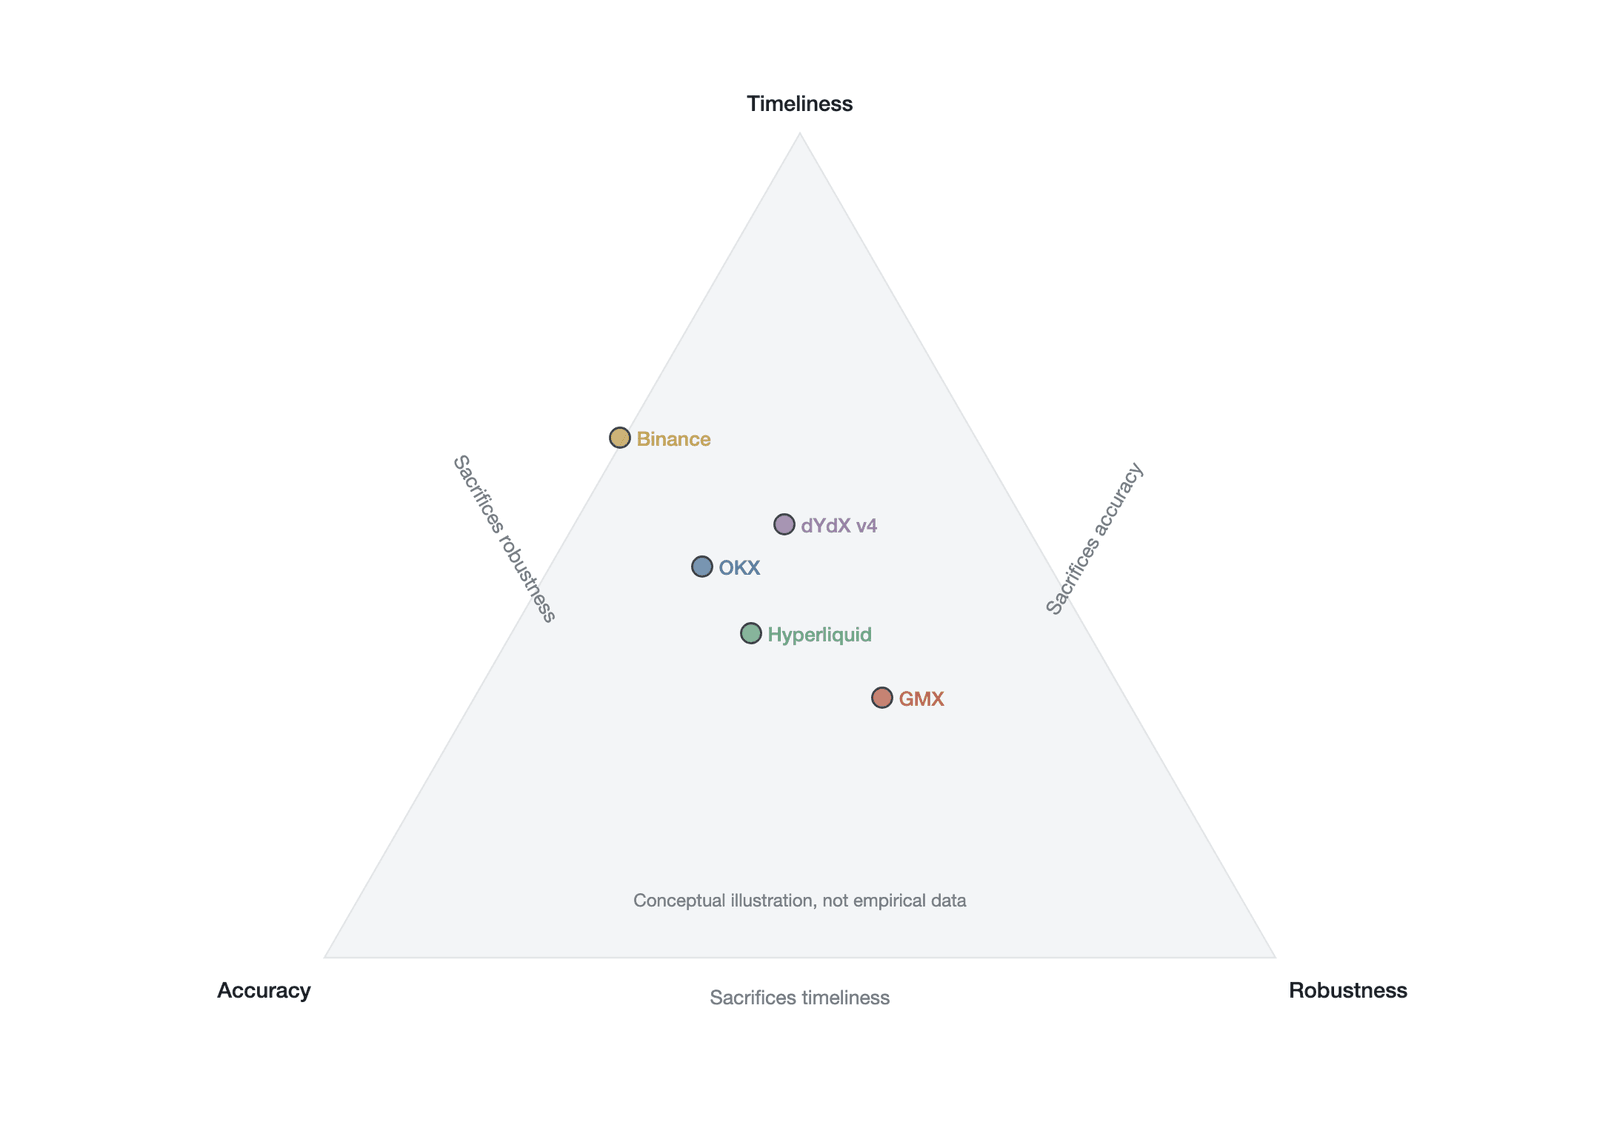
Figure 14-5. The mark price trilemma and each platform's design choice
There are deep, inherent conflicts among these three objectives. If a system pursues the extremes of accuracy and timeliness, it can only use the last traded price directly, but this leaves it almost defenseless against price manipulation, severely sacrificing robustness. If a system chooses the combination of accuracy and robustness, it typically must introduce multi-source weighting and a long-window EMA algorithm, which inevitably causes the mark price to lag badly in a rapid one-sided move, thereby sacrificing timeliness. If a system tries to balance robustness and timeliness, it often adopts a short-window median algorithm, but when liquidity is unevenly distributed across platforms, the median may systematically deviate from the true fair value, thereby impairing accuracy.
Each major platform's mark price formula is essentially its specific choice within the trilemma, reflecting a different governance preference. Binance takes the median of three values—the price index, an adjusted price containing a one-minute basis moving average, and the last traded price [24]—leaning toward a balance of accuracy and timeliness. In May 2025, Binance shortened the basis moving-average window from 2.5 minutes to 1 minute, and in September 2025 shortened it further to 30 seconds [24]; this series of adjustments clearly embodies a governance intent tilted toward timeliness. This median-of-three design is naturally resistant to a single-point anomaly, but under extreme conditions, when all three inputs are shocked simultaneously, it still risks being skewed by a local price. OKX's design instead anchors directly to the index price and adds a moving average of the basis [25], leaning toward accuracy and robustness; its smoothing term reflects only the contract premium and is structurally clear, but the moving average introduces substantial latency in a rapid move. Hyperliquid adopts a more complex three-component median mechanism [7]. Its mark price takes the median of the following three independent components: the first is the oracle price plus a 150-second EMA of the difference between Hyperliquid's weighted mid price and the oracle price; the second is the weighted mid price of Hyperliquid's own order book; and the third is the median of the perpetual futures prices across multiple centralized exchanges. In this architecture, the object smoothed by the 150-second EMA is the basis (the difference between Hyperliquid's mid price and the oracle price) rather than the price itself, which means that when the oracle price moves in tandem, the mark price follows the oracle price instantaneously, with the lag manifesting only in the adjustment of the basis. Its EMA decay formula uses a time constant of about 2.5 minutes (150 seconds) (decay follows exp(−t/150 s)) and updates roughly every 3 seconds as validators publish the oracle price [7]. Hyperliquid's oracle is operated by its own validator set rather than an independent external oracle network; the security implications of validators simultaneously bearing the dual roles of consensus and price feeding are discussed further in Section 14.5.4. This design leans heavily toward robustness, but because it relies on multiple external sources and a long smoothing window, it exhibits significant reaction latency under extreme conditions. dYdX's fourth version, by contrast, embeds price aggregation and a consensus mechanism within its validator nodes [26], leaning toward robustness and timeliness; it eliminates dependence on an external oracle but introduces the potential governance risk of validator centralization.
14.4.3 The latency effect of EMA smoothing
To seek a balance within the trilemma, most exchanges introduce an EMA algorithm to smooth the mark price. Its recursive formula is , where , is the time constant (the e-folding time, with half-life ), and is the update interval. In a step-down scenario, if the last traded price undergoes a sudden change of magnitude at time , the mark price's response at time is . This formula shows that at the mark price reflects only about 63% of the price change, and at only about 18%. Taking Hyperliquid's seconds as an example, if the last traded price falls 10% within 30 seconds, the mark price falls only about 1.8% over the same period (30 seconds is , so 1.8% here equals 18% × 10%, the same point expressed two ways as the earlier "about 18% at "). The 1.8% here rests on a simplified model that applies smoothing to the price itself; in Hyperliquid's actual architecture the smoothing acts on the basis rather than the price, and the mark price's actual response also depends on the oracle update frequency (about once every 3 seconds)—the lag is smaller when the oracle closely tracks the last traded price, and the two layers of lag compound when the oracle itself is delayed. The choice of the decay coefficient and the time constant constitutes the most concrete parametric governance decision: the larger is, the more slowly the mark price changes and the stronger its immunity to flash crashes and short-term manipulation, but the more severe the latency effect it produces in a rapidly one-directional market.
Figure 14-6 simulates the direct impact of different smoothing-window lengths on the distribution of liquidation events in a rapidly falling market.
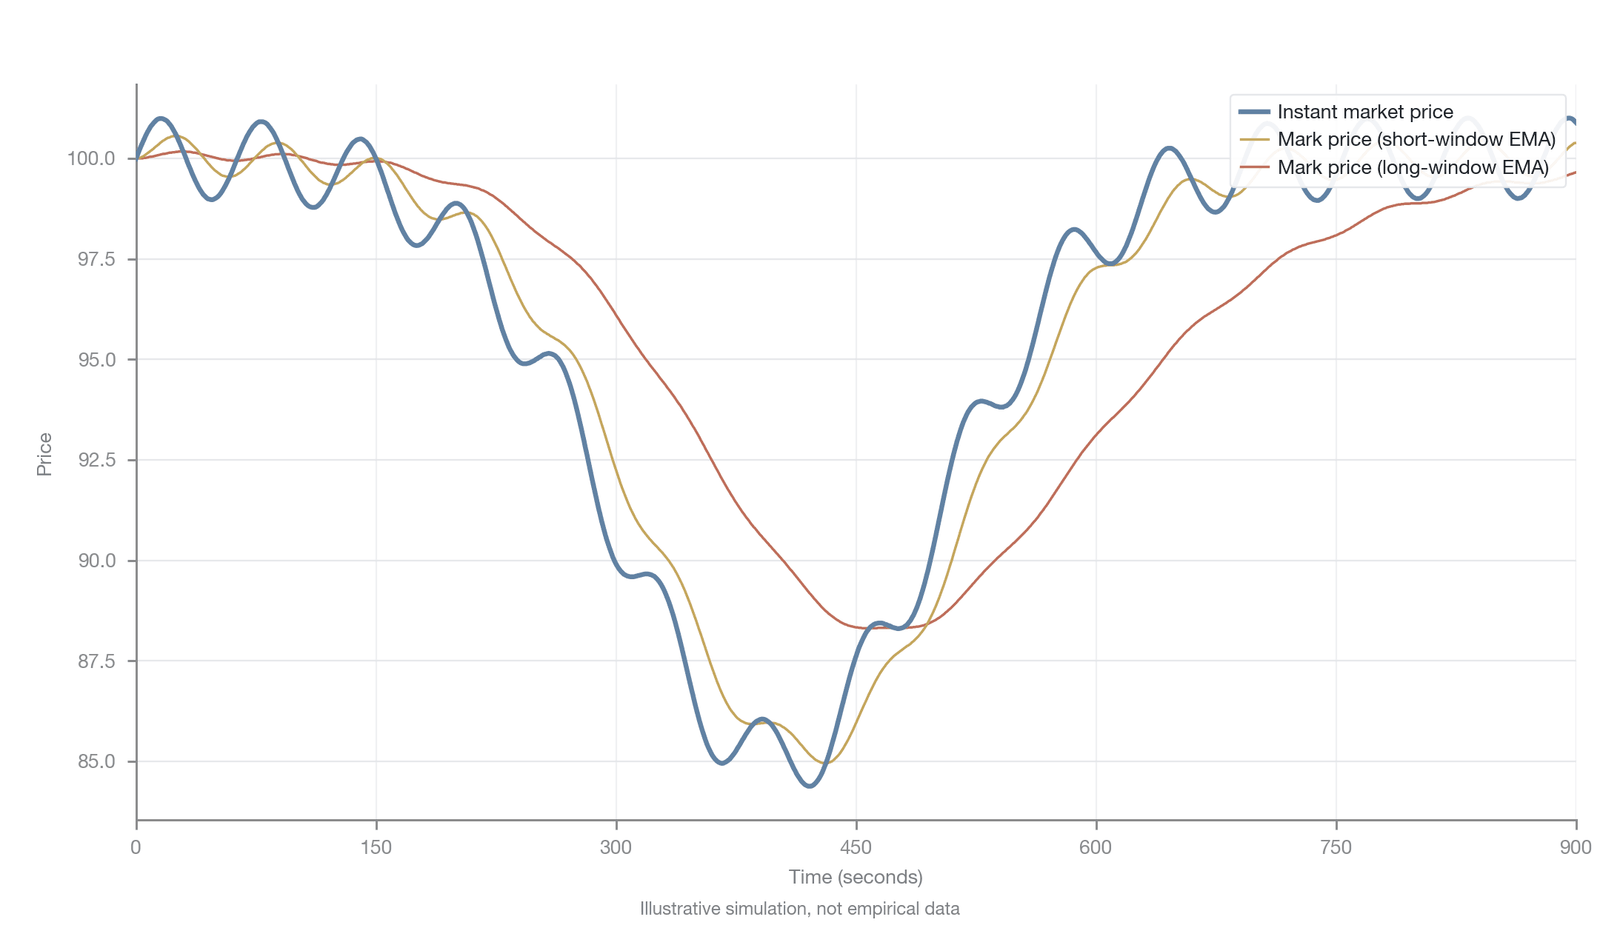
Figure 14-6. The effect of smoothing-window length on the temporal distribution of liquidation events
When the market price falls rapidly, the mark price is often significantly higher than the last traded price, making a trader's margin ratio appear safer on paper than it actually is. Liquidation is therefore triggered with a delay, and when the mark price finally catches up to the last traded price, the liquidations that should have occurred dispersed across different price levels are artificially compressed into a concentrated burst at a single point in time, sharply increasing the intensity of the liquidation cascade. As the worked example above shows, this lag of the mark price means that a large number of liquidations that should have been triggered at different price levels are temporarily backlogged, awaiting the mark price's slow catch-up.
In a reversal, this smoothing mechanism also produces a cumulative-release effect: when a rapid fall is quickly followed by a rebound, the lagging mark price may trigger delayed liquidations that should not have occurred—this mark price trap is developed in detail in Section 14.4.4. Conversely, if a system adopts a short-window EMA, the mark price can closely track the last traded price and timeliness improves substantially, but it becomes extremely sensitive to brief price manipulation and flash crashes. A manipulator need only push the last traded price for a very short time, and the mark price will quickly follow and trigger liquidations, which significantly lowers the cost of attack and widens the system's attack surface. Binance's decision in 2025 to shorten the basis moving-average window successively from 2.5 minutes to 1 minute and then to 30 seconds [24] is exactly such a recalibration between the latency effect and manipulation sensitivity.
14.4.4 The mark price trap
The EMA smoothing mechanism creates a phenomenon in reversals known as the mark price trap. In a market environment of a violent fall accompanied by a rapid rebound, the lag of the smoothing algorithm causes the mark price to keep running downward even after the true market price has recovered significantly. This algorithmic inertia produces a retroactive effect in which the price has recovered but the position is still liquidated.
Figure 14-7 dissects the mechanism of this trap by comparing the trajectory of the mark price under long-window and short-window EMA parameters. The red shaded region marks the time window in which the mark price is below the liquidation line while the last traded price has already recovered above it—that is, the interval in which retroactive liquidation occurs.
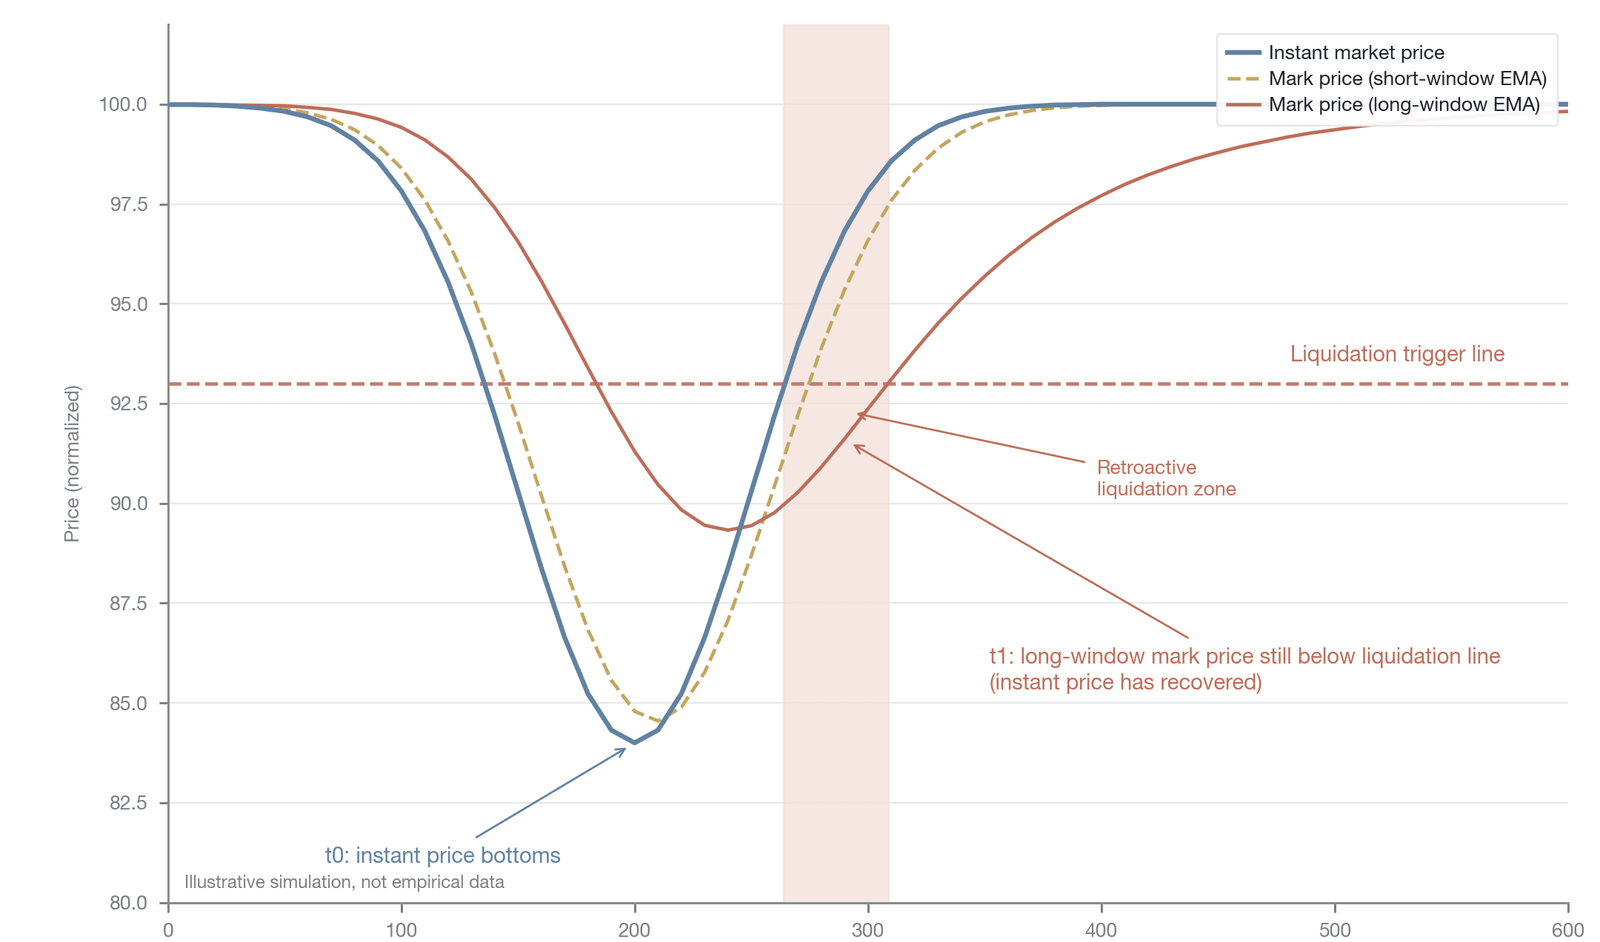
Figure 14-7. The mark price trap and retroactive liquidation in a V-shaped reversal
During the phase of a sharp fall, the true price bottoms out rapidly and the mark price begins to follow it down, but exhibits a clear lag because of the smoothing algorithm. Subsequently, the true price rebounds, but by this time the mark price is still digesting the earlier steep drop and continues to probe downward. When the mark price finally touches the trader's liquidation line, the user's position is forcibly liquidated. Only afterward does the mark price begin to recover slowly, but the liquidation is already irreversible and the trader's substantive loss has been incurred. The red shaded region in Figure 14-7 marks precisely this trap interval: the last traded market price is already significantly above the liquidation line, yet the mark price computed by the long-window EMA still hovers below it, causing retroactive liquidation to be executed at a stage when the market appears to have already recovered.
The inertia of the EMA is meant to serve as a buffer that protects traders in a one-directional plunge, but in a reversal it becomes a mechanism of harm. Observing that the last traded price has already recovered, traders often mistakenly believe their positions are already safe, overlooking the hidden risk that the mark price is still approaching the liquidation line. In the end, traders are retroactively liquidated at the very moment the crisis appears to have passed. This phenomenon reveals a profound governance implication: choosing the length of the smoothing window is essentially choosing which class of market conditions' users to protect—an implicit risk-allocation decision. Even a trader who judges the market direction perfectly correctly and successfully buys the bottom may still be liquidated for lack of a full understanding of the mark price's algorithmic behavior. Beyond retroactive liquidation in a V-shaped reversal, the mark price can also produce a symmetric mark price illusion in a slow trending market: EMA smoothing keeps the mark price persistently below the last traded price during a slow rise, giving traders the illusion that their margin is more ample than it really is. When the trend suddenly reverses, the mark price's catch-up effect leads to a larger-than-expected concentration of liquidations. In this specific scenario, the trilemma resolves into a dilemma between protecting the majority from manipulation and protecting the minority from delayed liquidation. Although a short-window EMA can effectively avoid the mark price trap, its high sensitivity to the last traded price—as shown by the orange curve in Figure 14-7—means that it produces more false liquidation triggers amid everyday volatility.
The mark price trap not only causes immediate liquidation losses but also produces lasting microstructure effects through behavioral feedback. Rational traders who repeatedly experience retroactive liquidation will systematically reduce their leverage use or set stop-losses at distances farther than necessary, even when such conservative parameter settings are not optimal from a fundamental standpoint. This experience effect reduces the overall market's leverage supply and liquidity depth, and its long-term welfare loss exceeds that of any single liquidation event.
14.4.5 Liquidation hunting and institutional isolation
In the early derivatives markets that lacked mark price protection, liquidation hunting was a high-frequency and highly impactful attack method. When a liquidation system relied directly on the last traded price, an attacker would first scout for a target market with shallow order-book depth, a concentration of high-leverage positions, and thin liquidity. Having selected the target, the attacker would suddenly deploy a massive market sell order during the period of lowest liquidity, directly consuming all of the bid-side resting orders and causing the last traded price to plunge in a cliff-like drop, forming the classic wick pattern on the candlestick chart. This instantaneous price collapse would immediately trigger the risk-control system tied to the last traded price, forcibly liquidating a large number of high-leverage long positions. The market sell orders generated by the liquidation engine would push the price down further, forming a destructive liquidation cascade. In the end, the attacker would profit through a short position established in advance, or buy in at the extremely low prices of the panic sell-off.
The introduction of the mark price mechanism fundamentally changed this attack-defense dynamic through institutional isolation. Along the spatial dimension, the multi-source aggregation of the index price makes the price shock an attacker creates in a single derivatives market negligible for the global index; to affect the index price significantly, an attacker would have to manipulate all constituent spot markets simultaneously, so the cost of attack grows exponentially. Along the temporal dimension, the mark price's moving-average algorithm provides a further buffer: even if the derivatives market's last traded price momentarily deviates sharply from the index price and the basis widens abruptly, the smoothing dilutes the impact of this transient anomalous basis on the final mark price enormously, so the mark price may move only minutely—far too little to touch most traders' liquidation lines.
The Bitstamp flash crash of May 2019 is a classic cautionary tale of insufficient institutional isolation. At the time, a massive sell order of approximately 5,000 BTC instantly drove the platform's spot price from about $7,900 down to about $6,180, a drop of approximately 20% [27]. Because BitMEX's price index was then composed of only two exchanges, Bitstamp and Coinbase, equally weighted, this local price manipulation directly dragged down the global index and triggered more than $200 million in long liquidations. Brave New Coin's multi-exchange index only briefly dipped below $6,660 in the same period, whereas BitMEX's index momentarily touched $6,382 [27]; the gap of nearly $300 between the two fully illustrates the decisive influence of the number of index constituents on robustness. This event directly spurred industry-wide index reform, with mainstream platforms expanding the number of index-constituent exchanges and introducing outlier-filtering mechanisms.
As platforms today introduce broader index constituents and more complete smoothing mechanisms, transient price manipulation targeting a single derivatives order book usually ends in failure. The mark price stays stable, avoiding the unfair liquidation of innocent positions, while the attacker may instead suffer enormous slippage losses from dumping at low prices in an illiquid market. The mark price mechanism is not a simple technical optimization but a fundamental institutional design: it shifts the authority to adjudicate risk control from noisy local order-book signals to a highly robust global price signal, significantly raising the barrier to market manipulation.
14.4.6 Platform comparison
The methods by which different derivatives exchanges compute the mark price embody markedly different design philosophies, yet their core idea remains highly consistent: to take an externally, spatially aggregated spot price as the absolute anchor and to absorb short-term irrational swings through a temporal smoothing mechanism. Table 14-2 compares the mark price mechanisms of mainstream trading platforms.
| Platform | Core algorithmic architecture | Smoothing parameter (window / time constant) | Number of price sources | Update frequency | Governance preference |
|---|---|---|---|---|---|
| Binance | Median of the index price, adjusted price, and last traded price | 30-second window (since Sept 2025) | 10+ | ~1 second | Balance of accuracy and timeliness |
| OKX | Index price plus a basis moving average | Variable | 7+ | ~1 second | Accuracy and robustness |
| Hyperliquid | Median blend of oracle, local order book, and multi-CEX prices | 150 seconds | 3 input components (10+ underlying sources) | ~3 seconds† | Robustness first |
| dYdX v4 | Validator-node consensus aggregation | No explicit EMA (median aggregation + ~1–2 s consensus latency) | Validator aggregation | ~1 second† | Decentralization and robustness |
| GMX | Chainlink and Chaos Labs decentralized oracles | Heartbeat-triggered | Multiple nodes | 0.5% deviation or 27-second heartbeat | Robustness and accuracy |
Table 14-2. Comparison of mark price mechanisms across mainstream trading platforms (Data source: compiled by the author from platforms' public documentation)
Note: † The figures shown are nominal price-publication frequencies, which may not be synchronized with the liquidation engine's check frequency; the actual frequency may decrease under extreme conditions. The Binance formula described applies to the normal-market state of USDT-margined perpetual futures; under extreme market conditions it may switch to a degraded logic.
Table 14-2 has already listed each platform's choice within the mark price trilemma; here we add only two differences not developed in Section 14.4.2. First, Binance's median-of-three formula contains an implicit form of outlier filtering: when any one input deviates abnormally, the median mechanism automatically excludes it from the final result, giving natural resistance to a single-source anomaly [24].
Second, Hyperliquid's most complex three-component median mechanism [7] exposed, in the JELLY attack of March 2025 (see Section 14.7.5), the fragility of such complex mechanisms when liquidity is extremely depleted: the attacker neither tampered with the smart contract nor exploited a code vulnerability but—relying solely on a thorough understanding of the mark price computation logic—contaminated the oracle through compliant spot manipulation, skewed the mark price via a loophole in the median aggregation, and forced the platform into an emergency delisting of the token [28].
The liquidation impact of the mark price also depends on the margin architecture. Under isolated-margin mode, a change in the mark price affects only the margin ratio of a single position; under the cross-margin or unified-margin mode now widely adopted by mainstream platforms, a small swing in the mark price affects the total margin adequacy of the entire account and the cross-asset offsetting calculation, so liquidation sensitivity rises significantly.
14.4.7 The intensity of liquidation cascades
The choice of mark price parameters determines not only the fate of individual traders but also, directly, the intensity of systemic liquidation cascades. As described in Section 14.4.3, a longer-window smoothing parameter takes the liquidations that should have fired at dispersed price levels as the market fell and compresses them into a single concentrated burst: when the mark price finally breaks through a key threshold, a large number of positions are liquidated at once within an extremely short time, the single-round liquidation volume increases sharply, and the market's self-reinforcing divergence condition is readily met.
In the crypto-market liquidation cascade that erupted on October 10, 2025, more than $19 billion in leveraged positions were forcibly liquidated within about 24 hours, of which long liquidations accounted for approximately 87%, affecting about 1.6 million traders [1]. Bitcoin's price plunged from about $122,000 to about $104,000, and Ethereum fell about 12% over the same period [1]. This event reveals how a smoothing mechanism originally intended as a buffer can, through delay and concentrated release, instead become a catalyst that intensifies a systemic collapse in an extreme one-sided move. Ali's (2025) [1] study notes that the trigger of this liquidation cascade was an escalation of tariffs between the United States and China, but that its intensity was largely amplified by the microstructure of the derivatives market: the latency effect of the mark price caused liquidation events to become highly concentrated along the time dimension, forming a self-reinforcing downward spiral. Figure 14-8, based on the flash-crash data of October 2025, shows the dynamic divergence between the last traded price and the mark price within a 5-minute window: the last traded price fell rapidly while the mark price lagged significantly because of the EMA buffer, and the positions within the price gap formed between them were temporarily protected by the smoothing mechanism—but they also constituted the backlog that would later be concentrated into liquidations as the mark price caught up.
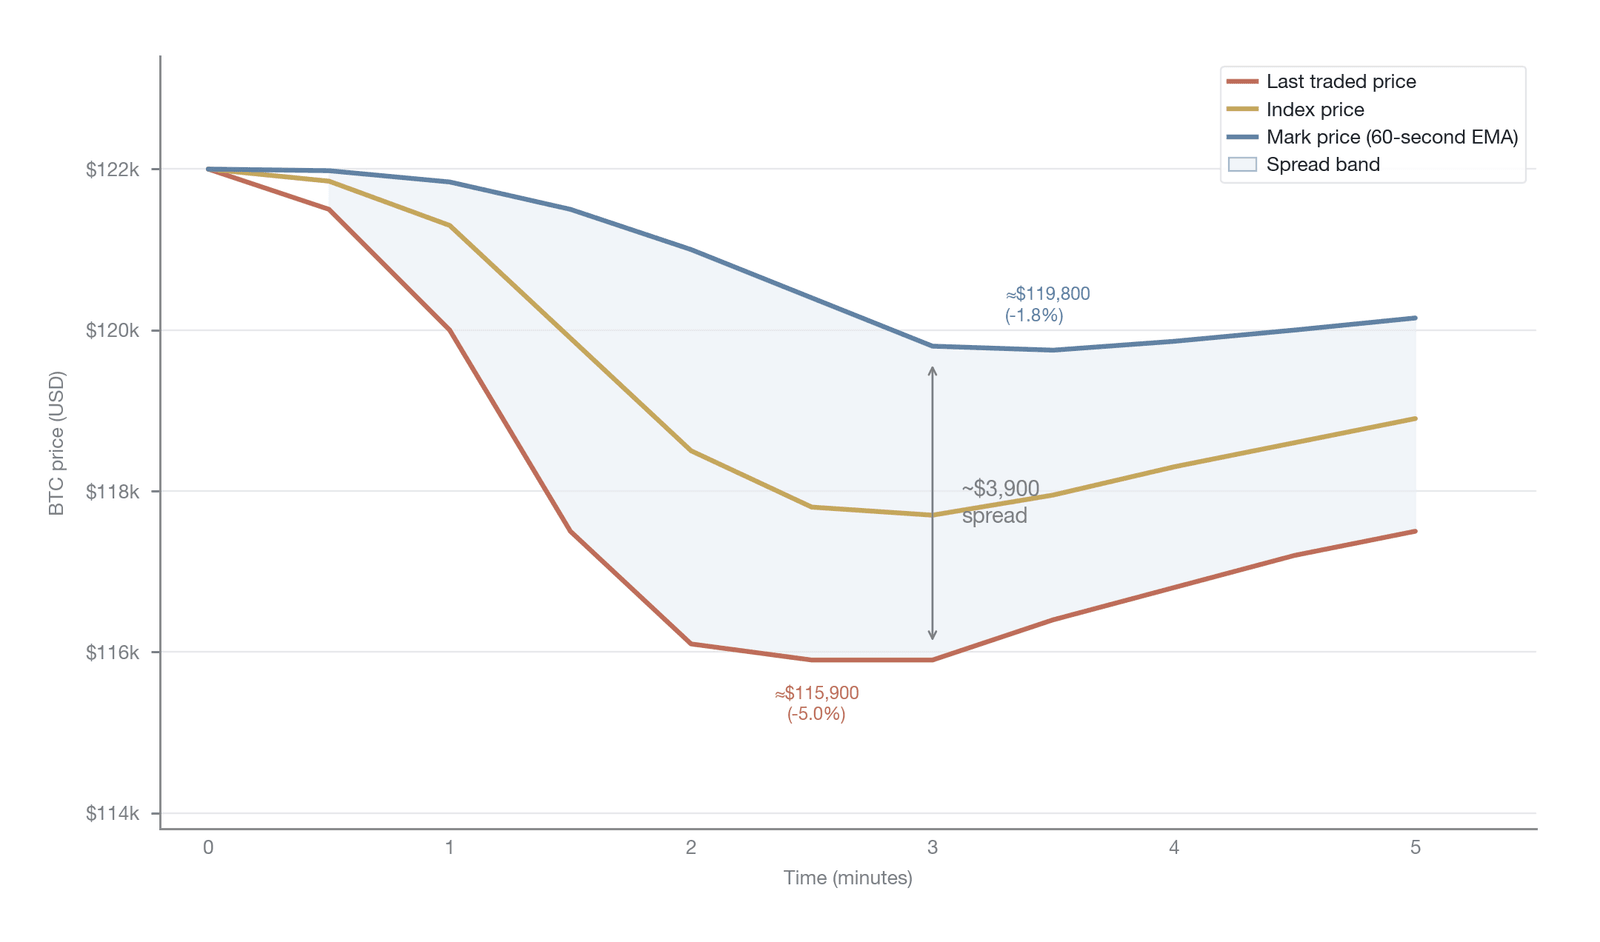
Figure 14-8. The dynamic divergence between mark price and last traded price in a flash-crash scenario
Conversely, if an exchange leans toward timeliness and chooses a shorter smoothing window, the mark price will track market swings extremely sensitively. Under such a mechanism, liquidation events are triggered in a more dispersed manner, each round of forced closure releases relatively little selling pressure to the market, and the divergence condition for systemic risk is harder to meet. Yet such a sensitive mark price, amid everyday choppy conditions, is highly prone to triggering a large number of unnecessary liquidations because of a brief price wick, harming the interests of individual traders. This is a profound and counterintuitive governance trade-off: a more robust design lowers the probability of an individual being improperly liquidated but raises the risk of systemic collapse, whereas a more sensitive design protects the stability of the system but at the cost of sacrificing individuals' safety amid everyday volatility. Protecting individuals and protecting the system here point to entirely opposite design choices, which constitutes the core normative challenge in mark price mechanism design. This trade-off cannot be dissolved by purely technical means, because it is essentially a normative question about risk allocation: in an inevitable extreme event, whose interests should the system prioritize?
This analytical framework must also incorporate the divergence between the mark price and the liquidation execution price. The mark price determines the timing of the liquidation trigger, but the actual closing is executed as market orders against an order book that may already have severely contracted. In the October 2025 event, in an environment where order-book depth contracted by more than 90%, the execution slippage of large liquidated positions may have far exceeded the construction error of the mark price itself. Therefore, measuring the true impact of mark price mechanism design on trader welfare should examine not only the deviation of the mark price from fair value but also the execution gap between the moment the mark price triggers and the actual liquidation execution price.
14.5 Oracle architecture and the information bottleneck
Smart contracts are deterministic in their execution logic, but their runtime environment is essentially a closed system, unable to perceive the state of the external world on its own. For an on-chain financial protocol to provide financial services priced on real-world assets, it must rely on a mechanism that transmits off-chain data to the chain safely and reliably. This information-transmission mechanism is the oracle. In the context of DeFi, an oracle is not merely a simple data-transmission channel but the core node that determines the security of the entire system. If the data an oracle provides are biased or maliciously manipulated, then however well the on-chain protocol's liquidation engine and risk-control models are designed, the result will inevitably be erroneous liquidations, asset loss, or systemic collapse. The oracle is therefore regarded as the security bottleneck of the on-chain financial ecosystem.
As the total value locked (TVL) in DeFi continues to climb, the importance of oracles within the entire ecosystem grows ever more prominent. As of the first quarter of 2026, leading oracle networks secured more than $100 billion in on-chain assets, and the price data they provided triggered trillions of dollars in transactions and liquidation instructions [29]. Yet this large asset scale also makes oracles the primary target for attackers. Although oracle manipulation is not the largest source of DeFi losses in 2025 (by Immunefi's accounting, pure manipulation attacks fell from nearly 19% of DeFi losses in 2022 to about 1% in 2025, and the dominant loss types that year were private-key compromise and phishing), the destructive power of a single incident and its high degree of targeting at low-liquidity long-tail assets make it one of the core threats that protocol designers must confront [30]. This asymmetric attack-defense posture forces protocol designers into difficult trade-offs in their choice of oracle architecture.
14.5.1 The oracle trilemma
Oracle design is not merely a matter of engineering implementation but is constrained by a fundamental trilemma. Theoretical research shows that in constructing a decentralized oracle network, designers must trade off among three dimensions—accuracy, manipulation resistance, and timeliness—and cannot reach a theoretically optimal state on all three at once [31]. This trilemma fundamentally determines the evolutionary direction of different oracle architectures and their suitability for specific financial scenarios.
Accuracy requires that the on-chain price an oracle provides reflect, to the greatest extent possible, the true trading state of the off-chain spot market. To improve accuracy, an oracle typically needs to obtain prices from multiple independent data sources and use complex aggregation algorithms to remove outliers. Manipulation resistance concerns the oracle's robustness in the face of capital attacks—that is, how large an economic cost an attacker must pay to make the oracle output a price that deviates from the true market level. Improving manipulation resistance often requires introducing more data providers, longer observation windows, or stricter staking-and-slashing mechanisms. Timeliness measures the time delay for an off-chain price change to be reflected on-chain. In a rapidly volatile market, timeliness directly bears on whether the liquidation mechanism can trigger in time and whether arbitrageurs can effectively close cross-market spreads.
There are inherent conflicts among these three dimensions. The multi-source aggregation and time-weighted averaging mechanisms introduced to improve manipulation resistance inevitably increase the latency of data processing, thereby sacrificing timeliness. Conversely, using a single data source or an instantaneous price in pursuit of the utmost timeliness sharply lowers the cost for an attacker to manipulate the price, impairing the system's manipulation resistance. In existing DeFi practice, no oracle scheme can perfectly resolve this dilemma; all architectural innovations are essentially a rebalancing of these three dimensions under specific business requirements.
14.5.2 Push-based architecture
The push-based architecture is the oracle model most widely adopted in the early days of DeFi; its core logic is that a network of oracle nodes actively pushes price-data updates onto on-chain smart contracts. Under this architecture, nodes continuously monitor the price movements of a target asset off-chain, and when the price fluctuation exceeds a preset deviation threshold, or when the time since the last update exceeds the limit of the heartbeat interval, the node network initiates a consensus process. After reaching agreement through an off-chain reporting protocol, the nodes package the aggregated price data into a transaction and send it to the blockchain network for all protocols relying on that oracle to read [32].
The greatest advantage of this design lies in its extremely high manipulation resistance and broad compatibility. Because the data have been signed and aggregated by multiple nodes off-chain, the failure of a single data source or the malfeasance of a single node can hardly have a substantive effect on the final on-chain price. At the same time, because the price data are stored directly in on-chain state, any smart contract can read these data with zero latency, greatly simplifying the development process of decentralized applications.
The limitations of the push-based architecture, however, are equally significant. To maintain high-frequency price updates, the oracle network must continuously consume large amounts of network fees. When the blockchain network is congested, oracle update transactions may sit waiting for a long time because of insufficient fees, causing the on-chain price to lag badly behind the real market. Moreover, constrained by on-chain computation and storage costs, push-based oracles can typically support only a limited number of asset instruments and cannot provide millisecond-level price updates. This compromise in timeliness and scalability makes the push-based architecture ill-suited to the needs of price-sensitive applications such as derivatives trading.
14.5.3 Pull-based architecture
To break through the bottlenecks of the push-based architecture in update frequency and cost, the pull-based oracle architecture emerged. In this model, oracle nodes no longer actively push prices on-chain but continuously generate cryptographically signed price reports off-chain. When a decentralized application's user needs to execute a price-dependent transaction, the user or the front-end interface fetches the latest price report from the oracle's off-chain data-availability layer and packages it together with the business transaction for submission to the blockchain. Before executing the business logic, the smart contract first verifies the report's signature and timestamp, and only after confirming their validity does it use that price in its computation [33].
Figure 14-9 shows the core differences in data-flow paths among the three oracle architectures: push-based, pull-based, and app-chain native.
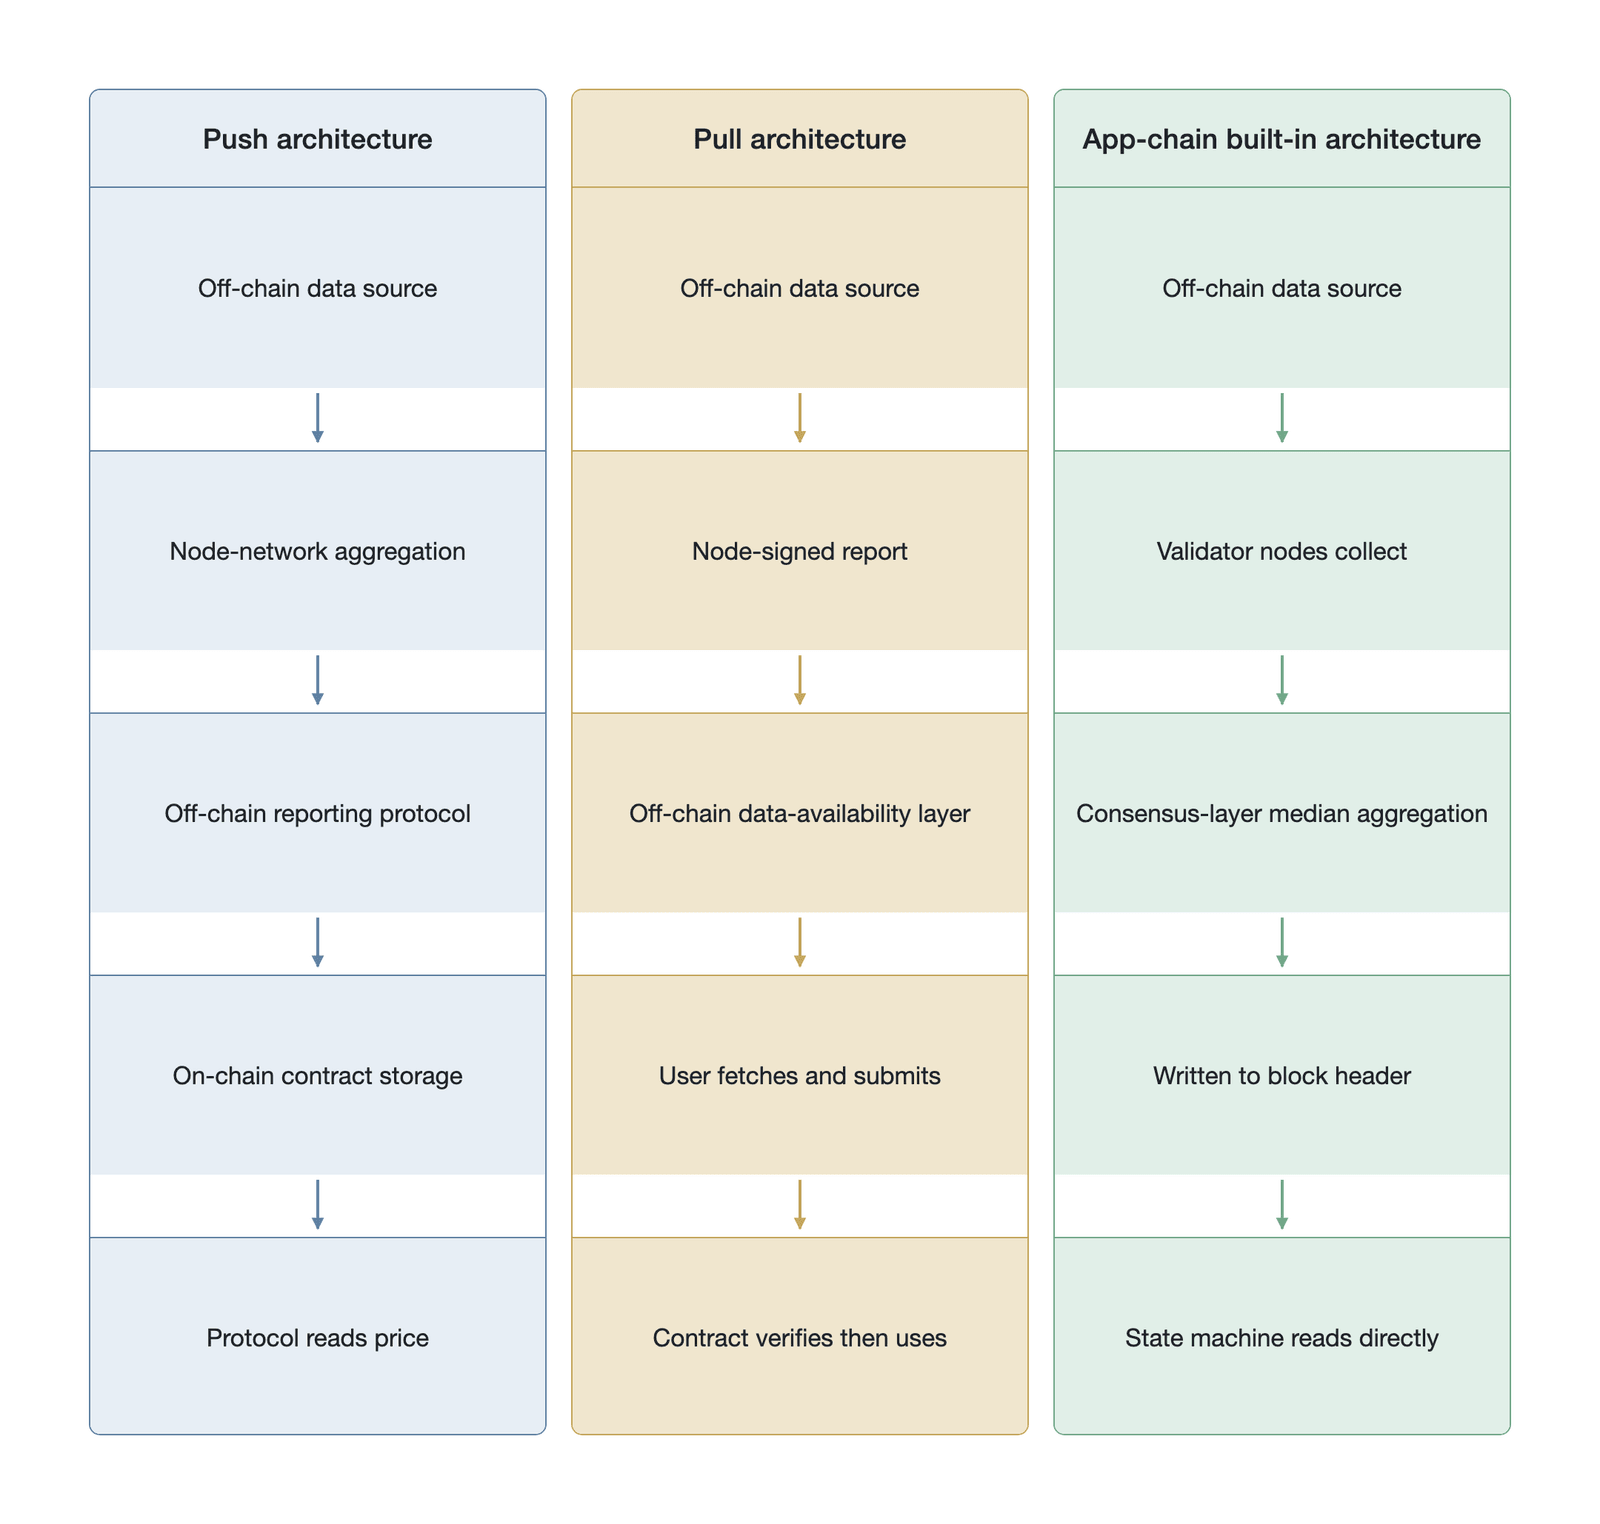
Figure 14-9. Comparison of the data-flow paths of the three mainstream oracle architectures
The pull-based architecture fundamentally changes the economic model of the oracle. The cost of a price update is no longer borne by the oracle network but transferred to the user who actually uses that price, achieving a precise match between cost and benefit. This design entirely removes the constraint that network congestion places on price-update frequency, enabling the oracle to provide high-frequency price data for hundreds or thousands of assets at extremely low latency. For a perpetual futures DEX that needs millisecond-level response, the pull-based architecture provides the necessary infrastructural support.
Despite its major breakthroughs in timeliness and scalability, the pull-based architecture also introduces a new risk dimension. Because the trigger for a price update rests in the user's hands, a malicious trader may exploit this mechanism for selective updating. In a liquidation scenario, for example, if the latest price is unfavorable to the borrower, the borrower may deliberately avoid triggering a price update in an attempt to delay the liquidation process. Although a protocol can mitigate this problem by introducing independent liquidation bots, this increases the overall complexity of the system. In addition, the pull-based architecture requires the smart contract to verify multiple signatures in real time within every transaction, which may become a new performance bottleneck on some blockchains with limited computational resources.
14.5.4 App-chain native oracles
As application-specific blockchains have proliferated, a new architecture that embeds the oracle mechanism directly into the blockchain consensus layer has gained adoption. In this deeply coupled model, the oracle is no longer an external service independent of the blockchain but becomes a native responsibility of validator nodes. While participating in block packaging, validators must submit the external asset prices they observe. The consensus mechanism votes not only on transaction ordering but also on the median aggregation of these price data, and the resulting price is written directly into the block header for the on-chain state machine to use [34].
The native-oracle architecture pushes timeliness to the extreme. Because price updates proceed in step with block generation, the latency of the on-chain price is limited only by the block time and can typically reach the sub-second level. More importantly, this architecture entirely eliminates the transaction fees required for oracle updates, because the price data are no longer transmitted through ordinary smart-contract transactions but take effect directly as a byproduct of the consensus process. This zero-cost, high-frequency price-acquisition capability enables an app-chain to support extremely high-leverage derivatives trading while sharply reducing the systemic risk posed by liquidation latency.
Yet this design, which deeply binds financial logic to the underlying consensus, also raises profound questions about the system's security boundary. A native oracle requires validators to take on extra data-acquisition and processing work, increasing the complexity of node operation. If some validators cannot provide accurate prices because of data-source failures or network latency, it may affect the consensus process of the entire blockchain, causing block production to stall. Moreover, this architecture forgoes the generality of the oracle; the price data it provides can be used only within the specific app-chain and cannot serve the broader multi-chain ecosystem. This concession in generality is the price that must be paid in pursuit of ultimate performance.
The app-chain native-oracle architecture raises a deeper question about the incentive compatibility of validators. When validators bear the dual responsibilities of block production and price submission, a validator holding derivatives positions faces an economic inducement to trigger favorable liquidations by submitting a shifted quote. Furthermore, in systems such as dYdX v4 and Hyperliquid, validators can also extract returns similar to maximal extractable value (MEV) by selectively delaying or advancing the submission of price updates. The severity of this incentive conflict depends on the size of the validator set and the strength of the penalty mechanism. dYdX v4's validator cap was lowered from 60 to 50 in mid-2025, with roughly 30-odd actually active, and Hyperliquid's validator set is even more limited in size; both differ by orders of magnitude in decentralization from the hundreds to thousands of validators on general-purpose chains, and a smaller validator set significantly lowers the threshold for multiple nodes to collude in manipulating price quotes.
Beyond the three architectures above, all of which depend on external data sources, the TWAP oracle based on an on-chain automated market maker (AMM) constitutes an entirely different paradigm. This mechanism relies on no off-chain data feed; instead, it computes the price directly from the liquidity pool of an on-chain DEX. In Uniswap V3, for example, a built-in price accumulator records the logarithm of the instantaneous price at every trade, and an external protocol can compute the geometric mean price over an arbitrary window length by reading the difference in the accumulator between two points in time. Architecturally, this design eliminates the oracle's trust-boundary problem, because the price data are generated entirely by on-chain trading activity, with no need for a validator network or signature verification. However, the manipulation cost of an on-chain TWAP oracle is proportional to both the depth of the liquidity pool and the length of the time window: an attacker must sustain a disequilibrium trading price throughout the entire TWAP window, which means that the manipulation cost grows linearly with window length—but at the price of a latency that scales proportionally with that same window length. In the approximately $34 million attack on Harvest Finance in October 2020, the attacker used a flash loan to sharply distort the price in Curve's USDC/USDT liquidity pool and exploited the vulnerability of the excessively short window of the on-chain TWAP oracle that Harvest relied on, completing the price manipulation and the malicious deposits and withdrawals within a few transactions [35]. This incident demonstrates that the security of an on-chain TWAP oracle depends heavily on the depth of the underlying liquidity pool, not merely on the length of the time window. Building on the order-book and AMM microstructure discussed in Chapter 7, the on-chain TWAP oracle can be viewed as an institutional arrangement that translates market makers' quoting behavior directly into a price benchmark; its governance implication is that it shifts the benchmark's credibility from the honesty of validators to the capital commitment of liquidity providers.
14.5.5 The cross-layer information bottleneck
Whatever architecture is adopted, the process by which an oracle transmits off-chain prices on-chain inevitably entails a lossy compression of information. This phenomenon is called the oracle cross-layer information bottleneck, and it is the core theoretical foundation for understanding the fragility of on-chain finance. In traditional centralized financial markets, price is a continuous, high-precision, multi-dimensional information flow rich in order-book depth. Yet when this information enters the blockchain through an oracle, it is forced to undergo an irreversible compression along three dimensions: time, precision, and source.
Along the time dimension, because of the blockchain's discrete block-production mechanism and the trigger conditions limiting oracle updates, the continuous price flow is truncated into discrete data points. Within the time window between two oracle updates, the on-chain protocol is in a blind spot with respect to external market changes. Along the precision dimension, to lower on-chain computation costs and reach consensus among nodes, the complex order-book structure and minute price fluctuations are typically simplified into a single aggregate scalar value, masking the true depth of market liquidity. Along the source dimension, the price data of hundreds or thousands of centralized exchanges and decentralized liquidity pools are ultimately condensed into a single unified benchmark price, erasing the microstructure differences between markets.
The consequences of this information bottleneck are systemic. Because all protocols relying on the same oracle share this compressed informational reality, the oracle effectively becomes the single point of failure for the entire on-chain financial ecosystem. When the off-chain market swings violently and the oracle, constrained by the bottleneck, cannot transmit this swing in a timely and accurate manner, the on-chain protocol's risk-control mechanisms make decisions based on stale or distorted price data. This systemic misjudgment, arising from information asymmetry, is precisely the root cause of large-scale liquidation cascades and pool depletion. However rigorous the logic of an on-chain protocol's design, its security ceiling is always constrained by the quality of the oracle's cross-layer information transmission.
14.5.6 Latency and information asymmetry
The most direct manifestation of the oracle cross-layer information bottleneck is the latency of price updates, which creates a brief but significantly impactful window of information asymmetry between on-chain and off-chain. When the true price in the external market suddenly changes while the oracle's on-chain price has not yet been updated, an arbitrageur with faster information channels can clearly see the future direction of the on-chain price. This time difference confers on the arbitrageur a structural informational advantage. In actual execution, frictions such as the uncertainty of gas costs, the front-running competition of MEV bots, the execution risk of smart contracts, and the protocol's position limits prevent this theoretical informational advantage from being fully captured—which is precisely why the oracle extractable value discussed in Section 14.5.7 is partly dissipated through MEV competition.
Figure 14-10 depicts the window of information asymmetry created by oracle update latency when the true off-chain price suddenly changes.
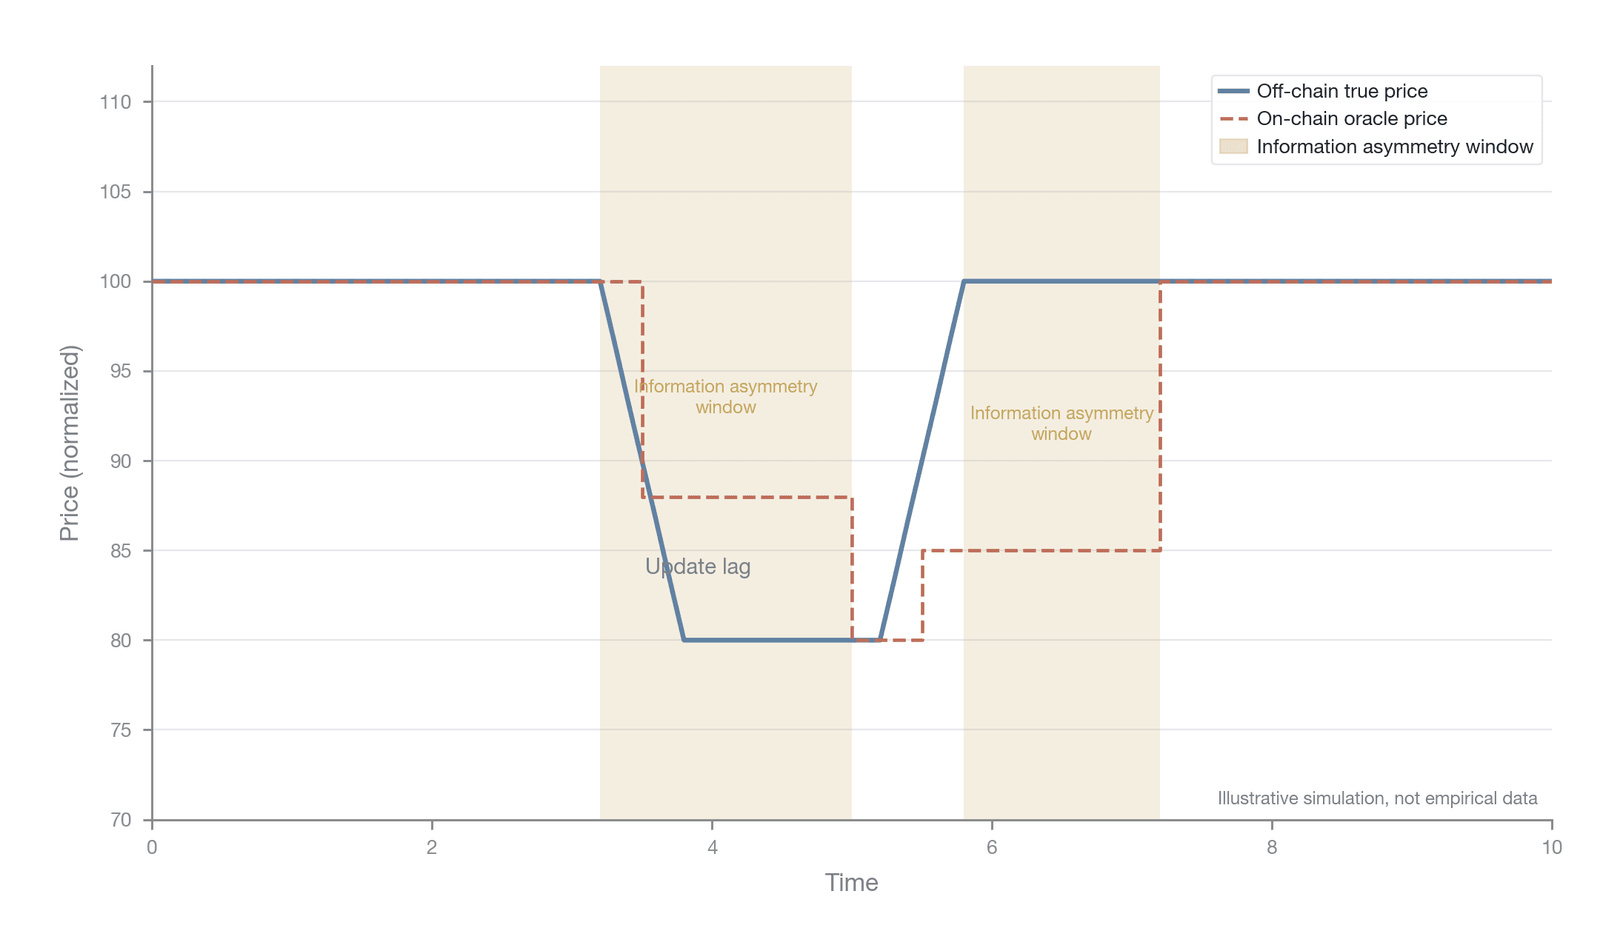
Figure 14-10. Oracle update latency and the formation of the information-asymmetry window
In a lending protocol, if the true price of the collateral asset plunges but the oracle price still sits at a high level, a malicious user can, in the few seconds before the oracle updates, use the overvalued collateral to borrow a large amount of assets and then let the position be liquidated after the oracle updates. On a derivatives exchange, if the true price surges, a trader can establish a long position while the on-chain price has not yet reacted and close it for a profit immediately after the oracle completes its update. This behavior essentially shifts the oracle's latency cost onto the protocol's liquidity providers and other honest users.
To counter this latency arbitrage, protocol designers typically introduce more conservative parameter settings, such as lowering the maximum leverage, raising the initial collateralization ratio, or extending the withdrawal lock-up time. Yet these defensive measures inevitably reduce capital efficiency and harm the user experience. The deeper problem is that as long as oracle updates have a physical time interval, this window of information asymmetry cannot be entirely eliminated. The speed race between arbitrageurs and oracle nodes becomes a zero-sum game that consumes vast resources, with the result of continually driving up the operating cost of the entire ecosystem.
14.5.7 Oracle extractable value
An oracle update transmits not only price information but also determines the timing of on-chain state transitions. In a lending protocol, a change in the oracle price is the sole condition that triggers the liquidation procedure. When the oracle submits a price that renders a borrowing position insolvent, whoever can be the first to execute the liquidation transaction reaps a rich liquidation penalty. This risk-free profit, directly spawned by the oracle update, is called oracle extractable value (OEV) [36].
Figure 14-11 shows the extraction and redistribution flow of OEV under the traditional path and under the order-flow-auction path.
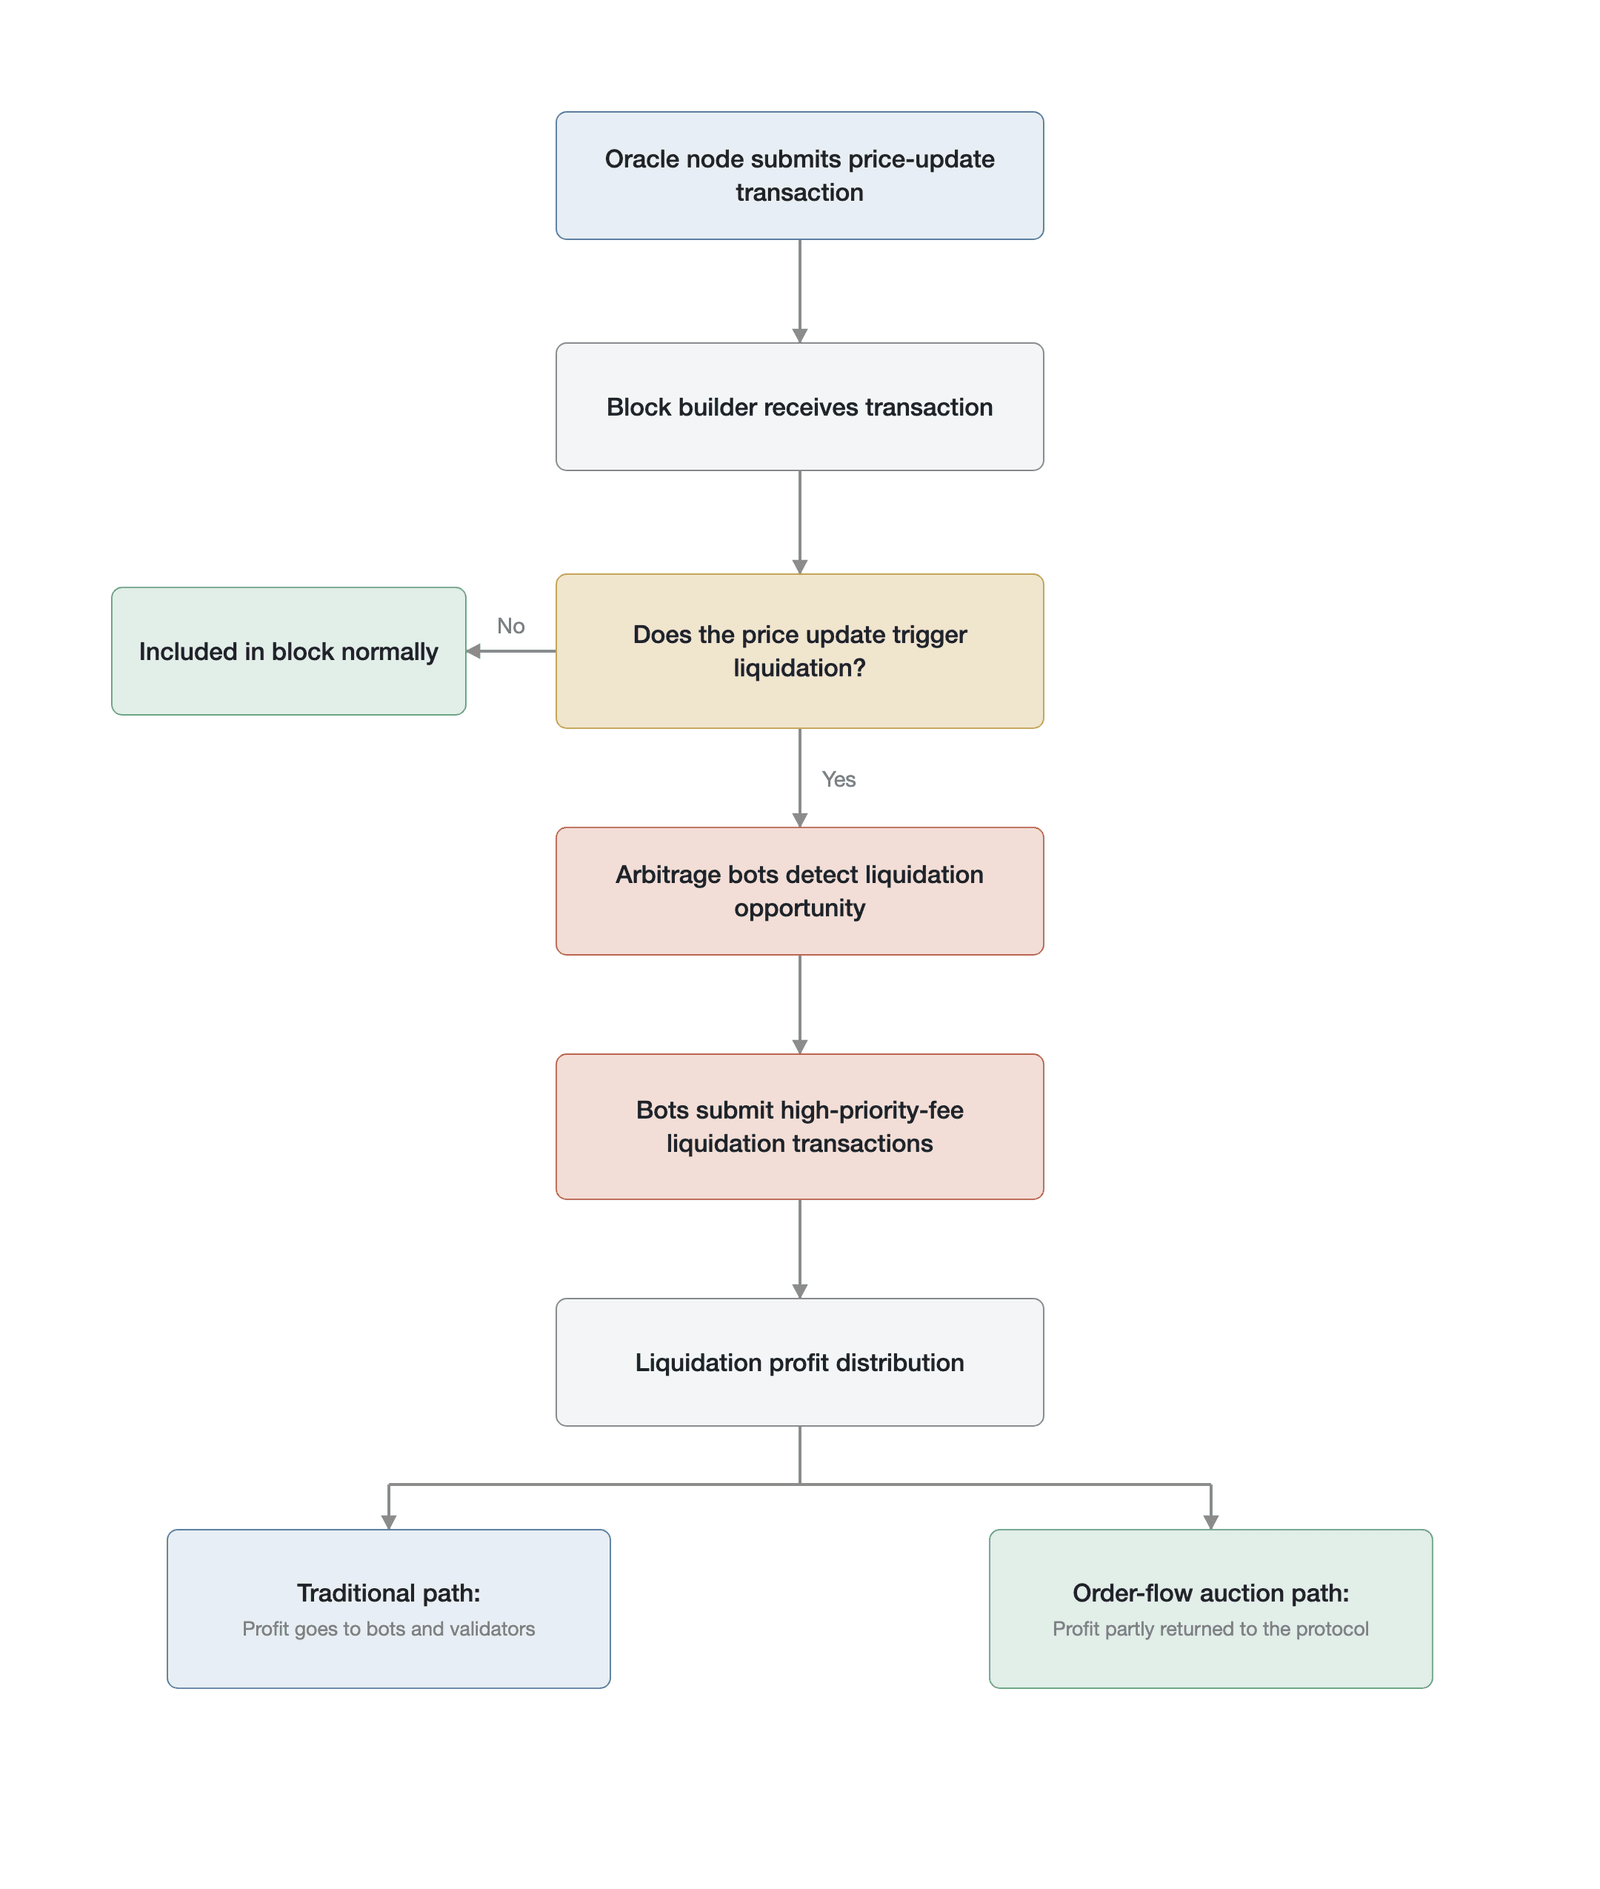
Figure 14-11. The extraction and redistribution of oracle extractable value
OEV reshapes the underlying incentive structure of the blockchain network. To compete for the right to liquidate, arbitrage bots—within the same block as the oracle-update transaction—try to have their own liquidation transaction executed immediately after the oracle update, either by paying an extremely high network priority fee or by directly bribing the block builder. This fierce bidding not only causes network congestion and a surge in ordinary users' transaction costs but also transfers value that would otherwise belong to the DeFi protocol to the underlying miners or validators.
To reclaim this leaked value, oracle networks have begun to explore new economic models. One representative scheme introduces an order-flow auction mechanism that allows liquidators to bid off-chain for the right to execute an oracle update. The highest-bidding liquidator obtains the exclusive right to package the oracle update together with its liquidation transaction into a single atomic operation for submission on-chain. The proceeds of the auction are then returned to the lending protocol or the oracle network according to a predetermined ratio [37]. This mechanism transforms the timing of the oracle update itself into a quantifiable, distributable economic asset, marking the evolution of oracle design from a pure data-transmission layer toward a complex economic-game layer.
14.5.8 The cost-benefit of oracle manipulation
An oracle may fail not only because of technical faults or network latency but also faces the severe threat of deliberate manipulation. An oracle-manipulation attack is essentially a precisely calculated economic game: the attacker conducts large trades in the off-chain spot market or on-chain liquidity pools to artificially distort the target asset's price, forcing the oracle to transmit this false price on-chain. The attacker then uses this manipulated on-chain price to borrow maliciously in a lending protocol or to trigger erroneous liquidations in a derivatives market, thereby seizing enormous profits.
The core of whether an attack is feasible lies in the comparison of cost and benefit. The cost of attack mainly comprises the capital slippage needed to move the price in the spot market, transaction fees, and the friction cost of cross-market hedging. Because oracles typically use multi-source aggregation and time-weighted averaging algorithms, an attacker must maintain the anomalous price for a sufficiently long time and across multiple major liquidity centers at once, which greatly raises the manipulation cost [38]. However, with the spread of uncollateralized borrowing tools such as flash loans, an attacker can mobilize hundreds of millions of dollars within a single block and instantly break through a weak liquidity pool, so the originally very high capital barrier loses its binding force.
Figure 14-12 compares the cost-benefit curves of launching an oracle-manipulation attack against a high-liquidity asset versus a low-liquidity asset.
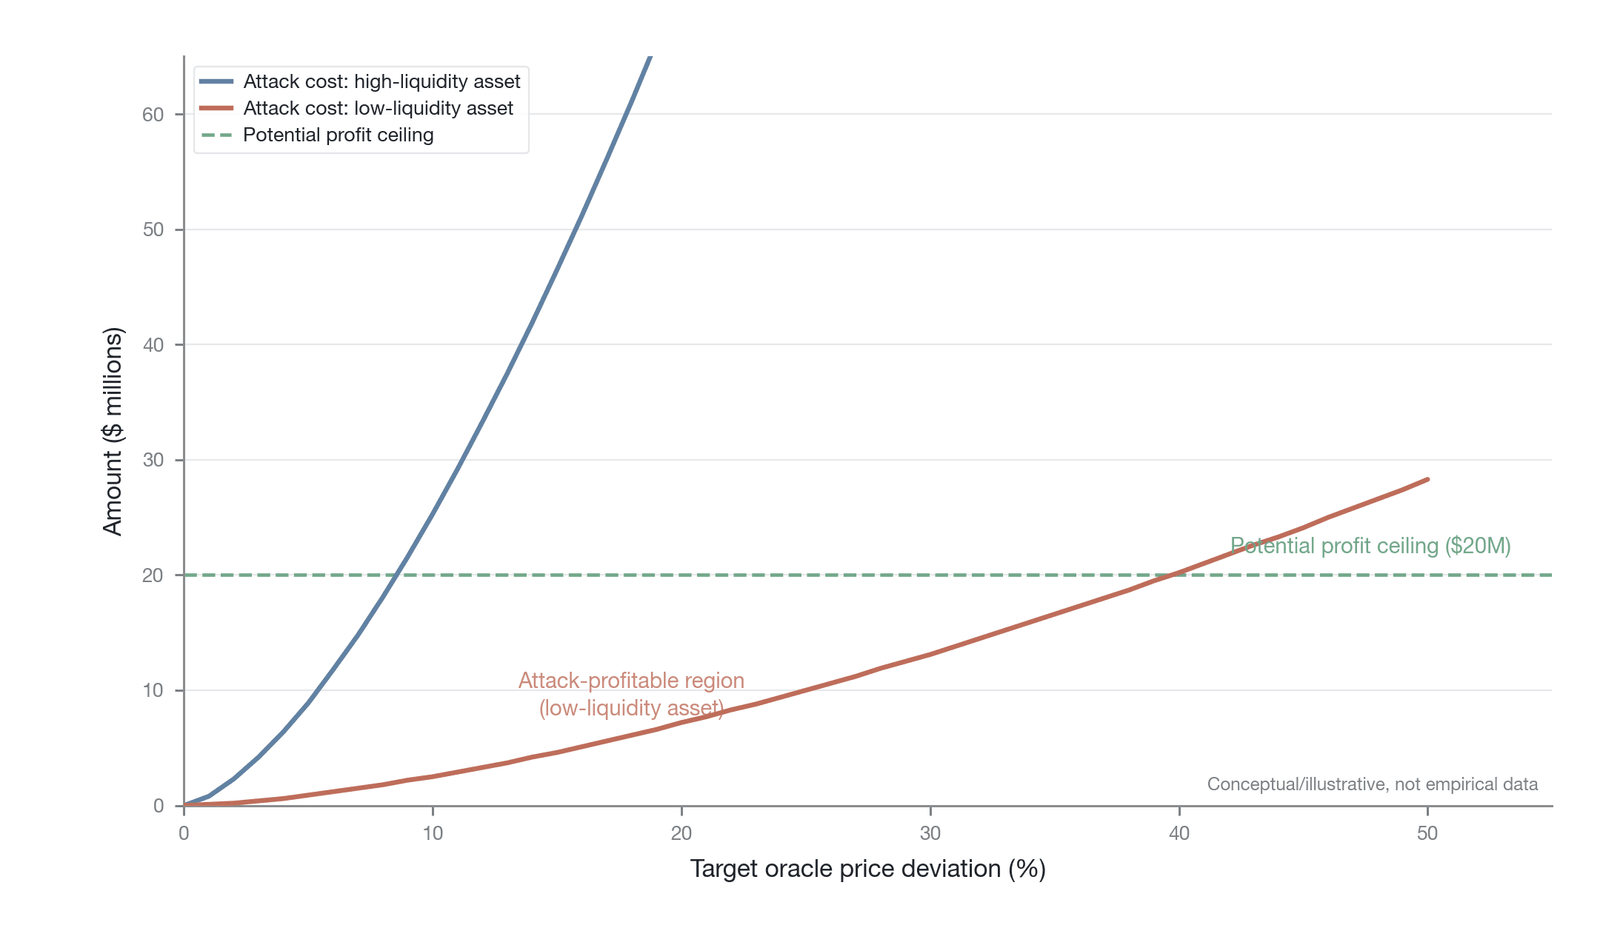
Figure 14-12. Cost-benefit analysis of oracle manipulation attacks
The potential benefit of an attack depends on the on-chain protocol's risk exposure. If a lending protocol allows users to use an extremely illiquid long-tail token as collateral to borrow highly liquid stablecoins, then an attacker need only spend a minimal cost to ramp the long-tail token's price and can drain the protocol's entire stablecoin reserve. In the 2022 attack on a decentralized lending-and-derivatives protocol, the attacker extracted approximately $116 million in liquidity within just a few dozen minutes by manipulating the oracle price of a governance token [3]. This extremely high return-on-investment ratio shows that defending against oracle manipulation cannot rely solely on strengthening the robustness of the oracle itself but requires the on-chain protocol to build a multi-layered defense-in-depth system across asset admission, debt ceilings, and liquidity-depth monitoring.
14.6 Feedback loops and systemic transmission
In the on-chain financial system, a price benchmark is not merely a passively read data point but a dynamic variable that drives the operation of the entire system. When we examine a price benchmark within the dynamic evolution of market microstructure, we find that it not only reflects market state but also shapes market behavior. Under the joint action of leverage and liquidity, a price benchmark becomes the hub of both positive-feedback and negative-feedback loops. Liquidation spirals, funding-rate arbitrage, and oracle synchronization congestion are all, in essence, the systemic results of a price benchmark transmitting through different feedback mechanisms. Understanding the trigger conditions and transmission paths of these loops is a prerequisite for guarding against on-chain systemic risk.
14.6.1 Positive feedback and the liquidation spiral
In the finance literature, Brunnermeier and Pedersen (2009) decompose the margin spiral into two mutually reinforcing sub-mechanisms: the loss spiral and the margin spiral [39]. The transmission logic of the loss spiral is that a price fall causes leveraged traders' existing positions to incur unrealized losses; the decline in their capital adequacy forces them to cut positions, and the resulting selling pressure depresses the price further. The transmission logic of the margin spiral is different: a price fall raises market volatility, and the risk-control system accordingly raises its margin-ratio requirement, so that even if a trader's existing position has not yet touched the liquidation line, the higher margin requirement forces them to reduce positions proactively to satisfy the new capital constraint. In traditional finance, these two sub-mechanisms are coupled through market makers' funding constraints. Gromb and Vayanos's (2002) [40] study shows that when arbitrageurs face funding constraints, their ability to dampen price deviations declines, market liquidity deteriorates accordingly, and the price shock is further amplified. The model also implies a contagion channel that is often overlooked: when market makers and proprietary trading firms operate simultaneously in both crypto and traditional financial markets, a funding-constraint shock in the crypto market may transmit to other asset classes through the balance sheet of the common intermediary, and vice versa. Brunnermeier and Pedersen's original model assumes that margin requirements adjust dynamically with value at risk (VaR)—that is, rising volatility drives up the margin ratio and forces traders to reduce positions before the price reaches the liquidation line. Crypto perpetual futures markets, however, generally adopt a fixed-leverage margin regime, in which the initial margin is the reciprocal of the leverage multiple and does not adjust in real time with volatility. This means that the transmission path of the margin spiral in the original model—rising volatility leading to higher margin requirements leading to forced position reduction—is replaced in crypto markets by the loss spiral path: a price fall directly erodes the margin balance until it touches the fixed liquidation threshold. The dynamics of the two mechanisms have different temporal characteristics: the VaR margin spiral can start at the early stage of a volatility rise, whereas the loss spiral under fixed leverage is triggered only after the price change accumulates to a sufficient magnitude. When this corrected theory is mapped onto on-chain finance, the liquidation spiral exhibits even more deterministic and automated characteristics, because the smart-contract liquidation engine has no buffer of human judgment: once the mark price touches the liquidation line, the closing instruction executes within milliseconds (Chapter 11 provides the mathematical derivation of this mechanism). The liquidation spiral is not merely the result of excessive leverage or the depletion of market liquidity; its fundamental driving force is embedded deep in the design of the price benchmark. The smoothing parameters of the mark price, the update frequency of the oracle, and the degradation strategy of the index together constitute the control variables of the liquidation spiral, determining the spiral's activation threshold, amplification speed, and duration.
The smoothing mechanism of the mark price serves as a buffer in normal markets, but under extreme conditions it can become a catalyst for the liquidation spiral. The mark price trap described in Section 14.4.4 manifests in the liquidation spiral as a reflexive closed loop: retroactive liquidation under long-window smoothing forcibly closes positions that had already avoided liquidation, the resulting selling pressure again depresses the true price, and this in turn drags the mark price down further, turning a one-time price shock into sustained systemic selling pressure.
The index's degradation strategy likewise plays a key role in the spiral. When some exchanges' price sources fail because of liquidity depletion or system outages, if the index-construction rules lack a robust exclusion mechanism, anomalous prices are incorporated into the calculation. This distorts the index price and in turn triggers erroneous liquidations by protocols relying on that index. In the market crash of October 2025, more than $19 billion in leveraged positions were liquidated within 24 hours [41]. During this process, the near-touch available liquidity in Bitcoin's order book contracted sharply by more than 90% (on a major-venue, major-pair basis), and the bid-ask spread widened from single-digit basis points to double-digit percentages. This liquidity vacuum and the mechanical execution of the mark price reinforced each other, forming a classic positive-feedback loop.
14.6.2 Negative feedback and the funding rate
In contrast to the positive feedback of the liquidation spiral, the funding rate is the core negative-feedback mechanism in the perpetual futures market. Its core function is to use economic incentives to push the contract price back toward the spot index price. When the contract price is higher than the index price, the funding rate is positive and longs pay a fee to shorts, which incentivizes arbitrageurs to short the contract and buy the spot, thereby depressing the contract price. This algorithmic feedback rule effectively maintains the anchoring between the derivatives market and the spot market most of the time.
Yet the effectiveness of the funding-rate mechanism rests entirely on the accuracy of the index price. When the index price that serves as the benchmark is itself distorted, this negative-feedback mechanism not only fails but may even turn into destructive positive feedback. If the spot index deviates from true fair value because of an extreme anomaly at an individual constituent exchange, the funding rate is computed based on this erroneous benchmark. Acting on erroneous incentives, arbitrageurs instead push the derivatives price in a direction that deviates from true value.
In extreme market volatility, the failure of the funding rate is often accompanied by the depletion of liquidity. When market participants expect the index price to be unreliable, they demand a higher risk premium, manifested as wider spreads and smaller resting-order sizes. At this point, even if the funding rate offers an enormous arbitrage opportunity, arbitrage capital chooses to exit the market because of excessive slippage costs and a sharp rise in liquidation risk. On the eve of the October 2025 crash, the annualized funding rate in the derivatives market briefly surged to 30%. A 30% annualized funding rate converts to approximately 0.0274% every 8 hours; although this level is far above the 0.01% baseline, its negative-feedback effect is subject to three constraints in a one-sided extreme move. The first is the constraint of settlement frequency: within the 8-hour window between two consecutive settlements, the funding rate exerts no direct economic constraint on the market. The second is the saturation of the rate cap: most exchanges impose a cap on the funding rate. On Binance, for example, the cap is not a fixed value but is set according to the contract's maintenance margin rate (approximately 0.75× the maintenance margin rate for high-leverage contracts, and approximately ±2% for low-leverage contracts); once the degree of market imbalance exceeds the basis level corresponding to that cap, the funding rate can no longer increase to reflect the true extent of the long-short imbalance. Third, when the expected short-term return of extremely leveraged longs far exceeds the cost of the funding rate, the rate mechanism degenerates from a substantive deleveraging incentive into a negligible holding cost. When the market collapses, this steep holding cost accelerates the closing of long positions, the negative-feedback mechanism breaks down entirely, and it instead becomes a force that intensifies the market sell-off.
From a macro-finance perspective, the funding rate can be decomposed into a risk-free interest rate component and a leverage premium specific to crypto markets. During a Federal Reserve rate-hiking cycle, the opportunity cost of holding a long position in crypto perpetual futures rises and the equilibrium funding rate increases accordingly, which means that part of the funding rate's anomaly may merely reflect changes in the macro interest-rate environment rather than a failure of market microstructure. However, the annualized funding rate of as high as 30% on the eve of the October 2025 crash far exceeded contemporaneous U.S. dollar interest rates, revealing the enormous leverage premium embedded within it. This extreme premium is itself a signal of behavioral crowding: the high concentration of directional positions (post-hoc statistics show that longs accounted for approximately 87% of liquidations) indicates that narrative-driven chasing and social-media-amplified optimism had pushed the market into an extremely fragile state. Far from suppressing this crowding, the high funding rate was instead read by some traders as confirmation that the market is extremely bullish, forming a positive-feedback cognitive loop that runs counter to the negative-feedback design intent.
Figure 14-13 places the operating mechanisms of the positive-feedback loop and the negative-feedback loop side by side, revealing the symmetry between them in trigger conditions and transmission direction.
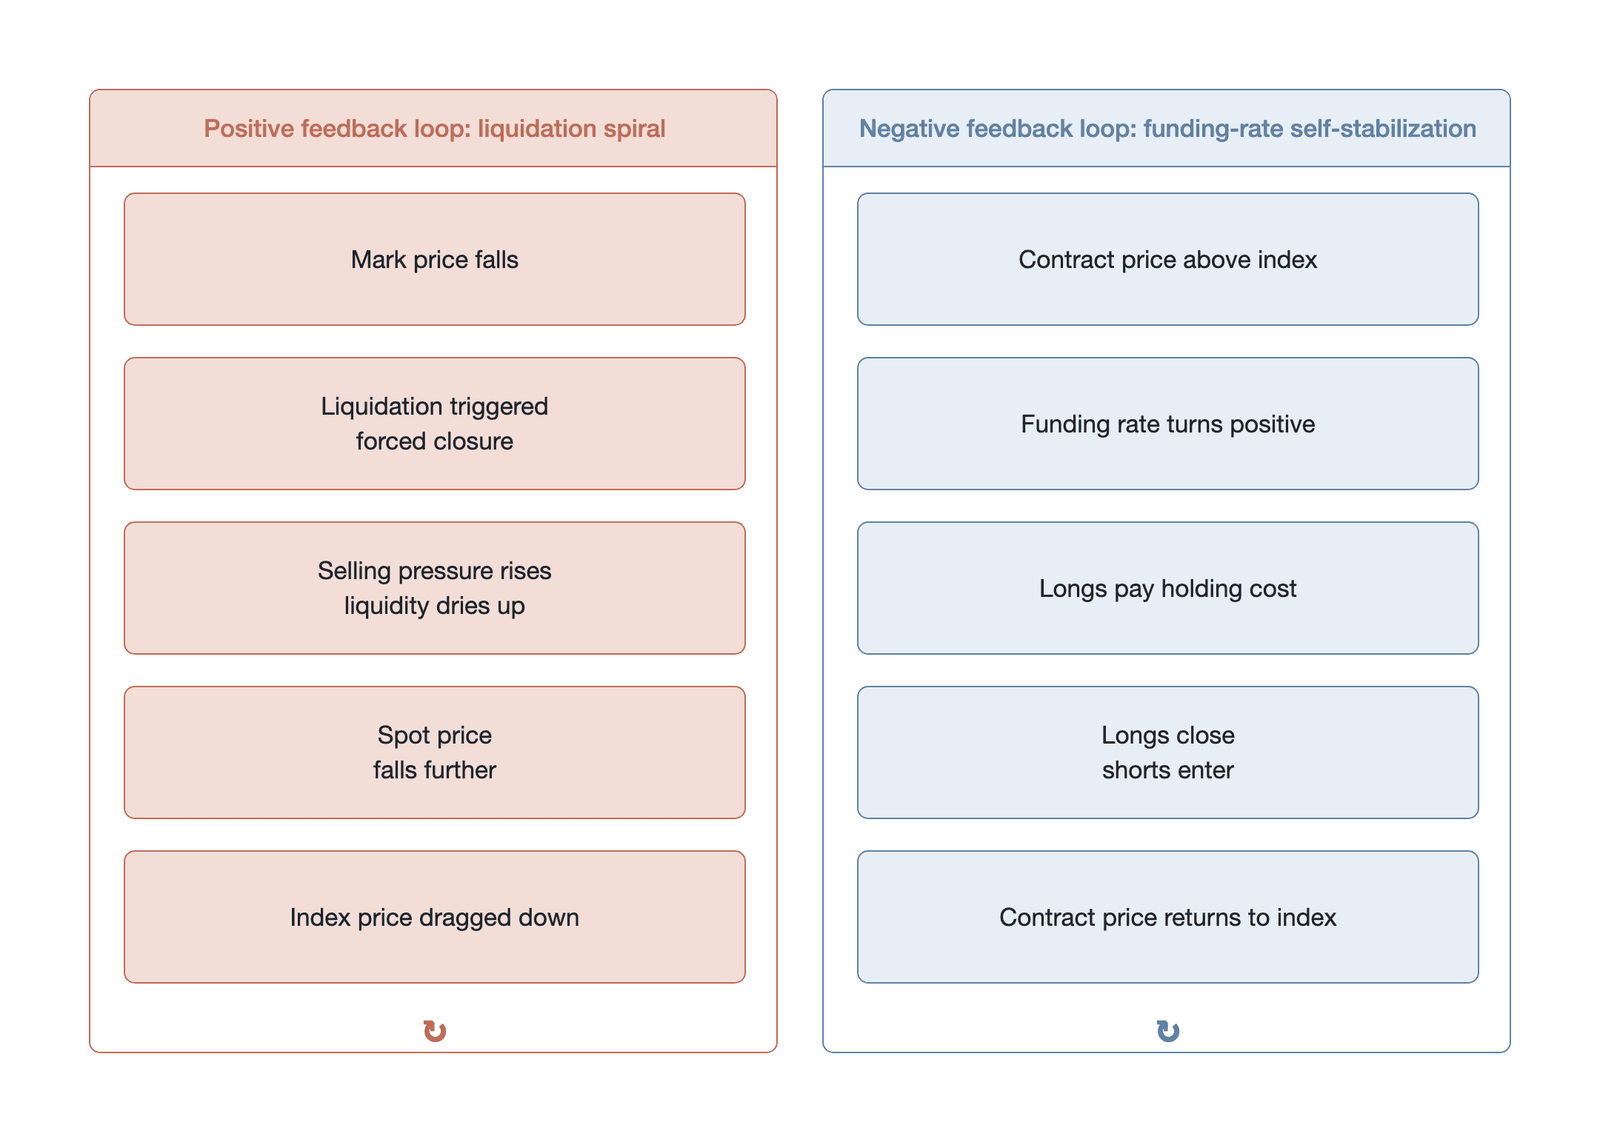
Figure 14-13. Comparison of the positive-feedback and negative-feedback loops
The core finding of this figure is that under normal market conditions, the negative-feedback channel of the funding rate dominates and can effectively pull the derivatives price back toward the spot index; however, when the benchmark price itself is distorted, the anchoring foundation of the negative-feedback loop is destroyed and the system rapidly switches to a positive-feedback mode dominated by the liquidation spiral. The switch between the two modes is often nonlinear, and the location of the critical point depends on the accuracy of the index and the depth of market liquidity.
14.6.3 Oracle synchronization risk
As the sole channel through which off-chain data enter the chain, the oracle's information-compression characteristic manifests not only within a single protocol but also, more significantly, at the cross-protocol systemic level. In the current on-chain financial ecosystem, oracle networks exhibit a highly concentrated character. The vast majority of mainstream protocols rely on a very small number of leading oracle service providers to obtain their price benchmarks. While this architecture lowers the integration cost of an individual protocol, it introduces a serious synchronization risk.
When multiple lending protocols, derivatives exchanges, and synthetic-asset platforms share the same oracle price feed, they effectively share the same liquidation trigger. Once the oracle updates a sharply lower price, all protocols subscribing to that feed trigger their liquidation logic simultaneously. On a throughput-constrained blockchain such as Ethereum, this synchronized liquidation instantly generates a massive volume of liquidation transactions, causing severe network congestion and a surge in gas fees.
This synchronized congestion in turn obstructs users' margin top-ups and arbitrageurs' dampening trades. Borrowers cannot add margin before liquidation occurs, arbitrageurs cannot execute cross-market arbitrage in time, and liquidity providers cannot adjust their market-making ranges. The delay caused by network congestion is equivalent to injecting enormous friction into the entire system, so that a local imbalance that could have been regulated spontaneously by the market evolves into a systemic liquidity crisis. In the crash of May 19, 2021, network-wide liquidations exceeded $8 billion, and the synchronization of oracle updates caused severe on-chain congestion, so that many users could not stop their positions from being liquidated because they were unable to send transactions [4]. More insidious is the second-order effect of synchronized congestion: when network congestion prevents oracle price updates, the on-chain price stalls at a stale level, and the liquidations that should have been triggered are therefore delayed. Yet once the congestion eases and the oracle price completes a discrete jump update, all the positions awaiting liquidation that accumulated during the congestion are released in a concentrated burst within an extremely short time, and the resulting liquidation shock is far greater than the gradual liquidation that would have occurred had the oracle updated continuously. In other words, the recovery phase of synchronized congestion may be more destructive than the congestion itself.
14.6.4 The four transmission paths
The failure of a price benchmark is not an isolated event but spreads through the entire financial system along specific paths. Synthesizing the preceding analysis, we can outline four main transmission paths by which a price benchmark triggers a systemic crisis. These four paths describe the dynamic process by which a crisis spreads through the system, answering the question of how a crisis evolves from a local anomaly into a systemic collapse. Complementary to them is the taxonomy of five failure modes to be established in Section 14.7.2, which classifies the system's structural vulnerabilities from the static angle of architectural flaws, answering the question of why the system is prone to failure at specific links. A correspondence exists between the two frameworks: source contamination is both the starting point of a transmission path (this section) and an architecture-level failure mode (Section 14.7.2); the distortion of the arbitrage window is the joint runtime manifestation of the two failure modes of aggregation distortion and transmission latency. These four paths often do not occur in sequence but activate simultaneously and interweave under extreme conditions.
Source contamination is the starting point of crisis transmission, usually originating from a local liquidity depletion in the spot market or a system failure at an individual exchange; the anomalous price enters the calculation system of the benchmark price through the weight allocation of index construction and, in the absence of an effective exclusion mechanism, is amplified and passed to downstream. When the distorted benchmark price enters an anchoring mechanism such as the funding rate, the distortion of the arbitrage window follows: arbitrage capital, guided by erroneous economic signals, withdraws from the market or takes offsetting positions, so that a mechanism that normally stabilizes turns into one that amplifies. At the same time, the liquidation spiral, through the smoothing algorithm of the mark price, converts a price shock into a stream of sustained liquidation instructions, and the intervention of the auto-deleveraging mechanism further contagiously spreads the risk to originally profitable hedging positions, causing systemic deleveraging. At the underlying-infrastructure level, the synchronized liquidation caused by multiple protocols sharing an oracle instantly exhausts the blockchain's computational resources, and the network congestion not only blocks users' self-rescue avenues but also paralyzes arbitrageurs' ability to intervene, so that the system loses all its regulatory functions at the very moment it most needs liquidity. These four paths do not occur in sequence but activate simultaneously and couple with one another under extreme conditions, ultimately amplifying a local price anomaly into an on-chain systemic crisis [42].
The interaction effects among the four paths are superadditive. Among them, the coupling of source contamination and feedback amplification is the most destructive path pair: a distorted source transmits through the index to the mark price, triggers erroneous liquidations, and the liquidation selling pressure in turn further distorts the spot price, constituting a new round of source contamination. When oracle synchronization risk is superimposed, multiple protocols sharing the same oracle feed trigger the above cycle at the same instant, amplifying a price distortion that should have been confined to a single protocol into a cross-protocol systemic contagion. The key path to breaking this cycle lies in the accuracy of the source layer: once the credibility of the index price is guaranteed, the downstream feedback amplification and arbitrage-window distortion lose their driving force.
Figure 14-14 visualizes the four paths above and their cross-coupling relationships in the form of a flowchart.
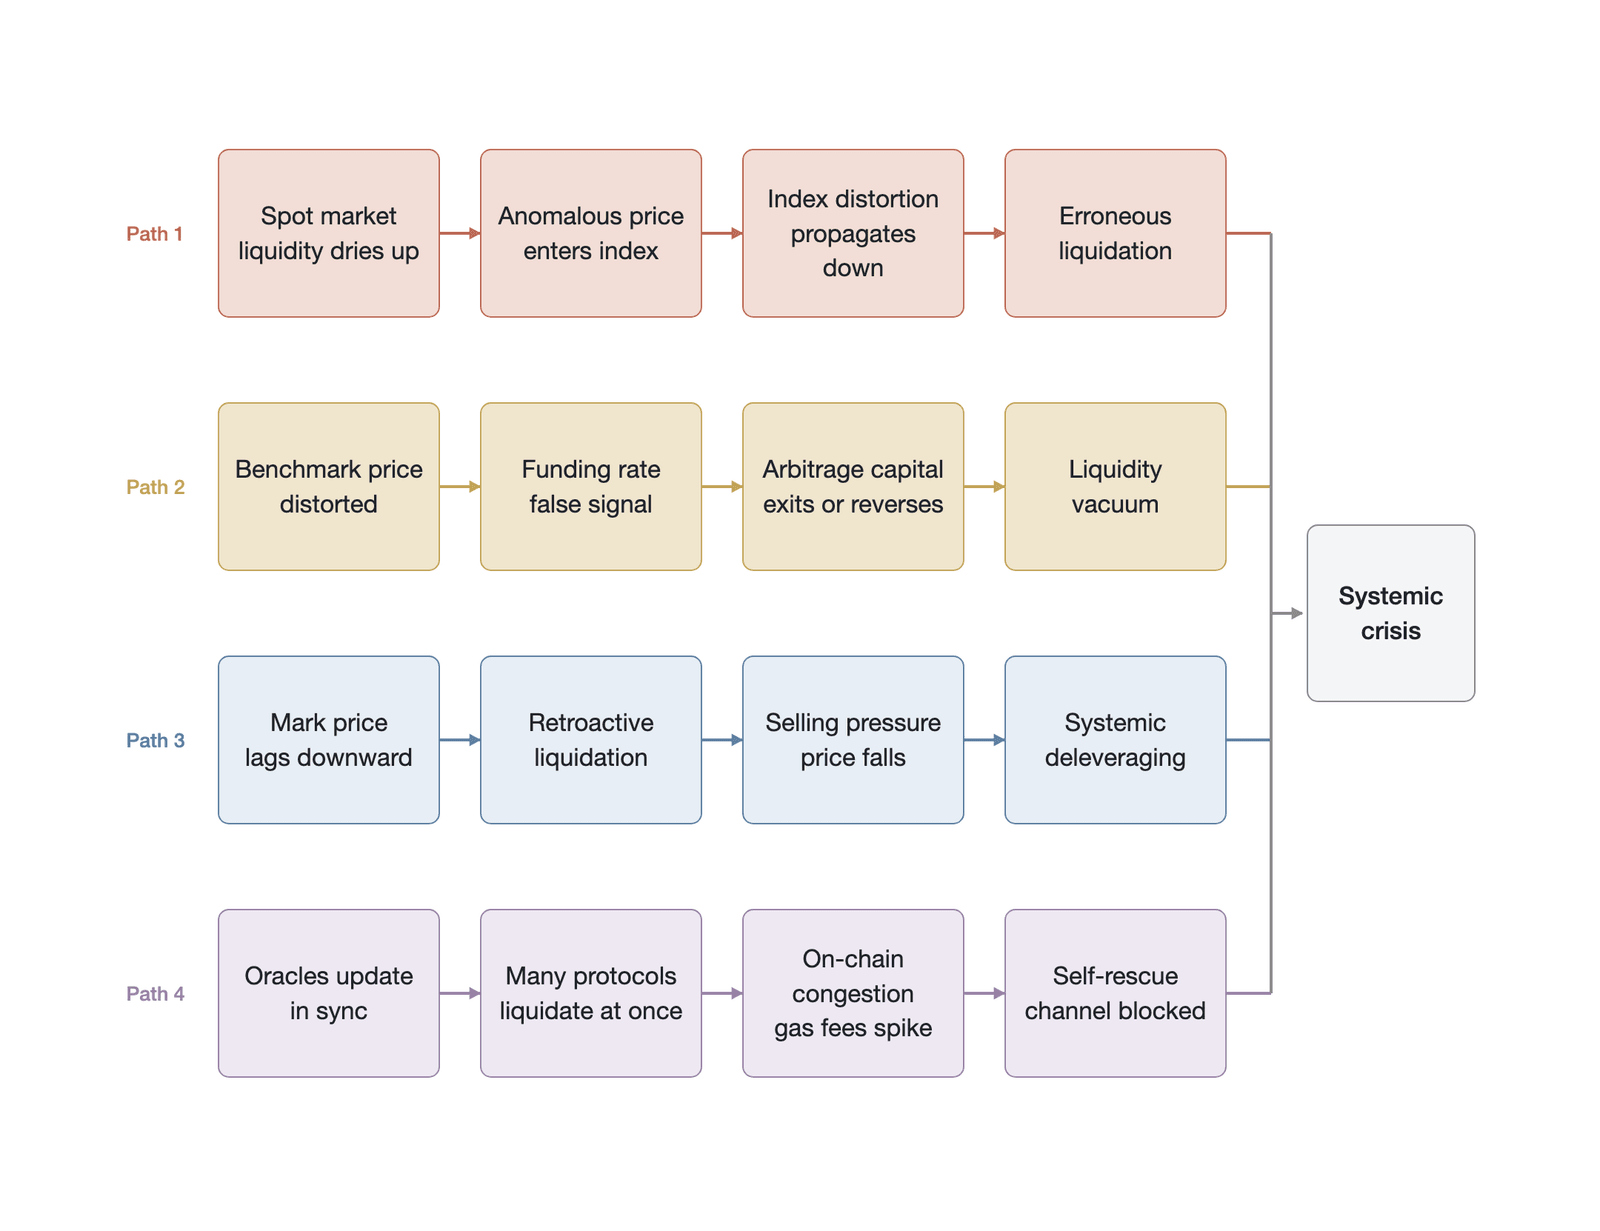
Figure 14-14. The four transmission paths of price-benchmark failure
Although the figure presents the four paths in parallel, their true danger lies in the fact that they are not isolated linear chains but couple with one another to form a mesh structure: the output of source contamination flows directly into the input of arbitrage-window distortion, the selling pressure produced by the liquidation spiral in turn aggravates the liquidity depletion of the source layer, and synchronized congestion acts as a lateral constraint that simultaneously limits the self-repair capability of all paths. This multi-path coupling explains why the scale of losses in extreme conditions often far exceeds what any single path would predict.
14.7 Attack surfaces, failure modes, and lines of defense
Having understood how a price benchmark transmits risk through the system, we must confront an objective fact: a price benchmark can not only fail naturally in an extreme market environment but can also become the target of deliberate manipulation by malicious attackers. The permissionless nature of on-chain finance and the openness and transparency of its code mean that any small design flaw can be turned into enormous economic gain. Attack-surface analysis, the classification of failure modes, and the construction of a defensive system constitute the practical core of price-benchmark governance.
14.7.1 A unified attack-surface analysis
The attack surface of a price benchmark is not a single-dimensional vulnerability but is distributed across the complete lifecycle from data collection to on-chain execution. We can deconstruct this lifecycle into three core layers: the index layer, the mark-price layer, and the oracle layer. Any attack on a price benchmark is essentially a search for the weak link among these three layers, breaking their normal operating logic through capital advantage or technical means.
The attack surface of the index layer is concentrated mainly in liquidity manipulation in the spot market. An attacker artificially distorts the index's computed result through wash trading or malicious price ramping on a heavily weighted spot exchange. The success rate of this attack depends on the robustness of the index-construction rules, especially the ability to exclude outliers and the consideration of liquidity depth. If the index is merely a simple volume weighting without truncation of extreme prices, an attacker can influence the entire index with relatively little capital.
The attack surface of the mark-price layer focuses on the vulnerabilities of the smoothing algorithm. The mark price is designed to filter short-term volatility, but this smoothing mechanism can itself be exploited. In some designs, for example, if an attacker can maintain the spot price at an anomalous level for a sufficiently long time, the mark price will inevitably converge toward that anomalous price, thereby triggering the intended liquidations. This game along the time dimension depends on the contest between the attacker's capital cost and the length of the smoothing window.
The attack surface of the oracle layer concerns the security and timeliness of data transmission. Systematic research classifying oracle manipulation shows that attack vectors can unfold layer by layer, from the data source through off-chain aggregation to on-chain consumption [43]. Because the oracle is the main channel through which off-chain data enter the chain, it becomes the primary target of attack. Attack methods include manipulating a single oracle's data source through a flash loan, or exploiting network congestion to delay the oracle's update and thereby create arbitrage room. When the attack surfaces of these three layers are incorporated into a unified analytical framework, we can clearly see that the attacker's decision follows a simple condition of economic rationality: as long as the cost of manipulating the price benchmark is lower than the resulting liquidation gain or arbitrage profit, the attack will inevitably occur.
14.7.2 Five failure modes
To construct a defensive system systematically, we need to translate the attack surface into concrete failure modes. The failure of a price benchmark can be summarized into five typical modes covering every link from data input to governance intervention. Source contamination is the most basic failure mode, usually occurring in the upstream spot market: when an exchange serving as an index constituent suffers liquidity depletion or malicious manipulation, its anomalous output price, if not identified and excluded by the index-construction rules in time, enters the downstream system as a contamination source. Even if none of the data sources is itself contaminated, aggregation distortion can still arise at the index-calculation or oracle-node-aggregation stage, where unreasonable weight allocation or median-calculation logic can cause the final result to deviate severely from fair market value. The event in March 2026 in which a mainstream lending protocol, because of an oracle-configuration error, undervalued staked Ethereum and triggered $27 million in erroneous liquidations is a classic case of aggregation distortion [44]. The specific technical root cause of that event involved the exchange-rate oracle between the liquid staking token (LST) and the underlying Ethereum, rather than a simple price-oracle error; in a scenario where the staking token traded at an exchange-rate discount, an erroneous exchange-rate parameter triggered liquidations based on an incorrect valuation. At the data-transmission stage, transmission latency constitutes another kind of failure: under extreme conditions, the oracle's update frequency may fail to keep pace with the violent price swings, and the resulting on-chain price lag creates a window of information asymmetry for high-frequency traders, allowing arbitrageurs to extract value from the protocol using stale on-chain prices. When a distorted price benchmark triggers unreasonable liquidations or erroneous funding-rate payments, the feedback-amplification effect further worsens the situation: the selling pressure produced by liquidation continues to distort the price, forming a vicious cycle that turns a local failure into a global systemic crisis. Beyond these technical failures, governance rigidity itself constitutes a failure mode. If the governance process is too cumbersome to make decisions within the critical window of a crisis, the system loses its last means of correction; and if governance power is too concentrated, so that a few people can arbitrarily modify the parameters of the price benchmark, it will provoke a crisis of market trust, causing participants to withdraw liquidity for fear that the rules will be tampered with.
14.7.3 Three lines of defense
Facing multi-dimensional attack surfaces and complex failure modes, a single defensive mechanism is clearly insufficient. An on-chain financial protocol must build a multi-layered system that ranges from passive response to active defense. This defense in depth can be divided into three lines: the prevention layer, the buffer layer, and the recovery layer.
The outermost layer of the defense-in-depth system is the prevention mechanism, whose core objective is to block an anomaly before it occurs—for example, by adopting dynamic weight allocation based on liquidity depth in place of static volume weighting, introducing a strict outlier-truncation mechanism to exclude quotes deviating from the median beyond a specific threshold, and using a multi-oracle redundant design to cross-validate data from different networks and reduce the risk of a single oracle being manipulated. When an anomalous price breaks through the prevention mechanism, the buffer mechanism takes on the function of limiting its destructive power: a circuit-breaker mechanism can automatically pause trading or liquidation during violent price swings, providing the market a cooling-off period; the mark price's EMA algorithm absorbs short-term price shocks through smoothing along the time dimension; and dynamically adjusting the leverage cap and raising the initial-margin requirement constrain the systemic risk exposure under extreme conditions. Where the system has already suffered actual losses, the recovery mechanism intervenes as a last resort: the insurance fund absorbs the bankruptcy losses that arise when liquidation is not timely, protecting the protocol from insolvency, and when the insurance fund is exhausted, the auto-deleveraging mechanism makes up the shortfall by forcibly closing profitable positions. Beyond these three layers of mechanisms, transparent governance intervention serves as a supplementary means, allowing emergency adjustment of system parameters or a state rollback to be carried out under extreme circumstances.
The effectiveness of the three lines of defense rests on the assumption that each layer independently bears part of the risk, but in a systemic-collapse scenario the layers may come under pressure simultaneously rather than being activated in sequence. When all sources deviate simultaneously under a systemic shock, the prevention layer's outlier filtering loses its reference benchmark for judging what is normal; the protection the buffer layer's EMA smoothing provides in a sustained one-directional move decays exponentially over time; and the emergency governance vote on which the recovery layer relies may be far too slow to keep pace with the market's collapse. As Reason's Swiss cheese model reveals, the safety of multi-layered defense depends on the probability that the flaws of each layer are not aligned at the same moment—and an extreme tail event is precisely the scenario in which all layers fail at once. It is therefore insufficient to evaluate the effectiveness of each defensive line in isolation; one must also identify the joint-failure threshold of the multi-layer defenses through reverse stress testing—that is, by fixing the worst-case liquidation outcome and working backward to the minimal market-shock scenario that would produce it.
14.7.4 The attack-defense matrix
Combining the five failure modes with the three lines of defense, we can construct a comprehensive attack-defense matrix. This matrix reveals not only the response strategy for each failure mode but also the weak links in the current defensive system. Against source contamination, the prevention mechanism relies mainly on liquidity monitoring of the spot market and filtering of anomalous quotes, the buffer mechanism reduces the influence of a single contamination source through the smoothing of the index price, but if the contamination persists, the recovery mechanism can only rely on the insurance fund to absorb the losses from erroneous liquidations. For aggregation distortion, the key to the prevention mechanism is adopting a more scientific aggregation algorithm (such as a volume-weighted median), the buffer mechanism can limit the magnitude of a single update by setting a change threshold on the aggregated result, and after a systemic error occurs it may be necessary to launch an emergency governance vote to correct the aggregation parameters manually. In responding to transmission latency, the prevention mechanism's means are to raise the oracle update frequency or adopt a pull-based architecture, the buffer mechanism can compensate for latency risk by widening the bid-ask spread or increasing trade slippage, and the recovery mechanism may need to restore balance by rolling back transactions or confiscating the profits of malicious arbitrageurs. Against feedback amplification, the prevention mechanism's focus is optimizing the mark price computation logic to avoid excessive lag in a one-directional move, the circuit breaker within the buffer mechanism can break the vicious cycle by forcibly pausing liquidation, and the recovery mechanism relies on the insurance fund and auto-deleveraging to digest the systemic risk. For governance rigidity, a tiered governance architecture separates routine parameter adjustments from core rule modifications and grants a security council the power for rapid intervention, a timelock mechanism provides a buffer period for governance decisions to prevent malicious proposals from being executed instantly, and when governance fails completely, community consensus and forking mechanisms become the ultimate means of rebuilding trust.
Figure 14-15 summarizes, in matrix form, the cross-mapping between the five failure modes and the three lines of defense.
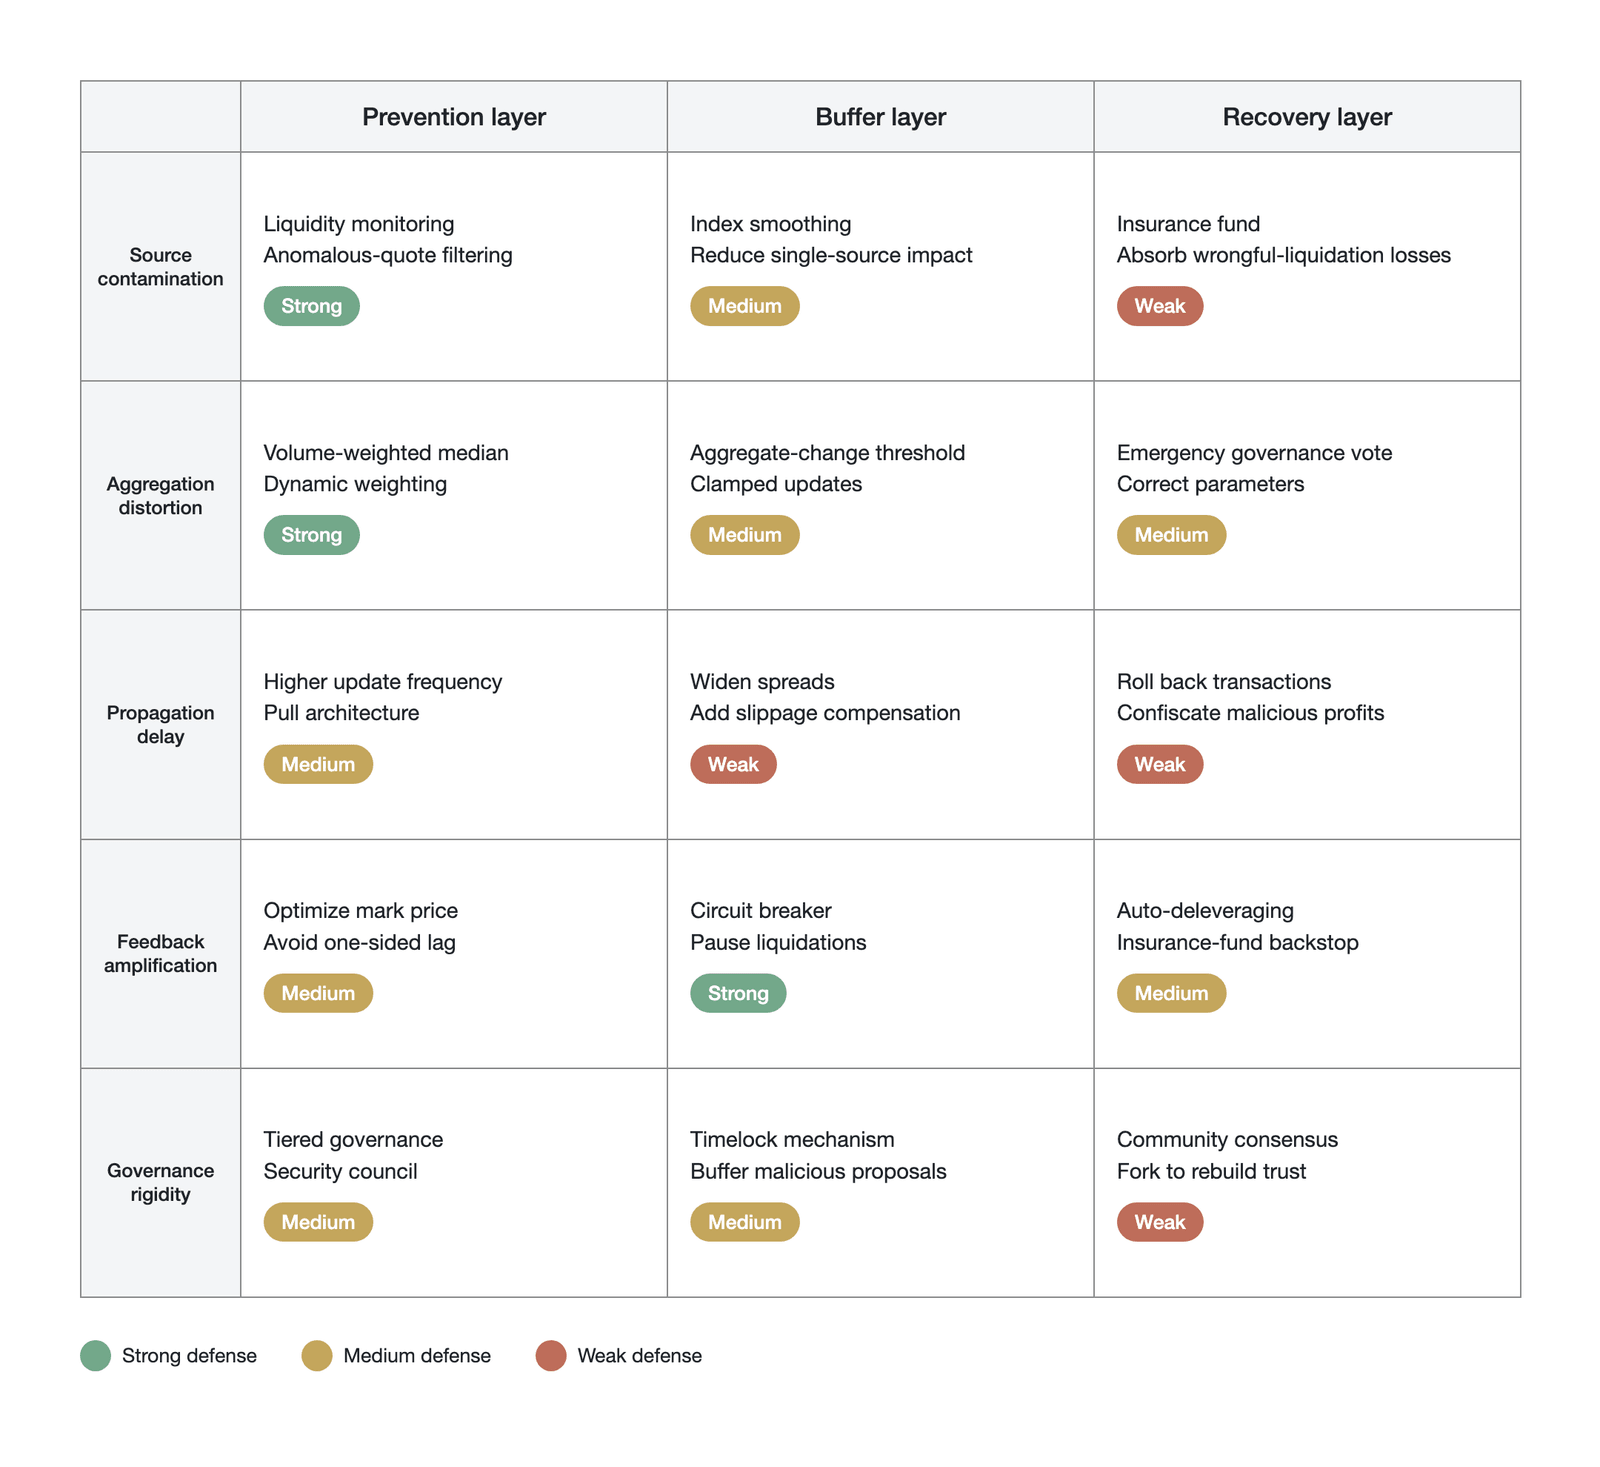
Figure 14-15. The attack-defense matrix of price-benchmark failure modes and the three lines of defense
The matrix shows that the prevention layer has strong coverage against source contamination and aggregation distortion but limited protective power against feedback amplification and governance rigidity. The circuit-breaker mechanism of the buffer layer plays a core role in responding to feedback amplification but is weaker in transmission-latency scenarios. The recovery layer, as a last resort, has an effectiveness that depends heavily on the adequacy of the insurance fund—and under extreme conditions, the insurance fund is precisely the resource most easily exhausted. This uneven coverage distribution indicates that the current defensive system has structural blind spots, especially in composite-attack scenarios where multiple failure modes are activated simultaneously.
14.7.5 Composite attacks and a case retrospective
A theoretical attack-defense matrix often appears structurally clear, but in the real on-chain world attackers frequently do not confine themselves to a single failure mode. The most dangerous and hardest to defend against is a composite attack that spans the index layer, the mark-price layer, and the oracle layer. In such an attack, multiple failure modes are activated simultaneously and the defenses are breached layer by layer.
The token-manipulation attack on a mainstream derivatives exchange in March 2025 is a classic case of a composite attack. The attacker first established a large short position in a low-liquidity token on the derivatives market. Then, using their capital advantage, they sharply ramped up the token's price on the spot market. This behavior directly triggered source contamination at the index layer.
As the spot price surged, the oracle transmitted this distorted high price on-chain. Although the mark price algorithm tried to smooth this violent swing, under the attacker's sustained capital push the mark price was ultimately and irreversibly ramped up. This caused the liquidity pool that served as the protocol's insurance fund to incur an unrealized loss as large as $13.5 million. The attacker exploited the time lag of the mark-price layer and the mechanical execution of the oracle layer, converting spot-market manipulation into enormous profits in the derivatives market.
Facing this composite attack, the protocol's routine defenses proved unable to respond effectively. Had the system been allowed to run according to its established rules, the liquidity pool would have faced an insolvency risk of about $230 million (per Halborn; other estimates put it at about $290 million). In the end, the protocol team had no choice but to take an extreme governance intervention: forcibly delisting the token through a validator vote and forcibly settling all positions at a price favorable to the liquidity pool. Although this forced intervention averted the protocol's collapse, it also laid bare the system's fragility under an extreme composite attack, along with the residual risk of centralized intervention in price-benchmark governance. Viewed through the lens of operational risk management, the fundamental failure point of this attack was not the price-benchmark algorithm itself but the token-listing governance standards: a token with extremely thin spot liquidity (a market cap of only about tens of millions of dollars) was allowed to trade on a platform with enough depth to generate $13.5 million in risk exposure. Given that no mark price engineering can adequately protect an extremely illiquid asset from manipulation, asset-admission standards—particularly constraints based on minimum liquidity depth and a maximum ratio of risk exposure—constitute the first line of defense in price-benchmark governance. This episode shows that however sophisticated the technical design, the security of a price benchmark ultimately depends on dynamic risk management grounded in a thorough understanding of microstructure.
Figure 14-16 reconstructs the complete process of the composite attack in the form of a timeline, annotating the temporal relationship in which the index layer, the mark-price layer, and the oracle layer were separately activated at different stages.
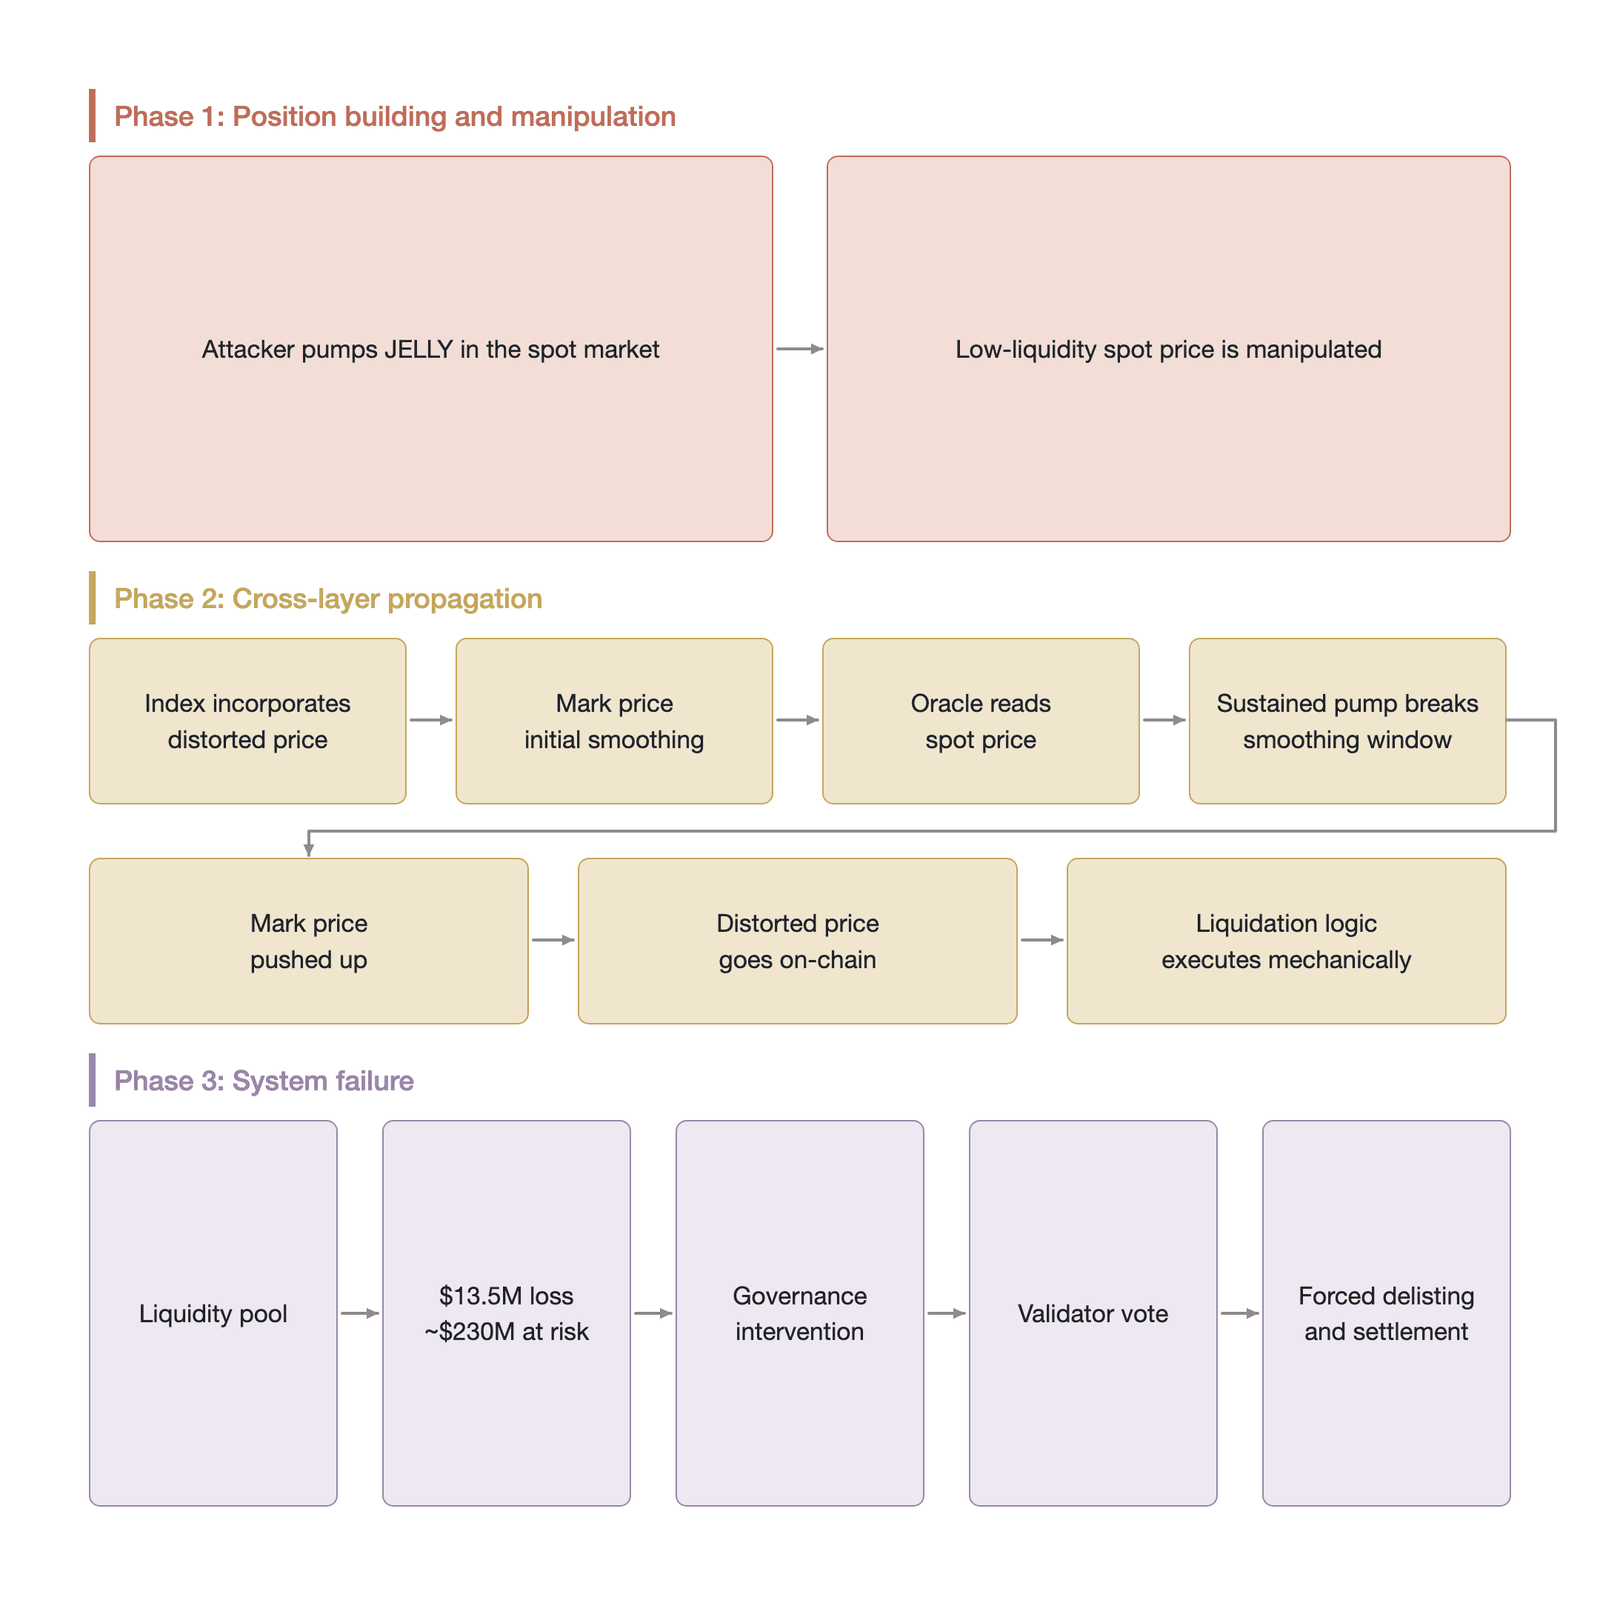
Figure 14-16. The timeline of a composite attack and the superposition of the three-layer attack surface
Note: The $13.5 million figure for the liquidity pool is the unrealized loss at the time of the event, corroborated by multiple reports; the $230 million figure is an estimate of the liquidity pool's potential risk from full exposure had the token continued to rise (per Halborn), not a realized loss.
The figure shows that within a window of about two hours the attacker exploited the vulnerabilities of the three layers in sequence: first contaminating the index-layer sources through spot-market manipulation (the position-building and price-ramping phase), then using the time lag of the smoothing algorithm to create a sustained deviation at the mark-price layer (the sustained-mark-price-deviation phase), and finally locking in the profit on-chain through the mechanical transmission of the oracle (the on-chain profit-locking phase). The superposition of the three attack surfaces made it impossible for any single-layer defensive measure to sever the complete transmission chain of the attack.
14.8 Case retrospective: the May 19, 2021 event
The effectiveness of price-benchmark governance must be tested under extreme market conditions. The cryptocurrency market crash of May 19, 2021 provides a highly complete study sample: a panic sell-off triggered by external news evolved, through a chain reaction across the source layer, the index layer, the mark-price layer, and the oracle layer, into a market-wide liquidation cascade. This event was not the isolated failure of any single layer but a systemic validation of the four transmission paths analyzed in this chapter being activated simultaneously under extreme conditions.
14.8.1 Background and timeline reconstruction
In mid-May 2021, the cryptocurrency market was in the midst of a strong bull-market cycle; Bitcoin had touched an all-time high of about $64,000 in April of that year, and Ethereum set a record of about $4,360 on May 12 [45]. However, a series of negative news items were released densely within a short period, severely damaging market confidence. The National Internet Finance Association of China, the China Banking Association, and the Payment and Clearing Association of China jointly issued an announcement reiterating the prevention of the risks of speculative virtual-currency trading and prohibiting financial institutions and payment institutions from providing related services. A few days earlier, Elon Musk had expressed concern about the environmental impact of Bitcoin mining and announced the suspension of accepting Bitcoin payments [4]. These external shocks were rapidly amplified in the high-leverage derivatives market. The macro trigger of the May 19 event was a sustained fundamental-revaluation shock rather than a transient technical fault. The key difference between a shock of this nature and a flash crash is that the sustained one-directional selling pressure over several hours prevented the EMA smoothing mechanism from protecting traders by waiting for a rebound; the latency effect analyzed in Section 14.4.3 was, in this context, inverted from a protective mechanism into a catalyst for the backlog of delayed liquidations.
On May 19, market volatility peaked. Bitcoin's price plunged from about $43,000 to close to $30,000, a single-day drop of approximately 30%; Ethereum's fall was even more severe, with an intraday maximum drop of about 46%, breaking below $1,900 during the session [4] [46]. Driven by the collapse of spot prices, high-leverage positions in the derivatives market and in DeFi lending protocols faced enormous closing pressure, triggering a record wave of liquidations. By some counts, network-wide liquidations exceeded $8 billion within 24 hours [4]. On the centralized-exchange side, on May 19 alone the major platforms recorded more than $7 billion in long liquidations, of which Huobi accounted for approximately $2.95 billion [47]. In DeFi, the two major lending protocols Aave and Compound experienced approximately $310 million and $260 million in collateral liquidations, respectively, during May 17 to 23, of which the single-day liquidations on May 19 were approximately $170 million and $160 million, respectively—each an all-time high for its protocol [47].
Figure 14-17 compares liquidation amounts across major platforms in the May 19 event, showing the order-of-magnitude difference in liquidation scale between centralized exchanges and DeFi protocols.
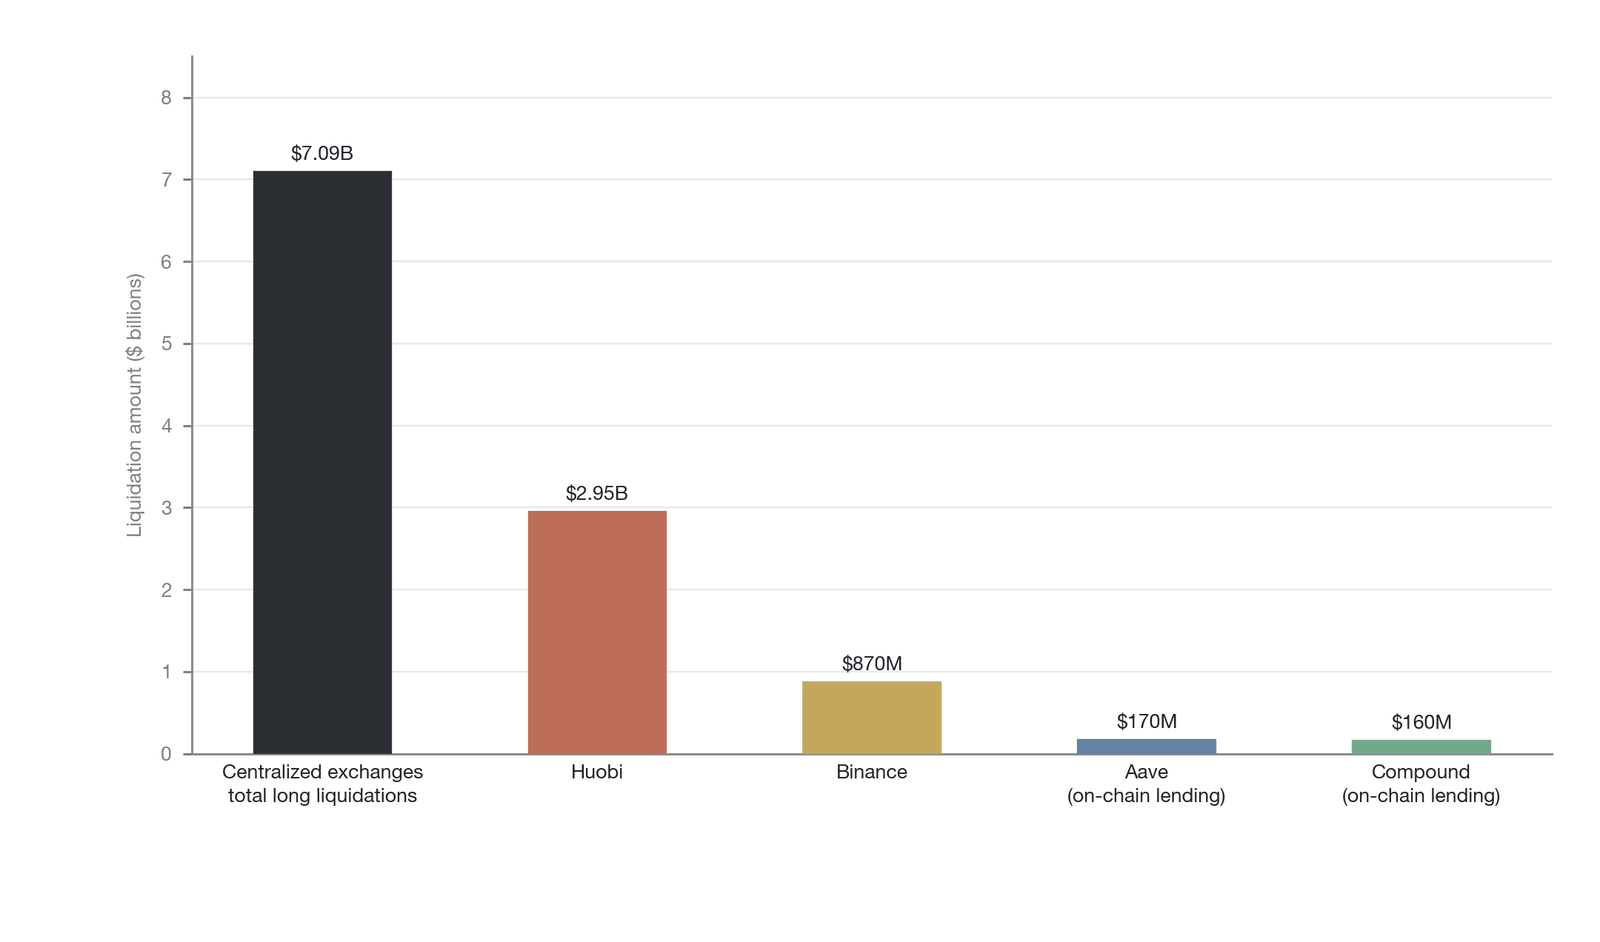
Figure 14-17. Comparison of liquidation amounts across platforms in the May 19, 2021 event
Note: The on-chain figures—approximately $170 million for Aave and approximately $160 million for Compound—are corroborated precisely by Gauntlet's liquidation retrospective; the centralized-exchange breakdown consists of third-party reconstructed values, including approximately $2.95 billion for Huobi and approximately $870 million for Binance, whereas Binance officially disclosed only approximately $24 million that day—a figure widely suspected of severe underreporting and therefore disputed.
This crash was not merely a violent price adjustment but a comprehensive stress test of the entire crypto financial infrastructure. From the matching engines of centralized exchanges to the price transmission of on-chain oracles, every link exposed design weaknesses under extreme load.
14.8.2 Mapping failure points across the layers
In the May 19 event, the transmission chain of the price benchmark showed clear failures at multiple layers, and these failures amplified market panic and intensified the liquidation cascade. At the source layer, extreme trading volume caused several mainstream centralized exchanges to experience outages or service degradation. Coinbase experienced serious connectivity issues from 5:50 a.m. to 7:38 a.m. Pacific Time, with its web servers largely unavailable because the Nginx routing connection count hit its ceiling, the error rate of the mobile-side GraphQL service climbing at one point to 10%, and the Coinbase Pro API partly paralyzed [48]. Binance likewise suffered serious technical failures, at one point suspending retail trading functions and halting the provision of some trading data [49]. Baumgartner and Güttler's study found that during the outage Binance's Bitcoin futures price diverged from those of other exchanges, with the spread widening to about seven times (relative to a 10-day reference period before the crash) [49]. These infrastructure failures caused the market to lose key price-discovery venues and the available price sources to plummet, directly damaging the quality of the price index's data inputs.
At the index layer, the absence and delay of price sources forced the index-construction algorithm into degradation mode. When some exchanges' price data could not be obtained in time, the algorithm was forced to reallocate weights to the remaining, possibly poorly liquid, sources, causing the index's market representativeness to decline significantly. In some periods, some indices even had to use the last valid price as a substitute, effectively freezing the index update so that it no longer reflected the true market dynamics.
At the mark-price layer, the EMA smoothing algorithm produced a significant lag effect during the sustained one-directional fall. In the initial phase of the plunge, this lag actually provided a degree of protection, sparing some positions from erroneous liquidation caused by a momentary wick. However, when the mark price finally caught up to the true magnitude of the fall, the liquidations were not evenly distributed but erupted in a concentrated, pulse-like manner. Within a single time window, the liquidation volume far exceeded the market's liquidity-absorbing capacity, further intensifying the downward pressure on the price. This is precisely the classic manifestation of the mark price trap: in a one-sided move, the smoothing mechanism compresses liquidation pressure along the time dimension rather than eliminating it.
Figure 14-18 shows the price movements of Bitcoin and Ethereum on May 19 and the change in Ethereum network gas fees, presenting the synchronous relationship between the price plunge and network congestion.
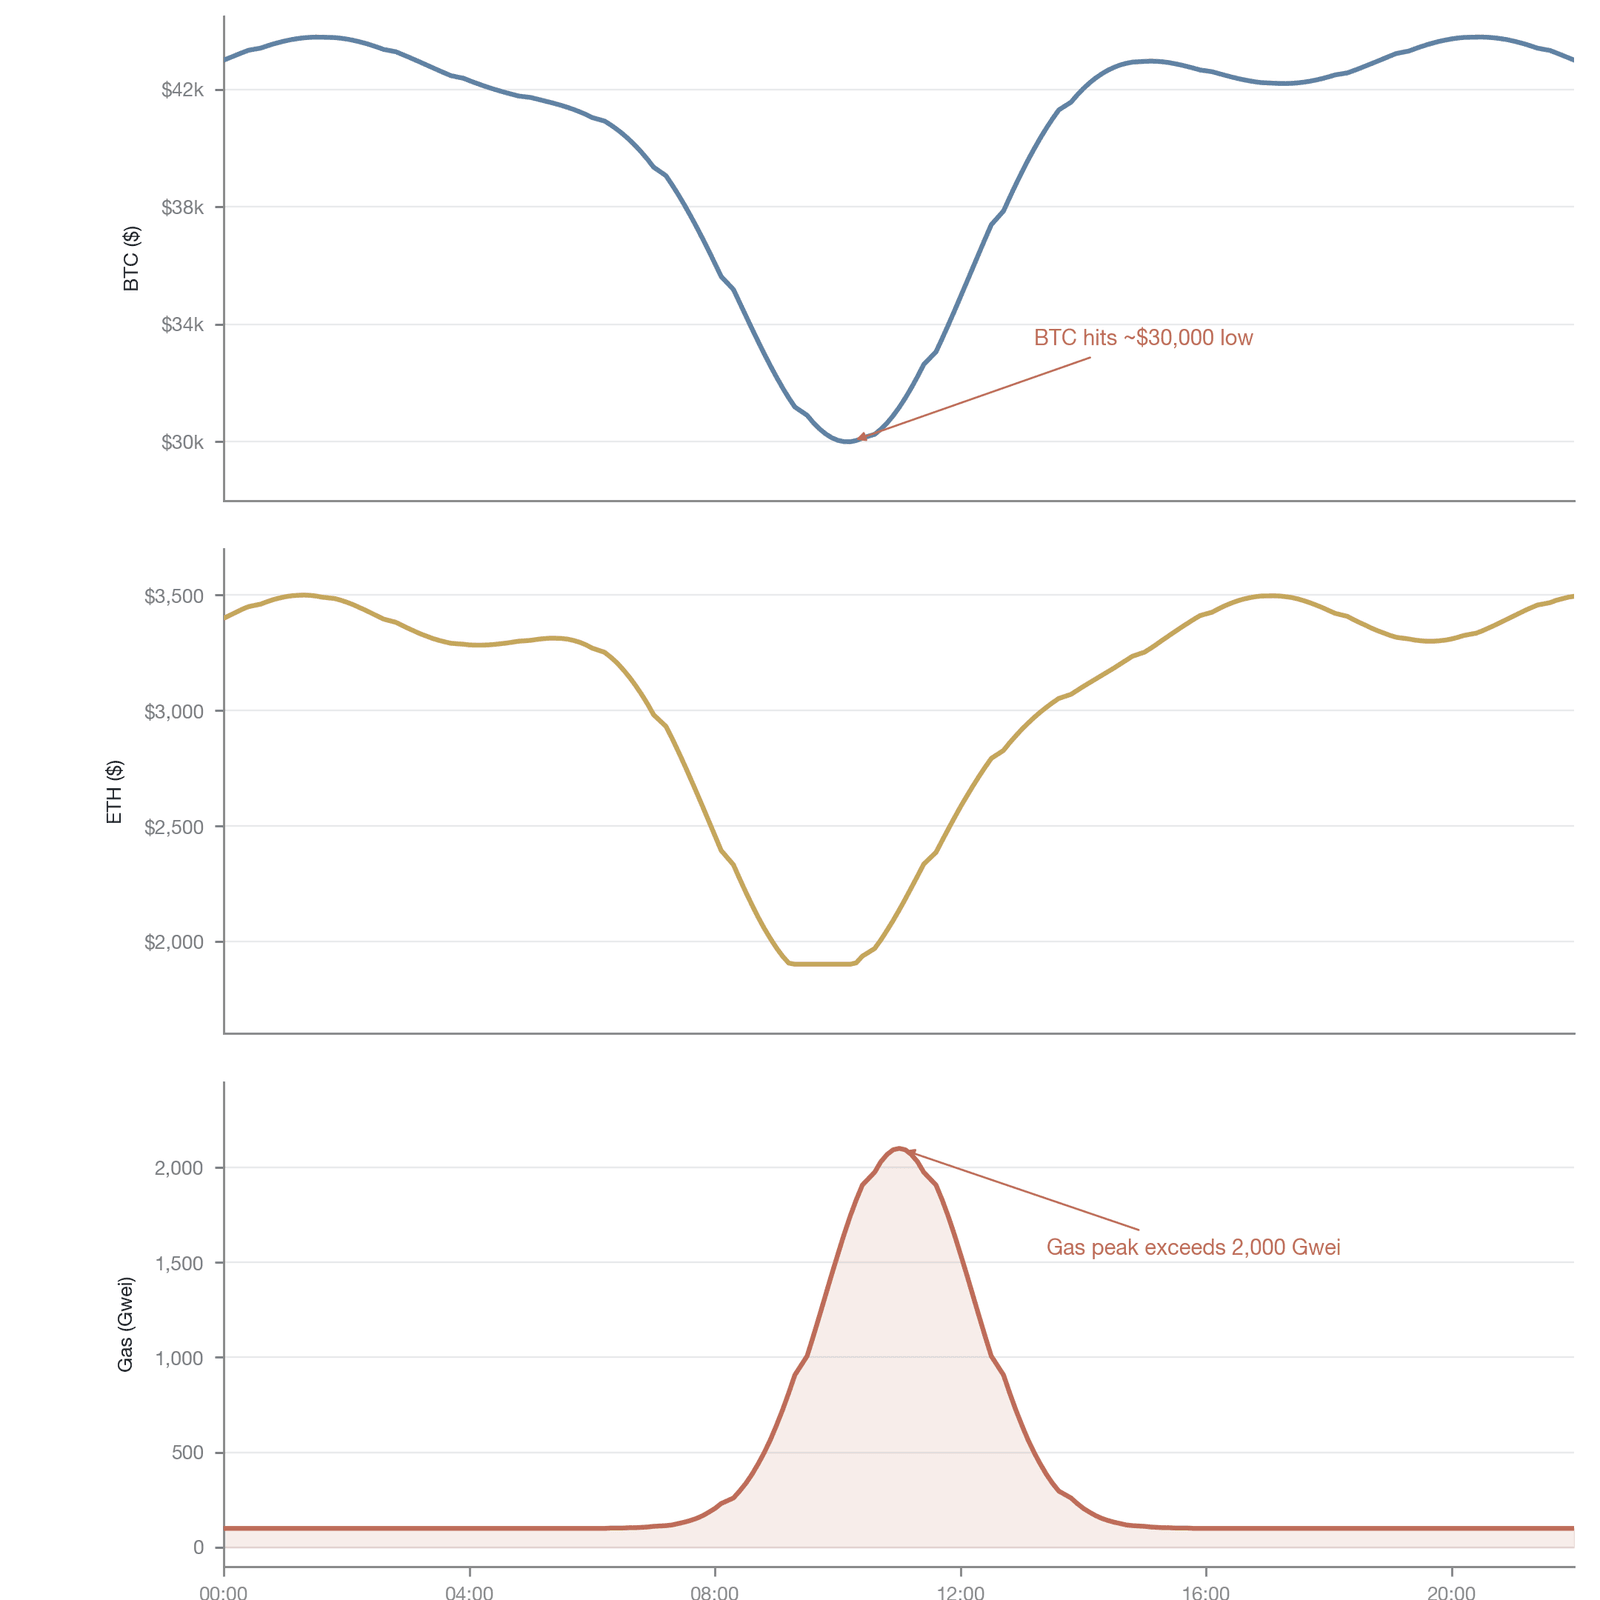
Figure 14-18. Bitcoin and Ethereum price movements and the change in Ethereum gas fees
Note: The Bitcoin and Ethereum price curves and the Ethereum gas-fee curve in the figure are illustrative reconstructions based on public records, not tick-by-tick measured series; the orders of magnitude—Bitcoin's intraday low of approximately $30,000, Ethereum declining from approximately $3,400, and gas briefly exceeding 1,000 Gwei that day—have been corroborated.
At the oracle layer, the extreme congestion of the Ethereum network became the critical bottleneck. Panicked investors, arbitrage bots, and liquidators competed to submit transactions, driving Ethereum's gas price at one point above 1,000 Gwei, with a peak exceeding 2,000 Gwei (the actual cost of complex transactions involving multiple contract calls was even higher), and some users reported that their transactions were still stuck after paying more than $1,000 in fees [50]. In such an extreme network environment, oracle nodes faced an economic constraint: submitting update transactions at a normal gas bid might leave them unpackaged for a long time, whereas frequent updates at a high gas bid would rapidly exhaust the operating budget. The price-update frequency of mainstream oracles such as Chainlink was therefore forced to decline, and on-chain prices lagged badly behind actual off-chain prices [51]. This lag not only prevented borrowers from adding margin in time but also exposed liquidators to enormous price-slippage risk when executing liquidations. At the same time, the high-gas environment entirely shut small and mid-sized traders out of on-chain operations: when the gas cost of a single swap ran to hundreds of dollars, a user holding a position worth a few thousand dollars effectively lost the ability to rescue themselves [50].
14.8.3 The simultaneous activation of the four paths
The fundamental reason the May 19 event evolved into a market-wide liquidation cascade is that the four transmission paths analyzed in this chapter were activated simultaneously under extreme conditions, forming a negative self-reinforcing loop.
Figure 14-19 shows the full-chain transmission path from external shock to liquidation cascade in the May 19 event, together with its feedback loop.
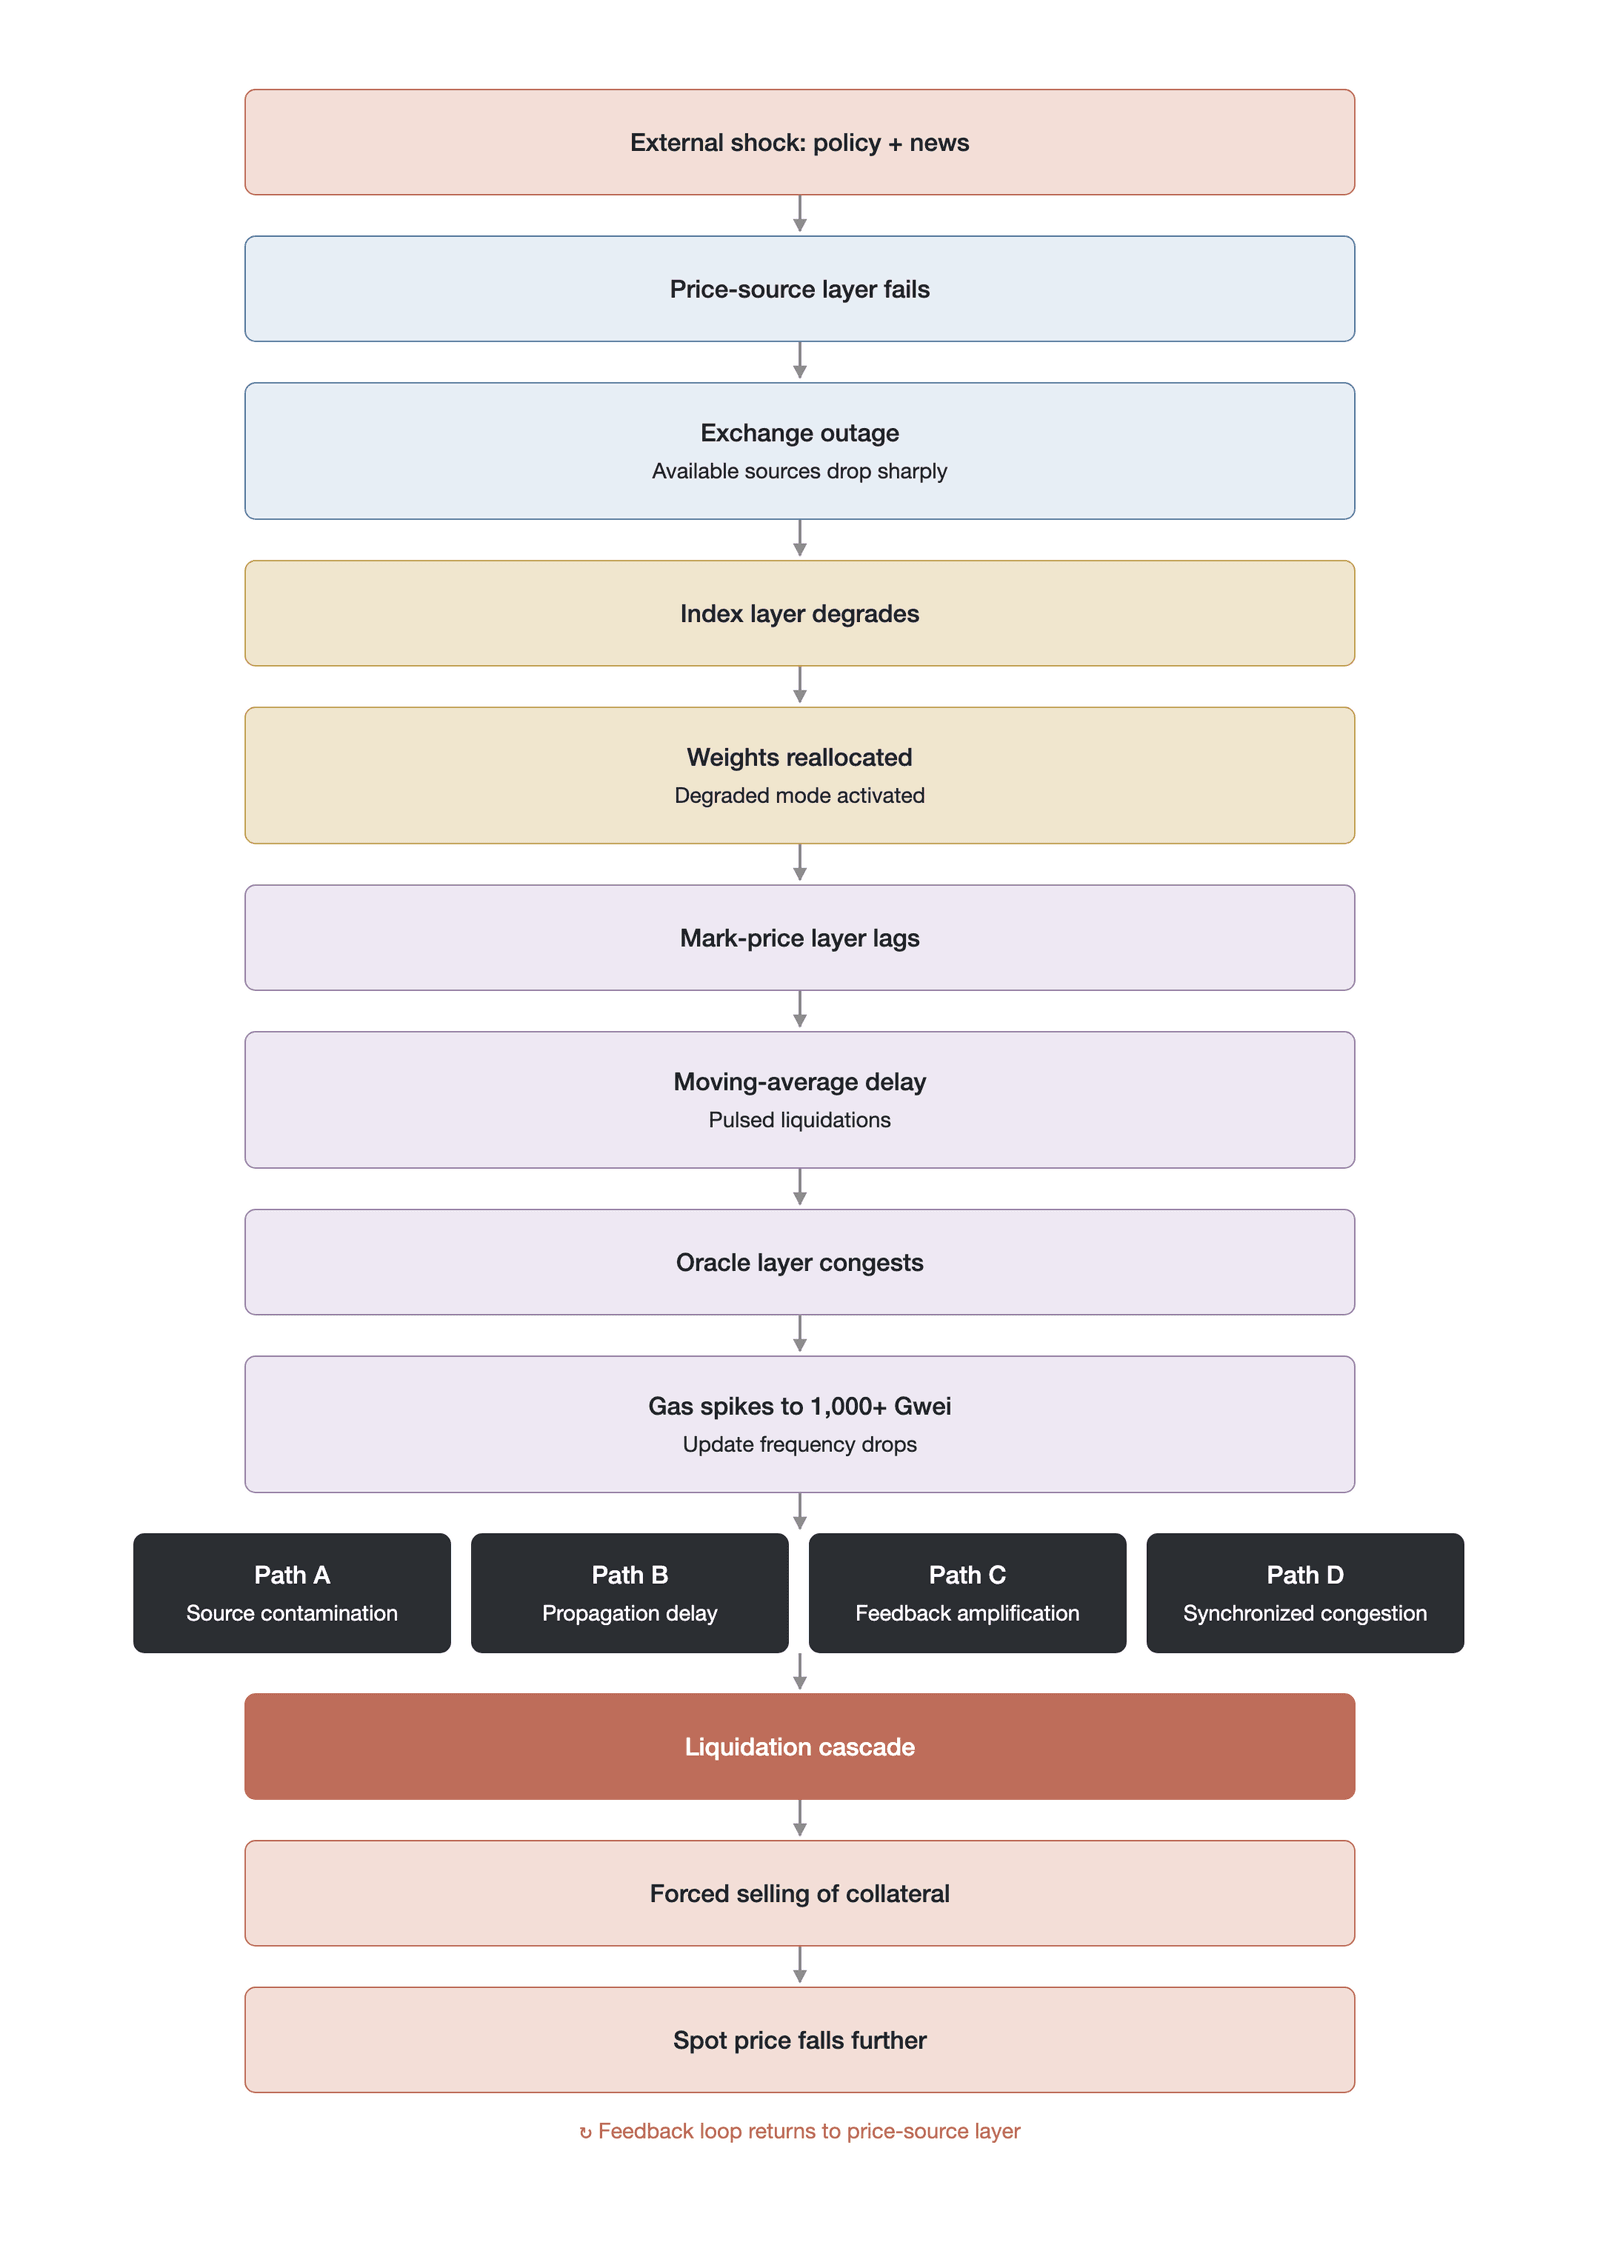
Figure 14-19. The full-chain transmission path and feedback loop of the May 19 event
At the source layer, when major exchanges such as Coinbase and Binance could not provide continuous trades and quotes because of extreme trading volume, the index-construction algorithm was forced to rely on the remaining, poorly liquid sources, giving extreme execution prices in a few markets a disproportionate weight and contaminating the overall index price. Under normal market conditions, the influence of these marginal sources could be diluted by the vast trading data of mainstream exchanges, but when the mainstream sources were absent at the same time, the index's manipulation resistance plummeted. At the same time, transmission latency struck at both the oracle layer and the mark-price layer: congestion on the Ethereum network delayed oracle quotes, while the mark price's smoothing algorithm added computational latency of its own, and this double latency decoupled the system states of DeFi protocols and derivatives exchanges from the real market, so that when the system finally executed liquidations based on the delayed price, it often forced positions closed at prices worse than the borrowers expected. At the liquidation-execution level, feedback amplification constituted the core driving force of the cascade: when high-leverage positions were liquidated, the liquidation engine forcibly dumped collateral assets on the market, further depressing the spot price, and the fall in the spot price in turn transmitted back through the index and the oracle to the protocols, triggering the next round of liquidations of slightly-lower-leverage positions. In the May 19 event, this cycle of fall–liquidation–dump–further fall played out synchronously across centralized exchanges and DeFi protocols. Gauntlet's post-event analysis showed that the asset classes with the highest liquidated value in the Aave protocol were precisely those already flagged as high systemic risk in its risk model, indicating that the activation of feedback amplification is predictable [47]. At the infrastructure level, the synchronized liquidation caused by multiple protocols sharing an oracle instantly exhausted Ethereum's computational resources; borrowers could not send transactions to repay debt or add margin, oracles could not update prices in time, and the entire on-chain financial system fell into synchronized paralysis. The surge in gas fees was essentially an implicit admission barrier that shut resource-limited participants out of self-rescue actions, intensifying the irreversibility of the liquidations.
Table 14-3 summarizes the specific manifestations of the four transmission paths in the May 19 event and their failure points at each layer.
| Transmission path | Failure layer | Specific manifestation | Consequence |
|---|---|---|---|
| Path A: Source contamination | Source layer, index layer | Exchange outages sharply reduced available sources; index weights tilted toward low-liquidity sources | Index representativeness declined; price deviations widened |
| Path B: Transmission latency | Oracle layer, mark-price layer | Surging gas fees delayed oracle updates, compounded by moving-average smoothing lag | On-chain prices decoupled from the real market; liquidation timing was misjudged |
| Path C: Feedback amplification | Entire chain | Liquidation selling depressed spot prices, triggering further liquidations | Cascade liquidations far exceeded the initial shock |
| Path D: Synchronized congestion | Oracle layer, infrastructure layer | Multiple protocols triggered liquidations simultaneously, congesting the entire Ethereum network | Small and mid-sized users lost the ability to self-rescue; liquidations became irreversible |
Table 14-3. The manifestations and consequences of the four transmission paths in the May 19 event (Data source: compiled by the author from public materials on the May 19 event)
Comparing the actual behavior of the May 19 event with the predictions of this chapter's theoretical framework allows us to test the framework's explanatory power and its limits. Based on the EMA recursive formula, Section 14.4.3 predicts that in a sustained one-sided fall the lag of the mark price will cause liquidation events to be released in a concentrated burst along the time dimension; in the May 19 event, the mark price did indeed lag the last traded price in the early phase of the plunge, and the subsequent pulse-like concentrated liquidations validated this prediction. Section 14.6.3's analysis of oracle synchronization risk predicts that multiple protocols sharing the same oracle feed would cause synchronized liquidation and network congestion under extreme conditions; the facts that gas fees surged above 1,000 Gwei and that multiple protocols triggered liquidations at the same time validated this prediction precisely. One dimension the chapter's framework failed to anticipate fully, however, is the synchronized failure of exchange infrastructure: the theoretical framework assumes that source failures are random and independent, but the simultaneous outages of major sources such as Coinbase and Binance in the May 19 event show that extreme trading volume itself constitutes a systemic common-cause failure, and this infrastructure-level correlation should be incorporated into future analytical frameworks. The overwhelming preponderance of long liquidations in the May 19 event calls for explanation. In the weeks before the crash, social-media amplification of the bull-market narrative and the overconfidence brought by successive all-time highs drove retail traders to go one-directionally long with extremely high leverage. This extreme directional concentration is itself a systemic-risk indicator that can be monitored in advance, but the market-governance framework of the time lacked an automated mechanism for dynamically adjusting margin or leverage limits based on such signals.
The simultaneous activation of the four paths reveals a key structural problem: the layers of a price benchmark do not operate independently but affect one another through complex coupling relationships. Under normal market conditions, this coupling is benign, and the multi-layer redundancy provides an extra margin of safety. But under extreme conditions, the coupling amplifies a local failure into a systemic collapse, and the defensive mechanisms of the layers not only fail to cover for one another but drag one another down because they come under pressure simultaneously.
14.8.4 Case comparison: systemic crash versus targeted attack
Comparing the May 19 event with the JELLY token attack of March 2025 analyzed in Section 14.7.5 reveals two entirely different modes of price-benchmark failure. The May 19 event is a systemic crash, its trigger an exogenous macro shock, with the four transmission paths activated simultaneously and spontaneously, absent any single attacker's subjective intent. The JELLY attack is targeted manipulation, in which the attacker, through a precise understanding of the mark price computation logic, actively and methodically exploited the vulnerabilities of the three layers. On the time scale, the liquidation cascade of the May 19 event lasted about 24 hours and involved hundreds of assets across the market; the JELLY attack was completed within about two hours and targeted only a single low-liquidity token. In terms of the mode of defensive failure, what the May 19 event exposed was insufficient infrastructure redundancy and the economic constraint on oracles in a high-gas environment, and the failure of the defenses was concurrent; what the JELLY attack exposed was the flaw in the mark price mechanism for low-liquidity assets, and the failure of the defenses was serial. This comparison shows that price-benchmark governance must not only cope with systemic tail risk but also guard against precise attacks that target specific parameter vulnerabilities—and the defensive strategies the two kinds of threat require differ fundamentally.
14.8.5 Post-event improvements and governance reflection
The May 19 event exposed the fragility of early crypto financial infrastructure but also spurred profound reflection and improvement across the industry in price-benchmark governance and system design. At the exchange level, centralized platforms substantially strengthened their systems' stress resilience and the redundancy of their price benchmarks. In its post-event analysis, Coinbase acknowledged that its auto-scaling rules had failed to adapt to the burst-traffic patterns unique to crypto markets and pledged to optimize its load-testing scheme specifically to simulate genuine extreme scenarios [48]. Several exchanges increased the number of price sources for their price indices, lowered the weight cap of any single source, and introduced liquidation cooling-off-period mechanisms during extreme volatility. Some platforms also optimized the moving-average parameters of their mark prices so that, while retaining the smoothing effect, they could respond more quickly to sustained one-sided moves.
At the oracle level, the industry accelerated its evolution toward more efficient architectures. Chainlink had already deployed its off-chain reporting protocol to mainnet in early 2021; by aggregating node signatures off-chain and submitting only a single transaction on-chain, this protocol reduced the gas cost of oracle updates by nearly 90% [52]. The May 19 event further validated the necessity of this upgrade and spurred continued optimization in subsequent versions. At the same time, a new generation of pull-based oracles such as Pyth Network began to gain adoption; their design philosophy shifted from the traditional push model to an on-demand pull model, allowing decentralized applications to actively fetch the latest price data when needed, thereby avoiding the update-latency problem of the push model during network congestion [53].
At the DeFi protocol level, mainstream lending platforms such as Aave and Compound introduced finer-grained risk-management mechanisms in their subsequent versions. A multi-oracle aggregation strategy became an industry standard: protocols no longer rely on a single oracle as their price source but simultaneously connect to multiple independent oracle networks, taking the median or weighted average as the reference price to reduce the risk of a single point of failure. Progressive liquidation mechanisms were also widely adopted, splitting a large liquidation into multiple small batches for execution to reduce the instantaneous impact on the spot market [47].
Viewed from a governance perspective, the core lesson of the May 19 event is that seemingly purely technical parameters—such as the length of the moving-average window, the update frequency of the oracle, and the degradation strategy of the index—directly determined the liquidation fate of billions of dollars under extreme conditions. The post-event improvements were not only technical optimizations but also an enhancement of governance transparency. A growing number of exchanges and protocols began to publish their index-construction methodologies and parameter-change logs, transforming the design of price benchmarks from a closed technical decision into an auditable governance action.
The far-reaching impact of the May 19 event was reflected not only in improvements to technical architecture but also, more directly, in an acceleration of regulatory action. In September 2021, the People's Bank of China (PBOC) and ten departments jointly issued a notice characterizing all virtual-currency-related business activities as illegal financial activities, and over the same period a complete phase-out of cryptocurrency mining was implemented. At the broader global level, the event was cited by regulators in several jurisdictions as evidence of systemic risk in crypto markets, spurring the accelerated formation over subsequent years of regulatory frameworks targeting crypto-asset service providers. This trajectory shows that the ultimate binding force on price-benchmark governance may come not from the self-improvement of technical design but from external regulatory intervention triggered by systemic events.
14.9 Chapter summary
Having explored the construction, transmission, failure, and governance of price benchmarks, we must examine the essential nature of this infrastructure from a higher vantage point. In the context of crypto finance, a price benchmark is not merely a stream of objective data; it substantively wields broad financial power through technical and algorithmic means: defining what a fair price is, deciding who gets liquidated, shaping the distribution of liquidity, and setting the difficulty threshold for manipulation.
To constrain this implicit financial power and ensure the objectivity, fairness, and robustness of price benchmarks, traditional finance has accumulated rich experience. IOSCO's Principles for Financial Benchmarks, issued in 2013 after the LIBOR manipulation scandal, provided a systematic framework for the governance of global financial benchmarks [16]. Combining the characteristics of crypto markets with the analysis in this chapter, we can distill six core design principles for price-benchmark governance. Compilation independence requires that the benchmark's administrator be independent, in organizational structure and interests, from data providers and benchmark users, and that strict conflict-of-interest firewalls be established. As analyzed in Section 14.2, a crypto exchange simultaneously plays the three-in-one roles of index compiler, mark price setter, and liquidation executor, and its conflicts of interest exceed even those of the bank-quote system of the LIBOR era; breaking this structure is the core institutional need of crypto-market price-benchmark governance. Methodological transparency requires that the index's construction rules, weight-allocation logic, outlier-exclusion criteria, and degradation trigger conditions be fully public and subject to community and market scrutiny; parameter changes should come with advance notice and a complete change log, so that market participants can assess the potential impact of rule changes on their own positions. The principle of redundancy over optimization emphasizes that, while pursuing update frequency and precision, one must ensure multiple redundancy of price sources, computation nodes, and transmission channels; but the effectiveness of redundancy is premised on the independence of the components: if multiple price sources share the same underlying infrastructure (such as the same cloud provider or the same data-aggregation interface), they may fail simultaneously in a systemic event—that is, common-mode failure. The simultaneous outages of Coinbase and Binance in the May 19 event are a classic case of common-mode failure (see Section 14.8.2), showing that the value of redundancy depends on the diversity of components' failure modes, not merely on their number. Degradation over collapse requires that when some components fail, the system be able to transition smoothly to a preset degraded mode (such as lowering the update frequency or widening the spread tolerance) rather than simply stopping service or outputting erroneous data; this principle corresponds directly to the stress-degradation mechanism analyzed in Section 14.3.6, and degradation paths should be predefined and regularly validated through stress testing. Feedback awareness requires the benchmark's designers to fully understand the endogenous feedback loops between the price benchmark and the underlying market. As analyzed in Section 14.6, the moving-average parameters of the mark price affect the intensity of the liquidation cascade through a reflexivity equation, and this influence must be explicitly incorporated into design considerations—the liquidation spiral is not an unforeseeable black swan but an inevitable result of a specific parameter combination. Governance evolvability acknowledges that as market structure and underlying technology change, the methodology of a price benchmark cannot remain fixed; regular parameter reviews, community-participatory modification mechanisms, and forward-looking assessment of emerging risks together constitute the institutional foundation of governance evolution.
A price benchmark is regarded as a form of financial power because it directly defines the fair price in the eyes of a smart contract. This price determines whether a borrower is liquidated, sets the funding rate a derivatives trader bears, and shapes the liquidity distribution of cross-market arbitrageurs. Throughout this process, the benchmark's administrator constantly faces a series of difficult trade-offs.
Table 14-4 summarizes the trade-off spectrum of the six core dimensions of price-benchmark governance.
| Governance dimension | Conservative end | Aggressive end | Core tension |
|---|---|---|---|
| Degree of smoothing | Long-window moving average, high robustness | Short window or no smoothing, high timeliness | Positioning within the mark price trilemma |
| Number of price sources | Minimal set, low complexity | Maximal set, high redundancy | Trade-off between operational cost and manipulation resistance |
| Degradation threshold | Low threshold, conservative suspension | High threshold, maximal continuity | Tension between user protection and market continuity |
| Liquidation speed | Immediate liquidation, protocol safety first | Delayed liquidation, user protection first | Allocation between protocol interests and user interests |
| Degree of transparency | Fully public, auditable | Partially confidential, gaming-resistant | Balance between trust-building and security defense |
| Oracle model | Push-based, always available | Pull-based, on-demand low latency | Trade-off between gas cost and timeliness |
Table 14-4. The six-dimensional trade-off spectrum of price-benchmark governance (Data source: constructed by the author)
These trade-offs have no absolutely correct answer; they are essentially a redistribution of different types of risk. When a protocol chooses a longer-window smoothing algorithm, it is in effect transferring the risk of short-term price volatility from borrowers to liquidity providers and the insurance fund: borrowers gain more time to add margin, but the protocol faces greater bankruptcy risk in an extreme one-sided move. When an oracle sets a specific deviation threshold, it is making a trade-off between guarding against minor manipulation and saving on network fees: a higher threshold lowers the update frequency and gas consumption but also widens the potential window of deviation between the on-chain price and the real market.
The core insights of this chapter can be condensed into four propositions. Price benchmarks equal implicit governance: designing a price benchmark is not a neutral technical activity but an exercise of power that defines price reality, and the lesson of LIBOR is replaying itself in a new form. The mark price trilemma shows that accuracy, robustness, and timeliness can be optimized only two at a time, and the choice of the moving-average window is not merely a technical parameter but also determines who is protected and who is sacrificed. Oracles constitute a cross-layer information bottleneck: the entire price reality of on-chain finance is obtained through the single conduit of the oracle, and the information compression along the three dimensions of time, precision, and source is irreversible. Attack-surface analysis reveals that the index, mark price, and oracle each have a quantifiable attack surface, the most dangerous being a multi-layer composite attack, and defending each layer carries a clear cost within the trilemma. The existence of flash loans fundamentally challenges the basic assumption of traditional market-microstructure theory that capital constraints serve as a deterrent to manipulation. In traditional finance, the cost of price manipulation under the Kyle (1985) [54] framework is proportional to the amount of capital an attacker must deploy, and this capital requirement constitutes a natural defensive barrier. Flash loans, however, allow an attacker to mobilize hundreds of millions of dollars of liquidity without collateral within a single transaction, effectively removing the capital constraint from the manipulation-cost function. This means that in the cost-benefit framework of manipulation analyzed in Section 14.5.8, the traditional cost term of attack capital times slippage must be redefined: in an on-chain environment that supports flash loans, the true constraint on manipulation is no longer the scale of capital but the depth of the target liquidity pool and the length of the oracle's time window.
Despite multiple rounds of iteration, price-benchmark governance in crypto financial markets still faces many unresolved challenges, and as the industry develops, some new technologies and paradigms are reshaping the boundaries of this field. The dilemma of decentralized benchmark construction is the most fundamental among them. Although the transmission layer of oracles has achieved a high degree of decentralization, the construction rules of the benchmark index are often still controlled by a small number of core teams or stakeholders. Can a cross-protocol, DAO-governed unified price benchmark be established? How can compilation independence be achieved in a decentralized environment? The answers to these questions will directly affect the institutional maturity of crypto financial markets. The timing and manner of regulatory intervention likewise remain undecided: is it necessary to establish a crypto version of a regulatory framework akin to IOSCO's Principles for Financial Benchmarks? Chapter 26 discusses this topic in depth.
At the technological frontier, the application of zero-knowledge proofs in the oracle domain shows enormous potential [55]. By computing the price index off-chain and generating a zero-knowledge proof, an oracle can move complex computation logic off the main chain without sacrificing security, greatly lowering verification costs while guaranteeing the credibility of the computed result. The maturation of artificial intelligence and machine learning also offers new possibilities for the outlier detection and dynamic weight allocation of price benchmarks, but whether adaptive parameters will introduce new opacity still warrants careful evaluation; Chapter 31 explores this. In an era of coexisting multiple chains, how to build a secure, low-latency cross-chain price benchmark to support the integration of omnichain liquidity is another pressing engineering challenge; Chapters 28 to 30 develop the design from an engineering perspective.
Chapter 15 will use empirical data to test the theoretical framework established in this chapter and in Chapter 13, measuring the informational efficiency of crypto markets. Is the price-discovery leadership of perpetual futures empirically supported? How large is the magnitude of mechanical noise? How does efficiency vary across different market states? The price-manipulation attack surfaces analyzed in this chapter will be tested in Chapter 15 for whether they are detectable in the market through data.
References
[1] Ali, Z. (2025). Anatomy of the Oct 10-11, 2025 crypto liquidation cascade: Macroeconomic triggers, market microstructure, and systemic risk lessons. SSRN. https://papers.ssrn.com/sol3/papers.cfm?abstract_id=5611392 https://doi.org/10.2139/ssrn.5611392
[2] HM Treasury. (2012). The Wheatley Review of LIBOR: Final Report.
[3] Solidus Labs. (2022). The Mango Markets Exploit: An Order Book Analysis.
[4] Deribit Insights. (2021). The (Flash) Crash of May 19, 2021. https://insights.deribit.com/exchange-updates/the-flash-crash-of-may-19-2021/
[5] Harris, L. (2003). Trading and Exchanges: Market Microstructure for Practitioners. Oxford University Press.
[6] Chainalysis. (2023). Oracle Manipulation Attacks Rising: A Unique Concern for DeFi.
[7] Hyperliquid. (2025). Robust price indices. Hyperliquid GitBook. https://hyperliquid.gitbook.io/hyperliquid-docs/trading/robust-price-indices
[8] Binance. (2025). What Are Mark Price and Price Index in USDⓈ-Margined Futures. Binance Support.
[9] Alexander, C., Choi, D. F., Massie, H., & Sohn, J. (2020). Price discovery in Bitcoin: The impact of unregulated markets. Journal of Financial Stability, 50, 100776. https://doi.org/10.2139/ssrn.3583843
[10] BitMEX. (2025). Fair price marking. https://www.bitmex.com/app/fairPriceMarking
[11] Bybit. (2026). Upcoming Improvement to Index Price Calculation. Bybit Announcements.
[12] Shearer, M., Rauterberg, G. V., & Wellman, M. P. (2023). Learning to manipulate a financial benchmark. In Proceedings of the Fourth ACM International Conference on AI in Finance (ICAIF '23). Association for Computing Machinery. https://doi.org/10.1145/3604237.3626847
[13] Williamson, O. E. (1985). The Economic Institutions of Capitalism: Firms, Markets, Relational Contracting. Free Press.
[14] North, D. C. (1990). Institutions, Institutional Change and Economic Performance. Cambridge University Press. https://doi.org/10.1017/cbo9780511808678
[15] Duffie, D., & Stein, J. C. (2015). Reforming LIBOR and other financial market benchmarks. Journal of Economic Perspectives, 29(2), 191-212. https://doi.org/10.1257/jep.29.2.191
[16] International Organization of Securities Commissions (IOSCO). (2013). Principles for Financial Benchmarks: Final Report.
[17] Bitwise Asset Management. (2019). Presentation to the U.S. Securities and Exchange Commission: Fake Volume on Cryptocurrency Exchanges.
[18] European Union. (2023). Regulation (EU) 2023/1114 on Markets in Crypto-Assets (MiCA), Article 72 (Conflicts of interest of crypto-asset service providers).
[19] International Organization of Securities Commissions (IOSCO). (2023). Policy Recommendations for Crypto and Digital Asset Markets: Final Report (IOSCOPD747).
[20] CoinDesk Indices. (2023). CoinDesk Indices Update on Binance.US.
[21] United States District Court, Southern District of New York. (2025). United States v. Avraham Eisenberg, No. 1:23-cr-00010: Opinion and Order (granting Rule 29 motion for judgment of acquittal, May 23, 2025).
[22] OKX. (2026). Index components weightage adjustment FAQ. OKX Help Center.
[23] Makarov, I., & Schoar, A. (2020). Trading and arbitrage in cryptocurrency markets. Journal of Financial Economics, 135(2), 293-319. https://doi.org/10.1016/j.jfineco.2019.07.001
[24] Binance. (2025). Binance futures will update the mark price calculation for all USDⓈ-M and COIN-M perpetual contracts. https://www.binance.com/en/support/announcement/detail/20c5bfbd9e084b6982c768516c316514
[25] OKX. (2025). Mark price calculation. https://www.okx.com/help/mark-price
[26] dYdX. (2025). dYdX v4 documentation: Oracles. https://docs.dydx.exchange/
[27] Brave New Coin. (2019). The Bitstamp flash crash: Why robust indices matter. Brave New Coin. https://bravenewcoin.com/insights/the-bitstamp-flash-crash-why-robust-indices-matter
[28] CoinDesk. (2025). HyperLiquid delists JELLY after vault squeezed in \$13M tussle. CoinDesk. https://www.coindesk.com/markets/2025/03/26/hyperliquid-delists-jellyjelly-after-vault-squeezed-in-usd13m-tussle
[29] Messari. (2025). Chainlink: A Full-Stack Institutional Platform.
[30] Immunefi. (2025). The Ecosystem Vulnerability Scoreboard: Six Years of DeFi Loss Data. Immunefi Research.
[31] Cong, L. W., Fox, L., Li, S., & Zhou, L. (2025). A primer on oracle economics. Journal of Corporate Finance. https://doi.org/10.2139/ssrn.5208421
[32] Chainlink Labs. (2021). Chainlink 2.0: Next Steps in the Evolution of Decentralized Oracle Networks.
[33] Pyth Network. (2022). Pull, Don't Push: A New Price Oracle Architecture.
[34] dYdX Foundation. (2023). dYdX v4 Architecture Overview.
[35] Rekt News. (2020). Harvest Finance – Rekt. https://rekt.news/harvest-finance-rekt/
[36] Humphry, R., Avramovic, P., Acevedo, F., & Alkhair, S. (2024). Review of maximal extractable value & blockchain oracles. Financial Conduct Authority.
[37] Benligiray, B., & Vänttinen, H. (2022). Oracle extractable value (OEV) through order flow auctions [Litepaper]. API3. https://github.com/api3dao/oev-litepaper
[38] Aspembitova, A. T., & Bentley, M. A. (2023). Oracles in decentralized finance: Attack costs, profits, and mitigation measures. Entropy, 25(1), Article 60. https://doi.org/10.3390/e25010060
[39] Brunnermeier, M. K., & Pedersen, L. H. (2009). Market Liquidity and Funding Liquidity. The Review of Financial Studies, 22(6), 2201-2238.
[40] Gromb, D., & Vayanos, D. (2002). Equilibrium and welfare in markets with financially constrained arbitrageurs. Journal of Financial Economics, 66(2-3), 361-407. https://doi.org/10.1016/S0304-405X(02)00228-3
[41] FTI Consulting. (2025). Crypto Crash Oct 2025: Leverage Meets Liquidity. https://www.fticonsulting.com/insights/articles/crypto-crash-october-2025-leverage-met-liquidity
[42] Kaiko Research. (2025). Crypto's Pricing Problem Laid Bare. https://research.kaiko.com/insights/cryptos-pricing-problem-laid-bare
[43] Eskandari, S., Moosavi, S. M., & Clark, J. (2021). SoK: Oracles from the ground truth to market manipulation. In Proceedings of the 3rd ACM Conference on Advances in Financial Technologies (AFT '21). https://doi.org/10.1145/3479722.3480994
[44] CoinDesk. (2026). DeFi lending platform Aave sees a rare \$27 million liquidations after a price glitch. https://www.coindesk.com/business/2026/03/10/defi-lending-platform-aave-sees-a-rare-usd27-million-liquidations-after-a-price-glitch
[45] Chainalysis. (2021). The May 2021 cryptocurrency crash explained: Selling by new investors. https://www.chainalysis.com/blog/cryptocurrency-price-crash-may-2021/
[46] CNBC. (2021, May 19). The crypto collapse: Here's what's behind bitcoin's sudden drop. https://www.cnbc.com/2021/05/19/the-crypto-collapse-heres-whats-behind-bitcoins-sudden-drop.html
[47] Gauntlet. (2021). Aave protocol liquidation retrospective: May 2021. https://www.gauntlet.xyz/resources/aave-protocol-liquidation-retrospective-may-2021
[48] Coinbase. (2021). Incident post mortem: May 19, 2021. https://www.coinbase.com/blog/incident-post-mortem-may-19-2021
[49] Baumgartner, T., & Güttler, A. (2022). Bitcoin flash crash on May 19, 2021: What did really happen on Binance? (IWH Discussion Papers No. 25/2022). Halle Institute for Economic Research. https://www.econstor.eu/handle/10419/266345
[50] Glassnode. (2021). DeFi uncovered: Navigating the crash. https://insights.glassnode.com/defi-uncovered-exploring-the-crash/
[51] Pandey, A. (2025). The oracle problem in DeFi: Chainlink and price feed architecture. Medium. https://medium.com/@arunpandeycdac/the-oracle-problem-in-defi-chainlink-and-price-feed-architecture-29cf1dd31342
[52] Chainlink. (2021). The year in Chainlink 2021: 7 pillars of momentum. https://blog.chain.link/the-year-in-chainlink-2021/
[53] Pyth Network. (2024). Pyth pull oracle launches on Solana. https://www.pyth.network/blog/pyth-network-pull-oracle-on-solana
[54] Kyle, A. S. (1985). Continuous auctions and insider trading. Econometrica, 53(6), 1315-1335. https://doi.org/10.2307/1913210
[55] Gu, B., & Nawab, F. (2023). zk-Oracle: Trusted off-chain compute and storage for decentralized applications. In Proceedings of the 2023 IEEE International Conference on Blockchain and Cryptocurrency (ICBC). IEEE. https://doi.org/10.1109/ICBC56567.2023.10174864