On October 10, 2025, the cryptocurrency market experienced an unprecedented mass liquidation event. Within just 24 hours, visible liquidation notional exceeded $19 billion (roughly $19.1–19.4 billion on CoinGlass's basis; because some platforms' liquidation feeds are rate-limited to a single record per second, this visible liquidation notional is likely systematically underestimated, and CoinGlass estimates that the true scale of deleveraging may have reached $30–40 billion), affecting roughly 1.62 million traders and erasing about $350 billion in total cryptocurrency market capitalization. This catastrophe, later dubbed the "10/10" event, laid bare for every market participant a problem long buried in the mechanics of perpetual futures: when a chain of forced liquidations finally breaks through a trader's margin floor and drives account equity below zero (a shortfall), who ultimately bears that loss, and how?
In the previous chapter, we analyzed in detail how risk evolves from the failure of an individual trader—through the chain reaction of a liquidation cascade—into systemic risk that sweeps across the entire market. If the previous chapter answered the question of how risk spreads, this chapter takes up that logic to examine a more fundamental proposition: how the system absorbs and allocates that risk. The deficit created by a shortfall does not vanish on its own; it must be filled. If such a deficit is allowed to widen, profitable traders can no longer be certain that their gains will be honored in full, and the market's foundation—the credible management of counterparty risk—loses its essential function. In a market where counterparty credit cannot be guaranteed, market makers will refuse to provide liquidity, institutional investors will exit, and the market as a whole will ultimately shrink amid a collapse of trust.
How losses are borne is, at bottom, a question of risk socialization. Because a shortfall loss cannot be covered by the defaulter, it must be transferred to other participants in the system. In crypto derivatives markets, risk socialization proceeds along two distinct paths: ex ante pooling (establishing an insurance fund) and ex post allocation (auto-deleveraging or socialized loss). The two are not opposing alternatives but tightly linked levels of a single risk-socialization mechanism, together forming a tiered risk-resolution system (its penalty sources, buffer-pool mechanics, and allocation mechanisms are elaborated in Section 12.1.2).
Within this system, an insurance fund is far more than a simple pool of capital; it is an institutional arrangement charged with the tensions of political economy. Where does the money come from? Is the fund large enough? Who has the authority to decide when it is used? Are the rules for its use transparent? And does the very existence of an insurance fund create new moral hazard? This chapter argues that the insurance fund is the node where technical design and political governance intersect most deeply in the perpetual-futures system. Its technical dimension—size, adequacy ratio, and trigger rules—can be optimized with actuarial models; but its governance dimension—who controls the fund, who decides on its use, whether information is disclosed, and whether users are told the true risks—involves deeper questions of power, trust, and the distribution of interests. These questions cannot be solved by code alone; they can only be constrained by sound institutions. At the same time, the insurance fund and the auto-deleveraging mechanism together constitute a dual institutional arrangement for risk socialization, and this combination of ex ante pooling and ex post allocation ultimately determines the settlement credibility and rule predictability of the perpetual-futures market. The chapter pursues three questions in turn: What is the dual mechanism of risk socialization, and how does it guarantee settlement credibility? Why must this system inevitably involve political economy, and how are its design parameters determined amid the interplay of competing interests? And how can we build a systematic analytical framework to evaluate the risk-mutualization mechanisms of different platforms?
12.1 The inevitability of shortfalls
Before examining how risk is socialized, we must first grasp a core fact: forced liquidation is by no means risk-free liquidation. In theory, a liquidation engine always seems able to close a position precisely before the price reaches the bankruptcy line, containing the loss perfectly within the trader's margin. In reality, however, a vast gulf—created by multiple sources of friction—separates the idealized liquidation model from the chaos of actual markets. It is precisely these frictions that make shortfalls structurally inevitable, and the existence of shortfalls is the fundamental reason the entire risk-socialization mechanism and all of its institutional arrangements come into being. Understanding these frictions is the logical starting point for understanding why insurance funds must exist.
12.1.1 Four frictions in the liquidation process
When markets enter a state of extreme volatility, the liquidation mechanism tends to encounter four core frictions. These frictions do not stem from design flaws in the liquidation engine itself; they are rooted in the intrinsic limitations of market microstructure and infrastructure. They are the direct drivers of shortfalls and a key entry point for understanding why insurance funds are necessary.
The most direct friction arises from insufficient order-book depth. When a large-scale liquidation occurs, enormous market-order closeouts instantly exhaust the liquidity resting on the order book. Market makers, as the suppliers of market liquidity, build their core business model on spread income rather than on bearing directional risk. When the market moves violently in one direction, market makers—seeking to avoid excessive directional exposure of their own—often widen their bid-ask spreads sharply or withdraw their quotes altogether. This sudden evaporation of liquidity forces liquidation orders to fill at markedly unfavorable prices, and the final execution price is often far worse than the trader's bankruptcy price. This phenomenon was especially pronounced during the 2025 "10/10" event. According to data from the research firm Amberdata, during a mere 40-minute phase of violent cascading (20:50 to 21:30 UTC), positions totaling $6.93 billion were liquidated, and the liquidation rate surged to $10.39 billion per hour—about 866 times the $12 million per hour of the normal period in the eight hours before the event [1]. Under such concentrated selling pressure, the top-of-book depth for Bitcoin shrank by more than 90%, and the bid-ask spread jumped from a normal single-digit number of basis points to double-digit percentages [2]. In such an extreme liquidity vacuum, the liquidation engine simply could not complete closeouts without triggering shortfalls. Figure 12-1 places the 10/10 event in a longitudinal comparison with major liquidation events in the history of crypto derivatives; it shows that the liquidation scale of October 10, 2025 (about $19.37 billion on CoinGlass's basis, exceeding $19 billion) was nearly double the previous record (about $10 billion on April 18, 2021) and almost 20 times that of the 2020 "Black Thursday," reflecting a trend in which liquidation scale accelerates as the market becomes more leveraged.
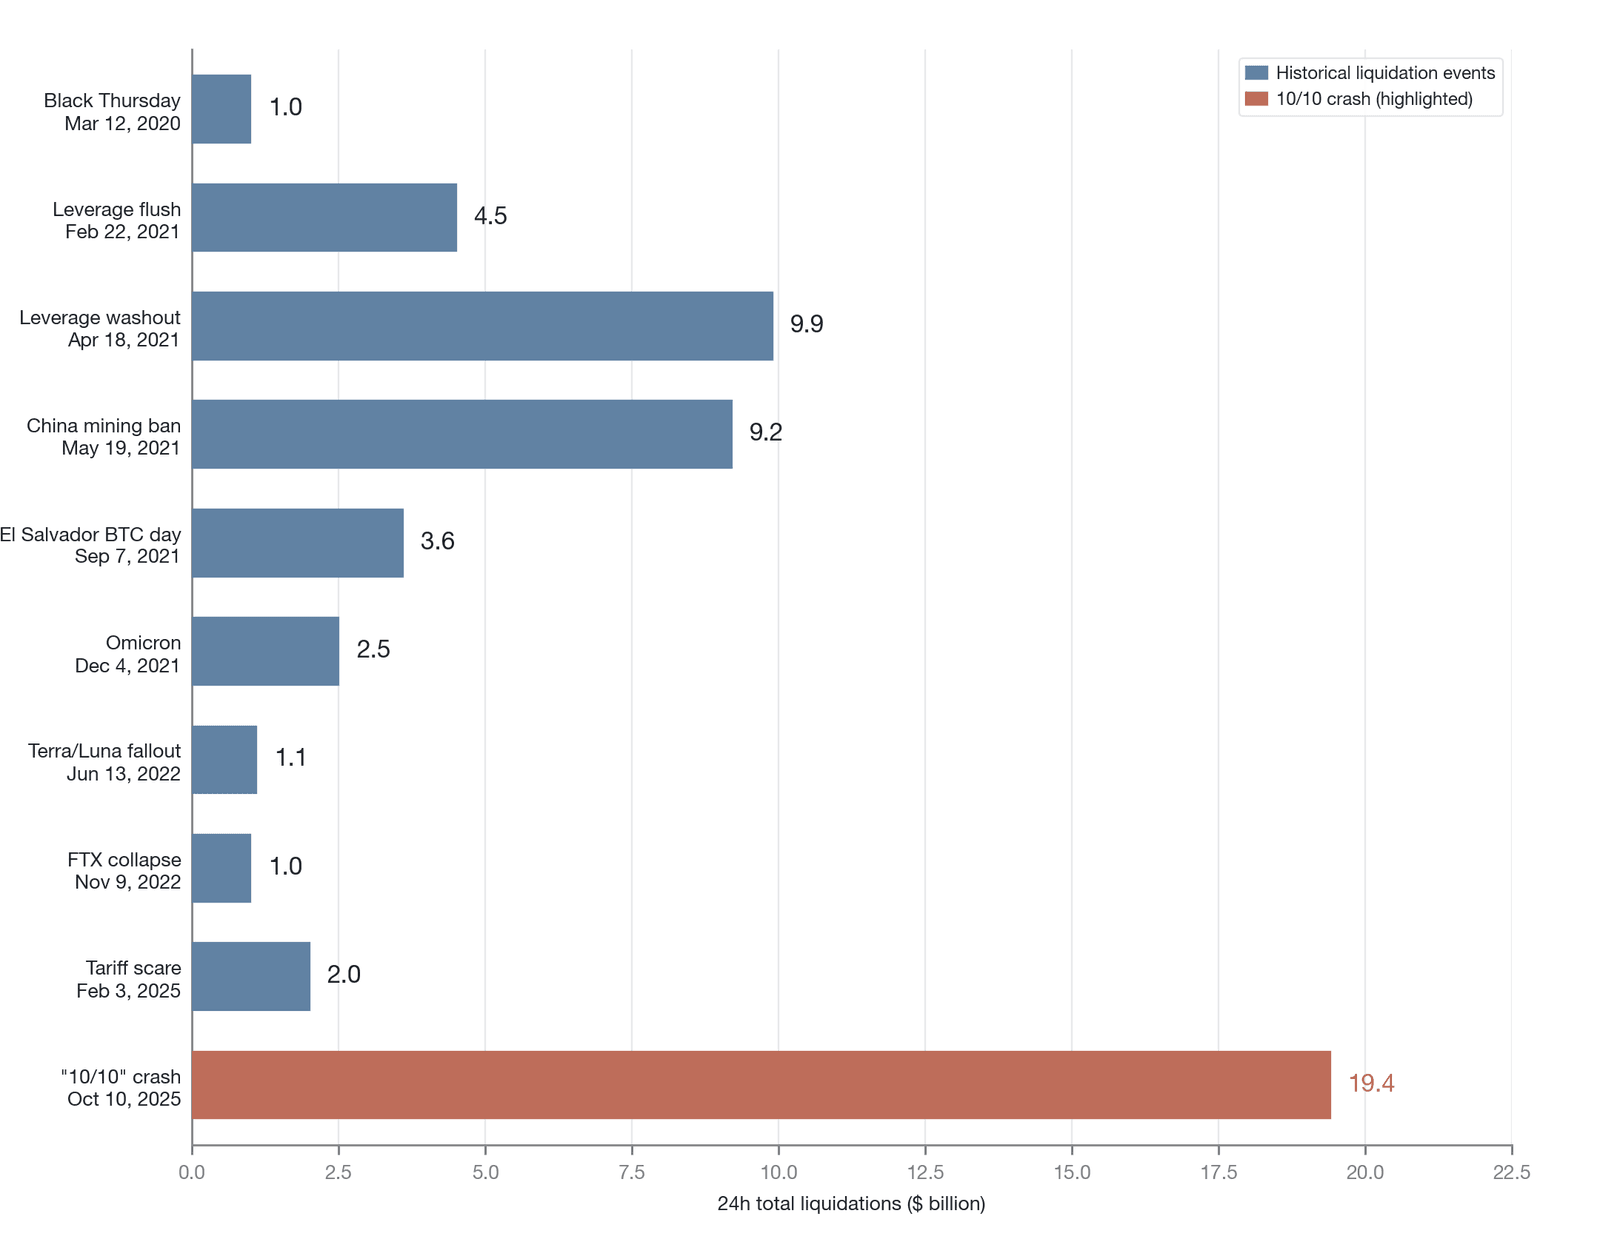
Figure 12-1. Historical comparison of major liquidation events in crypto derivatives (CoinGlass basis, subject to historical underestimation; the April 18, 2021 and May 19, 2021 events were of similar scale, both in the range of roughly $9 billion to $10 billion, with April 18 slightly higher when reconciled at present value)
Comparison across periods based on absolute liquidation volume alone can mislead, because the overall size of the cryptocurrency market has differed enormously across periods. A more analytically useful, standardized metric is the ratio of liquidation volume to the total cryptocurrency market capitalization of the same period. Take the March 2020 "Black Thursday": about $10 billion in liquidations corresponded to a total crypto market capitalization of roughly $200 billion at the time, a normalized ratio of about 0.5%. By contrast, the roughly $19.37 billion in visible liquidations on October 10, 2025 (CoinGlass basis; note that this visible notional may be systematically underestimated because of platform rate-limiting) corresponded to a total market capitalization of about $3.5 trillion, a normalized ratio of about 0.55%. The closeness of the two events on this standardized metric offers a preliminary hint that the relative severity of extreme liquidation events across different market cycles may follow some regularity worth further verification. This preliminary observation must, however, be treated with caution: two data points are not enough to establish a statistically robust regularity; the normalized ratios of other historical extreme events (such as May 19, 2021, or the liquidation event triggered by the Bank of Japan's rate hike on August 5, 2024) may deviate substantially from this range; and the heterogeneity of macro shocks (global systemic panic versus a regional geopolitical shock may differ fundamentally in transmission path and liquidation severity) means it would be unwise to attribute the consistency of the two ratios simply to an endogenous structural property of the crypto market. Moreover, using total open interest (OI) rather than total market capitalization as the normalization denominator could yield different conclusions. If this preliminary observation holds up under a larger sample and more diverse standardization methods, it would carry important implications for calibrating the actuarial models of insurance funds.
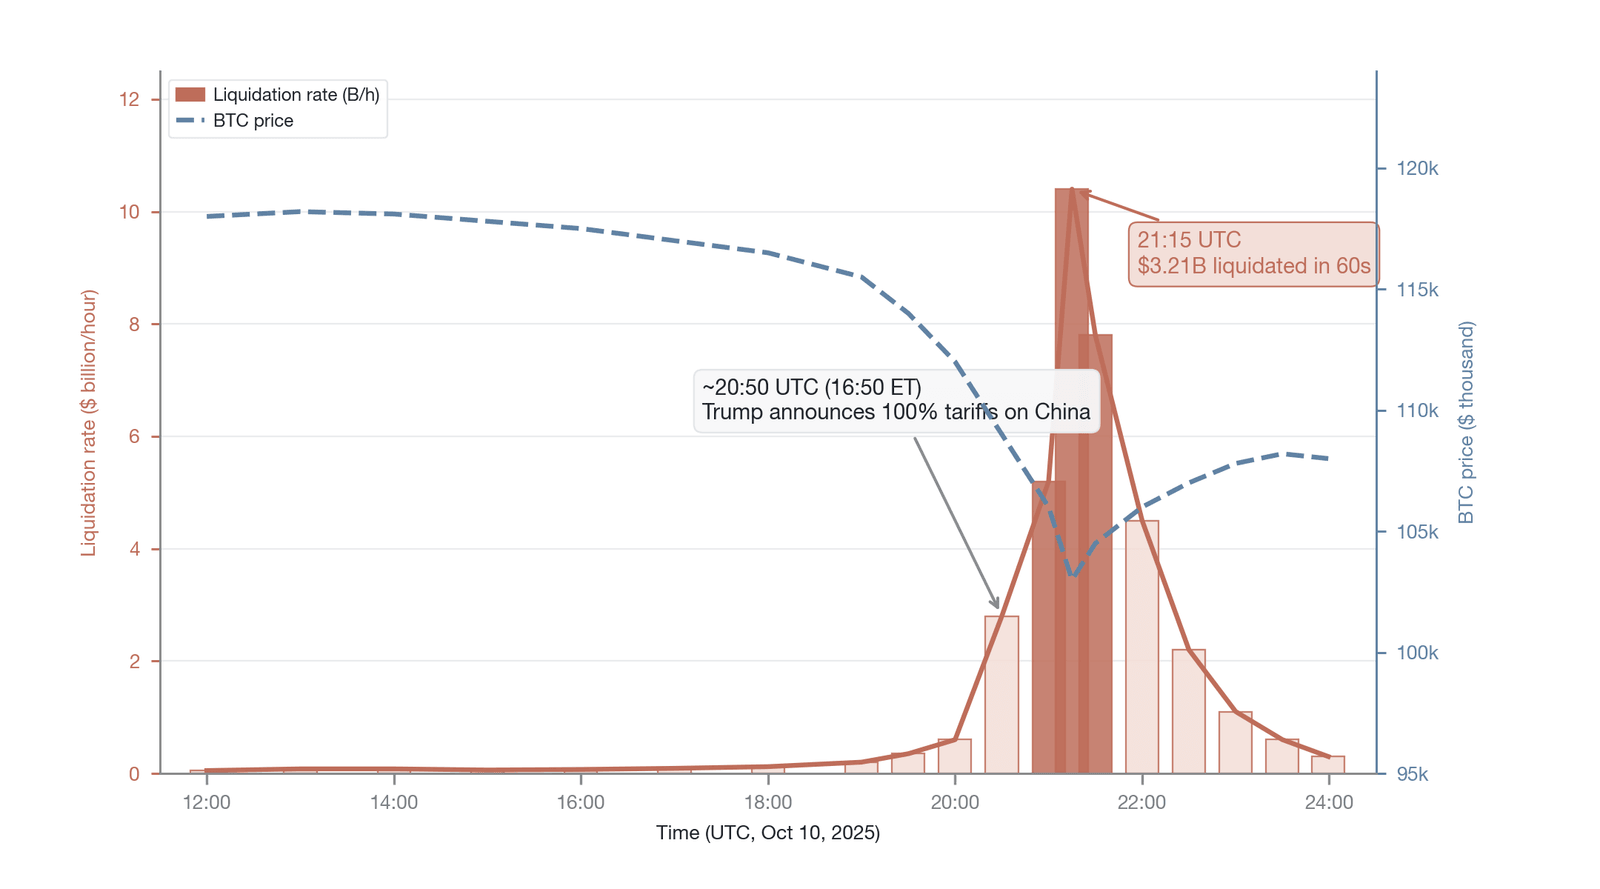
Figure 12-2. Liquidation rate and BTC price timeline for the 10/10 event (the minute-by-minute liquidation-rate and price series is a reconstructed illustration based on characteristic parameters from Amberdata and CoinGecko, not raw tick-by-tick data; endpoints and peaks have been verified)
As shown in Figure 12-2, within the 60 seconds around 21:15 UTC, positions worth $3.21 billion evaporated instantly—a liquidation rate that far exceeded the market's liquidity-bearing capacity. Insufficient order-book depth is a problem not only during extreme events; in day-to-day trading, the distribution of liquidity is itself highly time-varying and non-uniform, and extreme conditions merely amplify this ever-present fragility in its most violent form. The retreat of market makers, though rational risk avoidance at the individual level, constitutes at the system level a procyclicality of liquidity: the moment the market most needs liquidity is precisely the moment when the supply of liquidity is scarcest.
A second class of friction, running parallel to insufficient liquidity, is the price gap. In certain extreme conditions, an asset's price does not move continuously and smoothly but plunges in a cliff-like fashion. The price may instantly leap past a trader's liquidation price or even bankruptcy price, so that the position has no chance to fill at the preset protective level. This phenomenon exists in traditional financial markets as well (the price limits and circuit breakers of stock markets were designed precisely to address such price discontinuities), but in a cryptocurrency market that trades 24/7 without circuit breakers, the losses caused by price gaps are markedly larger. The "Black Thursday" of March 12, 2020, is the most typical case. That day, amid the global panic selling triggered by the COVID-19 pandemic, the price of Bitcoin plunged from about $7,900 to around $3,800 within roughly 24 hours (spanning the two trading days of March 12 and 13), a drop of more than 50% [3]. In such an extreme price gap, large numbers of highly leveraged long positions fell directly into deep shortfall. According to a research report by Ledger Prime, BitMEX alone saw liquidations exceeding $1.4 billion within a roughly 24-hour rolling window; during its downtime it deployed 1,627 deleveraging positions, and its insurance fund fell from about 35,500 BTC to about 33,880 BTC (a decrease of about 1,620 BTC) [4]. The essence of a price gap is that it renders wholly invalid the assumption of price continuity on which the liquidation engine relies. When prices no longer move continuously, any liquidation logic based on step-by-step triggering leads directly to a shortfall because it cannot find an executable intermediate price.
The divergence between mark price and execution price constitutes a third class of friction. To prevent market manipulation and abnormal price swings on a single exchange from triggering unwarranted liquidations, most exchanges use a weighted average of external spot indices as the mark price that triggers liquidation. When the exchange's internal derivatives market collapses, however, the internal contract execution price diverges enormously from the external index price. This divergence creates a dangerous scissors gap: relying on the relatively stable external mark price, the liquidation engine judges that a position has not yet reached the liquidation line, but when that position must finally be closed in the collapsing internal market, the actual execution price may already be far below the bankruptcy price. Conversely, in other cases abnormal swings in the internal price may trigger liquidations that should never have occurred. During a contract flash crash on OKEx (now OKX) on March 30, 2018, the external spot index price held at about $7,000, but the exchange's internal quarterly contract execution price instantly plunged to about $4,755 (some sources round this to about $4,800). This divergence of more than 25% relative to the index (about 30% to 32% at the prices above) caused large numbers of traders who should not have been liquidated to suffer irrational forced liquidation, producing severe shortfall losses (OKEx subsequently rolled all contracts back to 04:07 that day and introduced price-limit rules). The mark-price mechanism is itself an important protective measure, but it cannot eliminate the risk of the internal and external markets decoupling under extreme stress—and that decoupling is yet another important source of shortfalls.
Infrastructure congestion aggravates shortfall risk along another dimension. Even if the liquidation mechanism is flawless in its logical design, bottlenecks in the underlying infrastructure on which it runs can likewise lead to serious consequences. This problem is especially acute in decentralized finance, because the execution speed and throughput of on-chain transactions are hard-constrained by the underlying blockchain's performance. During the 2020 "Black Thursday," the Ethereum network became severely congested under a flood of transaction requests, and gas fees surged from about 20 Gwei in normal times to more than 500 Gwei, a 25-fold increase. This left MakerDAO's liquidation bots unable to submit liquidation transactions in time, because the gas fees they bid were insufficient for miners to include them within a reasonable period. As a result, over a window of about 40 minutes, some speculators seized the opportunity to "win" auctions of Ethereum collateral worth millions of dollars at the extremely low cost of 0 DAI; the total value of collateral swept away in these zero-bid auctions reached about $8.32 million (in a normal liquidation auction, collateral should be sold competitively to recover an equivalent amount of DAI to repay the debt, but because the liquidation bots could not participate in the bidding in time, speculators won with bids of 0 DAI for ETH collateral that should have been worth millions). After deducting the collateral taken for nothing, the MakerDAO protocol was ultimately left with about 5.67 million DAI (roughly $4.5 million) in uncollateralized bad debt, a gap eventually covered by an auction that minted new MKR tokens [5]. The success of the 0 DAI auctions was also partly attributable to a design flaw in MakerDAO's auction contract—namely, a starting bid price of 0 with no reserve-price protection—which allowed a speculator to win at an arbitrarily low price when no competitors participated. This event demonstrated that in DeFi, the effectiveness of a liquidation mechanism depends not only on the logical correctness of the smart contract but also on the availability and reliability of the underlying blockchain network under extreme stress. Since 2020, the infrastructure here has changed substantially. Most current decentralized perpetual-futures platforms (such as Hyperliquid and dYdX v4) run on dedicated app-chains or high-performance Layer 2s, and the problem of gas congestion has largely been resolved. The new architecture, however, introduces new forms of infrastructure risk—including the single-point-of-failure risk of the sequencer, app-chain consensus latency, and cross-chain bridge dependencies—and these new bottlenecks can likewise cause liquidation delays and shortfalls in extreme conditions.
These four frictions point to a core fact: no matter how well the mechanism itself is designed, infrastructure bottlenecks, the endogenous limits of market liquidity, and the discontinuity of price discovery can all lead to serious shortfalls. A shortfall is by no means a flaw of system design; it is a structural inevitability under real market frictions. This structural inevitability gives rise directly to the fundamental need for a risk-socialization mechanism.
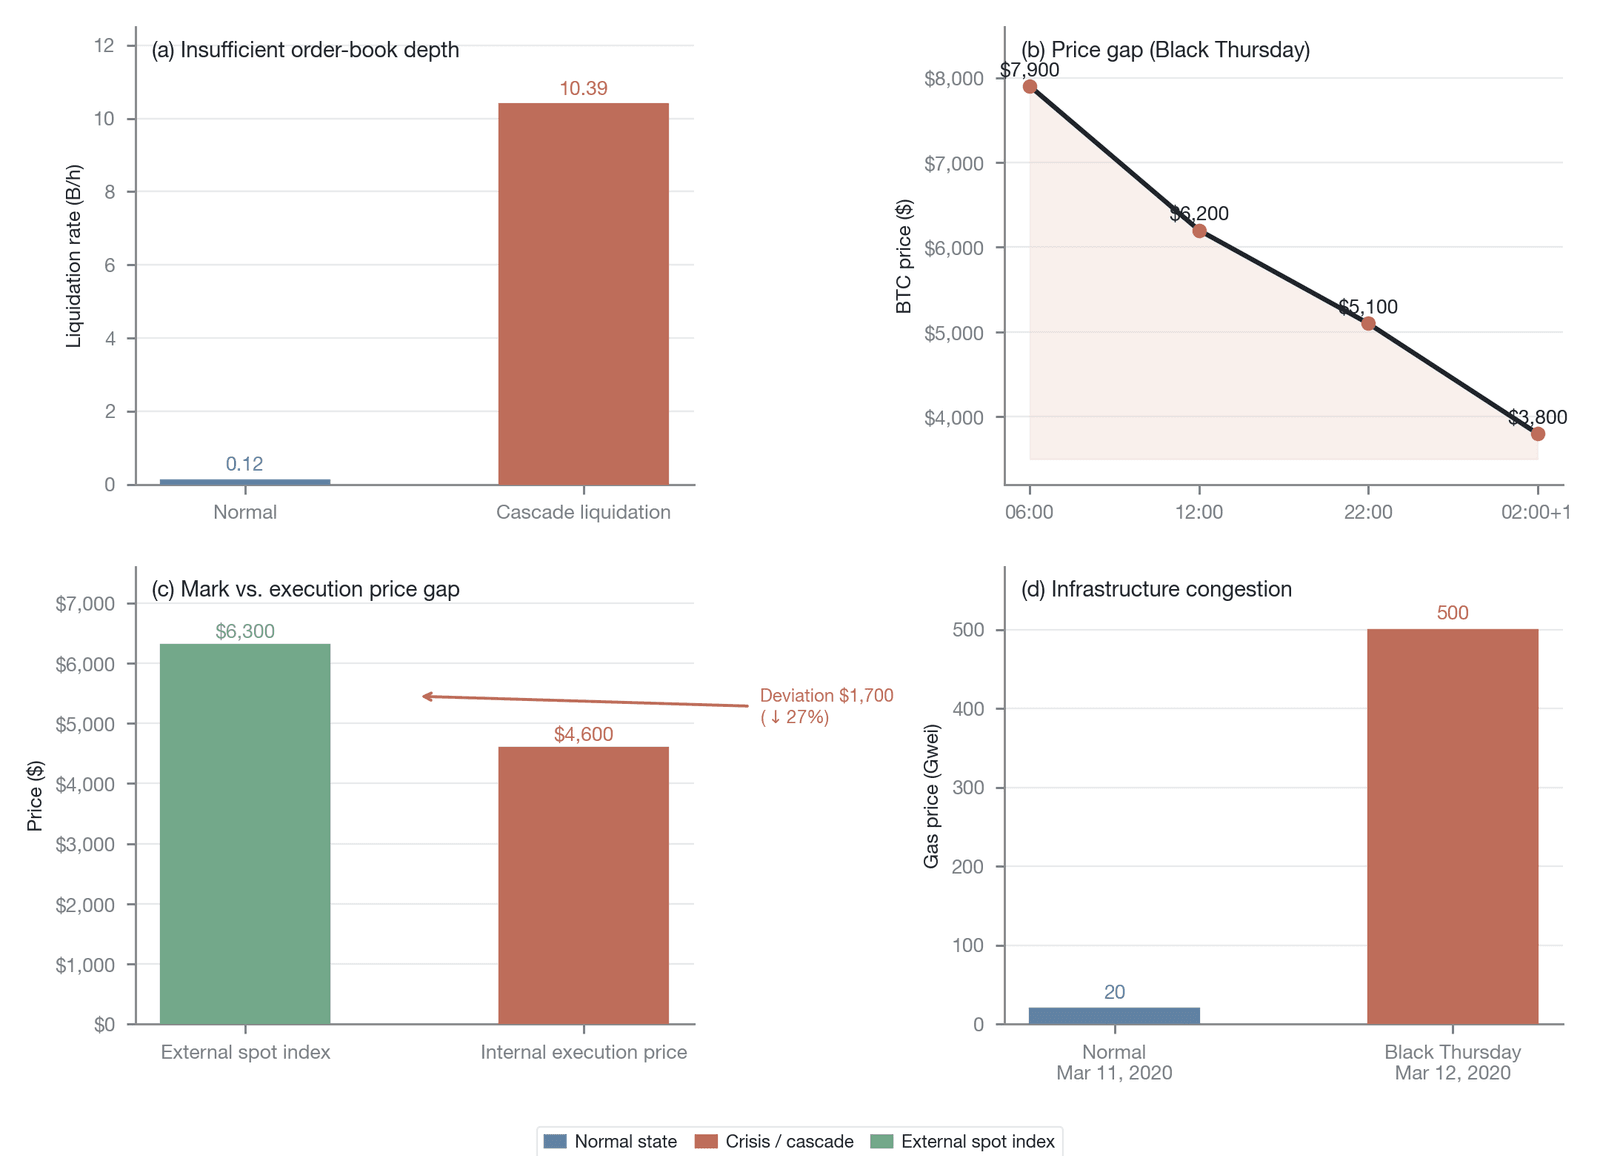
Figure 12-3. The four frictions in the liquidation process and their representative cases (panel ① draws on the 2025 "10/10" event; panels ② through ④ draw on the "Black Thursday" of March 12, 2020; the panels are dimensionally heterogeneous, and panel ① approximates order-book depth depletion with the liquidation rate)
12.1.2 Ex ante pooling and ex post allocation
The inevitability of shortfalls means their economic consequences must be handled systematically. A shortfall is, in essence, a default by a debtor (the liquidated trader whose equity is negative) on a creditor (the profitable trader). In traditional financial markets, a broker can pursue a defaulting client for the amount owed through legal channels, because the client's true identity and asset situation are known. In cryptocurrency markets, however, because of the anonymity (or at least pseudonymity) of accounts and the absence of real-world legal recourse, a platform cannot pursue defaulters for the shortfall as a traditional broker would. At the behavioral level, this institutional feature constitutes an implicit moral-hazard incentive: a highly leveraged trader faces an asymmetric payoff structure of "limited liability plus unlimited upside"—profits accrue to the individual, while losses beyond the margin are borne by the insurance fund or by other traders. As Jensen and Meckling (1976) noted in their classic agency-theoretic analysis, limited liability systematically incentivizes an upward shift in risk appetite [6]. As Know Your Customer (KYC) requirements spread and on-chain identity-tracking technologies (such as Chainalysis and Arkham) advance, this "no recourse" constraint is gradually eroding—yet it remains the general reality of crypto derivatives markets at the current stage. This means the loss produced by a shortfall cannot be pushed outside the system; it must be absorbed within it. In other words, the loss must be socialized—borne collectively by some group of participants in the system. To understand this inevitability, one must recognize the (aggregate) zero-sum nature of the perpetual-futures market once funding rates and fees are removed: in the aggregate, a shortfall trader's excess loss corresponds exactly to the receivable, unrealized profit of the holders on the other side of the contract (typically the profitable side). The shortfall trader's loss exceeds what their margin can cover, and this excess loss corresponds in accounting terms to the profitable side's receivable profit. If the system does not apportion this "bad debt" through some mechanism, the profitable side's profit becomes a paper figure that cannot be honored. Risk socialization is therefore not a subjective choice of the system's designers but a logical consequence of shortfalls under a zero-sum structure. Faced with this challenge, crypto derivatives markets have evolved two distinct paths of risk socialization.
The first path is ex ante pooling, whose core vehicle is the insurance fund. Before a shortfall event occurs, the insurance fund gradually accumulates a common pool of capital by continuously collecting liquidation penalties from the risk-takers who trigger liquidation. Besides liquidation penalties, the fund's revenue sources also include liquidation surplus (the spread that arises when the liquidation execution price is better than the bankruptcy price, which under normal market conditions is typically the main driver of the fund's growth) and, at some platforms, dedicated subsidies drawn from fee income. When a shortfall actually occurs, this pool serves as the first line of defense, collectively covering the deficit. The core advantage of this approach is that it has no direct effect on profitable traders: it does not erode their profits or disrupt the hedging strategies they have carefully constructed. More importantly, because the rules of the insurance fund are set in advance, it provides the market with a high degree of rule predictability. Before entering, traders know clearly that under normal circumstances their profits will not be eroded by others' shortfalls.
The second path is ex post allocation, which appears mainly in two mechanisms: socialized loss and auto-deleveraging. When the insurance fund is exhausted, the system has no choice but to impose the loss on profitable traders. Socialized loss uses a global-apportionment approach, deducting the total loss proportionally from all profitable accounts. Although this makes each person's loss relatively small, the amount is entirely unpredictable, and traders discover only at settlement that part of their profit has been deducted. Auto-deleveraging, by contrast, takes a targeted-selection approach: the system ranks positions by a combined score of return and leverage and forcibly closes the top-ranked profitable positions to offset the defaulter's loss. A trader subject to auto-deleveraging (ADL) is typically force-closed at the shortfall trader's bankruptcy price, which means the selected profitable trader not only loses the position but may be executed at a price far worse than the current market price, so that the actual loss can far exceed a mere give-back of book profit. This mechanism can be highly destructive for the selected trader: a cross-market hedged portfolio carefully constructed across several exchanges can turn instantly from "market-neutral" into naked directional exposure because one of its legs is force-closed by ADL. The execution challenges faced after being ADL'd go well beyond this: the hedging leg on another exchange must be urgently closed in an equally illiquid market; cross-platform capital rebalancing depends on on-chain transfers (which may be delayed by tens of minutes during network congestion); and the compounding of slippage in extreme conditions makes the total loss far exceed the book impact of the ADL itself. The real destructiveness of ADL to cross-platform hedging strategies is far greater than the loss on a single position, and its unpredictability severely undermines the foundation of market trust.
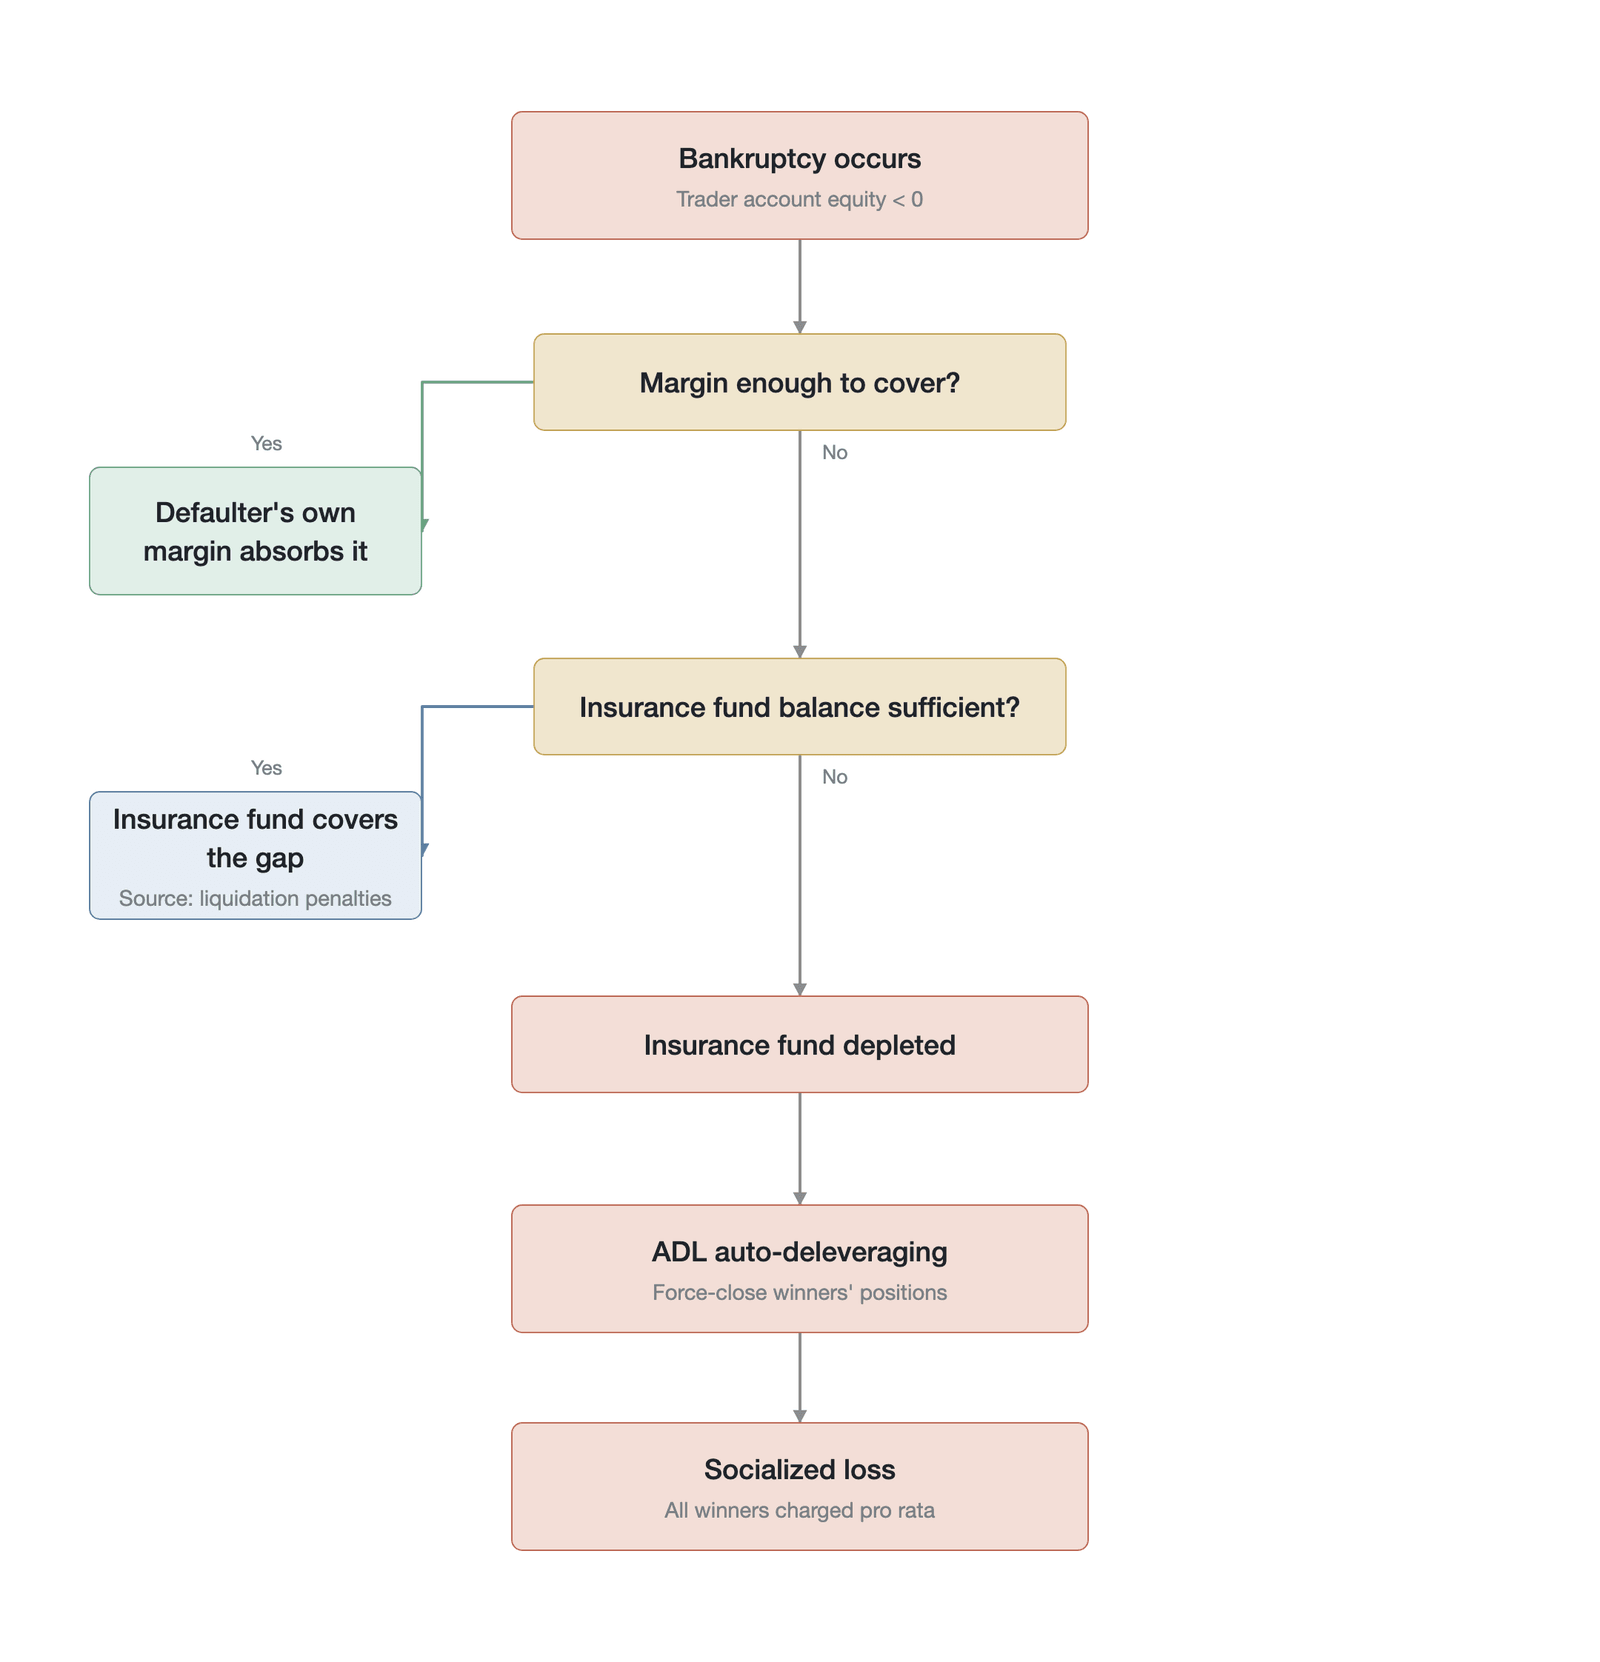
Figure 12-4. The liquidation and risk-socialization waterfall for perpetual futures
The comparison makes clear that both socialized loss and auto-deleveraging resolve the immediate crisis by undermining rule predictability. Socialized loss makes every profitable trader's profit uncertain; auto-deleveraging makes some profitable traders' continued holding uncertain. This uncertainty is a fundamental flaw that any mature financial market strives to avoid, because it directly erodes participants' confidence in the settlement system. For precisely this reason, the ex ante insurance fund is decisive: it is not merely a capital buffer but the ultimate buffer that reduces the probability of ex post allocation being triggered. The more adequate the insurance fund, the lower the probability that ex post allocation is triggered, and the higher the market's settlement credibility and rule predictability.
Ex ante pooling and ex post allocation are not the only conceivable architectures for risk socialization. In traditional finance and the academic literature, there exist at least three alternative or complementary mechanisms. The first is the circuit breaker: when a price falls by more than a preset threshold within a short period, the system halts trading to buy a window of time for liquidity to recover and information to be digested. Traditional stock markets widely adopt this mechanism, but in a crypto market that runs 24/7 and treats censorship resistance as a core principle, "who has the authority to press the pause button" is itself a governance problem. The second is a market-maker backstop obligation, whereby designated market makers assume an obligation of last resort to absorb order flow in extreme conditions, analogous to the New York Stock Exchange's designated market maker system. Crypto market makers, however, are generally not bound by such obligations and are often the first to withdraw liquidity in extreme conditions. The third is a mandatory hedging requirement, whereby one-sided positions above a certain size must hold an offsetting position in an external market, limiting shortfall risk at its source. This mechanism is conceptually the most thorough, but it lacks a technical basis for enforcement in an anonymized crypto market. The practical limitations of these alternatives argue, by contrast, for the institutional rationality of the current two-tier "insurance fund plus ADL" architecture in crypto derivatives markets. Far from perfect, it is nonetheless the most feasible risk-socialization solution under existing technical and governance constraints.
12.1.3 Internalizing negative externalities and supplying a public good
From a deeper economic perspective, an insurance fund is in essence a mechanism for internalizing negative externalities. In the perpetual-futures market, highly leveraged traders take on great risk in pursuit of high returns. When the market moves against them and they fall into shortfall, that loss—if not handled properly—translates directly into losses for other, profitable traders. This phenomenon, in which the risk-taking of some inflicts losses on others, is what economics calls a classic negative externality. Absent any intervening mechanism, risk-takers need not pay the full social cost of their behavior, which leads to systematic excessive risk-taking: the gains from risk-taking accrue to the individual, while the losses are borne by the collective.
The insurance fund solves this problem by institutional design. It levies a fee—the liquidation penalty—on traders who engage in high-risk behavior and are ultimately liquidated. This fee can be viewed as a "risk tax" that forces risk-takers to pay in advance for the externalities they may cause. The system aggregates these taxes into a common buffer pool dedicated to handling the consequences of shortfalls in extreme situations. In this way, the insurance fund forms, within the system, a closed loop of risk pricing and cost absorption, successfully internalizing the negative externalities of individual speculation. In economic principle, this mechanism closely resembles a Pigouvian tax: by taxing behavior that generates negative externalities, it brings private cost closer to social cost and thereby corrects market failure. The core function of a Pigouvian tax is to change incentives ex ante so as to reduce the volume of negative-externality activity, not to compensate victims ex post. If the current level of liquidation penalties is insufficient to effectively deter excessive leverage (that is, if it falls short of the Pigouvian optimal tax rate), then the insurance fund is closer to a "compulsory risk-mutualization fund" than to a Pigouvian tax in the strict sense.
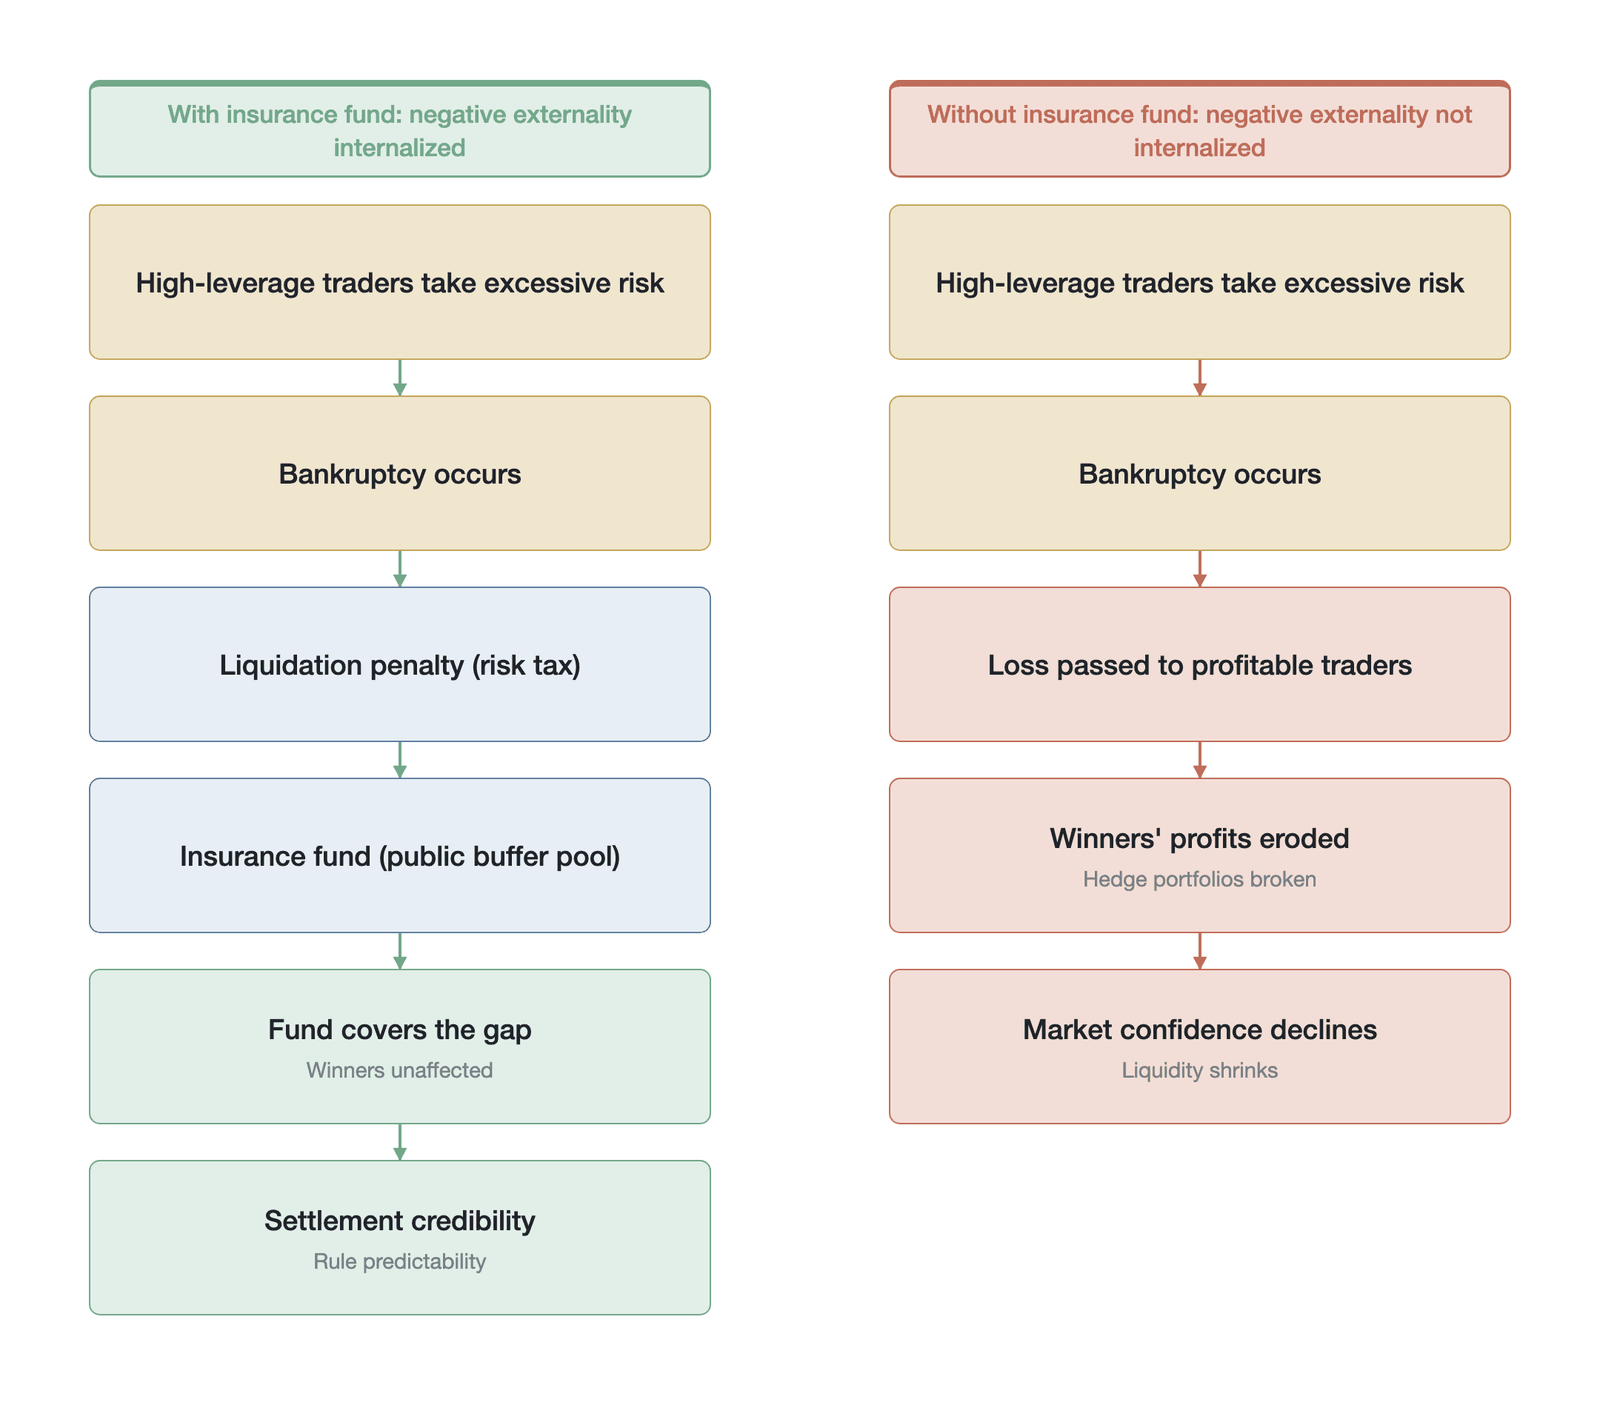
Figure 12-5. How an insurance fund internalizes negative externalities: a mechanism comparison
As shown in Figure 12-5, the presence of an insurance fund corresponds to a virtuous closed loop of cost absorption, whereas the absence of one corresponds to negative externalities spilling outward along the chain of counterparties.
The core output of an insurance fund is not the return earned by investing its capital but two decisive public goods it provides to the entire market. The first public good is settlement credibility. Only when the insurance fund serves as a solid backstop can profitable traders be confident that their book profits will be honored in full and without exception, without having to worry constantly that others' failures will erode their gains. This confidence is especially critical for market makers: the reason they are willing to provide continuous two-sided quotes is that they trust their profits can be reliably settled. If that trust is broken, market makers will withdraw or sharply widen their spreads, and market liquidity will contract dramatically. The second public good is rule predictability. In its Principles for Financial Market Infrastructures, the Bank for International Settlements states explicitly that ensuring the fulfillment of payment obligations to non-defaulting parties is a core function of any financial market infrastructure [7]. In crypto derivatives markets, the insurance fund is precisely the institutional vehicle for this core function. It makes the seemingly self-evident promise that "if you make money, you will surely be able to collect it" possible in a market full of anonymous traders and extreme volatility.
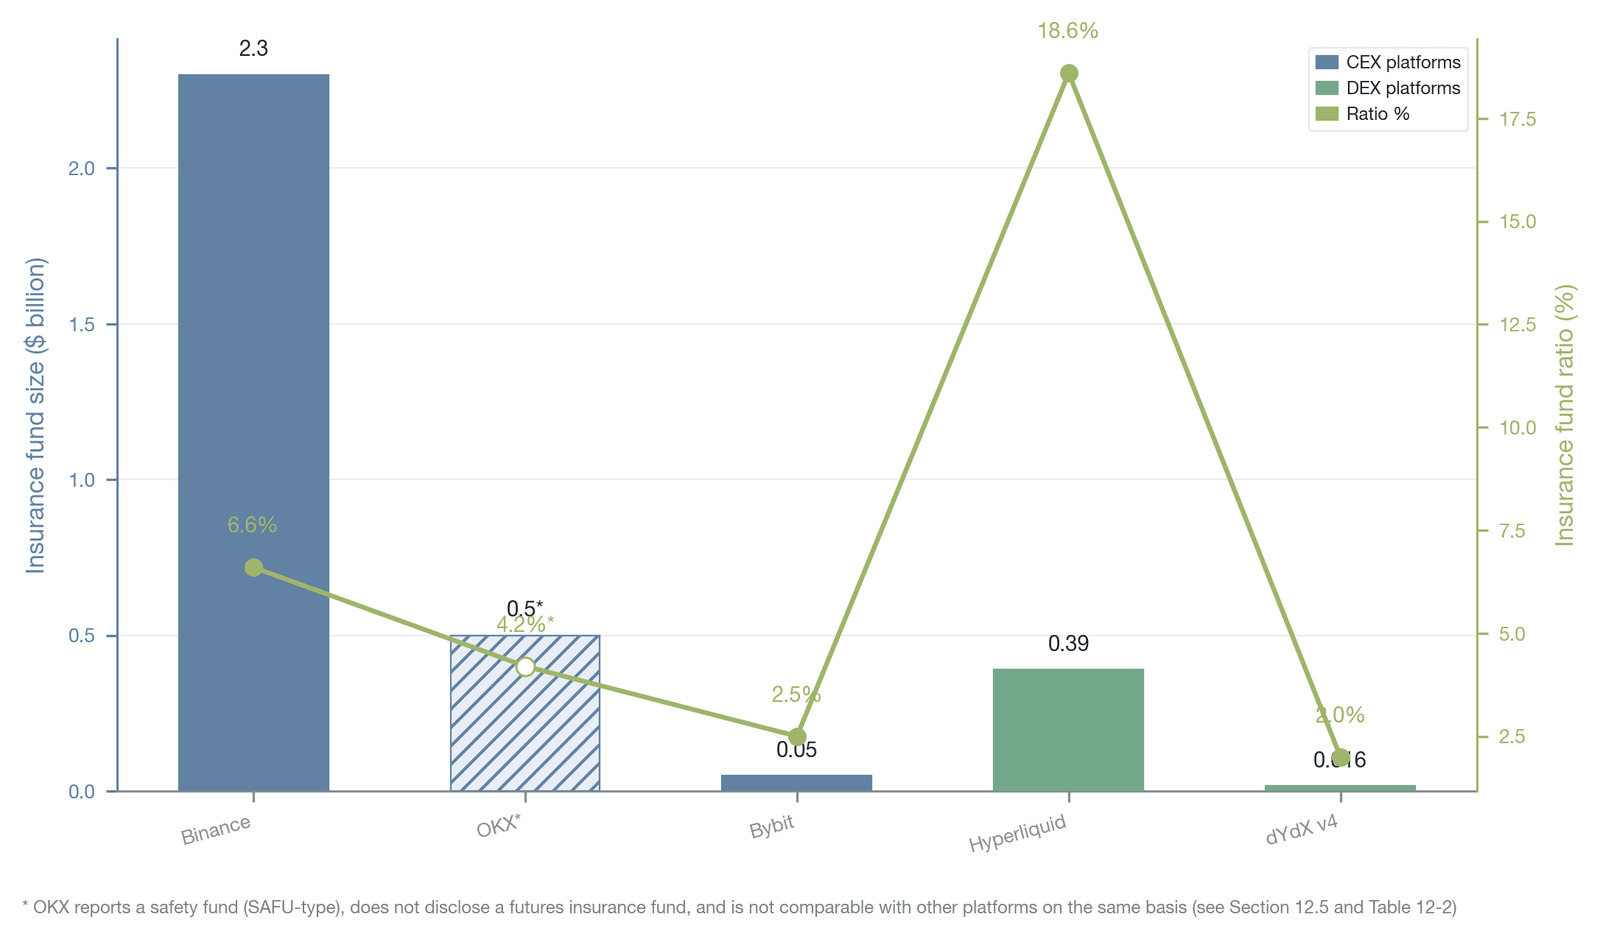
Figure 12-6. Comparison of major exchanges' insurance-fund size and fund-to-open-interest ratio (the fund-to-open-interest ratio is the author's estimate; platforms do not publish this ratio, and the Hyperliquid ratio is an upper-bound estimate based on total HLP TVL; fund sizes are an as-of-2025 snapshot, and present values have since changed and are highly time-sensitive)
Figure 12-6 compares the absolute and relative sizes of major exchanges' insurance funds. It shows that the platform with the largest absolute size (such as Binance, exceeding $2.3 billion) actually has a lower fund-to-open-interest ratio (about 6.6%) than a smaller decentralized platform (such as Hyperliquid, about 18.6%). This difference shows that absolute size alone can be misleading, and that the ratio of the fund to total open interest (here "total open interest" refers to the sum of the notional value of all outstanding contracts across all trading pairs on the platform—that is, the USD-denominated aggregate of open interest) is the effective metric for measuring the buffer thickness per unit of risk exposure. Note that Hyperliquid's roughly $390 million here is the total value locked (TVL) of the HLP vault, which encompasses a shared capital pool for both the market-making strategy and the liquidation-vault strategy. After the 2025 JELLY incident, the liquidation vault was segregated from the HLP main pool, and its standalone size was capped at a "small fraction" of the total HLP balance (the specific proportion has not been publicly disclosed), significantly below the total HLP TVL. Using total HLP TVL directly as the insurance-fund size for cross-platform comparison may therefore overstate Hyperliquid's actual risk-buffer thickness, and the 18.6% ratio should be understood as an upper-bound estimate based on total HLP TVL.
An insurance fund is not, however, a flawless mechanism. In solving the negative-externality problem, it introduces a series of new and complex challenges concerning adequacy of size, transparency of management, and moral hazard. Is the fund large enough to withstand extreme events? Are the rules for its use transparent and verifiable? Does the very existence of the fund instead encourage traders to take on greater risk, because they know a "safety net" underwrites their risk-taking? From a principal-agent perspective, the operation of an insurance fund is nested within two layers of principal-agent relationship. The first layer is between the platform and traders: traders, as principals, delegate the authority for risk management to the insurance fund operated by the platform, but the platform, as agent, holds an informational advantage regarding the fund's true condition, and this information asymmetry may allow the platform to conceal the fund's true risk exposure or misappropriate its assets (hidden-action moral hazard). The second layer is between the platform and liquidity providers (LPs), who deposit funds into the market-making vault or insurance pool and thereby delegate risk underwriting to the platform, but who lack sufficient observability of the platform's liquidation strategy, risk-parameter adjustments, and discretionary decisions in extreme situations (hidden-information adverse selection). This dual principal-agent structure means that the institutional design of an insurance fund must not only solve the technical question of whether the fund is large enough but also mitigate the moral hazard inherent in each layer of agency through incentive-compatible mechanism design. These challenges test not only a platform's technical design capabilities but, more deeply, its governance wisdom. The sections that follow take up these questions across several dimensions: the institutional architecture of the liquidation waterfall, actuarial adequacy-ratio models, the economic consequences of auto-deleveraging, the political economy at stake, the transmission between confidence and liquidity, dual moral hazard, and the governance spectrum.
12.2 Auto-deleveraging: the final mechanism of risk socialization
When extreme conditions leave the liquidation engine's closeout orders unexecutable for lack of liquidity, and the insurance fund is fully exhausted, the system triggers its last line of defense: auto-deleveraging. As the bottom layer of the liquidation waterfall, ADL is the most contested institutional design in crypto derivatives markets. It no longer attempts to resolve risk through market-based means; instead, through forced intervention, it directly strips some profitable traders of their profits and positions in exchange for the survival of the entire system. ADL is not a simple "risk-bearing switch" but a complex mechanism-design problem, involving the fairness of the ranking algorithm, the differentiated impact on different participants, and an inescapable trilemma among solvency, revenue, and fairness. To understand ADL is not merely to understand a risk-control algorithm; it is an entry point for analyzing the trade-offs among efficiency, fairness, and solvency in crypto markets under extreme conditions.
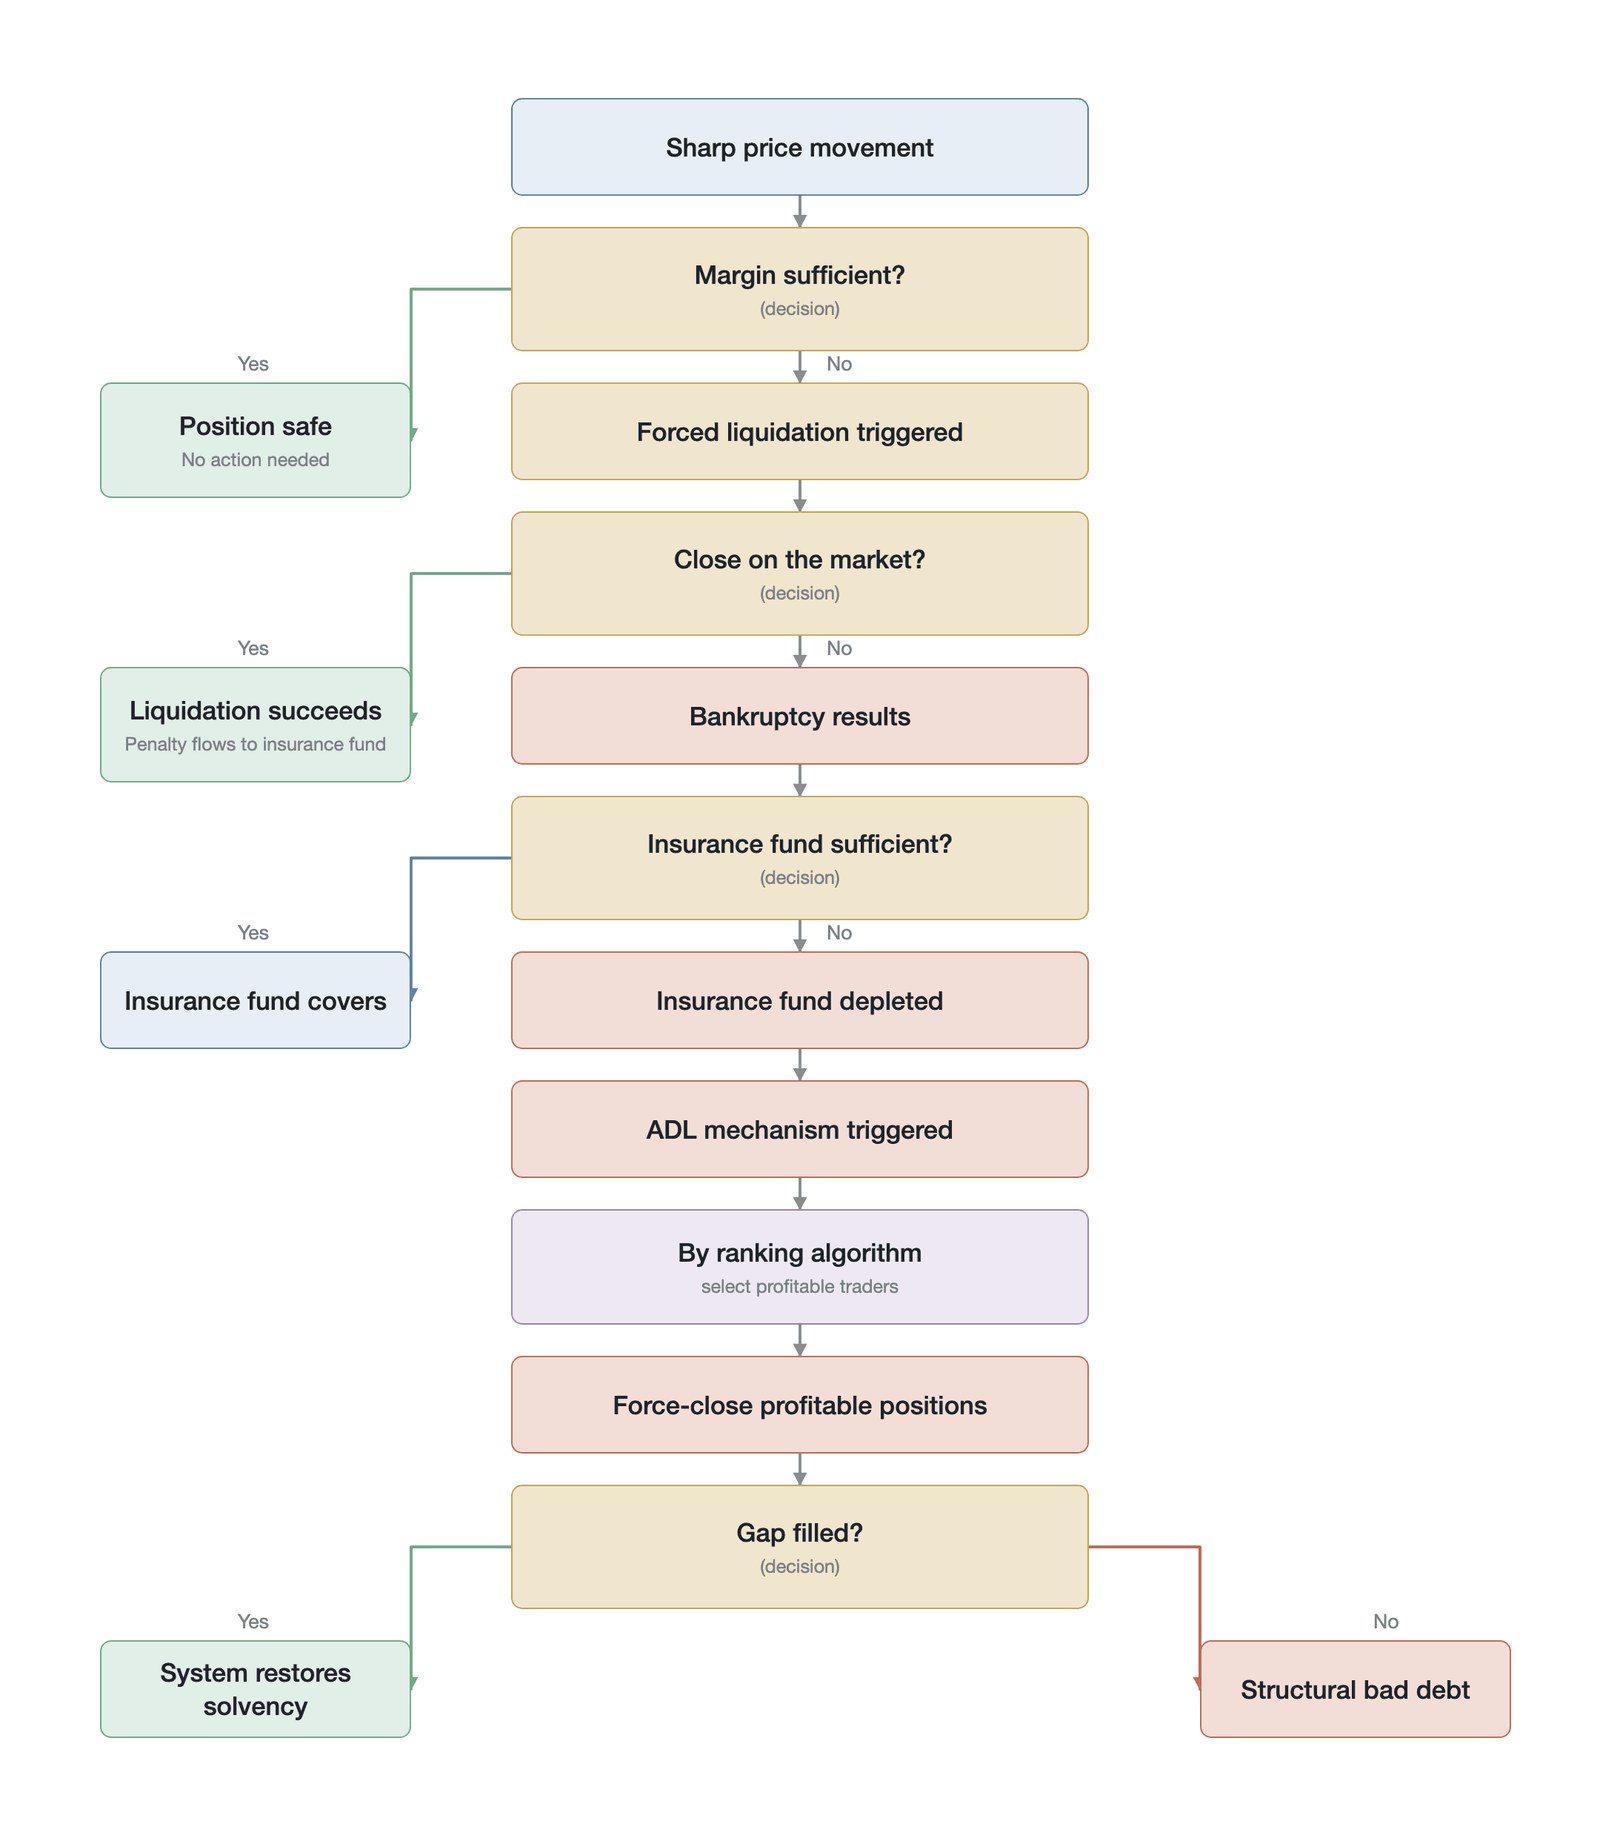
Figure 12-7. The decision process from price movement to an ADL trigger
12.2.1 Ranking algorithms
After shortfall losses break through the three buffers of margin, the liquidation engine, and the insurance fund in turn, the system finally enters the ADL stage (as shown in Figure 12-7). The core of ADL lies in deciding who bears the loss. When a shortfall loss exceeds the insurance fund's current balance, or the fund balance falls below a preset threshold, ADL is triggered. The system first identifies the size of the shortfall gap, then determines a deleveraging priority among the holders of opposing profitable positions according to a ranking algorithm, and force-closes at the bankruptcy price starting from the highest-ranked holder until the gap is completely filled. In mainstream implementations, these "opposing profitable positions" are strictly limited to opposing holdings in the same contract: when a BTC long falls into shortfall, the system selects ADL targets only among the profitable holders of BTC shorts, and never executes across contracts. A direct consequence of this design is that for low-liquidity long-tail assets, if long and short positions are highly imbalanced, the opposing profitable positions available for ADL are extremely limited—which is precisely the root cause of the structural bad debt in the WLD case discussed in Section 12.2.3. When facing a systemic shortfall gap, an exchange must establish a clear set of rules to select the "sacrifices" from among its many profitable traders. The concrete embodiment of these rules is the ADL ranking algorithm. At present, the market's ADL algorithms have evolved into three main paradigms, each embodying a distinct design philosophy.
The oldest and most widely used is the queue-ranking algorithm based on the "product of profit rate and leverage." This ranking formula was introduced by BitMEX in 2016 (Huobi first introduced the ADL mechanism itself in 2015, but it lacked an estimable ranking), and it has since become the de facto industry standard, adopted by Binance (which adopted the formula in 2019), Bybit, and the decentralized platform Hyperliquid, among others [8]. Its core logic is that those who use the highest leverage and reap the largest unrealized profits are regarded as the group that has benefited most from the current extreme conditions and, simultaneously, contributed most to system risk. The system therefore scores and ranks all profitable accounts by the product of return and effective leverage. When ADL is required, the system force-closes the positions of these "top winners" one by one, strictly from highest to lowest, until the shortfall gap is completely filled. The advantage of this algorithm is its extremely high execution efficiency: it can eliminate the largest risk exposure with the fewest operations. Its core defect, however, is that it excessively concentrates its punishment on the most successful traders, giving rise to strong moral hazard and adverse selection. A selected trader may lose all of their profit or more, while the vast majority of profitable traders are entirely unaffected. More seriously, the queue-ranking algorithm has extremely low Sybil resistance: a sophisticated trader can split one large account into several small accounts to lower each account's ranking score, effectively evading the risk of being selected for ADL, so that those who ultimately bear the ADL impact are often the less sophisticated participants. Sybil-evasion strategies are not, however, costless: on centralized exchanges, operating multiple accounts runs up against the hard constraint of KYC identity verification; on decentralized platforms, spreading positions across sub-accounts requires each to maintain margin independently (forfeiting the capital efficiency of cross-margining), and managing multiple accounts increases the probability of operational error in extreme conditions.
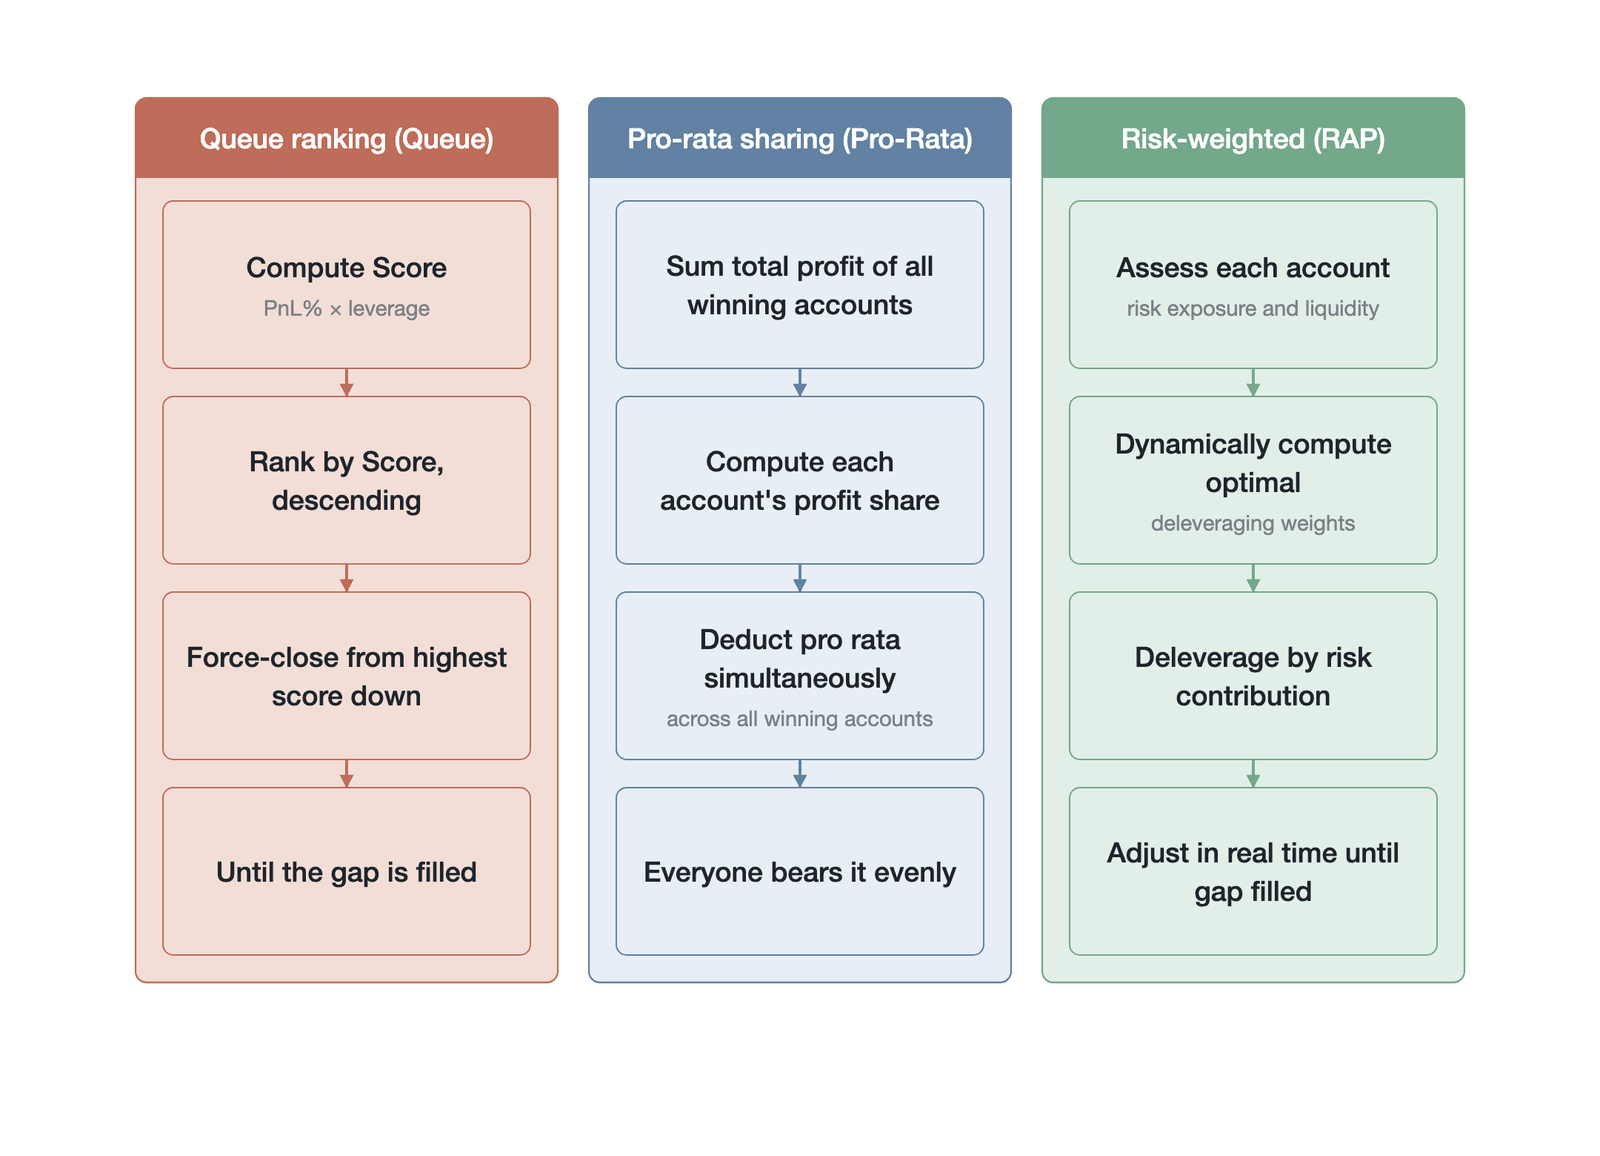
Figure 12-8. A comparison of the execution logic of three classes of ADL ranking algorithms
As shown in Figure 12-8, queue ranking concentrates its blows on the top winners; pro-rata allocation distributes losses evenly; and risk-weighted allocation dynamically allocates losses according to each account's aggregate risk exposure. To mitigate the extreme unfairness of queue ranking, some decentralized exchanges (DEXs, such as Drift and Paradex) have begun to explore pro-rata allocation [9]. This algorithm abandons the precise targeting of the "largest winners" and instead apportions the shortfall gap evenly across all profitable accounts in proportion to their profit. This means that regardless of leverage, any account in profit must pay a "compulsory tax" for the survival of the system. On its face, pro-rata allocation appears more moderate and fair—each person's loss is smaller—and its Sybil resistance is extremely high (splitting accounts does not change the pro-rata outcome). In actual execution, however, because it involves the simultaneous handling of a large number of tiny accounts, its computational complexity and execution latency increase markedly, and it often proves inadequate in the split-second urgency of extreme conditions. A deeper problem is that if pro-rata allocation ignores differences in risk, it causes low-risk traders to provide an implicit subsidy to high-risk traders. When this subsidy cost exceeds the trading utility that low-risk traders derive from the platform, they will rationally choose to exit, raising the platform's average risk level, which in turn forces still more low-risk traders to exit—a self-reinforcing chain of exits.
In recent years, the academic community has proposed a more advanced risk-weighted allocation algorithm. Represented by the research Tarun Chitra published in late 2025 [10], the RAP algorithm seeks a dynamic balance between efficiency and fairness. Rather than relying solely on static profit or leverage metrics, it incorporates an account's aggregate risk exposure, historical volatility, and the current market's liquidity depth, using a complex mathematical model to compute in real time each account's optimal deleveraging share. Its core idea is to align risk with cost: accounts that contribute more to system risk should bear a larger deleveraging share, rather than being ranked simply by profit or leverage. Chitra's research further proposes the MDIC algorithm, which achieves an regret bound, whereas any static strategy incurs linear regret in an adversarial environment. The core distinction here is this: in the face of an adaptive adversary, a static strategy (such as a fixed queue ranking or a fixed pro-rata allocation) accumulates regret that grows linearly with the time step , meaning the gap between the strategy's performance and the optimal ex post benchmark widens uncontrollably; MDIC, as an online-learning algorithm, dynamically adjusts the allocation weights after each ADL event based on the observed market state, compressing cumulative regret to —that is, sublinear growth. This jump in order from to is used in the paper's formal model to establish two propositions (these conclusions come from a preprint and await peer-review verification): first, under the premise of an adversarial market environment, any static ADL rule that does not adjust to the market state cannot achieve sublinear regret and is therefore suboptimal; and second, there exists a computable dynamic strategy that can asymptotically approach optimal performance [10]. Moreover, the asymptotic optimality of the online-learning framework (the advantage of an regret bound relative to ) rests on the premise that tends to infinity, whereas ADL events are extremely low-frequency (the 12-minute window of the 10/10 event produced only about 1,000 shocks, and most platforms experience only single-digit numbers of ADL events per year); when is small (for example, ), the practical numerical difference between the two is negligible. The engineering value of the MDIC algorithm may therefore lie more in its idea of dynamically adjusting weights than in a strict guarantee of asymptotic optimality. Combined with the computational complexity of the MDIC algorithm (each round requires solving a convex optimization problem) and the challenges of engineering implementation, it remains difficult to deploy at scale in a production environment and remains largely a subject of academic exploration.
12.2.2 The trilemma
A close analysis of the ADL mechanism reveals that it faces an inescapable theoretical dilemma: the ADL trilemma. In designing any ADL strategy, an exchange tries to achieve three core objectives simultaneously: maintaining the system's solvency, protecting the platform's long-term revenue, and ensuring fairness to traders. In his 2025 research, however, Chitra proves within his formal model that—under the objectives and the class of feasible strategies specified in that paper—no ADL algorithm can simultaneously dominate on all three dimensions of solvency, long-term revenue, and fairness (the three constitute a Pareto trade-off), and an exchange must make a difficult trade-off among them [10].
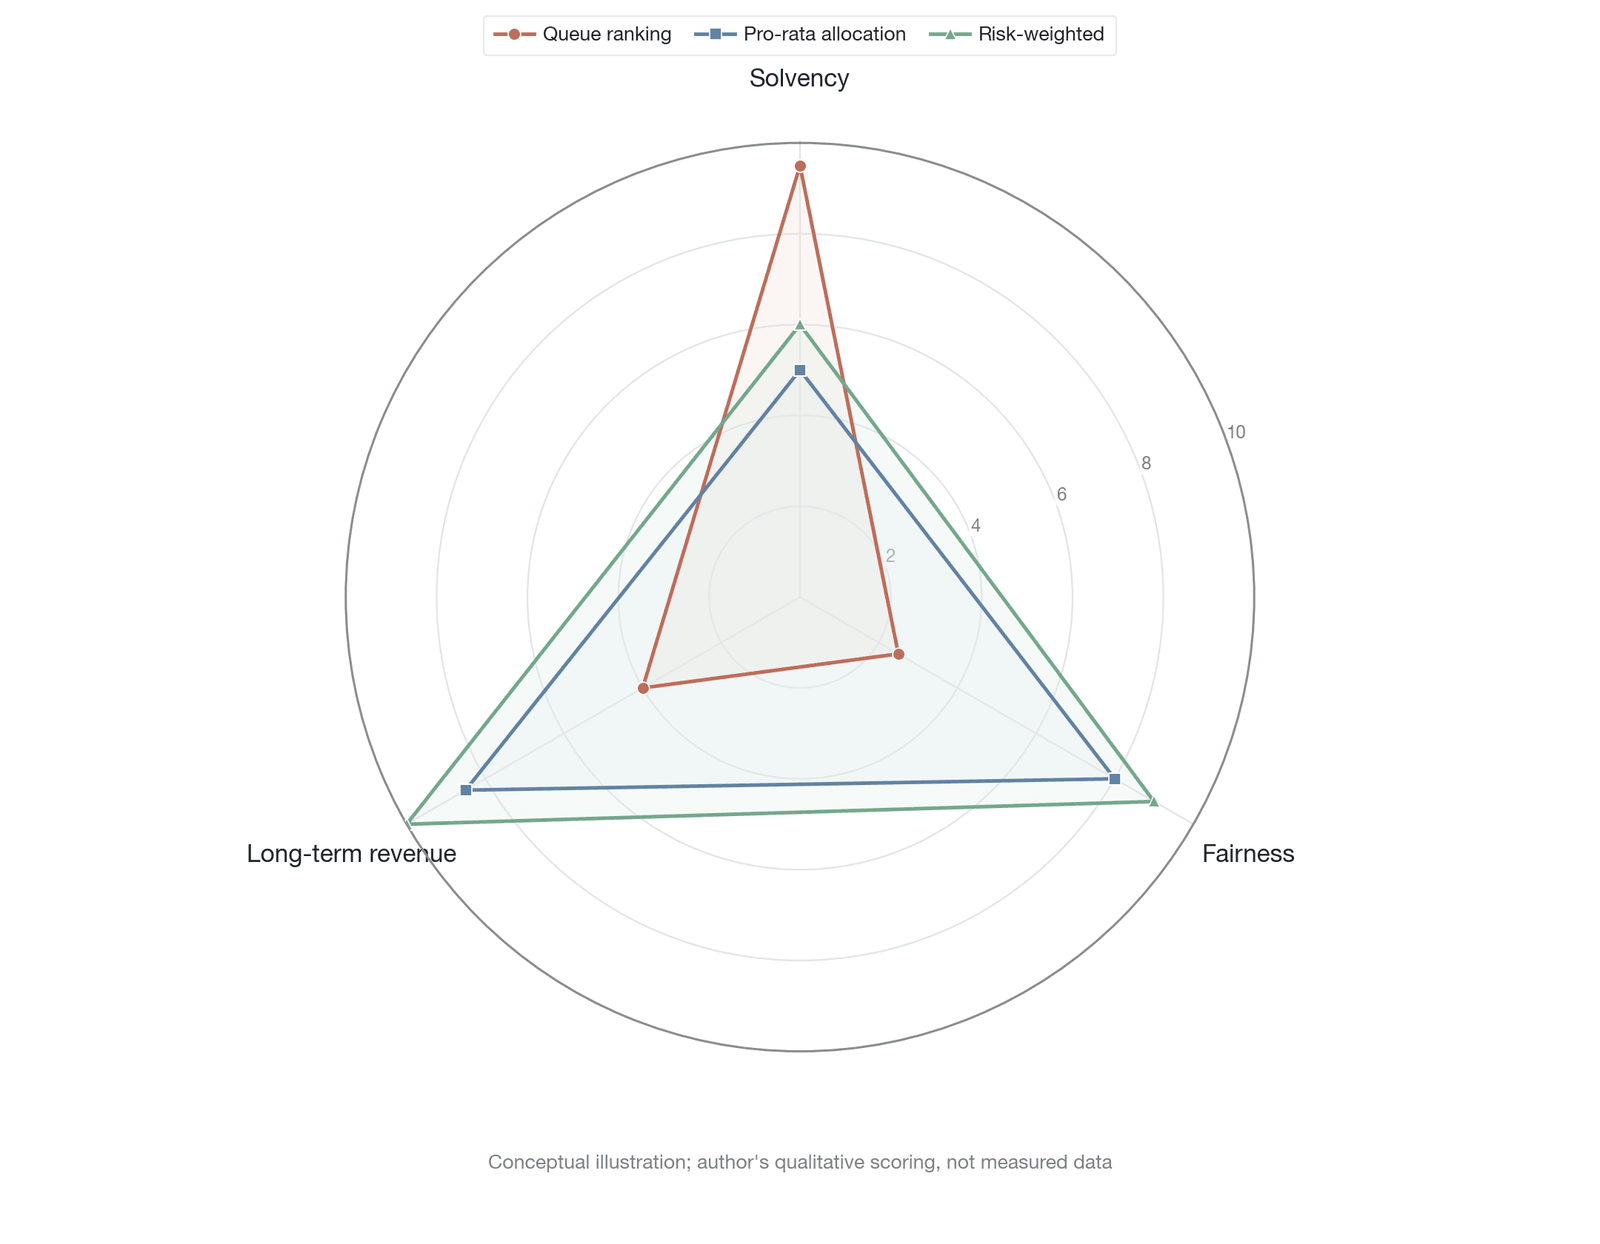
Figure 12-9. The trilemma performance of different ADL strategies (conceptual illustration, qualitative scoring by the author, not measured data)
Figure 12-9 presents, in radar-chart form, the trade-offs of different ADL strategies across the three dimensions: queue ranking has the highest solvency and the lowest fairness, pro-rata allocation is the reverse, and risk-weighted allocation seeks a balance. Solvency is the exchange's core constraint, requiring that ADL rapidly and thoroughly eliminate every shortfall gap. The most effective way to achieve this is to adopt an aggressive queue-ranking algorithm that directly cuts off the largest winners' positions. This approach, however, severely damages fairness, because it makes a tiny minority bear a disproportionate share of the systemic cost. Worse, this crude expropriation markedly reduces the willingness of high-net-worth traders to participate, causing them to leave the platform permanently after suffering ADL (that is, user attrition). The attrition of high-frequency traders and market makers directly drains platform liquidity and sharply reduces long-term fee revenue, thereby damaging the exchange's long-term revenue objective.
If, to protect long-term revenue and preserve fairness, an exchange chooses a gentler pro-rata allocation or sets a deleveraging cap, then in the face of a massive shortfall gap the force of ADL execution may fall far short. This not only fails to restore the system's solvency in a short time but may, through the continued spread of risk, trigger even larger-scale panic and a run. And if the exchange prioritizes protecting whale clients (high-net-worth traders) to preserve revenue, then small and medium traders must bear a larger share of the loss, fairness is further distorted, and systemic risk may keep accumulating because large positions are not disposed of in time. Within this trilemma, the prevailing mainstream queue-ranking algorithm has in effect chosen to preserve solvency at all costs, sacrificing fairness and long-term revenue.
To quantify this unfairness, Chitra introduces the profit-to-solvency ratio (PTSR) [10]. The PTSR measures the relationship between the profit a trader retains after suffering ADL and their contribution to the system's solvency. Mathematical analysis shows that the PTSR is of order , where is the largest winner's profit and is the total number of traders. For a light-tailed (thin-tailed) probability distribution, the largest winner's profit is asymptotically negligible relative to the total scale (), which means that as an exchange grows larger, ADL's "expropriation" of top winners tends toward completeness: in a sufficiently large exchange, the most successful traders tend to lose almost all of their profit. This conclusion is premised on the light-tail assumption: when the loss/profit distribution exhibits the power-law heavy tail described in Section 12.3.5 of this chapter (tail index ), may be of the same order as the total scale, in which case this expropriation conclusion is weakened or even reversed—and this is precisely the scenario most likely to arise for long-tail/meme assets. Ideally, the PTSR should be close to 0.5, meaning risk-sharing is relatively balanced (the 0.5 benchmark here implicitly assumes a symmetric fairness criterion, namely that about half of the profit should be retained per unit of solvency contribution; under different theories of fairness—for example, the Rawlsian maximin principle that prioritizes protecting the weakest participant, or a utilitarian framework that maximizes total utility—the ideal PTSR value may differ). Under the traditional queue-ranking algorithm, however, the largest winner's PTSR is often below 0.001, reaching the extreme level of one in a thousand, meaning they are stripped of almost all of their legitimate profit. By contrast, the PTSR of pro-rata and risk-weighted allocation strategies ranges between 0.3 and 0.5, which is markedly fairer.
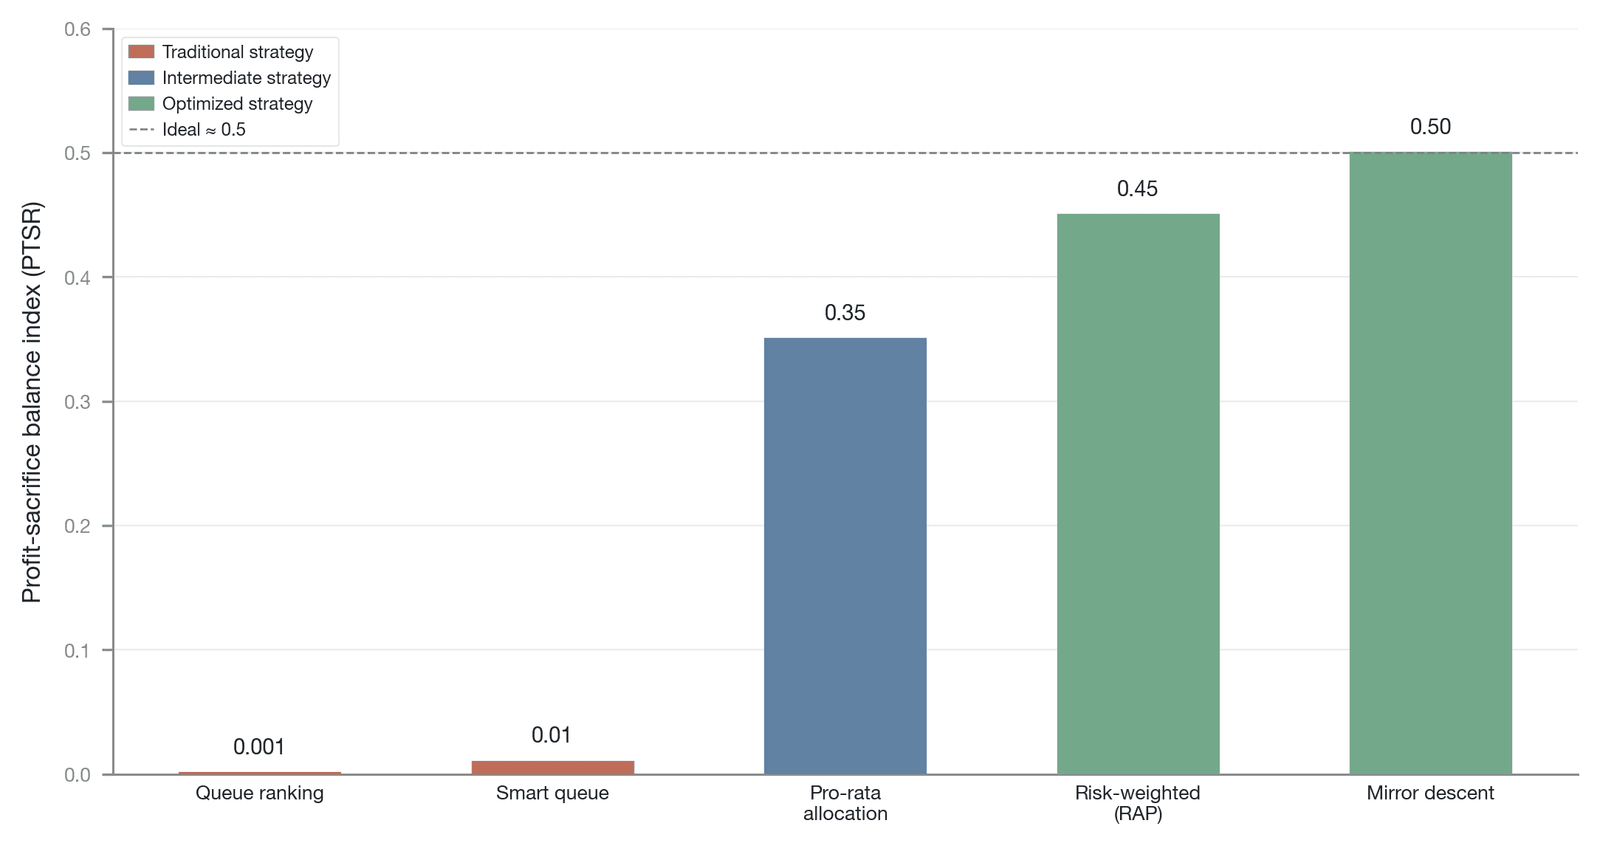
Figure 12-10. PTSR comparison across ADL strategies (PTSR values are constructed or illustrative by the author, based on the ADL research of Chitra and Gauntlet; the primary paper has not been verified; "smart queue" has no independent source, and only the qualitative ranking holds)
Figure 12-10 quantifies this difference in unfairness. From the perspective of a Stackelberg game, this trilemma carries a deeper dynamic implication. The game structure of ADL can be modeled as a sequential game. In a simultaneous game without commitment (Nash), a "bad equilibrium" exists: traders expect the severity of ADL to be high and therefore withdraw or reduce their positions; their withdrawal in turn reduces the total profitable positions available for deleveraging, forcing the system to impose a higher deleveraging intensity on the remaining participants in the next crisis—a vicious cycle. In a Stackelberg setting, by contrast, the exchange can commit in advance to an incentive-compatible strategy (such as RAP or MDIC), sending a credible signal to the market that coordinates participants toward a "good equilibrium," in which traders believe deleveraging will be fair and are therefore willing to stay on the platform, providing the system with a more ample deleveraging buffer [10].
12.2.3 Formal analysis and empirical testing
For a long time, discussion of ADL remained largely at the level of experience and intuition, lacking a rigorous mathematical framework and large-scale empirical testing. Only in late 2025, when Tarun Chitra published the first rigorous formal analysis of the ADL mechanism [10], did the field gain a rigorous scientific footing. Chitra's research not only proved the existence of the ADL trilemma in theory but also, through high-fidelity tick-by-tick replay of a real historical event, revealed the enormous defects of existing mechanisms, providing a solid empirical basis for optimizing ADL algorithms.
The core empirical basis of this research is the extreme market crash that occurred on October 10, 2025 (known in the industry as the "10/10 event"). On that Black Thursday, hit by a sudden shock from macro geopolitical news, the crypto market triggered more than $19 billion in visible liquidation notional within just 24 hours, affecting roughly 1.62 million traders and setting the highest visible liquidation record on record [11]. On decentralized platforms such as Hyperliquid, the ADL mechanism was triggered frequently. Chitra's research focuses on the 12-minute window from 21:16 to 21:27 UTC on October 10, 2025; in that brief but violent period, Hyperliquid saw about $2.1 billion in position liquidations, involving about 160 assets and 19,337 wallets, and producing ADL shocks, of which 201 produced a positive shortfall gap (that is, a genuine shortfall) [10].
By replaying tick-by-tick the 1,097 ADL shocks that occurred within these 12 minutes, Chitra's analysis reveals a striking phenomenon: over-deleveraging. The queue-ranking algorithm running in production, lacking dynamic awareness of the global gap, tends to mechanically close far more positions than actually needed. The data show that within these 12 minutes, the cumulative actual loss (that is, the dynamically accumulated value of the shortfall—the liability gap arising after account equity falls below zero across all shortfall events) was about $23.24 million, whereas the total profit available for deleveraging from all profitable traders (that is, the sum of the unrealized profit of the opposing profitable positions within the same time window, i.e., the reducible P&L allowance) was only $6.62 million. Yet the production queue-ranking strategy actually executed cumulative over-deleveraging as high as about $653.6 million (here "over-deleveraging" is measured by the equity value of the force-closed positions—that is, margin plus unrealized profit—rather than by a profit measure), with a single largest over-deleveraging of $47.1 million [10]. The seemingly contradictory difference in magnitude among these three figures (millions versus hundreds of millions) stems from two different measurement bases: the shortfall gap and the available profit are measured in "profit and loss (P&L) dollars" (counting only the profit/loss portion), whereas over-deleveraging is measured in "equity dollars" (the full position value, comprising margin principal plus profit). Based on public data, this book estimates that the average equity-to-profit ratio of the affected traders was about 6.66 times (the paper itself does not directly provide this ratio), meaning that each $1 of reducible profit corresponds to about $6.66 of position equity [10]. The core problem of the queue-ranking algorithm is that it force-closes the entire position of the highest-ranked profitable trader in full, rather than reducing only the minimum share of profit needed to fill the gap. To take a simplified numerical example: suppose a BTC short falls into shortfall and produces a $100,000 shortfall gap, while the largest opposing winner holds a long position with $5 million of equity value (of which $4.25 million is margin and $750,000 is unrealized profit). The queue-ranking algorithm force-closes the entire $5 million equity position of that long to fill the $100,000 gap, of which $4.9 million of equity-value closeout is unnecessary over-deleveraging. It is precisely this crude logic of "closing a large position to eliminate a small gap" that leads the system to impose forced closeouts tens of times larger than necessary on profitable traders. All of the optimized alternative strategies (including Smart Queue, Mirror Descent, Vector Optimization, and Hybrid Blend) keep over-deleveraging near zero; measured by the total equity force-closed, this indicates that about 98% was over-deleveraging unnecessary for filling the gap—pure additional harm inflicted on profitable traders by the crude design of the ranking algorithm.
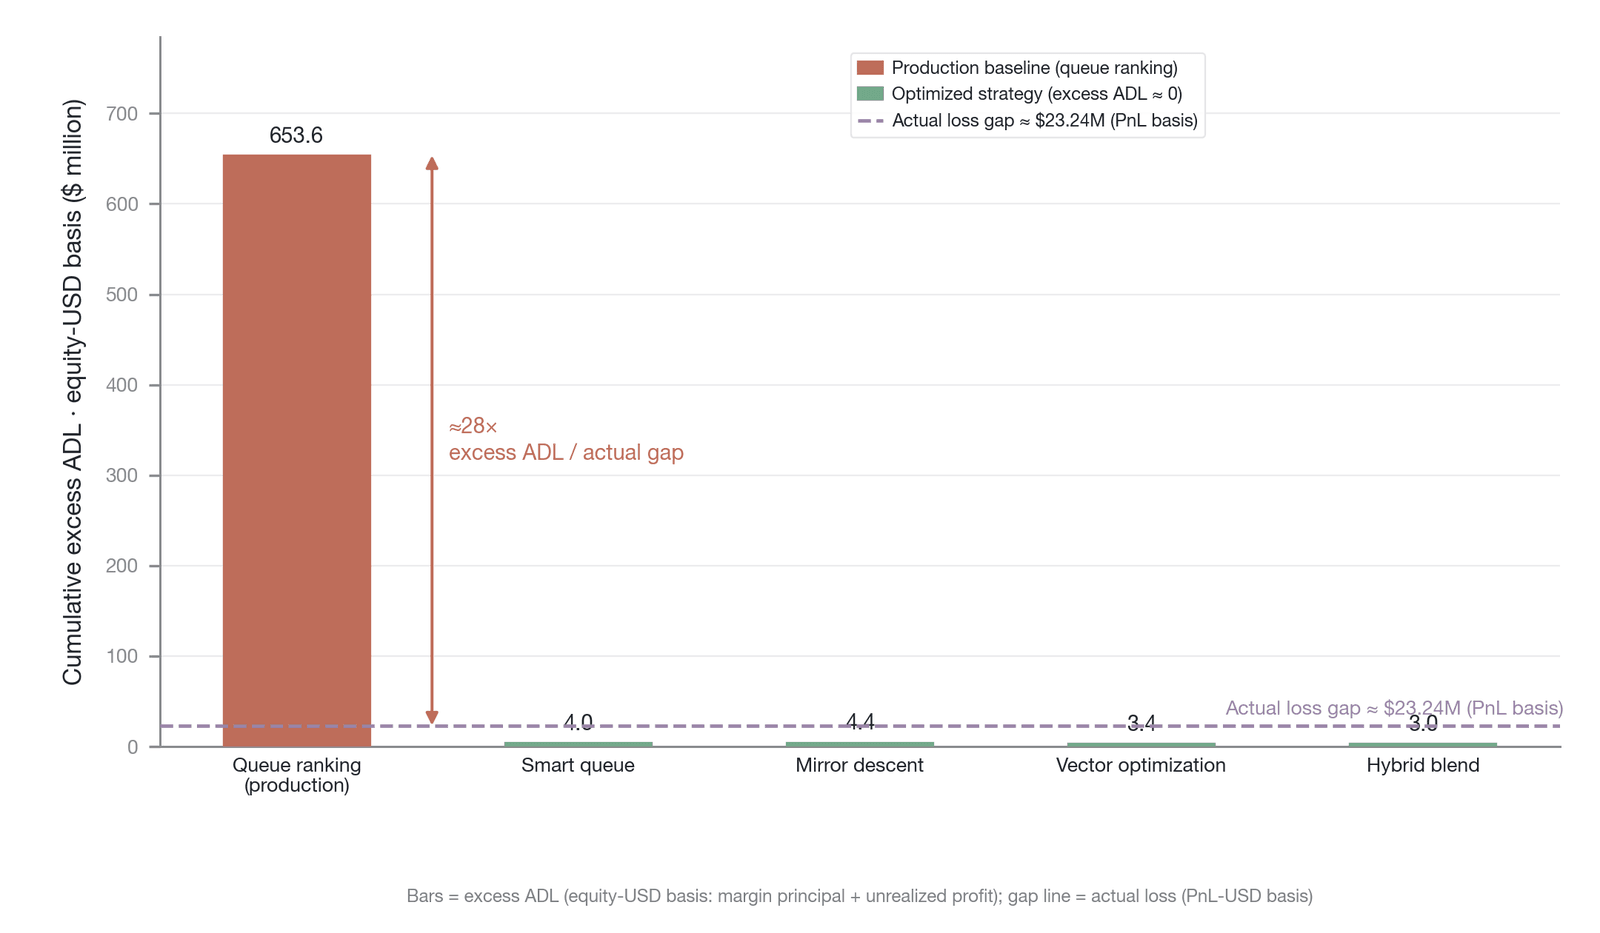
Figure 12-11. Comparison of cumulative over-deleveraging across ADL strategies (bar height is the equity-dollar measure of force-closed positions, including margin principal and unrealized profit, not the P&L actual shortfall gap; the actual loss was about $23.24 million, and over-deleveraging was about 28 times that)
Figure 12-11 compares the cumulative over-deleveraging of different strategies; the enormous gap between the production queue-ranking strategy and the near-zero optimized strategies (Smart Queue, Mirror Descent, and others) confirms the crudeness of static ranking rules. In an on-chain environment, executing 1,097 ADL shocks within 12 minutes involves a large number of state changes and fund transfers, and the operational risk is not to be underestimated: the uncertainty of transaction ordering, partial execution failures, and the challenge of guaranteeing state consistency—risks specific to on-chain systems—make the engineering implementation of ADL far more complex than a database transaction in a centralized environment.
More significant theoretically, Chitra's research identifies the absolute failure boundary of ADL in mathematical terms: the structural bad-debt floor. In the 10/10 event, some small-cap assets encountered a severe liquidity vacuum. The most extreme case appeared in the WLD asset: at one instant, that asset produced a single shortfall gap as high as about $11.56 million, while the maximum deleveraging capacity that all profitable holders of that asset could provide at that moment was only about $2,500 [10]. The gap between the two exceeded 4,600 times, for a coverage ratio of only 0.02%. Under such extreme asymmetry in microstructure, no ADL algorithm, however ingenious (whether queue ranking, pro-rata allocation, or the most advanced risk-weighted allocation), can mathematically fill the loss. This structural bad-debt floor shows that ADL is no panacea. When the market's one-sided tilt reaches an extreme—when a given asset's long and short positions are so severely imbalanced that nearly all participants stand on the same side—the socialization mechanism fails completely, and the system inevitably produces bad debt. Across the entire 12-minute window, at least $16.6 million in losses were structurally uncoverable by any ADL strategy, constituting an irreducible "hard bad-debt floor" [10].
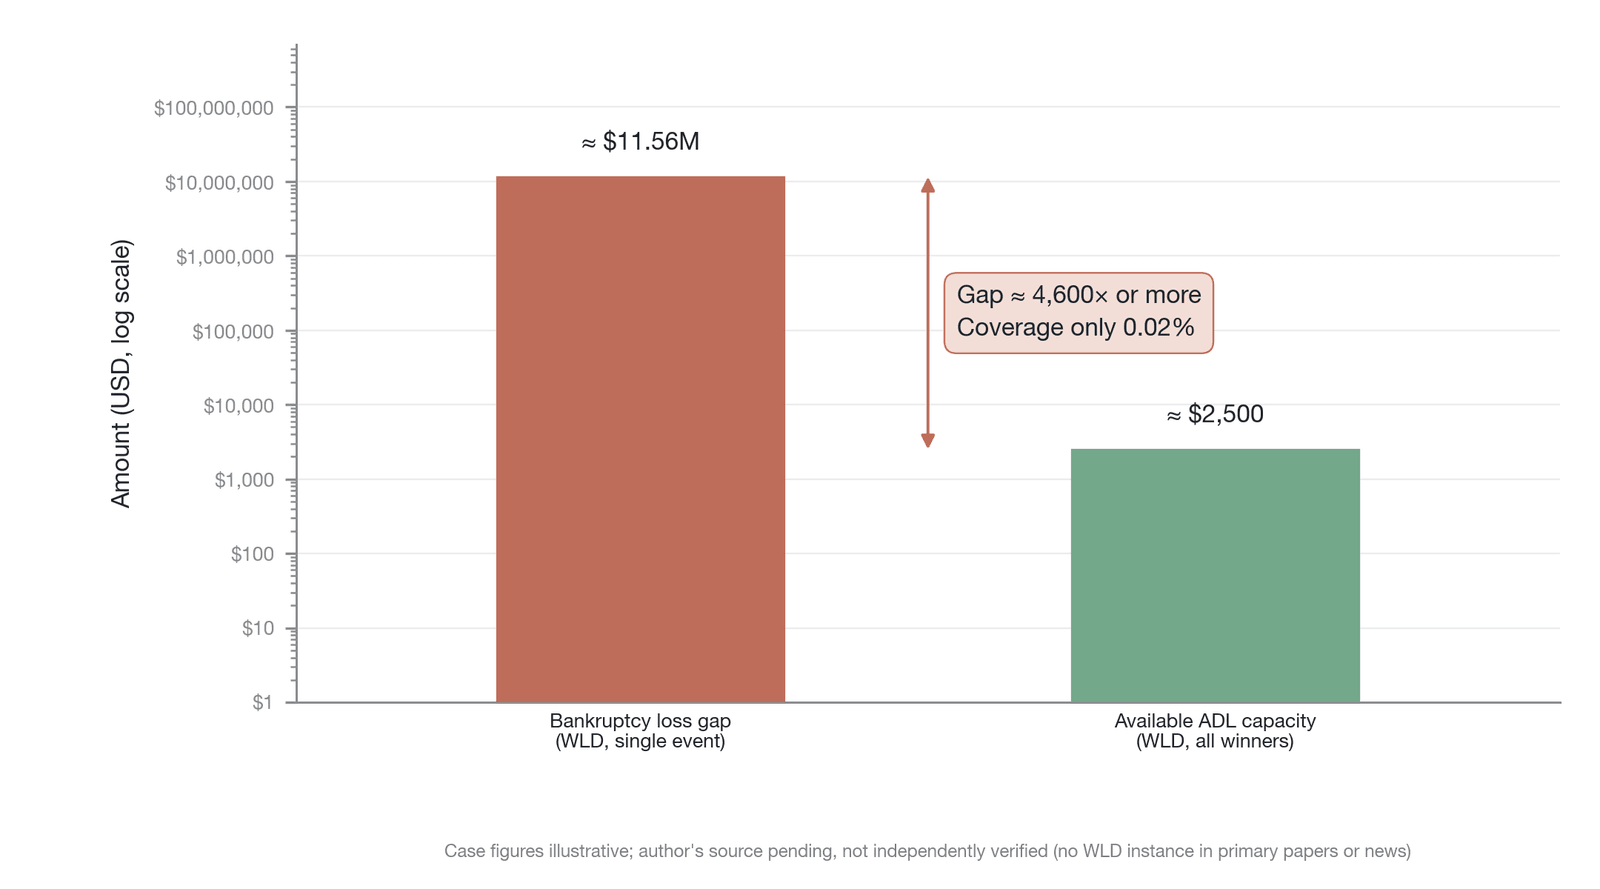
Figure 12-12. WLD's shortfall gap versus available deleveraging capacity (case values are the author's, with sources to be supplemented, or illustrative; neither the primary paper nor news reports contain the WLD instance, which is not publicly measured)
Figure 12-12 presents the stark contrast in this extreme WLD case, illustrating the mathematical failure of the ADL mechanism in the face of a structural liquidity imbalance. This finding carries far-reaching implications for institutional design. It means that even if the ADL algorithm itself is optimized to the extreme, the system's resilience still depends on the upstream mechanisms—including the insurance fund's adequacy ratio, the liquidation engine's efficiency, the prudent setting of risk parameters, and the quality of liquidity management. ADL is only the last resort, not a cure for the underlying condition. As the WLD case reveals, when the underlying liquidity structure itself has a critical flaw, no socialization-allocation mechanism, however ingenious, can avert the loss. This recognition redirects attention from "how to optimize ADL" back to "how to strengthen the upstream defenses," laying an empirical foundation for the later sections' discussion of insurance-fund governance and a re-engineering of the risk waterfall.
12.2.4 ADL as a contrarian indicator
Although ADL means a passive loss of profit and position for traders, in the eyes of professional quantitative institutions and high-frequency market makers the frequency and scale of ADL triggers are a microstructural market signal with analytical value. From the perspective of market microstructure, ADL is in essence the concentrated eruption, at the liquidation level, of a severe scarcity of liquidity and a high concentration of one-sided positions. It is not only a contrarian indicator of an exchange's risk-management level but also a potential leading signal of turning points in the market sentiment cycle. This dual signaling value makes ADL a unique observational window connecting a platform's microstructural risk controls with the market's macro state: by analyzing the pattern of ADL triggers, one can infer both the mechanistic health of the platform and the sentiment extremes of the market.
ADL trigger frequency and scale are a key contrarian indicator of an exchange's overall risk-management level. When a trading platform begins to trigger ADL frequently, it sends the market several clear signals: the platform's insurance fund is exhausted or severely inadequate; its market-maker cohort has retreated, leaving the liquidation engine unable to find sufficient liquidity in the market to absorb bankruptcy orders; its risk parameters may be too aggressive (for example, allowing excessive leverage or listing illiquid long-tail assets); and the efficiency of its liquidation engine may be in question. Frequent ADL triggers suggest an inadequate insurance fund, an inefficient liquidation engine, overly aggressive risk parameters, or poor liquidity management. Conversely, a platform that has never triggered ADL does not necessarily have a well-designed ADL mechanism; rather, it means that its earlier layers of risk control (the margin system, the liquidation engine, and the insurance fund) are effective enough to have absorbed the risk at a more upstream stage.
The value of ADL as a contrarian indicator, however, goes well beyond assessing platform risk. Astute traders often treat ADL as a strong signal of a reversal in market sentiment. When a market crash is accompanied by large-scale ADL alerts, this usually means that panic selling has been exhausted and the short side's momentum is being forcibly consumed through this destructive process. A profitable short position closed by ADL is not executed by sending a buy order to the order book; it is settled off-book through a matched offset (match-off) between counterparties. ADL therefore does not directly generate buy-side order flow and produces no immediate buy-side price impact on the market. Nonetheless, by forcibly reducing short positions, ADL changes the balance of long and short forces in the market; moreover, if a trader who has been ADL'd loses their position and chooses not to rebuild it, this is tantamount to indirectly removing part of the sell-side force in the market. This indirect rebalancing of forces often produces a supportive effect on price after the peak of an ADL wave, driving a rebound or reversal. Conversely, at a bull-market top, if long positions begin to suffer ADL, it indicates that long leverage has reached a ceiling the system cannot bear, unsupported by real capital. This forced deleveraging, triggered by the collapse of the liquidation mechanism, is often a precursor to the end of the trend and an impending deep correction. In this sense, ADL is not only an exchange's final mechanism for maintaining solvency but also a structural catalyst for the market sentiment cycle to shift from excessive optimism toward mean reversion.
As the WLD case reveals, however, even an optimal ADL algorithm is powerless in the face of a structural shortage of liquidity. The effectiveness of ADL as a contrarian indicator rests on one premise: that sufficient opposing positions still exist in the market to be deleveraged. When this premise breaks down—when a given asset's long and short positions are extremely imbalanced and nearly all participants stand on the same side—ADL can neither save the system nor provide a meaningful reversal signal. In such an extreme case, an ADL trigger marks a structural market failure rather than a cyclical sentiment extreme. Therefore, when using ADL as a trading signal, one must combine it with an in-depth analysis of the underlying liquidity structure, distinguishing a "sentiment-driven extreme" (a high probability of reversal after ADL) from a "structure-driven collapse" (possible further deterioration after ADL). This discriminating ability constitutes a core competitive advantage for professional traders in extreme conditions. The effectiveness of ADL as a contrarian indicator may itself decay as market participants learn—a classic manifestation of Goodhart's law in the domain of trading signals. If the pattern of "the market reverses after an ADL trigger" becomes widely recognized and traded upon, the signal's information content will gradually be replaced by a coordination effect. Worse, an attacker could deliberately trigger ADL to induce herd buying and then take profit in the rebound. The signaling value of ADL must therefore be evaluated dynamically within the framework of Lo's (2004) adaptive markets hypothesis, rather than treated as a static structural regularity [12].
12.3 The confidence-as-liquidity hypothesis
In analyzing systemic risk in derivatives markets, traditional financial models tend to focus on the absolute size of capital and the efficiency of the liquidation algorithm. In a crypto market that lacks a central bank as lender of last resort, however, the effectiveness of an insurance fund depends not merely on its book balance but, more importantly, on the confidence it establishes in the minds of market participants. This section proposes the confidence-as-liquidity hypothesis, which argues that under extreme market conditions the size of the insurance fund is itself a strong market signal: by shaping the confidence of traders and market makers, it directly determines the market's liquidity depth and, in turn, the system's true capacity to withstand shortfall risk. The insurance fund's "signaling function" carries more economic weight than its "absorption function." Confidence management is, in essence, risk management.
12.3.1 The transmission mechanism
As one of the market's few publicly observable indicators of systemic health, the insurance-fund balance transmits complex signals with every fluctuation of its figures. This signal acts directly on the belief layer of market participants, which changes their behavior and ultimately reshapes the entire market's liquidity environment. We can decompose this transmission process into four layers: the signal layer, the belief layer, the behavior layer, and the outcome layer.
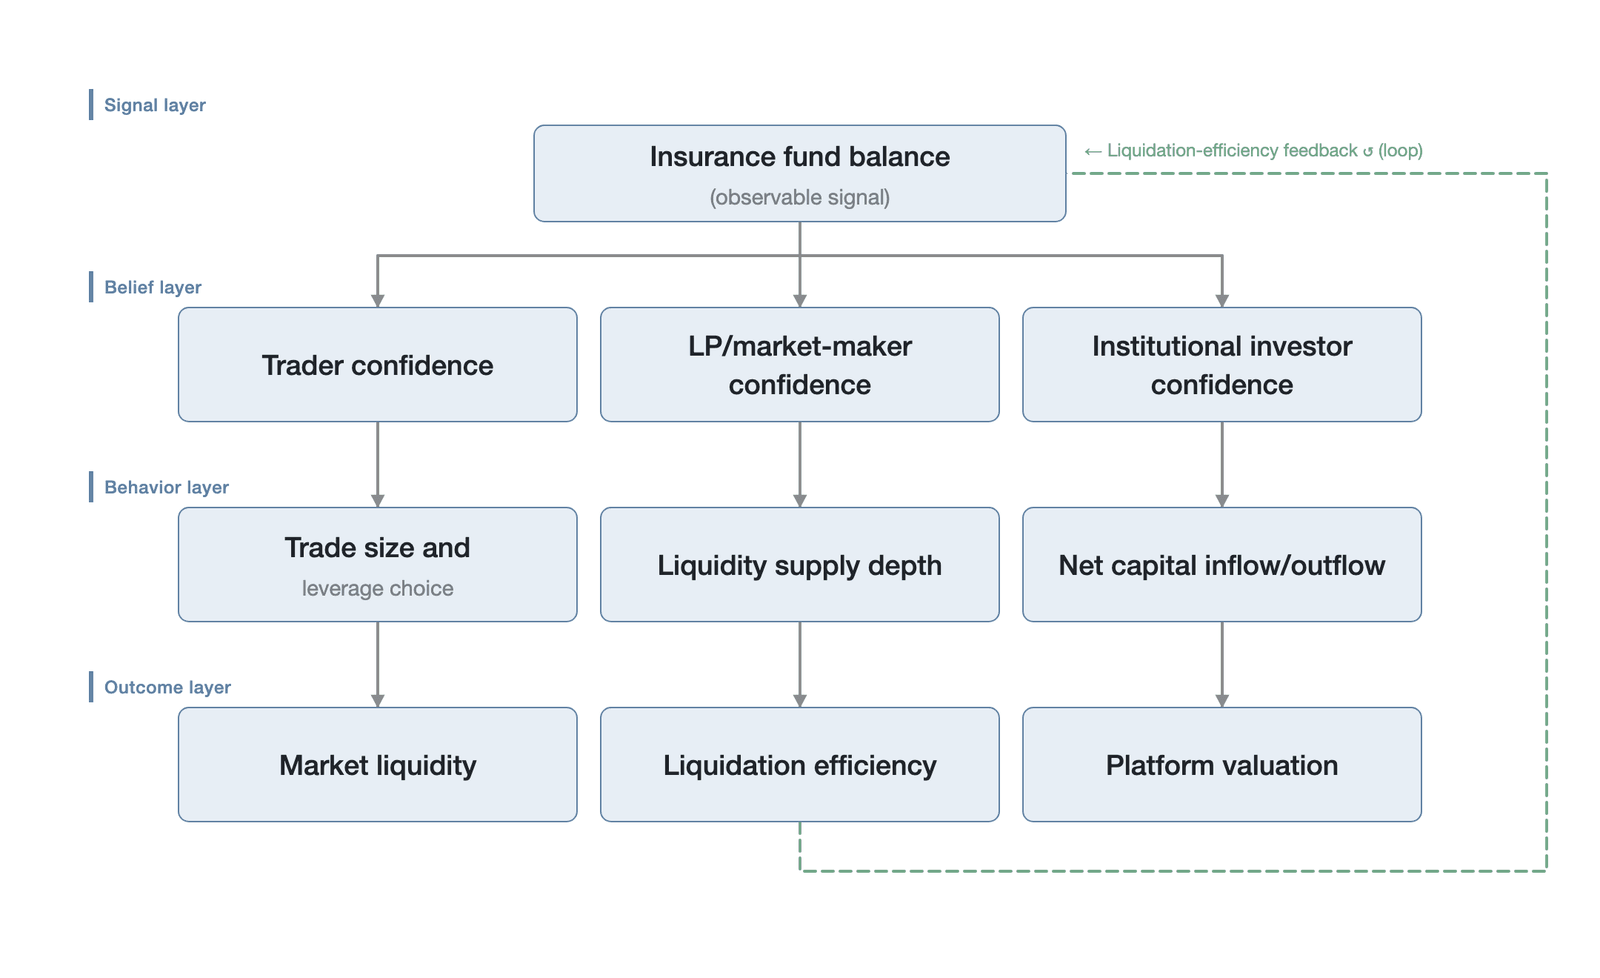
Figure 12-13. The confidence transmission mechanism of the insurance-fund balance
As shown in Figure 12-13, the observable insurance-fund balance signal acts in turn on the belief layer, the behavior layer, and the outcome layer, and forms a closed loop through the feedback of liquidation efficiency on the fund balance.
In the positive transmission chain, when market participants regard the insurance fund as "ample," a series of positive chain reactions unfolds. Users believe the system can withstand extreme events; market makers, facing lower shortfall risk, are willing to quote narrower bid-ask spreads; liquidity providers are willing to keep more capital in the vault (because they believe extreme losses will be absorbed by the fund); and traders are willing to hold larger positions and choose higher leverage. The consolidation of these beliefs translates directly into positive market behavior: trading volume expands, liquidity supply deepens, and capital keeps flowing in on a net basis. Finally, at the outcome layer, the market exhibits abundant liquidity and excellent liquidation efficiency—deeper liquidity, narrower spreads, and higher market quality. Efficient liquidation in turn keeps shortfall losses to a minimum, further protecting the insurance-fund balance and forming a virtuous ecological cycle.
The reverse transmission chain presents the exact opposite picture. When the insurance fund is regarded as "inadequate," or its governance is called into question, fear propagates in reverse along the same chain. Users worry that an extreme event could trigger ADL or a system collapse; market makers quickly widen spreads and cut quoting depth to demand higher risk compensation; liquidity providers withdraw capital from the vault ("I am unwilling to bear a risk I do not understand"); and traders reduce their positions ("I am not sure the platform is safe"). The end result is shrinking liquidity, widening spreads, and a sharp decline in market quality. The deterioration of liquidity in turn further lowers liquidation efficiency, raises shortfall risk, and places even greater pressure on the insurance fund.
12.3.2 The positive feedback loop
When the market suffers a sudden black-swan event that causes the insurance fund to shrink markedly, an extremely dangerous positive feedback loop of confidence collapse can be triggered. In traditional financial markets, such a loop is usually broken forcibly by emergency intervention from regulators or by a central bank's liquidity injection; but in a decentralized or inadequately regulated crypto market, this loop often evolves in free fall until some external force intervenes or the system collapses completely. This process closely parallels the classic mechanism of a bank run. More specifically, Diamond and Dybvig (1983), in their classic bank-run model, revealed the existence of multiple equilibria: in the "good equilibrium," depositors believe the bank is solvent and do not run, so the bank continues to operate; in the "bad equilibrium," depositors expect others to run and therefore rationally choose to withdraw first, so the run becomes a self-fulfilling prophecy [13]. Mapping this framework onto the behavior of insurance-fund LPs: when LPs believe the HLP vault's risk exposure is manageable, keeping capital in place constitutes the "good equilibrium"; but once LPs expect other LPs to withdraw in panic, even if the fund remains fundamentally adequate, a rational LP will choose to exit early to avoid being the last one out—which is precisely the dynamic depicted in the Hyperliquid whale incident of Section 12.3.3.
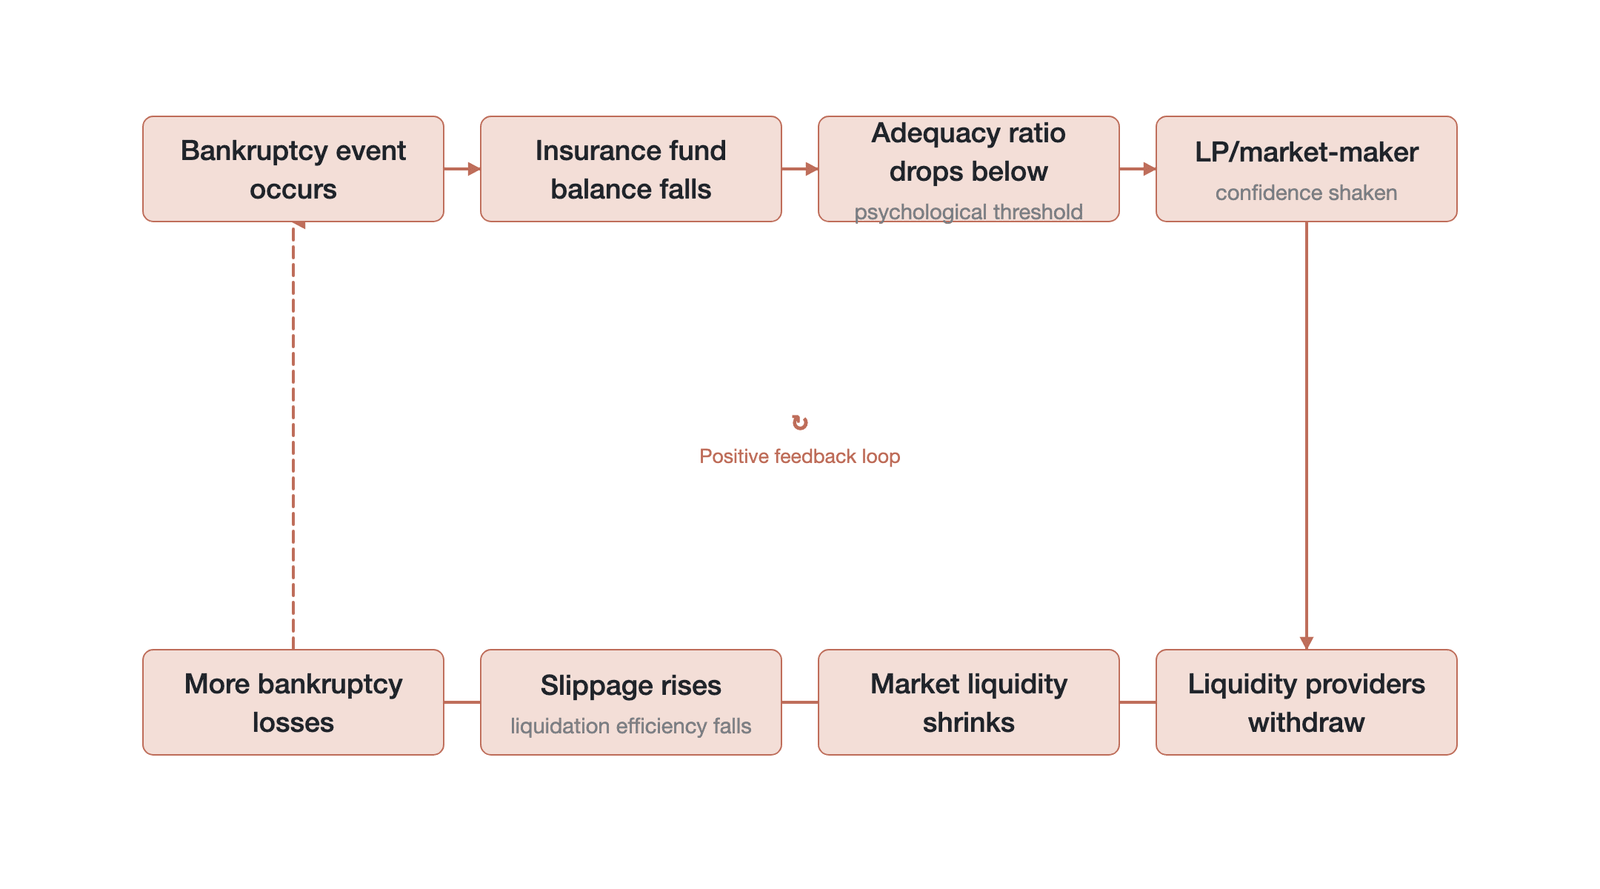
Figure 12-14. The positive feedback loop of confidence collapse and liquidity evaporation
The starting point of the loop is usually a massive liquidation the market fails to absorb smoothly, so that shortfall losses hit the insurance fund directly. When the fund balance falls and drops below participants' psychological expectation threshold, panic begins to spread among liquidity providers. To avoid potential systemic risk, market makers and liquidity providers instinctively choose to cancel orders and withdraw capital. The sudden withdrawal of liquidity further worsens an already fragile market depth. With insufficient buyers to absorb the flow, subsequent liquidation orders can only fill with greater slippage, which not only accelerates the crash in asset prices but also produces more severe shortfall losses. These new shortfall losses are again borne by the insurance fund, causing its balance to plunge further and triggering a new, more intense round of panic and withdrawal.
In this vicious cycle, the loss of confidence is directly equivalent to the evaporation of liquidity. The positive feedback loop keeps running until the vault shrinks to some minimum viable size, or confidence is restored by some external intervention—whether an emergency adjustment of protocol parameters, an injection of external capital, or transparent communication from the core team. Once the spiral begins, however, the cost and difficulty of breaking it rise sharply. This is precisely why preventive confidence management is far more important than after-the-fact crisis rescue.
12.3.3 Empirical evidence of the confidence multiplier
The Hyperliquid whale liquidation incident of March 2025 [14] provides quantitative empirical support for the confidence-as-liquidity hypothesis. The incident showed how a book loss can be amplified dozens of times through the confidence transmission mechanism, ultimately evolving into a severe liquidity crisis.
The incident began when a whale trader, at an address starting with 0xf3F, built a long Ethereum position on the Hyperliquid platform with a notional value exceeding $300 million (Arkham basis; at a liquidation price of about $1,915 and roughly 113,000 ETH, this works out to about $210 million, the difference stemming from different pricing at the position peak versus at the liquidation moment), opening at a notional leverage as high as 50x. When the market price moved unfavorably, the trader did not close out in the usual way but actively triggered the system's forced liquidation by strategically withdrawing collateral. The trader's choice of a "strategic liquidation" path rather than closing directly on the order book had a clear economic rationale: for a massive position with a notional value exceeding $300 million, closing directly at market would have caused a price impact of hundreds of basis points on the liquidity-limited order book, whereas transferring it to HLP through liquidation externalized this slippage cost to the liquidity providers. In essence, this was a form of arbitrage against the liquidation mechanism, using a gap in the rules to convert a private trading cost into a socialized loss borne by the public pool. Ultimately, the position was liquidated at a price of about $1,915, and the trader exited having cashed out a profit of about $1.8 million. Because the position was too large, however, the liquidity of the platform's public order book could not fully absorb this liquidation order, forcing the remaining position to be transferred to Hyperliquid's liquidity provider vault for backstop liquidation.
In handling this massive position, the HLP vault suffered an actual loss of about $4 million due to enormous market slippage, roughly 1% of the vault's total size (about $450 million to $480 million before the event). In a crypto derivatives market with trading volumes routinely in the hundreds of millions, an absolute loss of $4 million hardly seems fatal. Yet this loss triggered a strong psychological shock among liquidity providers. Vault participants suddenly realized that, as passive risk-bearers of an automated market maker, they not only shared in the trading-fee income but could also be forced to absorb this kind of hard-to-handle, high-risk liquidation order flow in extreme situations, bearing enormous socialized losses. Even more unsettling, the scale and frequency of this risk had not been fully understood or anticipated beforehand. The driver of the panic was not that "a $4 million loss is unacceptable," but rather the sudden realization that one's capital was exposed to a risk one did not fully understand, that even greater losses might occur in the future, and that it would be better to withdraw first.
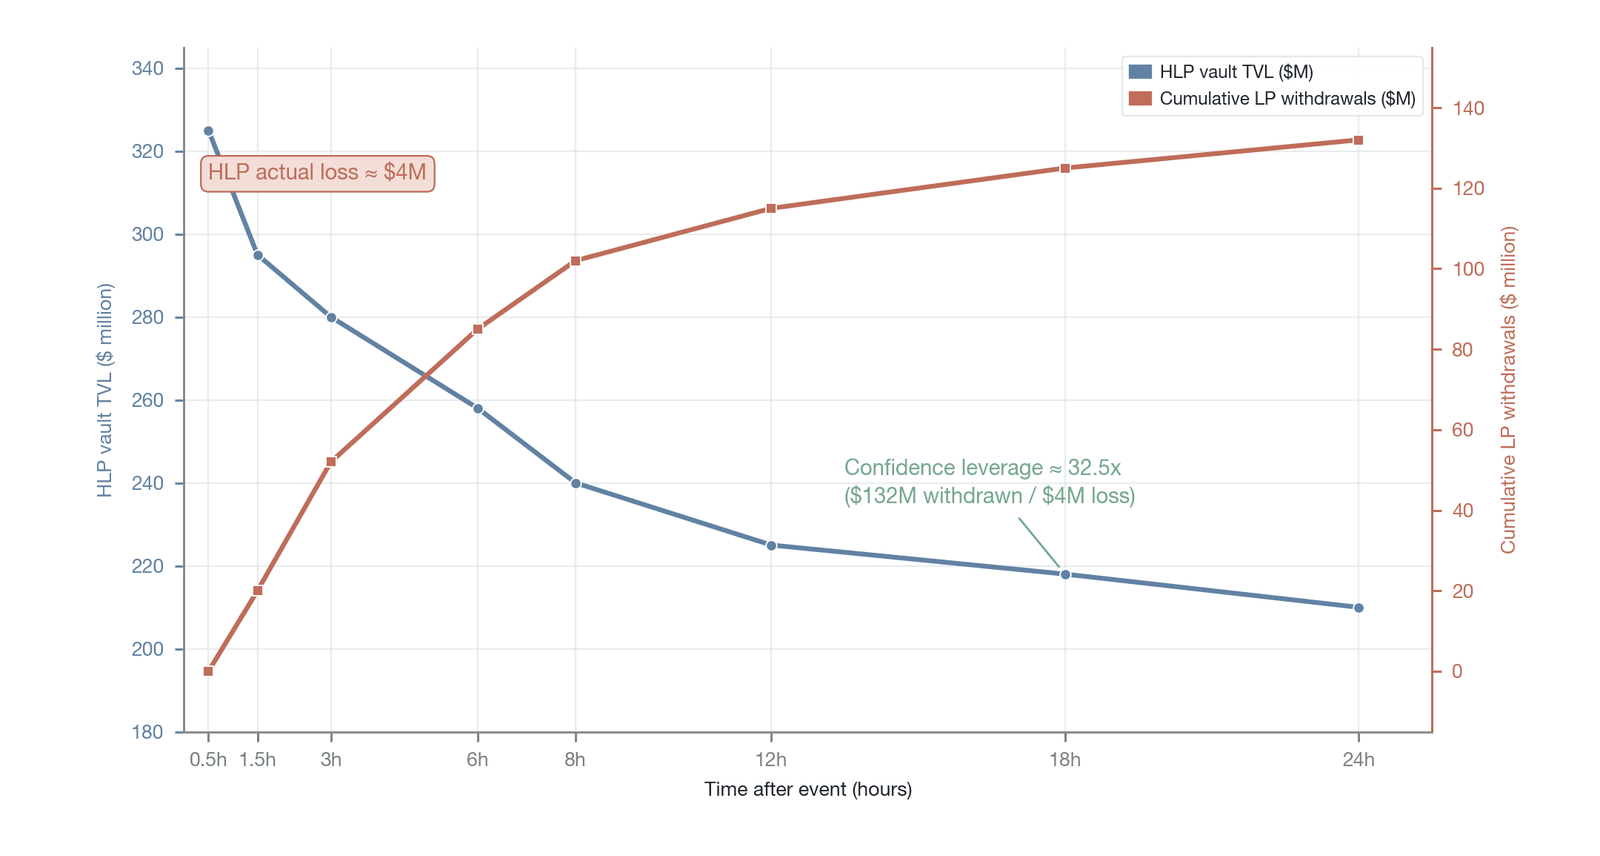
Figure 12-15. The confidence-leverage effect in the Hyperliquid whale incident (the intermediate series of HLP vault TVL and cumulative withdrawals is an on-chain estimate for illustration, with only the endpoints and the 32.5-times figure verified; 32.5 times is a correlational amplification, not strict causation)
The scissors gap between the two curves in Figure 12-15 captures the divergence between the decline in the HLP vault's TVL and the cumulative LP withdrawals.
Panic quickly turned into a run. Within 24 hours, more than $130 million was withdrawn in panic from the liquidity provider vault. A book loss of $4 million was accompanied by a liquidity outflow of $130 million, a ratio of about 32.5 times (this book's estimate, defined as the secondary panic-redemption amount divided by the primary direct vault loss). This striking correlational amplification factor reveals how fragile liquidity providers' confidence is in a decentralized architecture.
The correlational amplification factor of about 32.5 times (a correlation measure, not a strict causal estimate) far exceeds the amplification of capital leverage: 50x leverage merely magnifies margin by 50 times, whereas confidence-related amplification expands the book loss more than 30-fold—and this "leverage" is not constrained by any margin system.
The 32.5-times confidence multiplier above comes from a single event (the March 2025 whale liquidation) on a single platform (Hyperliquid), and its external validity is subject to several limitations. First, as a newly emerging decentralized platform, Hyperliquid's LP cohort may differ systematically in risk perception and behavior from the LPs of mature centralized-exchange (CEX) platforms, who typically have richer experience with extreme events and higher risk tolerance. Second, the event occurred during Hyperliquid's early growth stage, when the platform had not yet experienced a similar shortfall event, and the LPs' panic stemmed partly from the "cognitive shock of first risk exposure," a factor that may weaken in subsequent similar events. Moreover, the 32.5-times amplification factor must also be treated with caution in causal attribution: LP withdrawal behavior may have been driven simultaneously by a contemporaneous decline in macro risk appetite (such as the Fed policy-expectation shift of March 2025), the viral spread of panic narratives on social media, changes in competing platforms' yields, and other factors, rather than being a pure confidence response to Hyperliquid's single event. If other DeFi protocols also experienced synchronous TVL declines over the same period, then part of the LP withdrawals can be attributed to a systemic deterioration in risk appetite rather than a platform-specific confidence shock. The 32.5 times should therefore be understood as a "correlational amplification factor" after multiple factors are superimposed, and the multiplier actually attributable to pure confidence transmission may be considerably lower; it should be regarded as an observed value under specific conditions rather than a universal constant. Building a more robust confidence-leverage model would require systematic empirical comparison across platforms (CEX and DEX), across event types (manipulative shortfalls versus market-driven shortfalls), and across market cycles (bull and bear). Even so, even if the true confidence multiplier varies substantially across contexts, the core qualitative conclusion revealed by the Hyperliquid incident—that the amplification effect of a confidence shock far exceeds the book loss itself—remains robust.
The core mechanism revealed by the Hyperliquid whale incident is that the loss of confidence is not a linear response to "losses already incurred" but a fearful amplification of "losses that may occur in the future." The magnitude of the fear is severely disproportionate to the loss already incurred. A tiny crack in the books, once it touches participants' trust in the system's safety boundary, triggers a large-scale flight of capital. This nonlinear amplification effect has a solid theoretical basis in behavioral finance. Kahneman and Tversky's prospect theory holds that the psychological weight of a loss is about twice that of an equivalent gain [15], and in scenarios involving the perception of systemic risk this asymmetry may be amplified further. Liquidity providers' decisions are based not on a precise calculation of realized losses but on a subjective probability estimate of the worst future scenario. When an unexpected loss event updates their cognitive model of the system's fragility, their subjective probability of extreme future losses rises sharply, triggering a withdrawal far exceeding the actual loss. Prospect theory explains the psychological basis of panic from the angle of individual cognitive bias, but it overlooks the key amplifier of panic transmission in crypto markets: the information-cascade effect of social media. The herd-behavior theory of Banerjee (1992) and Bikhchandani et al. (1992) reveals that in an environment of information uncertainty, individuals rationally choose to follow others' behavior while ignoring their own private information [16][17]. Among crypto LP cohorts sharing the same Discord channels and Twitter feeds, the behavior of a few early withdrawers may, through an information cascade, trigger exponentially growing follow-on withdrawals, with an amplification effect far exceeding loss aversion at the individual level. If the temporal distribution of LP withdrawals exhibits the typical features of a cascade (a few early movers triggering exponential growth in followers), then social-media-driven herd behavior may be the dominant amplification mechanism behind the correlational amplification factor. This evidence shows that the "signaling function" of an insurance fund (or market-making vault) carries more economic weight than its "absorption function."
12.3.4 Confidence management as risk management
Faced with the enormous destructive power of the correlational amplification effect of confidence transmission, exchanges and decentralized protocols must elevate "confidence management" to a strategic priority on par with "balance-sheet management." For the operators of insurance funds and market-making vaults, managing confidence may be as important as managing capital—perhaps more so. The core of confidence management lies in stabilizing participants' expectations of the system's risk-absorption capacity through institutional design and transparency-building.
Effective confidence management depends first on a transparent communication mechanism. When a shortfall event occurs, the platform must promptly and accurately inform liquidity providers and users of the scale of the loss, its cause, and the countermeasures. An information vacuum breeds panic. As Shiller's (2019) narrative economics points out, the "viral narratives" that form in an information vacuum (such as "the protocol is about to go bankrupt" or "the team has already absconded") propagate in a dynamic closer to an epidemiological model, with contagiousness correlated with emotional arousal rather than with factual accuracy [18]. When participants cannot obtain authoritative firsthand information, speculation and rumor on social media quickly fill the void and amplify fear. In the Hyperliquid whale incident, the community's misreading of the nature of the event and its excessive worry about the system's safety stemmed in large part from the lag and incompleteness of information dissemination. Equally important as after-the-fact communication is the ex ante setting of expectations: before liquidity providers deposit capital, a platform should clearly convey "the extreme loss scenarios your capital may face," so that LPs make an "informed" decision when depositing rather than "suddenly discovering" in a crisis that they are exposed to unanticipated risk. In the Hyperliquid incident, many LPs panicked precisely because they had not previously understood the tail risk that the HLP vault bears as the backstop liquidator. Had these risks been fully disclosed and quantified in advance, the degree of panic would very likely have been much lower.
Another core issue in confidence management is the selective disclosure of the adequacy ratio. Publishing the insurance fund's actuarial adequacy ratio can enhance transparency, but if the adequacy ratio is poor, publishing it may instead trigger panic. This trade-off between transparency and stability parallels the "constructive ambiguity" strategy of central banks in traditional finance. A central bank does not always publish its full assessment of the banking system's fragility, because excessive transparency can, in some circumstances, become a self-fulfilling prophecy. For crypto-market insurance-fund managers, the key is to find a balance point: providing enough information for market participants to make rational judgments while avoiding the release, at sensitive moments, of signals that could be over-interpreted.
In addition, platforms need to build multi-layered defense in depth. A single insurance-fund pool is easily and quickly exhausted in the face of an extreme shock, triggering panic. By introducing an auto-deleveraging mechanism as a safety valve, establishing tiered and segregated insurance pools, and introducing external insurance capital, a platform can effectively slow the spread of risk and buy a precious window of time for market confidence to recover. The FTX affair, from the opposite direction, confirms the institutional value of confidence management. According to the court testimony of co-founder Gary Wang [19], the insurance-fund size that FTX displayed to the outside world was entirely fabricated data generated by a formula containing a random number, bearing no relation to the fund's true balance. At one moment, FTX claimed the fund held $5.5 million and 5 million FTT tokens, when in fact the fund held no FTT at all. This fraud reduced the insurance fund from a risk-management tool to a mere instrument of false marketing, and when the truth came out it ultimately dissolved the foundation of user trust in the platform.
12.3.5 The cliff effect
A pronounced nonlinear feature exists between insurance-fund size and market confidence, which can be summarized as the "cliff effect." This effect indicates that market confidence does not decay smoothly and linearly as the insurance fund's adequacy ratio declines; rather, it collapses in cliff-like fashion within a specific threshold range. This nonlinear feature closely parallels the effect of bank capital adequacy on depositor confidence in traditional finance. The reason the minimum capital requirements under the Basel III framework are set at specific levels is precisely that regulators recognized that the impact of a decline in capital adequacy on market confidence is not linearly incremental but exhibits an exponential amplification near a critical point. In crypto derivatives markets, because there is no deposit-insurance system and no lender of last resort, this nonlinear feature manifests even more dramatically.
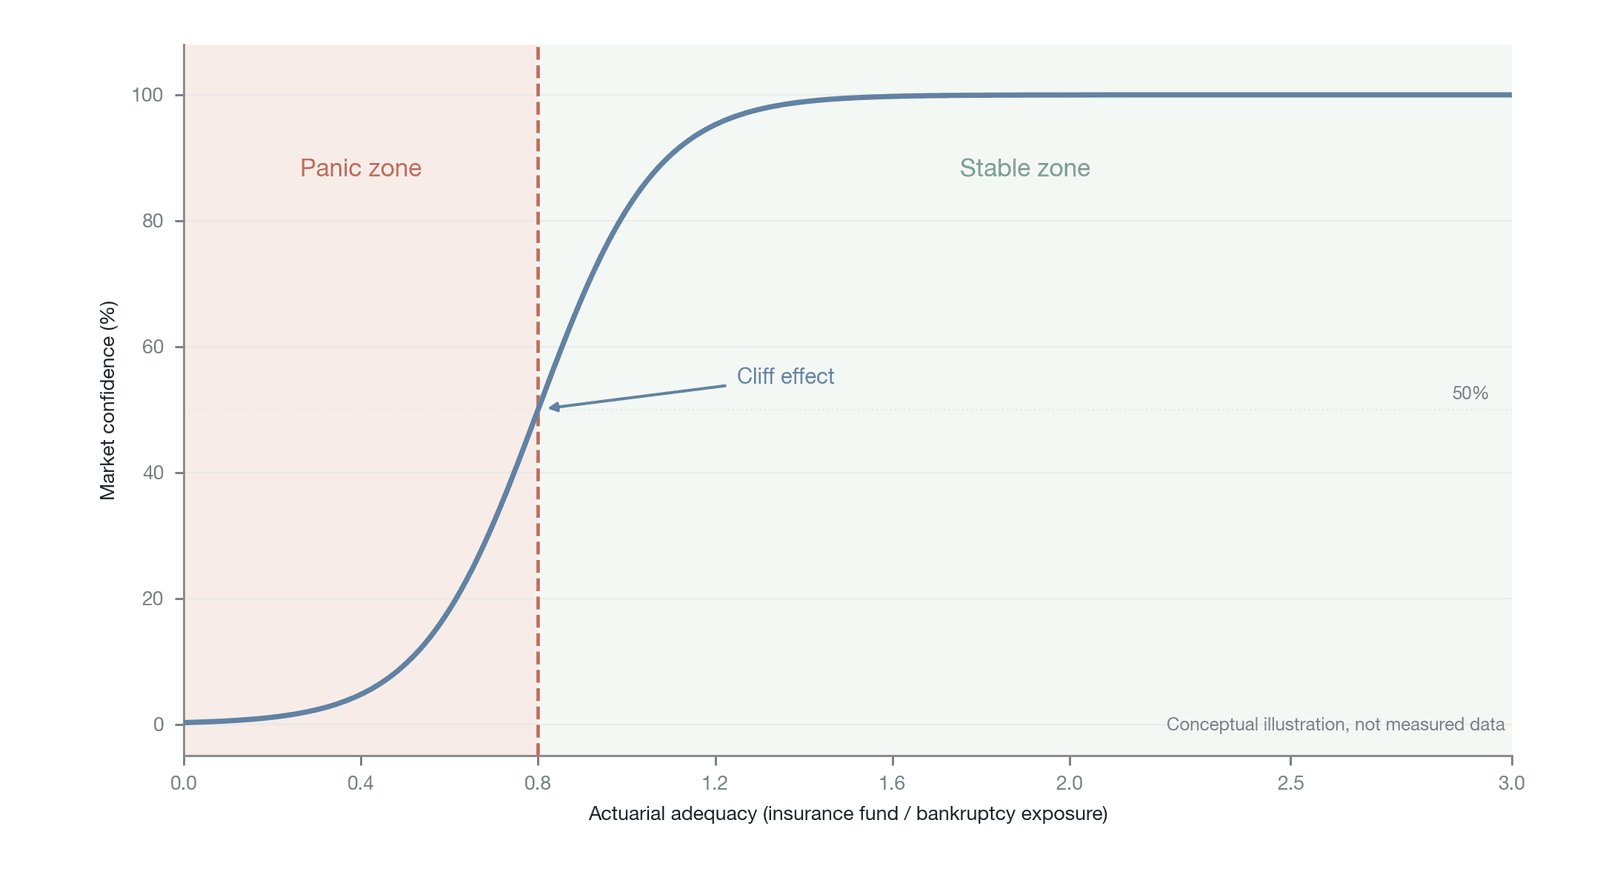
Figure 12-16. The nonlinear relationship between insurance-fund adequacy ratio and market confidence (conceptual illustration, not measured data; the threshold is an illustrative critical band, not a precise critical point, and the text likewise stresses that the threshold cannot be known precisely in advance)
We can define the actuarial adequacy ratio as the ratio of the insurance fund's current size to the maximum shortfall loss that might arise under expected extreme market conditions (measured by value at risk, VaR, or expected shortfall, ES). The academic roots of this definition trace back to the classic Cramér-Lundberg ruin model in actuarial science [20]. In that model, the insurance fund's balance is modeled as a stochastic process: premium income (corresponding to the steady inflow of liquidation penalties) grows at a constant rate, while claims (corresponding to shortfall losses) arrive as a compound Poisson process. The ruin probability (the probability that the fund balance first falls below zero) depends on the ratio of the premium rate to the claim intensity and on the tail distribution of claim sizes. Applying this framework to a crypto derivatives insurance fund, the key modeling choice lies in the selection of the tail-risk measure: VaR measures the quantile threshold of losses at a given confidence level (the loss level exceeded with only a $1 - \alpha$ probability) but ignores the severity of losses beyond that threshold, whereas ES (also known as CVaR) measures the conditional expected loss beyond the VaR threshold and better captures the "tail of the tail" extreme risk. Given the heavy-tailed character of the crypto market's shortfall-loss distribution (for example, WLD's single shortfall gap of about $11.56 million in the 10/10 event far exceeded that asset's VaR estimate of shortfall loss), ES is therefore a more prudent and appropriate choice of measure than VaR. Furthermore, if the shortfall-loss distribution exhibits a power-law tail (tail index ), then even ES may face the challenge of unstable estimation, requiring extreme-value-theory methods (such as fitting a generalized Pareto distribution) for more robust tail-risk modeling. The chapter's later adequacy analysis will therefore prioritize ES as the benchmark denominator. In operationalizing this definition, key parameter choices include the confidence level (99.5% or 99.9%, whose estimates may differ severalfold under a heavy-tailed distribution) and the time window of the extreme scenario (the maximum single-day loss or the cumulative loss over several consecutive days). These parameter choices have an enormous impact on the numerical value of the adequacy ratio, so cross-platform comparisons must ensure the use of a consistent parameter baseline. Two core assumptions of the classic Cramér-Lundberg model face significant departures in crypto markets. First, the model assumes that claim arrivals follow a compound Poisson process (that is, claim events are mutually independent), but shortfall events in crypto markets are highly clustered—for example, 1,097 ADL shocks within 12 minutes in the 10/10 event—and this tail clustering severely violates the independence assumption of Poisson arrivals, requiring self-exciting models such as the Hawkes process to more accurately capture the clustering of shortfall losses. Second, the model assumes a constant premium rate (corresponding to liquidation-penalty income), but insurance-fund income is itself procyclical (higher in bull markets, and potentially negative in extreme conditions precisely because liquidation volume surges while payouts explode simultaneously), and this co-movement of income and expenditure further weakens the model's applicability. When the adequacy ratio is at a high level (that is, in the stable zone), market participants generally take the system's safety for granted. Within this zone, whether the insurance fund grows or shrinks by tens of millions of dollars has no material effect on market confidence. Traders' and market makers' attention is focused mainly on finding trading opportunities and optimizing market-making strategies, and the fund's existence draws no attention.
When frequent shortfall events cause the insurance fund to be continuously depleted, however, and the adequacy ratio approaches and drops into a certain psychological threshold range, the situation changes dramatically. Within this narrow range, even a tiny further loss is amplified by the market and interpreted as a precursor to the system's imminent bankruptcy. At this point, market sentiment flips instantly from "absolutely safe" to "extreme panic," and participants' behavior shifts from seeking profit to fleeing at any cost. This sharp collapse of confidence directly triggers the liquidity withdrawal and positive feedback loop described earlier, ultimately leading to a comprehensive collapse of the system. From "no one cares" to "everyone panics," there is almost no smooth transition zone in between.
A key feature of the cliff effect is that the location of the threshold cannot be known precisely in advance. It depends on multiple factors: user psychology, the market environment, the memory effect of recent events, and the emotional amplification of social media. In a bull market, participants' risk tolerance is higher, and the threshold may be pushed to a lower level; in a bear market, or just after a major security incident, the threshold shifts markedly upward, and the system becomes more fragile. This uncertainty means that insurance-fund managers face a challenge that "cannot be precisely optimized": staying above the threshold requires an ample safety margin, but too high a safety margin means a loss of capital efficiency.
As shown in Figure 12-6, different exchanges differ enormously in insurance-fund size and relative adequacy ratio. Binance, with an absolute size exceeding $2.3 billion, far surpasses other platforms, but in terms of the ratio of fund size to total open interest, the picture changes markedly. Hyperliquid's relative ratio of about 18.6% (calculated on total HLP TVL) far exceeds Binance's 6.6% (OKX, because it discloses only a security fund rather than a futures liquidation insurance fund, has a ratio that is not comparable on a like-for-like basis; see Section 12.5), but as noted earlier this ratio may be overstated because of the distinction between total HLP TVL and the liquidation vault's standalone size. Even so, this difference still reflects that decentralized platforms, lacking centralized credit backing, must rely on a thicker capital buffer to sustain community confidence. For a decentralized protocol, the relative size of the insurance fund is the on-chain equivalent of its credit rating.
The significance of understanding the cliff effect lies in its warning to risk managers: one must never wait until the insurance fund is about to be exhausted before taking remedial measures. Once the system falls off the cliff, the cost of rebuilding confidence will be astronomical, far exceeding the capital cost of maintaining an ample safety margin in advance. A platform must therefore set an ample safety buffer at the edge of the cliff and, when the adequacy ratio touches the warning line, decisively initiate capital replenishment or a risk circuit breaker, resolutely defending that fragile yet decisive psychological line. It is thus evident that managing an insurance fund is both an actuarial problem and a problem of confidence governance and institutional constraint.
Synthesizing the foregoing analysis of confidence transmission, the positive feedback loop, and the cliff effect, we can construct a unified theoretical framework to explain how insurance-fund depletion triggers a nonlinear system collapse. This framework comprises two levels of mechanism: a macro-level threshold effect and a micro-level amplification mechanism. At the macro level, the cliff effect implies that the insurance fund's adequacy ratio has a critical threshold, below which market confidence undergoes a phase transition, jumping irreversibly from a "stable equilibrium" to a "panic equilibrium." At the micro level, confidence collapse is transmitted through three amplification channels: market-maker withdrawal leading to liquidity evaporation (price-impact amplification), LP runs further weakening the insurance buffer (capital-buffer amplification), and trader deleveraging aggravating order-flow imbalance (liquidation-cascade amplification). The coupling of the macro threshold and micro amplification produces the characteristic nonlinear collapse dynamic: once the adequacy ratio breaks below the critical point, the three micro amplification channels activate simultaneously, and the positive-feedback interaction among them makes the system's recovery path far longer than its collapse path—which is precisely why "the cost of rebuilding confidence is dozens of times the cost of maintaining it." This "macro threshold plus micro amplification equals nonlinear collapse" framework provides a unified analytical lens for understanding the failure modes of insurance funds in successive crypto-market crises, and it also furnishes a theoretical anchor for the later sections' discussion of re-engineering the risk waterfall.
12.4 The governance dilemma and the governance spectrum
One of the core contradictions of crypto derivatives markets is that the system must respond to extreme and unpredictable market risk, which often requires granting managers some form of discretion; yet at the same time, the core of the crypto ethos is "code is law," which stresses the elimination of human intervention and trust assumptions. This contradiction is especially prominent in the management of insurance funds and the design of liquidation mechanisms, forming a governance dilemma that is difficult to reconcile. Just as central banks in traditional finance perpetually oscillate between "rules" and "discretion," crypto derivatives platforms likewise face the challenge of finding a balance between certainty and flexibility. Because of the immutability of blockchain technology and the automatic execution of smart contracts, however, the search for this balance becomes more complex and fraught with tension.
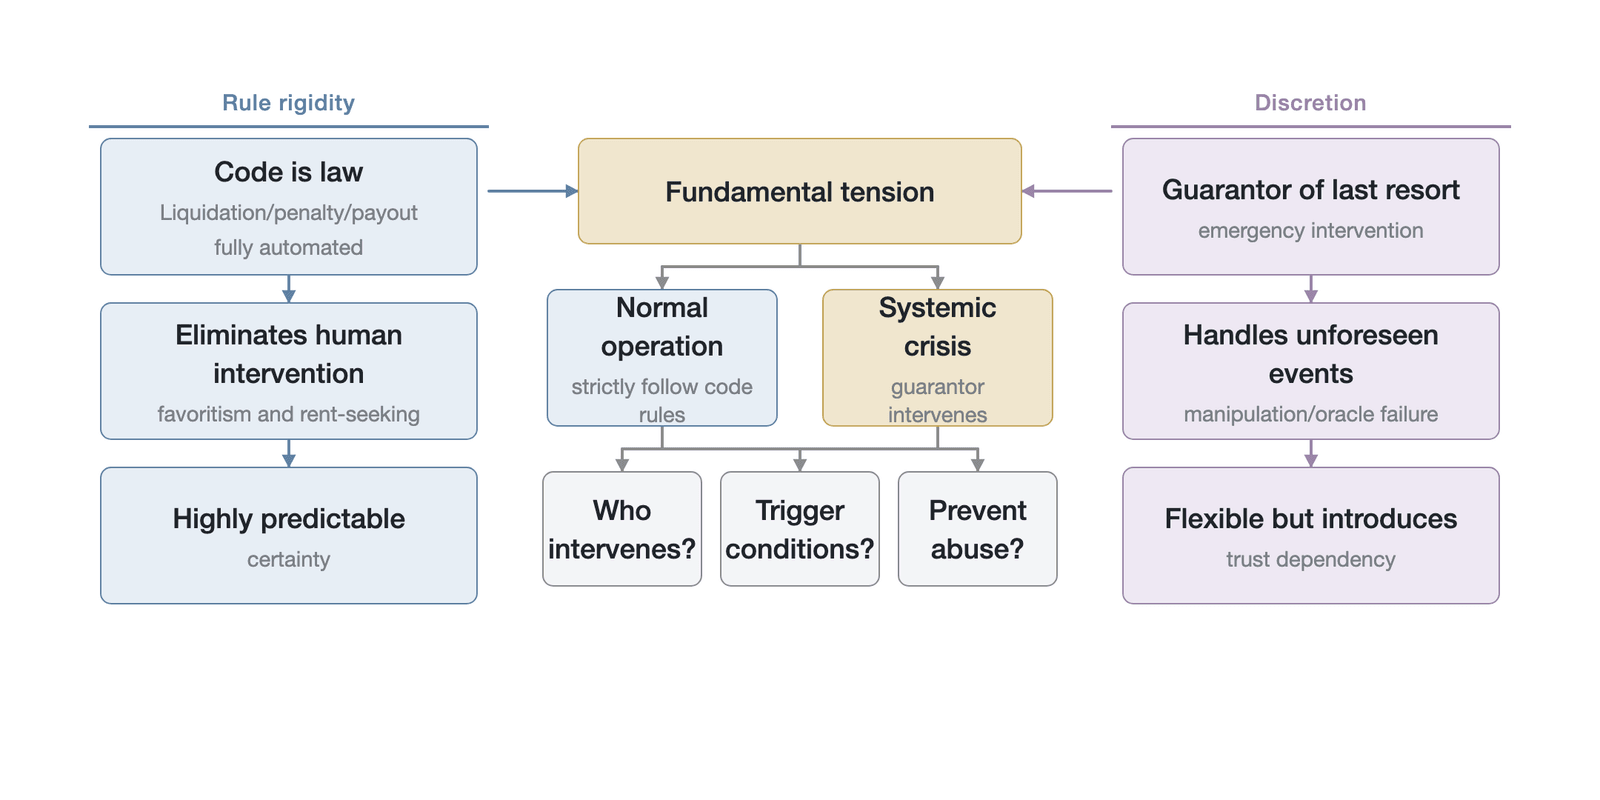
Figure 12-17. The tension between rule rigidity and discretion in insurance-fund governance
12.4.1 The limits of rule rigidity
"Code is law" is the cornerstone of decentralized finance. In an ideal decentralized derivatives platform, the triggering of liquidation, the collection of penalties, insurance-fund payouts, and the execution of auto-deleveraging should all be completed automatically by pre-written smart contracts. This rule rigidity brings a high degree of certainty and transparency, thoroughly eliminating the moral hazards common on centralized platforms—black-box operations, favoritism toward large clients, or internal rent-seeking. Before participating in the market, a trader can know clearly at what price they will be liquidated and how large a penalty they will face, and no one can arbitrarily change these rules.
The complexity of financial markets, however, often exceeds the preset range of code logic. The greatest limitation of rule rigidity is its inability to respond effectively to "unknown unknowns." A smart contract can only execute according to preset parameters and lacks the ability to understand the context of extreme anomalies. When the market encounters an unprecedented liquidity vacuum, when congestion on the underlying blockchain network prevents transactions from being included, or—more commonly—when the oracle price feed is maliciously manipulated, strict execution of the code may instead lead to systemic catastrophe. In these extreme scenarios, if a platform adheres entirely to rule rigidity and lets the liquidation engine blindly dump assets, it will not only aggravate the vicious cycle of prices but may also exhaust the insurance fund in an instant, ultimately triggering large-scale auto-deleveraging that makes innocent profitable traders bear enormous losses.
A further problem of rule rigidity lies in its "predictability" to attackers. When all rules are transparently encoded on-chain, an attacker can precisely calculate the cost and expected return of manipulating the market and thereby design a targeted attack strategy. This predictability does not exist in traditional finance, because regulators and market makers can increase attackers' uncertainty through unpredictable discretionary actions. Therefore, even a platform that touts a high degree of decentralization often has to find some form of emergency intervention mechanism when facing a life-or-death crisis—which brings us to the problem of the "guarantor of last resort."
12.4.2 The guarantor of last resort and discretion
To make up for the deficiencies of rule rigidity, a system often needs to introduce the role of a "guarantor of last resort" or "emergency administrator." On centralized exchanges, this role is naturally played by the platform operator; on decentralized platforms, it may take the form of a core team holding multi-signature authority or a specific governance committee. The guarantor of last resort is granted discretion to suspend trading, modify liquidation parameters, or even roll back transactions in emergencies.
This discretion has an irreplaceable function in responding to a systemic crisis. It endows the system with a kind of "elasticity," allowing the platform to block the spread of risk through human judgment when the code logic fails. Introducing discretion, however, inevitably reintroduces trust assumptions, which directly contravenes the original trustless intent of cryptocurrency. More seriously, once the power to intervene in the system is granted to some person or organization, one inevitably faces a series of thorny governance problems: who intervenes, what the trigger conditions are, and how to prevent the power from being abused.
The Hyperliquid JELLY incident of March 2025 provides a canonical empirical case of this dilemma. The attacker built two-way positions on the JELLY perpetual futures and actively withdrew margin to trigger self-liquidation, forcing the platform's liquidity provider pool to take over the short side; the attacker then pumped the JELLY spot price on the Raydium exchange on the Solana chain, causing HLP to bear an enormous unrealized loss (the mechanical details—the number of addresses, the size of the two-way positions, the magnitude of the pump, the loss amount, and the rollback price—are elaborated in Section 12.6.2) [21]. Here it is necessary to distinguish precisely between two manipulations of different natures: what the attacker carried out was "manipulation of the underlying asset price" (changing the asset's actual execution price by putting real money into a thin spot market), not "oracle signal injection" (directly tampering with the oracle's data transmission through technical means). In the JELLY incident, the oracle faithfully relayed the manipulated "real" market price, and its own technical integrity was not compromised. This distinction carries important implications for institutional design: defending against manipulation of the underlying asset price requires market-structure measures such as liquidity thresholds and position caps, whereas defending against oracle signal injection requires technical measures such as cryptographic verification and multi-source aggregation. Faced with this crisis, Hyperliquid's validator nodes voted in an emergency to override the oracle price, forcibly rolling back JELLY's settlement price to the level before the attack occurred, thereby avoiding a massive loss to the insurance fund [22].
This incident displays the two-sidedness of the guarantor-of-last-resort role. On the positive side, the validators' emergency intervention did indeed stop a planned market-manipulation attack and protected the interests of the insurance fund and the vast majority of users. On the negative side, however, this forced overwriting of the price triggered widespread doubt in the community: if validators can override the oracle price at any time, then what is the essential difference between Hyperliquid and a centralized exchange? Binance founder Changpeng Zhao went so far as to publicly criticize Hyperliquid's approach, questioning the authenticity of its decentralization. Viewed from a legal perspective, validators forcibly settling users' positions at a non-market price may create legal risk in multiple jurisdictions. At the level of contract law, even if the user agreement contains an "emergency" clause, the enforceability of that clause varies considerably across jurisdictions. At the level of property rights, for non-attackers holding long JELLY positions, the choice of the price benchmark for a "full refund" is itself a point of legal dispute. At the regulatory level, an entity with central counterparty (CCP)–like functions under the EU's Markets in Crypto-Assets (MiCA) framework unilaterally changing a settlement price may trigger scrutiny. The back-and-forth of Eisenberg being charged, convicted, and then having the conviction vacated in the Mango Markets case (see Section 12.4.3) exposes precisely the legal uncertainty of criminal prosecution for crypto-market manipulation on questions of venue and the elements of fraud; at the same time, whether the platform's intervention exceeded the reasonable scope of self-help could also become the focus of future litigation. This legal-dimension uncertainty adds the further complexity of cross-border legal coordination to the "residual control rights" problem discussed in Section 12.4.4. Historical experience shows that unconstrained discretion easily degenerates into an infringement of users' interests. Even with the purest of motives, the boundary of intervention is highly ambiguous. For example, when a large trader's collapse might trigger a chain of liquidations, a platform's choice to suspend liquidation to protect the insurance fund is in effect a disguised bailout of that large trader—and grossly unfair to other users who trade by the rules. This "too big to fail" phenomenon, long criticized in the traditional financial system, now reappears in another form in crypto markets.
12.4.3 Oracle risk
Oracle risk is a central topic in the governance dilemma. The oracle is the bridge connecting off-chain real-world price data with on-chain smart contracts, and it is also the most fragile link in a decentralized derivatives platform. No matter how tightly a platform's internal liquidation logic is designed, once the mark price the oracle feeds in is distorted, the entire system's risk-control mechanism fails in an instant. Take Hyperliquid: it uses a self-built oracle system that feeds prices aggregated from the spot prices of multiple external exchanges. For a low-liquidity asset like JELLY, however, its spot trading may be concentrated in the liquidity pools of just one or two decentralized exchanges, leaving the oracle's data sources severely lacking in diversity, so that the cost of manipulation is correspondingly extremely low. This reveals a key design flaw: for low-liquidity assets, an oracle should set a minimum data-source-diversity threshold, and if the available data sources fall below the threshold, the system should automatically limit the maximum position size on that asset or suspend its derivatives trading. The reason oracle risk occupies a special place in insurance-fund governance is that the shortfall losses it triggers arise not from normal market risk but from malicious manipulation of external inputs, which renders traditional risk-management frameworks almost entirely ineffective against such attacks.
Oracle manipulation attacks take multiple forms in practice. The most direct is spot-price manipulation, in which an attacker artificially pumps or dumps a token's price in a poorly liquid spot market with enormous capital, causing the oracle to capture the abnormal price and transmit it to the derivatives platform. A more covert approach exploits the flash-loan function of DeFi protocols to borrow an enormous sum within a single transaction to manipulate the price, repaying the loan immediately after completing the attack, with the entire process completed within one block. In addition, an attacker can exploit the gap in the oracle's update frequency to conduct arbitrage before the oracle reflects the latest price. According to Chainalysis estimates, in 2022 alone DeFi protocols lost about $403.2 million to oracle manipulation attacks across 41 separate incidents (this figure is explicitly labeled by Chainalysis as an estimate, and its statistical scope covers the entire DeFi ecosystem rather than being specific to perpetual futures) [23]. According to other estimates by security researchers, since 2020 oracle manipulation has accounted for about 15% to 20% of major DeFi security incidents (this proportion lacks a uniform definition of "major incident" and a public methodology, and should be treated with caution) [24]. The statistics above come mainly from publicly disclosed security-incident reports and on-chain data analysis, and the actual loss scale may be underestimated because of undisclosed incidents.
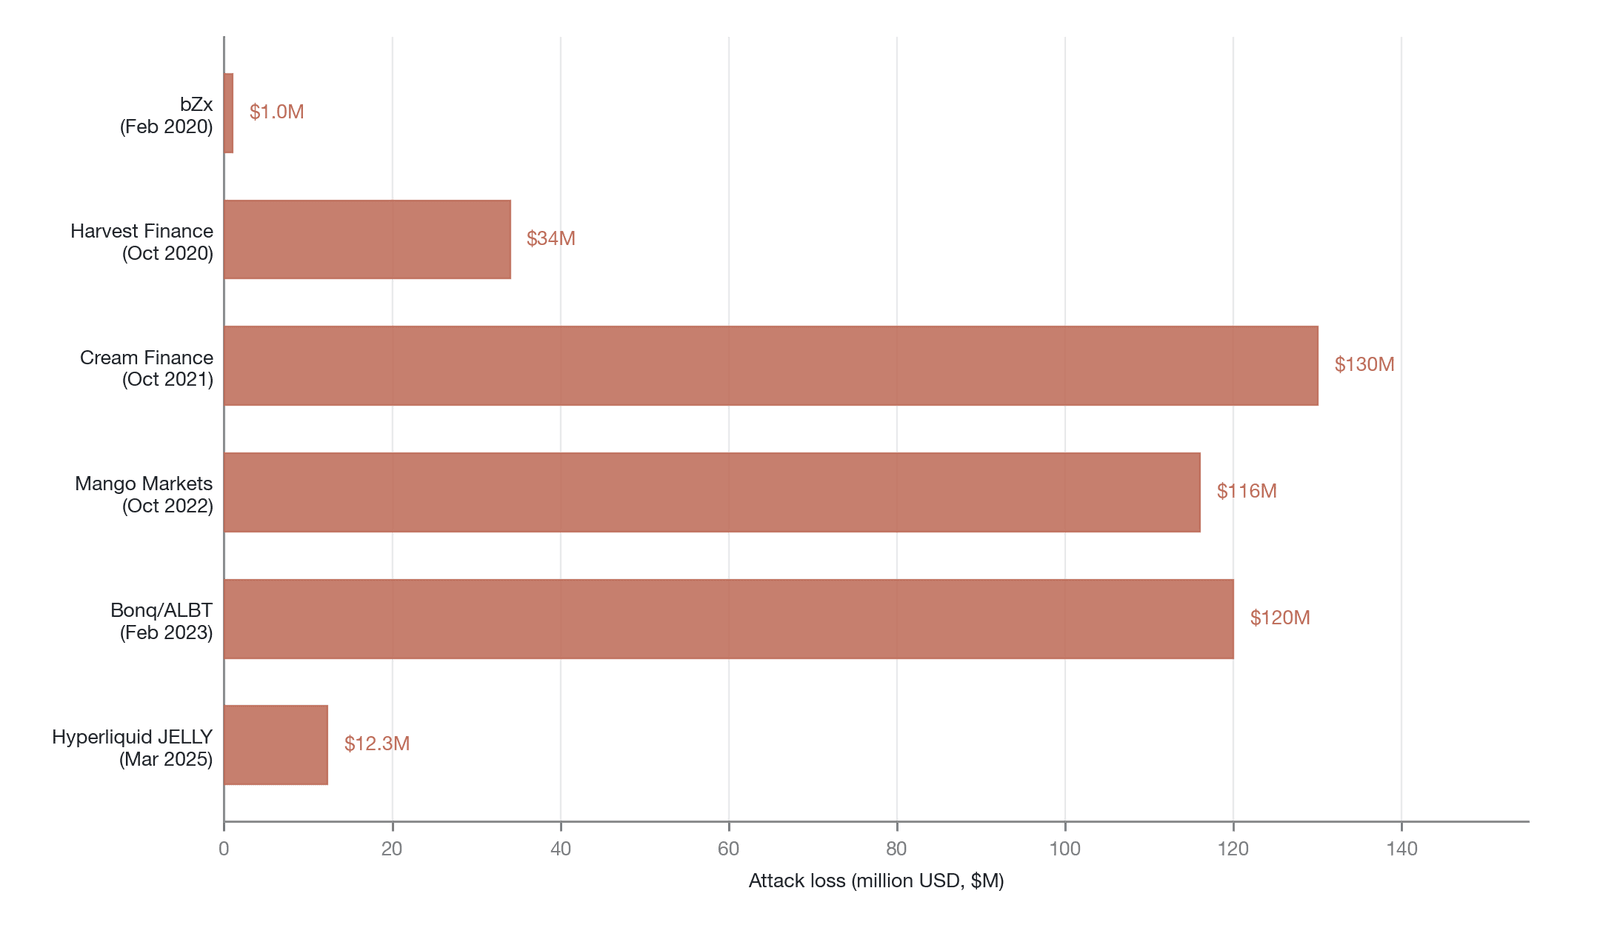
Figure 12-18. The loss scale of major oracle manipulation attacks in DeFi history (Bonq/ALBT's $120 million is the minted notional; constrained by wALBT liquidity, the actual amount extracted was about $1.7 million to $4 million)
Figure 12-18 shows the evolution of the loss scale of oracle manipulation attacks—from the millions to the hundreds of millions since the 2020 bZx incident—reflecting the persistent fragility of DeFi protocols in protecting against external price inputs.
The Mango Markets incident of October 2022 is a paradigmatic case of oracle manipulation. The attacker, Avraham Eisenberg, exploited the weak spot liquidity of the MNGO token to artificially manipulate the oracle price by building positions simultaneously in multiple markets, then used the inflated book profit to borrow various crypto assets worth as much as $116 million from the protocol [25]. Although the protocol's smart contract ran entirely according to its established rules, with no code vulnerability, the false price fed in from outside directly bankrupted the protocol. Eisenberg was charged by the U.S. Department of Justice in January 2023 with commodities fraud, commodities manipulation, and wire fraud, and was convicted by a jury in April 2024; but on May 23, 2025, the U.S. District Court for the Southern District of New York, invoking Rule 29 of the Federal Rules of Criminal Procedure, vacated all criminal convictions on the grounds of improper venue and insufficient elements of wire fraud (Mango Markets had no terms of service, did not prohibit the relevant operations, and had no repayment agreement, so there was no material misrepresentation); the prosecution has appealed, and as of this writing the case remains before the Second Circuit Court of Appeals [26][27].
Oracle risk poses a fundamental problem for insurance-fund governance: how should shortfall losses caused by non-market risk be handled? If the insurance fund pays out according to the established rules, then the attacker is in effect "legally" stealing funds from the insurance fund; if the platform chooses to intervene and refuse to pay, then we return to the discretion-abuse problem discussed earlier. There is no perfect solution to this dilemma; one can only reduce the probability of a successful attack through more refined oracle design (such as time-weighted average price, multi-source aggregation, and outlier filtering) while, through governance mechanisms, standardizing the trigger conditions and execution process of emergency intervention.
12.4.4 The theory of incomplete contracts
To understand this governance dilemma deeply from a theoretical standpoint, we can invoke the "incomplete contracts" theory from economics. Proposed by Oliver Hart (co-winner of the 2016 Nobel Prize in Economics with Bengt Holmström) and John Moore, this theory holds that because of humans' bounded rationality and the unpredictability of the future, contracting parties cannot foresee, ex ante, all the situations that might arise and write them into the contract [28]. All contracts are therefore "incomplete" in essence.
In the cryptocurrency context, the smart contract is the ultimate embodiment of such an "incomplete contract." Although a smart contract is called a "contract," it is in fact merely a piece of computer code deployed on a blockchain. When writing the code, developers can only set parameters based on their understanding of past market behavior and their predictions of a limited set of future scenarios. They cannot foresee every form of market manipulation, hacker attack, or extreme black-swan event. When these situations not covered by the code occur, the smart contract exhibits a "blank" or "loophole." The developers of Mango Markets could not have foreseen that someone would manipulate the price of a small-cap token in such an extreme way; nor could Hyperliquid's designers have exhaustively enumerated every possible cross-chain attack vector in the code.
The Hart-Moore model further points out that when a contract is incomplete, the key question is who holds the "residual control rights"—the power to make decisions in situations the contract does not specify. On a traditional centralized exchange, the platform holds absolute residual control rights, which gives it great flexibility but also creates the platform moral hazard discussed earlier. In the ideal model of full decentralization, an attempt is made to eliminate residual control rights entirely, leaving everything to code execution. Because of the inherent incompleteness of smart contracts, however, completely eliminating residual control rights is impractical. When unanticipated events such as oracle failure or a market collapse occur, someone or some mechanism must handle the situations not covered by the code, exercising residual control rights to save the system.
This theoretical framework offers a key perspective for understanding the governance dilemma of crypto derivatives: the core of the problem is not "whether discretion is needed" but "how to allocate and constrain discretion." An ideal institutional design should follow a "two-tier architecture": in day-to-day operation, strictly adhere to the code rules to ensure certainty and fairness; and when a systemic crisis occurs, authorize a guarantor of last resort—constrained by strict procedures—to intervene, but with the scope of intervention, the trigger conditions, and the after-the-fact accountability mechanism all clearly specified in advance. This is precisely why even the most hardcore DeFi protocols ultimately tend to retain some form of governance mechanism or emergency pause function. The essence of the governance dilemma is how, under the ideal of decentralization, to appropriately allocate and constrain this unavoidable residual control right.
12.4.5 Information asymmetry and signaling games
Before turning to the governance spectrum, consider the deeper logic of insurance-fund governance from the perspective of information economics. In his seminal paper on the "market for lemons," George Akerlof revealed how information asymmetry leads to market failure: when the seller holds quality information that the buyer cannot observe, high-quality products are driven out of the market by low-quality ones [29]. Mapping this framework onto the governance of crypto derivatives insurance funds, the "lemon problem" appears in a distinctive form: the platform (the seller) holds the fund's true condition (including its actual balance, risk exposure, historical payout record, actuarial adequacy ratio, and other private information), while users and LPs (the buyers) can observe only the public signals the platform chooses to disclose selectively.
Under this information asymmetry, Spence's signaling-game theory [30] provides a key perspective for understanding platform behavior. A high-quality platform (with an adequate insurance fund and transparent governance) has an incentive to distinguish itself from low-quality platforms by sending "costly signals." These signals include publishing on-chain proof of reserves, or PoR (which can be independently verified and is costly to fake), accepting third-party actuarial audits (which require real data to support them), and encoding liquidation rules completely into auditable smart contracts (which, once deployed, cannot be unilaterally tampered with). These signals are effective because the cost for a low-quality platform (one whose fund is inadequate or that engages in misappropriation) to mimic them is extremely high: a platform with a fictitious insurance fund cannot pass the verification of on-chain proof of reserves, and a platform with opaque rules cannot bear the exposure risk of a smart-contract audit. The FTX case is precisely a cautionary counterexample: it sent false signals by fabricating insurance-fund data, and its eventual implosion proved that false signals are unsustainable in the long run.
The logic of signaling games leads directly to the analysis of the governance spectrum. The progression from G0 to G3 is, in essence, a gradual upgrade of the "quality signal" a platform sends to the market, from cheap talk to a verifiable commitment.
12.4.6 The governance spectrum G0–G3
Faced with the tension between rule rigidity and discretion, crypto derivatives platforms have not remained stuck in a black-or-white binary but have explored, in practice, governance models of varying degrees. Taking governance transparency, the degree of decentralization, and the constraints on discretion as yardsticks, one can depict a "governance spectrum" running from a fully centralized black box to fully on-chain autonomy. We can divide it into four main levels: G0 through G3 (Table 12-1). This classification framework echoes the verifiability ladder discussed in Chapter 5 of this book; the governance level of the insurance fund is, in essence, a key dimension of a platform's overall verifiability.
| Level | Name | Transparency | Constraint on discretion | Representative platforms |
|---|---|---|---|---|
| G0 | Fully opaque | Size/source/rules all undisclosed | No constraint whatsoever | Early BitMEX, FTX |
| G1 | Size visible | Publishes PoR or on-chain balance | Governance process opaque | Binance, OKX (current) |
| G2 | Size + rules visible | Rules encoded on-chain, auditable | Upgrade authority concentrated in the core team | Hyperliquid |
| G2–G3 | Rules visible + partial on-chain governance | On-chain voting + timelock already running in production | Upgrade authority constrained by DAO governance, but emergency powers retained | dYdX v4 |
| G3 | Fully on-chain governance | Upgrades require community vote + timelock | Discretion programmatically constrained | Theoretical standard (none yet fully achieved) |
Table 12-1. Definition of the G0–G3 insurance-fund governance spectrum and representative platforms (Data source: constructed by the author)
The G0 level represents fully opaque black-box governance. At this level, the insurance fund's size, funding sources, payout rules, and liquidation logic are all undisclosed. The platform operator holds absolute discretion subject to no oversight whatsoever. Early BitMEX and the later-collapsed FTX are typical representatives of this level. In the G0 model, users can only blindly trust the platform's moral integrity, and history has repeatedly shown that such trust is often betrayed, with serious consequences. The FTX insurance-fund fraud case shows that at the G0 level the insurance fund can even be entirely fictitious, with users utterly unable to detect it.
The G1 level introduces a preliminary degree of transparency and can be described as "size visible, governance opaque." Platforms at this level begin to publish proof of reserves periodically or disclose the on-chain wallet address of the insurance fund, allowing the public to verify that the funds truly exist. How these funds are used, however, along with the specific parameters of the liquidation engine and the decision process in emergencies, still rests in the hands of a centralized team. Most mainstream centralized exchanges on the market today, such as Binance and OKX, sit largely at this level. They build trust by displaying a huge insurance-fund size, but they still retain broad discretion in rule enforcement. The advance of G1 over G0 is that users can at least verify "whether the money is really there," though "how the money will be used" remains unknowable.
The G2 level is a key step toward decentralization, characterized by "both size and rules visible, but upgrade authority concentrated." At this level are mainly the new generation of decentralized derivatives protocols. They encode liquidation logic, penalty collection, and the insurance fund's operating rules completely into smart contracts deployed on-chain for anyone to audit. The system's day-to-day operation achieves "code is law." To cope with the risk brought by incomplete contracts, however, the core team still retains the power to modify key parameters or upgrade contracts through means such as multi-signature. Hyperliquid's performance in the JELLY incident is a clear depiction of the G2 level: day-to-day operation is fully transparent and automated, but at the moment of crisis the validators (in substance controlled by the core team) can intervene in an emergency. This model represents a qualitative leap in transparency, but it still carries the single-point risk of the team acting unilaterally in bad faith or being coerced by regulators.
The G3 level represents the highest standard the industry is currently exploring: "fully on-chain governance with timelock constraints." At this level, not only are the rules and funds fully transparent, but residual control rights are handed to the decentralized community (usually through token voting). Any modification of system parameters, upgrade of contracts, or use of the insurance fund must go through an on-chain proposal and voting process. More importantly, the system introduces a timelock mechanism: after a vote passes, a change to the code must go through a mandatory waiting period (usually 24 to 72 hours) before taking effect. This gives users who disagree with the decision ample time to withdraw their funds, providing an exit-right guarantee of "voting with one's feet." dYdX v4, through its independent app-chain architecture based on the Cosmos SDK, is actively exploring this direction. The G3 model, through a programmatic democratic process and a time buffer, constrains the abuse of discretion to the greatest extent possible while preserving the system's elasticity.
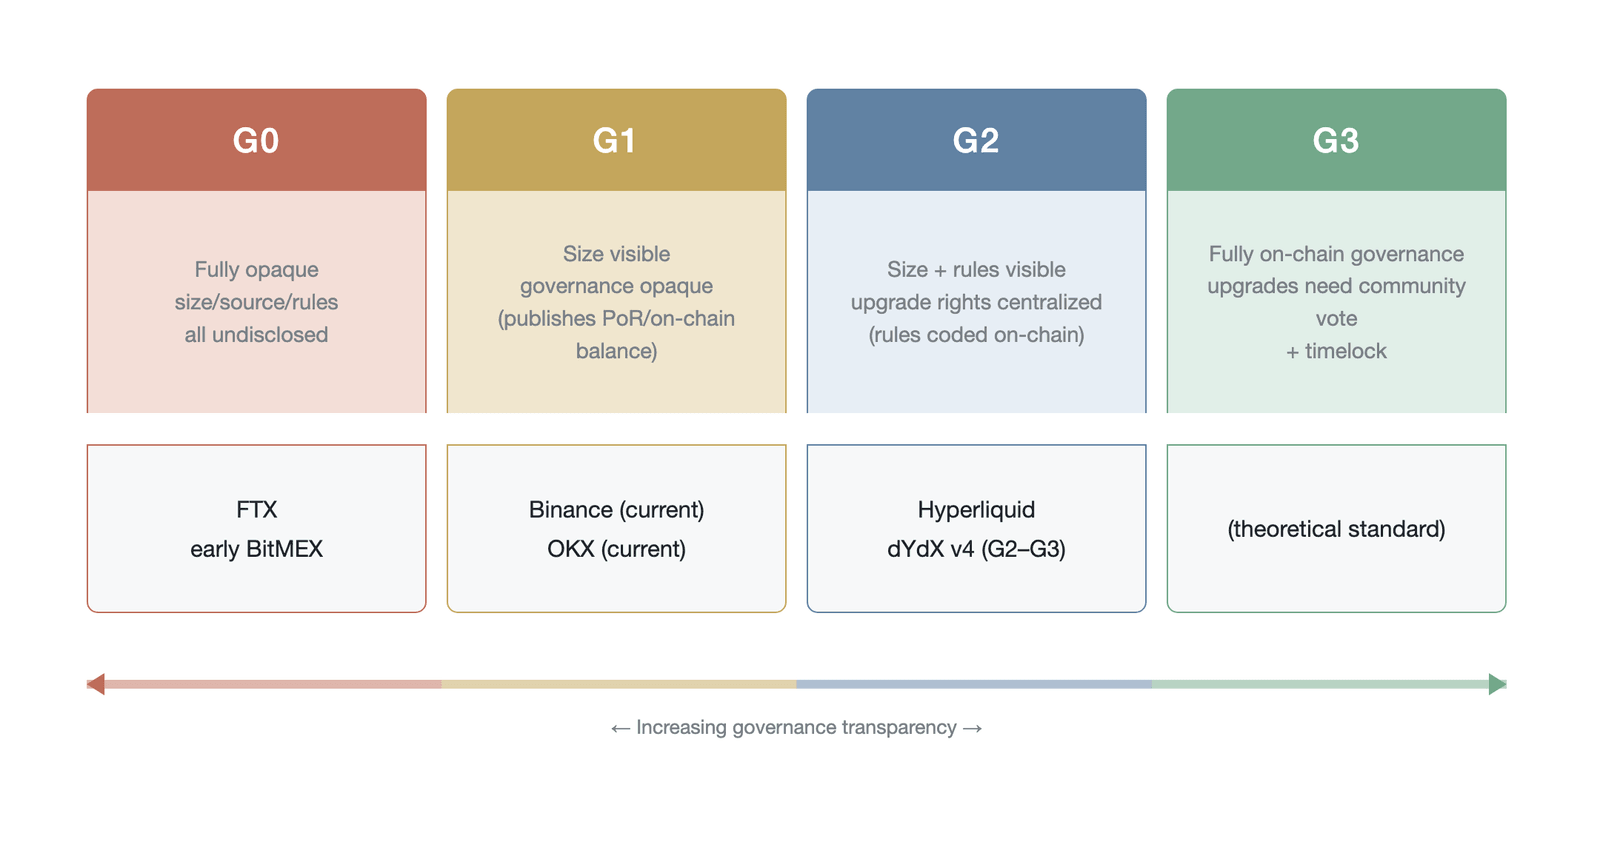
Figure 12-19. The governance spectrum of crypto derivatives platforms and the positioning of major platforms
Figure 12-19 shows the positioning of various platforms on the G0–G3 governance spectrum, with the industry as a whole exhibiting a gradual evolution from low to high transparency.
Even the G3 level, however, is not flawless. Fully on-chain governance faces real-world challenges such as low voter turnout, concentration of governance tokens, and insufficient emergency-response speed. When the system is under attack, waiting for a community vote and the expiry of the timelock may mean a delay of hours or even days, during which the attacker may already have completed the transfer of funds. Some protocols therefore introduce an "emergency multisig" as a safety valve within the G3 framework, allowing intervention that bypasses the normal governance process in extreme situations, subject to after-the-fact community review and ratification. Although this design sacrifices some purity of decentralization, it strikes a pragmatic balance between practicality and safety. In addition, the DAO voting mechanism itself faces the challenge of various behavioral biases: the concentrated holding of governance tokens leads to "whale governance" (plutocratic governance), in which the interests of a few large holders may be systematically inconsistent with those of ordinary LPs (for example, market makers holding large amounts of governance tokens may vote against lowering the leverage cap, because high-leverage trading brings more fee income); chronically low voter turnout allows a few active participants to dominate decisions; and token holders may vote for short-term token-price gains rather than the system's long-term robustness. These behavioral factors mean that G3 may not always be superior in practice to a well-designed G2 mechanism.
Examining insurance-fund governance from a regulatory perspective is likewise important. The Principles for Financial Market Infrastructures, jointly issued by the Bank for International Settlements' Committee on Payments and Market Infrastructures and the International Organization of Securities Commissions, sets an international standard for the default management of central counterparty clearinghouses, requiring CCPs with more complex business risk or systemic importance across multiple jurisdictions to maintain prefunded resources sufficient to cover the "default of the two largest participants and their affiliates" scenario (the industry's "Cover 2" standard), while other CCPs must at least cover the default of the single largest participant ("Cover 1"; the EU's EMIR subsequently raised Cover 2 to a hard minimum for all CCPs within its jurisdiction). This standard provides a reference benchmark for assessing the adequacy of crypto derivatives insurance funds. Although a crypto-market insurance fund is not, in legal nature, a CCP guarantee fund, its functional role is closely analogous. At the regulatory-framework level, the EU's MiCA regulation (Regulation (EU) 2023/1114, in force June 29, 2023, with the core rules for crypto-asset service providers applying from December 30, 2024) imposes capital-adequacy and prudential-operation requirements on crypto-asset service providers, but its specific regulatory standards for derivatives insurance funds remain in the process of detailed rulemaking [31]. Platforms with lower governance transparency on the G0–G3 spectrum (G0–G1) may evade these requirements by registering in loosely regulated jurisdictions, creating a "regulatory arbitrage" in which a platform acquires users in strictly regulated markets while operating its core risk-management mechanism in a regulatory void. This arbitrage not only undermines the consistency of global financial stability but also makes cross-border regulation of insurance funds an urgent issue in crypto-finance regulation. Beyond the applicability of the regulatory framework, the legal characterization of the insurance fund itself carries unresolved uncertainty. Core disputes include: whether the insurance fund constitutes "client assets" and is thereby subject to stricter segregation and fiduciary obligations; the fund's legal position in the priority of claims in a platform's bankruptcy liquidation (as in the FTX case)—whether it is common property belonging to all traders or the platform's own asset; and how liquidation penalties are classified for tax purposes (insurance premium, fee, or fine), with different classifications carrying starkly different compliance obligations for the platform. The unresolved state of these legal questions constitutes yet another dimension of uncertainty for the sustainability of the insurance-fund institution.
The progression from G0 to G3 is not merely an upgrade of technical architecture but a profound reconstruction of the trust mechanism of crypto derivatives markets. On this spectrum there is no absolutely perfect endpoint, only a process of continually seeking a better balance among transparency, efficiency, safety, and the ideal of decentralization. The governance of the insurance fund, like the weakest link in a chain, determines the ceiling of the entire platform's governance system. A platform that has achieved a high degree of transparency in both trade matching and asset custody will have the credibility of its whole system dragged down by this shortcoming if its insurance-fund management remains stuck at the G0 or G1 level. The political economy of insurance funds ultimately comes down to how, through institutional design, to build a governance consensus—in a market environment full of uncertainty—that can both withstand systemic collapse and defend against human greed.
12.5 An evaluation framework and cross-platform comparison
To comprehensively assess the merits of different derivatives platforms' insurance-fund mechanism designs, we must move beyond a single size metric and establish a multidimensional composite evaluation system. As argued in Section 12.1.3, simply comparing "whose insurance fund is larger" is not only superficial but potentially misleading: the platform with the largest absolute size does not necessarily have the greatest buffer thickness per unit of risk exposure. Through a systematic examination of four dimensions—capital adequacy, incentive compatibility, process quality and efficiency, and governance and verifiability—we can more clearly discern each platform's true defensive capacity in responding to extreme risk, and provide investors and protocol designers with a structured analytical tool.
12.5.1 Constructing the four-dimensional evaluation system
Capital adequacy is the primary basis for measuring an insurance fund's defensive capacity, and also the most intuitive but most easily misread dimension. This dimension involves three levels of examination. The basic metric is the ratio of the fund's size to the platform's total open interest; this relative metric reveals the thickness of the capital reserve per unit of risk exposure better than absolute size does. In traditional finance, central counterparty clearinghouses typically maintain strict margin and guarantee-fund ratios and conduct periodic stress tests to ensure solvency under extreme scenarios; in crypto markets, because asset volatility is higher, the market structure is more fragmented, and there is no unified regulatory standard, the reasonable range of this ratio is still being explored dynamically. Above this is stress-test coverage—whether the fund can cover the maximum total loss under historical extreme conditions (such as the "Black Thursday" of March 2020, the liquidation cascade of May 2021, and the "10/10 event" of October 2025) or under simulated future extreme scenarios. This requires combining the liquidation-reflexivity equation (and its divergence-criticality condition) established in Chapter 11 with the tail-risk-distribution modeling of Section 12.3.5 of this chapter to make a quantitative estimate. Further, there is the reliability of the replenishment mechanism—whether, after the fund is substantially depleted in an extreme event, there is a clear, credible, and rapid recapitalization mechanism. An insurance fund that takes months to recover after a crisis will have its defensive capacity in successive extreme events greatly diminished.
Incentive compatibility examines whether a platform's mechanism can effectively align the interests of various participants with the system's long-term robustness. This dimension covers three key sub-metrics. The reasonableness of the liquidation-penalty structure is the first key point—whether the penalty effectively deters high-risk behavior without excessively punishing normal traders. Too low a penalty cannot constrain high-leverage speculation, while too high a penalty may cause traders to adopt a more aggressive "gamble it all" strategy as they approach the liquidation line, instead aggravating system risk. On this basis, the ability to suppress moral hazard is likewise important, particularly at the platform level—whether the platform aligns its own interests with the system's robustness through "interest-binding." If a platform controls the insurance fund but bears no risk of loss, then the fund may degenerate into a marketing tool or even a fraud tool. Finally, the degree of interest alignment is also a core consideration—whether the distribution of interests across funding sources, use rules, and value appreciation matches the actual risk-bearers. If liquidity providers bear high tail risk without receiving a corresponding risk premium, or if the platform lacks skin-in-the-game constraints when handling shortfall losses, such a mechanism will inevitably face the risk of collapse in extreme conditions.
Process quality and efficiency focuses on the liquidation mechanism's performance in actual operation, especially its response speed and execution accuracy in the face of extreme events such as network congestion, oracle latency, or malicious manipulation. This includes liquidation execution speed and slippage (whether risky positions can be disposed of quickly and effectively in extreme volatility without producing an excessive market impact); the shortfall rate and ADL frequency (as the ultimate outcome metrics of problems in the earlier layers of the liquidation chain, a higher shortfall rate means weaker upstream defenses of the liquidation mechanism); and system performance under extreme conditions (whether problems such as downtime, API latency, or unfillable orders occur). The market-wide liquidation cascade of October 10, 2025 (the "10/10 event") provides empirical data of significant analytical value for this dimension: in that event, several mainstream exchanges suffered varying degrees of system-performance degradation, and some platforms' liquidation engines had insufficient throughput to handle the instantaneous burst of forced-liquidation orders, causing shortfall losses far above normal levels [32].
Beyond the above four dimensions, an increasingly important but often overlooked supplementary dimension is the systemic risk contribution. As the crypto derivatives market grows in scale and cross-platform interconnection deepens, the failure of a single platform's insurance fund may produce spillover effects on the entire ecosystem through multiple transmission channels (including market makers' cross-platform exposure, systemic redemption pressure on stablecoins, and the cross-market spread of panic). Traditional finance has developed mature tools for measuring systemic risk: among them, the CoVaR (conditional value at risk) proposed by Adrian and Brunnermeier [33] measures the increment in the entire system's value at risk when a single institution falls into distress, while the MES (marginal expected shortfall) proposed by Acharya et al. [34] measures a single institution's expected loss contribution during a systemic crisis. Transplanting these tools to the crypto derivatives domain makes it possible to assess the core question: "if platform X's insurance fund is broken through, how much additional risk will other platforms and the entire market face?" Directly transplanting these traditional tools, however, faces obstacles specific to crypto markets: the extreme insufficiency of transparency in cross-platform position data makes the conditional tail-dependence structure difficult to estimate; the crypto market's volatility-regime switches are more frequent, so conditional-quantile estimates based on historical data may lag severely; and the correlation among exchanges may be transmitted mainly through market makers' cross-platform inventory channel rather than through traditional balance-sheet linkages. Applying CoVaR and MES to the crypto derivatives domain therefore requires modeling adaptations tailored to the above distinctive transmission channels. Although the data availability and transparency of cross-platform positions remain major obstacles, the introduction of the systemic-risk-contribution dimension extends insurance-fund evaluation from "the robustness of a single platform" to "the resilience of the entire ecosystem," connecting with the logical framework of macroprudential regulation.
Governance and verifiability concern the transparency of the insurance fund and the certainty of rule enforcement. This requires not only that the fund balance be verifiable on-chain but also that the liquidation rules, the conditions for using funds, and the emergency-intervention mechanism have a high degree of transparency and predictability. Specifically, this dimension examines rule transparency (whether the inflow, depletion, and replenishment mechanisms of funds are public, clear, and codified), fund auditability (whether the balance and every income-and-expenditure flow can be independently verified in real time by a third party), and the governance mechanism for parameter changes (whether these are decided unilaterally by the platform or through a decentralized checks-and-balances process such as DAO voting). As the G0–G3 governance spectrum established in Section 12.4 of this chapter reveals, a platform's position on this spectrum—from a fully black-box operation (G0) to fully decentralized on-chain governance (G3)—directly determines whether it can maintain user trust at the moment of crisis. An "on-chain visible balance" does not equal "governance transparency"; a visible size with unverifiable use rules is still incomplete transparency. The insurance fund is usually the "weakest link" in a platform's governance chain, because it involves the largest scale of funds, the highest urgency of decisions, and yet transparency requirements that are often lowered in the name of "safety."
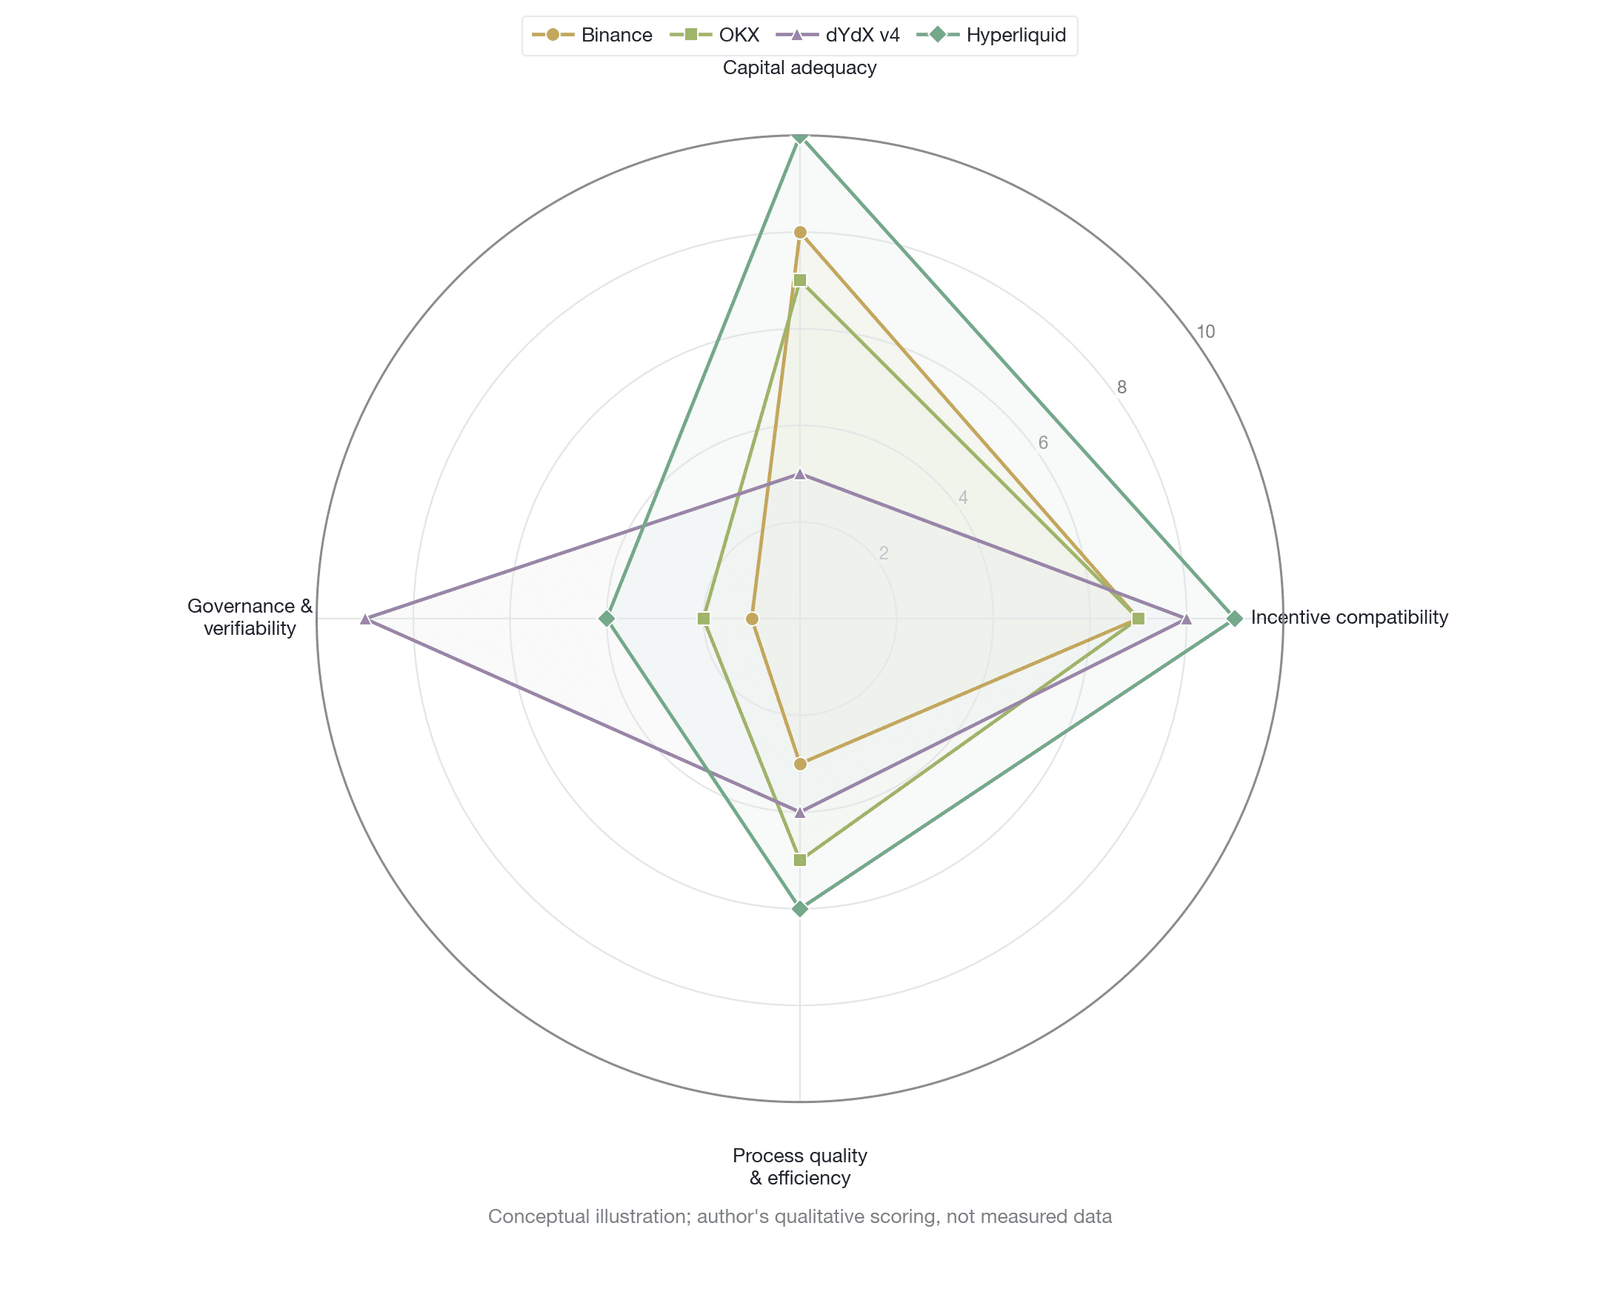
Figure 12-20. A four-dimensional radar chart of major derivatives platforms' insurance-fund mechanisms (conceptual illustration, qualitative scoring by the author, not measured data)
12.5.2 Platform comparison analysis
Figure 12-20 presents, in radar-chart form, the performance profile of each platform across the four dimensions: centralized platforms hold an advantage in capital adequacy but have a clear shortcoming in governance verifiability, while decentralized platforms exhibit the opposite pattern. Applying this four-dimensional evaluation framework to the current market's mainstream platforms, we can observe markedly different mechanism choices and capability emphases. No single platform holds an absolute advantage across all dimensions, and this "no-platform-optimal-on-all" pattern essentially reflects the deep trade-offs in insurance-fund design among capital efficiency, incentive compatibility, process reliability, and governance transparency.
Centralized exchanges, by virtue of their enormous trading volumes and long-term operational accumulation, possess insurance funds of enormous absolute size. According to public data from 2025–2026, Binance's futures insurance fund (an aggregation of segregated funds across contract groups, CoinGlass basis, as of 2025) has remained above $2.3 billion year-round and should be distinguished from its roughly $1 billion Secure Asset Fund for Users (SAFU) user-protection fund; it is the largest single futures insurance fund in the industry [35]. Because of its enormous open-interest base (total OI across all contracts of about $35 billion, fluctuating with market conditions), however, its fund-to-open-interest ratio typically holds around 6.6%. Binance's liquidation penalties adopt a tiered, escalating structure, setting different penalty ratios according to leverage and position size, which deters high-risk behavior to some extent. In terms of process quality, Binance's centralized matching engine performs relatively stably under normal market conditions. But in the 10/10 event, Binance too suffered API latency and partial functional downtime, exposing its performance bottleneck under extreme load. In terms of governance and verifiability, Binance remains at the G0–G1 level: although some fund addresses have been made public, the rules for using the fund, the adjustment logic of liquidation parameters, and the emergency-intervention mechanism remain a black box to outside observers, and all parameter changes are decided unilaterally by the platform. OKX has not publicly disclosed the size of its futures liquidation insurance fund; the roughly $500 million it discloses (now expanded to over $700 million) is a Security Fund (mainly covering user losses from platform-side hacks and vulnerabilities, comparable to Binance's SAFU) and should not be used directly as a futures insurance fund or in a fund-to-open-interest ratio. OKX has made some improvements in transparency (disclosing more operational data), but its core governance mechanism remains controlled by the platform, and its overall evaluation is similar to Binance's.
Among decentralized derivatives protocols, dYdX v4, by deeply binding its insurance fund to the community treasury, has achieved a high degree of governance verifiability (G2–G3 level). Although its roughly $16 million insurance fund is relatively small in absolute size, with a fund-to-open-interest ratio of only about 2.0%, it is entirely controlled by DAO governance, and the rules for injecting and using funds are transparent and predictable [36]. The liquidation rules are fully codified, parameter changes require a DAO vote, and any community member can put forward a governance proposal and participate in the discussion. This highly transparent governance model puts dYdX v4 far ahead of its centralized competitors on the governance dimension. This community-treasury-based model of socialized risk-bearing, however, still has room for improvement in incentive compatibility: token holders passively bear the system's tail risk without a refined risk-pricing mechanism to compensate for it. In the 10/10 event, dYdX v4 experienced a chain halt, exposing its process-quality shortcoming under extreme load. Moreover, the low fund-to-open-interest ratio means its buffer space is limited in the face of a large-scale liquidation cascade, and the speed of its replenishment mechanism is also constrained by the DAO governance process.
Hyperliquid, for its part, has explored a new direction in market-based risk underwriting. Its HLP vault's total TVL was about $390 million in the second half of 2025 (peaking above $500 million on March 11, 2025, and falling back to about $270 million by mid-2026), and the fund-to-open-interest ratio calculated on this basis was as high as about 18.6% [37]. As noted in Section 12.1.3, however, using total HLP TVL as a whole as the insurance-fund size may overstate the actual risk-buffer thickness. Moreover, the tail risk of long-tail assets (such as low-liquidity meme coins like JELLY and POPCAT) is far greater than that of mainstream assets such as BTC/ETH, and the average ratio of 18.6% masks a coverage that may be severely inadequate for specific asset classes—precisely the "risk-pool commingling" problem revealed by the case studies in Section 12.6. More importantly, by opening its liquidation vault and allowing liquidity providers to participate in risk underwriting autonomously on market-based principles, Hyperliquid makes HLP's annualized return directly reflect the market's dynamic pricing of liquidation risk, creating a marked differentiation from other platforms in incentive compatibility. Its liquidation rules are on-chain verifiable, and the validator consensus mechanism provides a degree of decentralized checks and balances on parameter governance, so its overall governance level sits at G2. As we see in the case in Section 12.6, however, this complex market-based mechanism still faces severe tests of process quality and efficiency in the face of extreme manipulation of long-tail assets: in the 10/10 event Hyperliquid triggered its ADL mechanism for the first time, and the 2025 JELLY incident further exposed the structural flaw of risk-pool commingling. In addition, although the validator consensus mechanism provides emergency-intervention capability, the degree of centralization and transparency of its decision process still needs improvement.
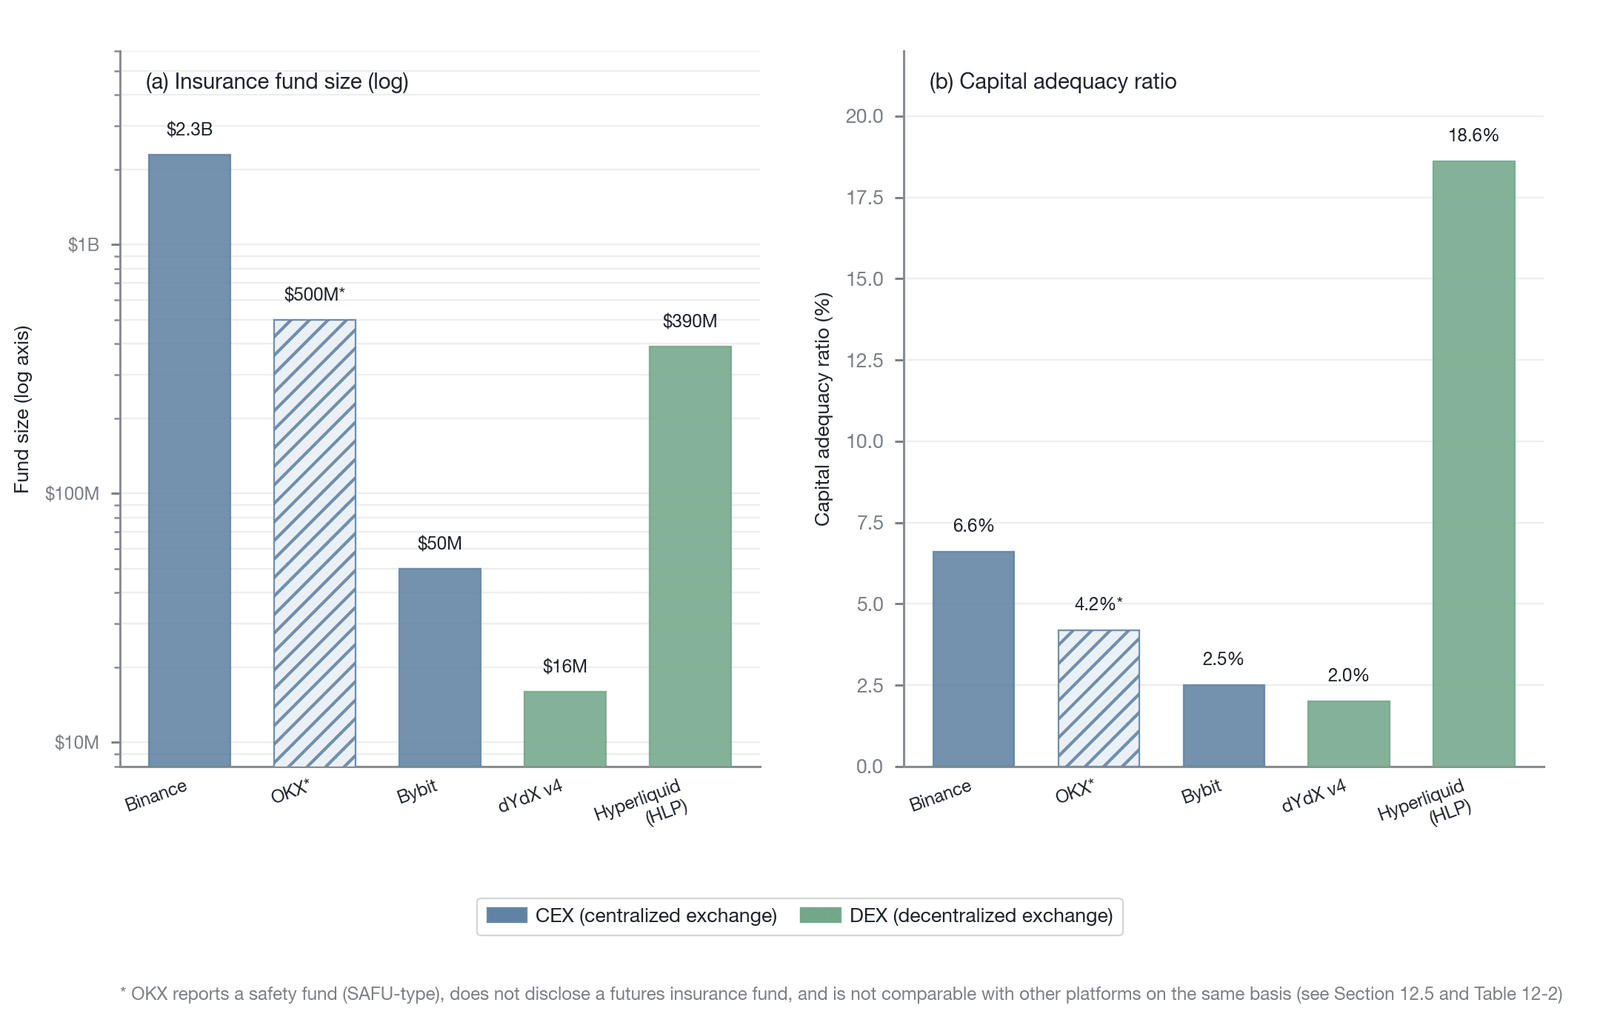
Figure 12-21. Comparison of major derivatives platforms' insurance-fund size and capital adequacy ratio (the capital adequacy ratio is the author's estimate; platforms do not publish this ratio; fund sizes are an as-of-2025 snapshot, and present values have since changed and are highly time-sensitive)
Figure 12-21 translates the above analysis into a visual comparison, intuitively confirming the earlier argument that "absolute size can be misleading" (see Section 12.1.3). Table 12-2 summarizes the systematic comparison of the four major platforms under the four-dimensional evaluation framework, providing readers with a structured frame of reference.
| Evaluation dimension | Key metric | Binance | OKX | dYdX v4 | Hyperliquid |
|---|---|---|---|---|---|
| Capital adequacy | Fund size | About $2.3 billion (futures insurance fund, distinct from the roughly $1 billion SAFU) | Not disclosed‡ | About $16 million | HLP total TVL about $390 million (market-making + liquidation)† |
| Fund-to-OI ratio | About 6.6% | Not comparable‡ | About 2.0% | About 18.6% (upper-bound estimate based on total HLP TVL)† | |
| Replenishment mechanism | Opaque | Opaque | DAO governance | Market-based replenishment | |
| Incentive compatibility | Penalty structure | Tiered, escalating | Tiered, escalating | On-chain rules | Uniform low fee |
| Interest alignment | Low | Low | Medium | High | |
| Process quality | 10/10 event performance | Downtime and API latency | Partial latency | Chain halt | ADL triggered |
| ADL frequency | Extremely rare | Extremely rare | Chain halt as substitute | First triggered in 10/10 | |
| Governance verifiability | Fund transparency | Black box (G0–G1) | Partially transparent (G1) | Fully on-chain (G2–G3) | On-chain verifiable (G2) |
| Parameter governance | Platform decides unilaterally | Platform decides unilaterally | DAO vote | Validator consensus |
Table 12-2. Four-dimensional evaluation summary of the four major platforms' insurance-fund mechanisms (Data source: compiled by the author from each platform's public documentation)
Note: † HLP total TVL encompasses a shared capital pool for both the market-making and liquidation strategies, and using it as a whole as the insurance-fund size may overstate the actual risk-buffer thickness; 18.6% should be understood as an upper-bound estimate based on total HLP TVL (see Section 12.1.3). ‡ OKX has not publicly disclosed the size of its futures liquidation insurance fund; the roughly $500 million it discloses is a security fund (comparable to SAFU, covering platform hacks), not comparable on a like-for-like basis with other platforms' futures insurance funds, so the "fund size/ratio" columns are recorded as "not disclosed/not comparable."
Several key insights can be distilled from this cross-platform comparison. Capital adequacy and governance transparency currently exhibit an observable descriptive association in the market: the platforms with the largest capital tend to have the least transparent governance, while the platform with the most transparent governance has the smallest capital. This association, however, may mainly reflect historical path dependence rather than a causal institutional trade-off: centralized platforms were founded earlier and have operated longer, naturally operating in an opaque manner and accumulating a size advantage in the early industry environment that lacked DeFi infrastructure; decentralized platforms are newer and have not yet experienced enough bull-and-bear cycles to accumulate a large-scale fund. Moreover, opaque and underfunded platforms (such as FTX) have already collapsed and are absent from the current sample, so survivorship bias may also distort the observed association. Whether, as decentralized platforms mature, a platform combining "high transparency plus high capital adequacy" will emerge and break the current association pattern is a proposition worth tracking over the long term. On this basis, a trade-off also exists between incentive compatibility and process reliability: Hyperliquid's market-based mechanism is more refined in incentive design than other platforms, but its complexity also brings a larger attack surface and more edge cases. On balance, no platform has reached an ideal level on all dimensions, and the choice depends on a user's prioritization of the different dimensions: a large institution pursuing capital safety may prefer Binance's absolute size, a DeFi-native user pursuing transparent governance may prefer dYdX v4, and a professional trader pursuing capital efficiency and innovative mechanisms may prefer Hyperliquid.
12.6 Case study: the JELLY incident
The merits of a theoretical framework must ultimately be tested by real market extreme stress. The series of risk events on the Hyperliquid platform in 2025—particularly the JELLY token manipulation case in March—offers us an extremely rare and research-worthy empirical case study. These events not only exposed the hidden fragility of a complex decentralized liquidation architecture but also laid bare the difficult choices decentralized governance faces at the moment of crisis, and further revealed the inherent limitations of a market-based risk-underwriting mechanism in the face of deliberate malicious gaming. The JELLY incident is worth studying in depth not only because of the sophistication of its attack method and the severity of its consequences, but also because it concentrates the technical design, governance mechanism, and political-economy tensions of the insurance fund in a single event, making it the fullest illustration of this chapter's theoretical arguments.
12.6.1 The HLP architecture
To understand the essence of the JELLY incident, we must first dissect the architecture of Hyperliquid Vaults. Hyperliquid's core innovation lies in its HLP vault system—a community-owned protocol vault that executes multiple automated strategies. After a user deposits USDC to become an LP, the capital is allocated across multiple sub-strategies, sharing the overall profit and loss of the strategy portfolio. Among the most critical sub-strategies are the market-making strategy (continuously providing two-sided quotes on the order book to earn the bid-ask spread) and the liquidation vault. The insurance-fund function is executed precisely as a core strategy embedded within HLP—namely, the liquidation vault. This design of integrating the market-making function and the insurance function within the same vault is the key feature distinguishing Hyperliquid from other protocols and the source of its high capital efficiency: the same pool of capital can both earn market-making returns and serve as a liquidation buffer when needed.
The liquidation vault was designed to solve the problem of liquidity evaporation in a decentralized order book under extreme conditions. Its risk-underwriting process follows a strict hierarchical logic: when a leveraged position's equity falls below the maintenance-margin requirement, the system first attempts to close it via a market order on the public order book—an open, competitive process in which any market participant can act as counterparty to absorb the liquidation order. If order-book depth is insufficient, or excessive price slippage drives the position's equity below two-thirds of the maintenance margin, the position is transferred directly to the liquidation vault. After the liquidation vault takes over all of the shortfall account's positions and remaining margin, it uses its enormous capital reserve to absorb the instantaneous shock, then gradually closes out the position in the market via an algorithm to minimize the damage to the market price. The profit or loss is shared by all HLP LPs [38]. The operating model of the HLP liquidation vault differs fundamentally from a centralized exchange's insurance fund. A CEX insurance fund typically uses a "deficit-covering" model: after the liquidation engine executes the closeout at market, the fund makes up the shortfall, and the fund itself bears no directional risk. The HLP liquidation vault, by contrast, uses a "position-takeover" model: it takes over the shortfall account's positions and remaining margin in full, bearing the market risk of holding directional exposure until it can gradually close out in the market. This design difference exposes HLP to an additional risk dimension that a CEX insurance fund does not face—"position-holding risk": in extreme conditions, the taken-over position may deteriorate further during the closeout process, and the JELLY incident is precisely the extreme manifestation of this risk dimension.
The design's strength lies in converting an instantaneous liquidation shock into a gradual release of liquidity, enhancing the system's antifragility. As a final line of defense, Hyperliquid also designed an auto-deleveraging mechanism: when the potential loss facing the liquidation vault exceeds a certain threshold, the system force-closes profitable users' positions to make up the liquidation loss, ensuring the protocol's overall solvency. Above ADL, there is also an ultimate discretion layer—the validator consensus mechanism—in which validators can decide by vote whether to carry out a special intervention. In theoretical reasoning, this four-tier defense system, composed of "order-book market closeout → liquidation-vault absorption → ADL ultimate risk-bearing → validator consensus," seems to construct a complete line of defense.
HLP's three major mechanism advantages earned it a high composite score in the evaluation framework of Section 12.5. First, market-based pricing of risk: HLP's annualized return directly serves as a dynamic risk-price signal—when the system faces higher liquidation risk, the higher return expectation attracts more risk-underwriting capital, and conversely it squeezes out excess capital, achieving a dynamic balance between the insurance fund's size and the actual risk exposure. Second, preliminary risk tiering and segregation: allowing users to create custom vaults focused on specific assets or strategies lays a foundation for more refined risk management in the future. Third, enhanced incentive compatibility: liquidation profits belong to the LPs, incentivizing the community to keep optimizing the liquidation strategy and turning risk management from "the platform's burden" into "the community's opportunity."
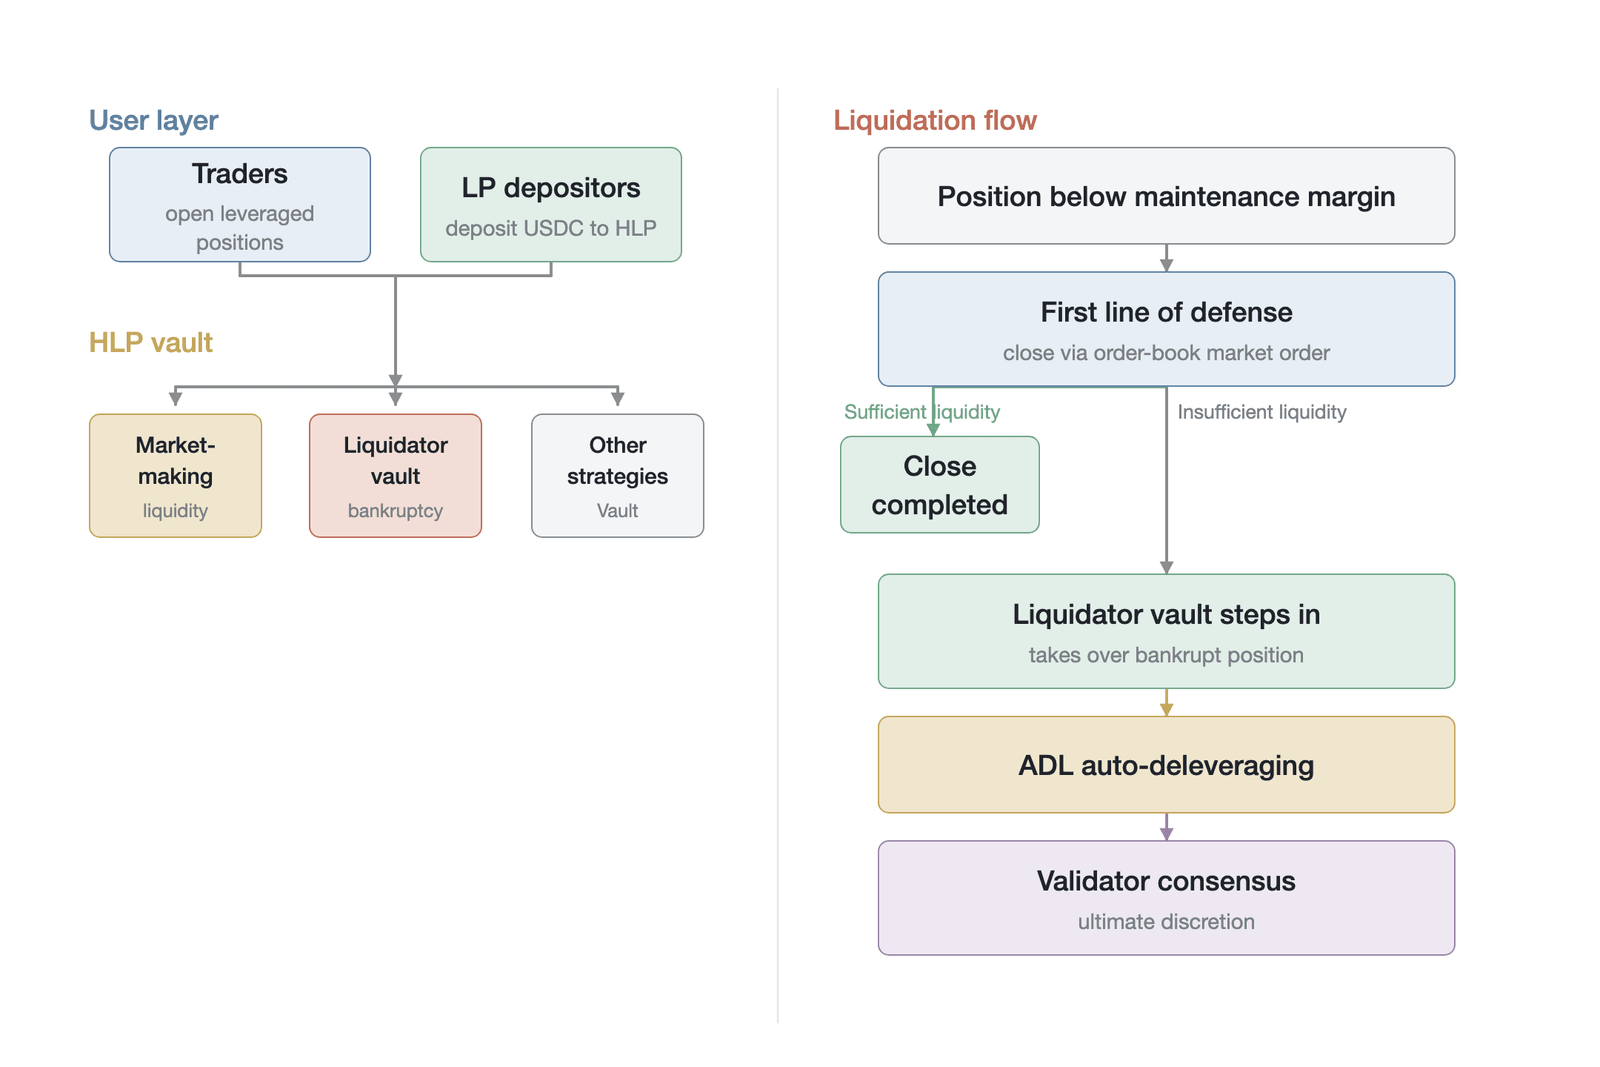
Figure 12-22. The risk-underwriting architecture and liquidation flow of Hyperliquid Vaults
Figure 12-22 presents, with arrows and threshold annotations, the direction of flow and the trigger conditions of this four-tier risk-underwriting architecture. The JELLY incident, however, proved that a significant gap exists between theory and practice.
12.6.2 Timeline of the incident
The JELLY incident of March 26, 2025, however, exposed a structural flaw in this defense system. JELLY was a meme coin issued via Pump.fun on the Solana chain, with a market capitalization of only about $10 million at the time and extremely scarce on-chain liquidity. The attacker precisely exploited a hole in Hyperliquid's risk controls for long-tail assets, carrying out a planned combined attack of cross-chain price manipulation and a liquidation-mechanism loophole [22]. The sophistication of this attack lay in the fact that it did not seek to profit from a directional bet on price but directly targeted the structural flaw of the liquidation mechanism itself.
In the setup phase of the attack, the attacker created three brand-new addresses on-chain and prepared several million dollars in capital. On Hyperliquid, targeting the low-liquidity JELLY, the attacker simultaneously opened a short position with a total value of about $4.5 million (concentrated in one address) and two long positions totaling about $5 million (spread across the other two addresses). This long-short hedged setup left the attacker's net risk exposure to JELLY price movements extremely small. The JELLY incident exposed not only a flaw in the liquidation architecture but, more fundamentally, an absence of basic operational risk controls. In traditional derivatives markets, the pattern of three newly created addresses simultaneously opening opposing enormous positions on the same low-liquidity instrument within a short time would immediately trigger a related-trading surveillance alert; a two-way position of $4.5 million/$5 million against JELLY's market capitalization of only about $10 million means that open interest approached the instrument's entire market capitalization—an obvious manipulation warning signal; and the pattern of actively and gradually withdrawing margin is itself a clear signal of self-liquidation. The above basic anomaly-detection capabilities are standard equipment on traditional derivatives exchanges, and their absence on Hyperliquid reflects the systematic lag of decentralized platforms in building operational risk-control infrastructure. The real source of the attack's profit was not a directional bet on price but arbitrage against the liquidation mechanism itself—that is, by "injecting" a doomed-to-lose short position into the liquidation vault, then manipulating the price in the external market to make the liquidation vault bear an enormous loss, and finally realizing a net profit through the profit on the long positions.
Next came the liquidation-trigger phase. The attacker began to gradually withdraw margin from the address holding the short position, actively pushing that position toward the liquidation line. The key to this operation was "gradual withdrawal" rather than "one-time withdrawal": by precisely controlling the speed of margin withdrawal, the attacker ensured that the timing of the liquidation was precisely synchronized with the rhythm of the cross-chain manipulation. Because JELLY's depth on the Hyperliquid order book was extremely scarce (for a meme coin with a market capitalization of only $10 million, there was almost no counterparty on the order book capable of absorbing a liquidation order of several million dollars), the liquidation engine could not find sufficient liquidity in the market to complete the closeout. Following the system's design logic, this enormous short position was duly transferred to HLP's liquidation vault. At this point the attacker had successfully "injected" an enormous short risk exposure into HLP, and this was the most critical step in the entire attack chain.
At almost the same moment the short position was taken over by the liquidation vault, the attack entered the cross-chain price-manipulation phase. The attacker deployed enormous capital on a decentralized exchange on the Solana chain (mainly Raydium) to buy up JELLY spot frantically. Because JELLY's on-chain liquidity was extremely thin, this concentrated buying drove the token's price to surge by about 400% in an extremely short time [21]. This violent price swing was rapidly transmitted to the Hyperliquid platform via the oracle. The oracle was designed to ensure consistency between the on-chain price and the off-chain market price, but in this scenario the oracle faithfully relayed an artificially manipulated price signal, instead becoming an indispensable transmission tool in the attack chain. This link reveals a systemic risk in the cross-chain DeFi ecosystem: when a protocol's risk management depends on price signals from an external market, the manipulability of that external market becomes the protocol's security boundary.
As JELLY's price surged, HLP faced severe solvency pressure. The enormous short position the liquidation vault was forced to hold instantly produced about $12 million to $13.5 million in unrealized losses (OAK Research/Halborn put it at about $12 million; CoinDesk and perp.wiki put it at about $13.5 million, equivalent to a temporary drawdown of about 27% of the HLP vault). This figure was nearly enough to exhaust the entire HLP vault's liquidity buffer. At this point, the system should have triggered the ADL mechanism to resolve the crisis—that is, to make up the liquidation loss by force-closing profitable users' positions. A serious architectural flaw, however, caused the ADL mechanism to fail completely.
ADL's trigger logic is based on the ratio of the liquidation vault's unrealized loss to its corresponding capital pool exceeding a preset threshold. In the system design at the time, however, the liquidation vault's capital pool was not fully segregated from the HLP main pool; the liquidation vault was merely a sub-strategy within HLP, not an independent capital entity. This meant that the denominator of the ADL trigger ratio was set to the entire HLP vault's enormous total assets (hundreds of millions of dollars), rather than the liquidation vault's own standalone capital. Against HLP's capital pool of hundreds of millions of dollars, the $12.3 million loss did not reach the ADL trigger threshold. The after-the-fact fix, which segregated the liquidation vault independently, greatly shrank the denominator of the ADL trigger ratio, markedly improving the safety valve's sensitivity. But the specific trigger-threshold value has not been publicly disclosed to the community; Hyperliquid's documentation describes only the general condition that ADL activates when "account value or the value of an isolated position becomes negative," without giving the precise ratio parameter—itself a transparency issue that needs continual improvement in G2-level governance. The system fell into a contradictory deadlock: an enormous shortfall loss was genuinely occurring, yet the final safety valve remained silent because "the pool was too big." This is precisely the fatal manifestation, under extreme conditions, of the "risk-pool commingling" problem analyzed in this section: the capital of the market-making strategy and the capital of the liquidation strategy were mixed in the same pool, weakening the risk signal and lowering the sensitivity of the safety mechanism.
Faced with the imminent systemic solvency crisis, the Hyperliquid team activated the final tier of the four-tier defense system: the validator consensus mechanism. Within just a few minutes of the crisis erupting, the platform's validators unanimously passed an emergency resolution: to disregard the real market price relayed by the oracle and forcibly overwrite JELLY's settlement price to $0.0095, the level before the manipulation occurred. Based on this artificially set price, the system forcibly closed all related positions, instantly eliminating HLP's book loss of over ten million dollars. The essence of this operation was that the validators collectively exercised a "price discretion," replacing the market price and oracle data with human judgment to preserve the system's overall solvency. In the cleanup phase after the crisis was resolved, Hyperliquid gave a full refund to all innocent JELLY long holders at the fair market price before the event, ensuring that ordinary users did not suffer losses because of the platform's mechanism flaw. The attacker's accounts were frozen, with a final net loss of about $910,000 (Arkham basis, an upper-bound estimate under the scenario that the frozen funds cannot be recovered) [21]. Specifically, the attacker's profit-and-loss structure was roughly as follows: the short position lost all of its margin because of the actively triggered liquidation; the two long positions produced a considerable book profit after the price surged, but the validators' price rollback forcibly restored the settlement price to the pre-attack level, wiping out most of the longs' profit; and the buying slippage on Raydium during the cross-chain price manipulation constituted an additional execution cost. The $910,000 net loss was the final result after netting the above items. A counterfactual analysis reveals the economic impact of the intervention: had the validators not intervened, the attacker's net gain—the long profit minus the short loss and manipulation cost—could have been as high as several million dollars, while HLP would have suffered an actual loss of about $12.3 million. From a purely economic standpoint, the attacker's attack did not succeed in turning a profit; but from the standpoint of system security, the architectural flaw the attack exposed was far more serious than the $910,000 direct loss.
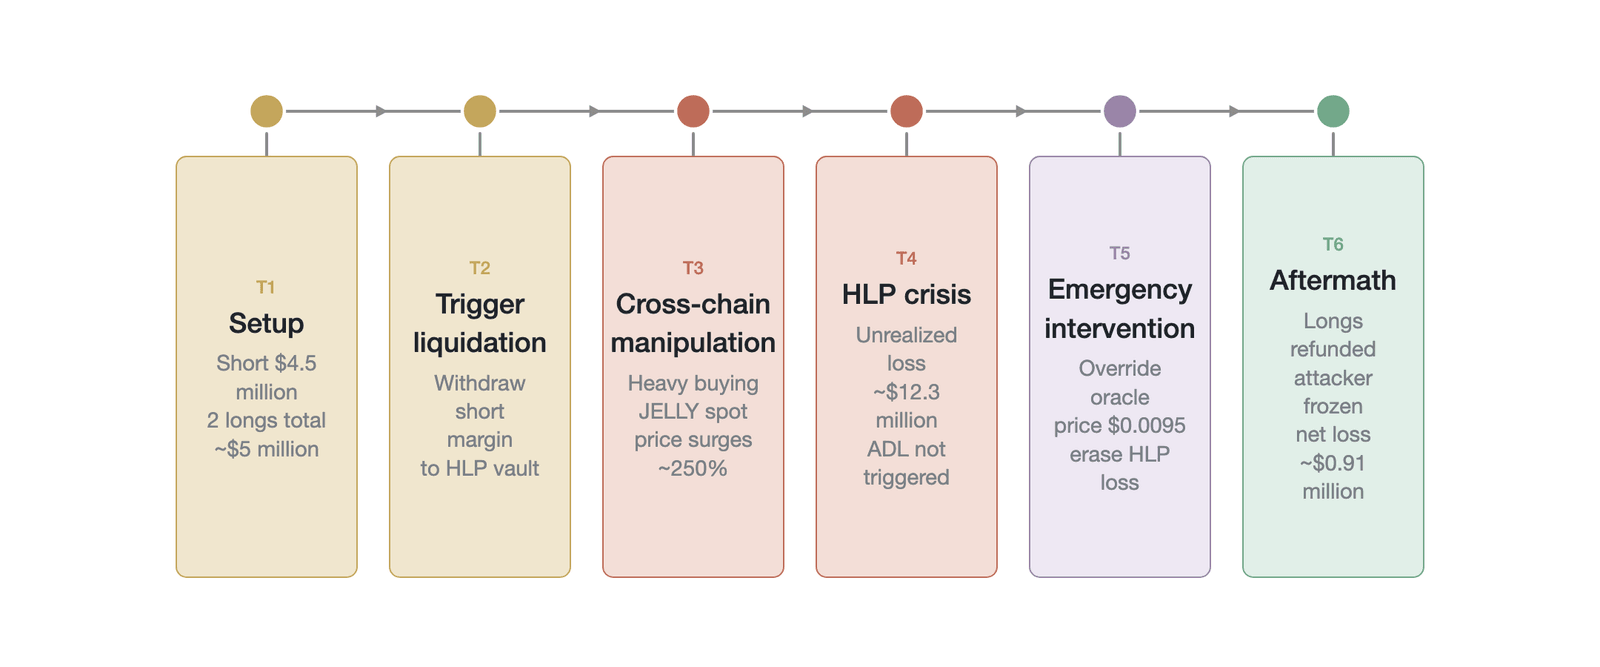
Figure 12-23. Timeline of the JELLY incident's cross-chain manipulation and crisis evolution (the "price surge of about 250%" in the figure is the gain in the initial manipulation window; the cumulative gain to the validator-consensus overwrite point was about 429%, and the "about 400%" in the text lies between the two, reflecting the difference in scope across different time windows of the same event)
Figure 12-23 integrates the time points of each phase, the key operations, and the flow of funds into a complete timeline. The entire attack, from setup to resolution, lasted less than a few hours, showing how fast risk evolves in a cross-chain DeFi environment.
The JELLY incident was not an isolated event but the climax of a series of risk events Hyperliquid experienced in 2025. Earlier, on March 12, 2025, Hyperliquid had already experienced a large whale-manipulation event: a trader used 50x leverage to open a long ETH position of more than $300 million and then triggered liquidation by strategically withdrawing margin, causing HLP to suffer a loss of about $4 million [39]. Although the loss was relatively limited, this event had already exposed HLP's fragility in the face of large directional manipulation and sparked wide community discussion of HLP's safety. And in November 2025, after the JELLY incident, the POPCAT incident further exposed a similar fragility, though its attack vector differed from JELLY's: the attacker withdrew about $3 million in USDC from OKX, split it across 19 wallets, built a POPCAT long with high leverage, placed a fake buy wall of about $20 million on Hyperliquid's own order book to fabricate demand, then abruptly canceled the orders, triggering a liquidation cascade of its own longs and forcing HLP to absorb about $4.9 million in bad debt; the attacker went ahead knowing full well that they would lose all of their roughly $3 million in margin. POPCAT was an on-platform order-book spoofing combined with liquidation-mechanism arbitrage, and did not involve JELLY-style cross-chain spot/oracle manipulation; the two share the common feature of targeting thinly liquid meme coins and being willing to sacrifice their own principal to spill losses onto HLP, and on-chain clustering suggests the two likely came from the same attacker cluster. This "harm yourself to harm others" strategy shows that for premeditated, cost-insensitive directional manipulation, a market-based risk-underwriting mechanism still faces severe challenges: when an attacker's goal is not to profit but to destroy, a defense mechanism based on the assumption of economic rationality will face fundamental failure.
The POPCAT incident is especially worth analyzing in depth because it occurred after Hyperliquid had implemented a series of fixes in response to the JELLY incident. The three core improvements introduced after the JELLY incident (asset segregation of the liquidation vault from the HLP main pool, dynamic position caps based on market capitalization and order-book depth, and a validator-vote delisting mechanism) all failed to effectively defend against the attack in the POPCAT incident. Asset segregation did allow the ADL mechanism to trigger at an appropriate threshold, avoiding the "pool too big so the safety valve stays silent" problem of the JELLY incident; the dynamic position cap, however, was circumvented by the attacker through dispersing addresses and building positions gradually, and the validators' delisting vote failed to start in time before the loss occurred because of the ambiguity of judging "whether an attack has already happened." This outcome reveals a fundamental limitation of institutional evolution: each round of fixes is essentially a targeted patch against the "last attack vector," while an adaptive attacker actively seeks new attack surfaces. This "attack → patch → new attack" evolutionary dynamic is highly isomorphic to the Red Queen effect in biology: the defender must keep evolving merely to maintain the same relative position against the attacker. From the standpoint of economic theory, this evolutionary dynamic can be understood more precisely as a manifestation of Goodhart's law: when the defense rule (the "measure") is transparently made public, the attacker (the "agent") will adjust its strategy specifically to render that rule ineffective. The logic of the Lucas critique applies equally: a defense strategy formulated on the basis of historical attack patterns will change future attack patterns because of the attacker's expectations about the strategy itself. For a decentralized protocol, this means that risk management cannot rely solely on after-the-fact patching of vulnerabilities but must establish a systematic adversarial mindset: incorporating "how an attacker would exploit this rule" as a core consideration at the mechanism-design stage, and reserving sufficient institutional elasticity for unknown attack vectors.
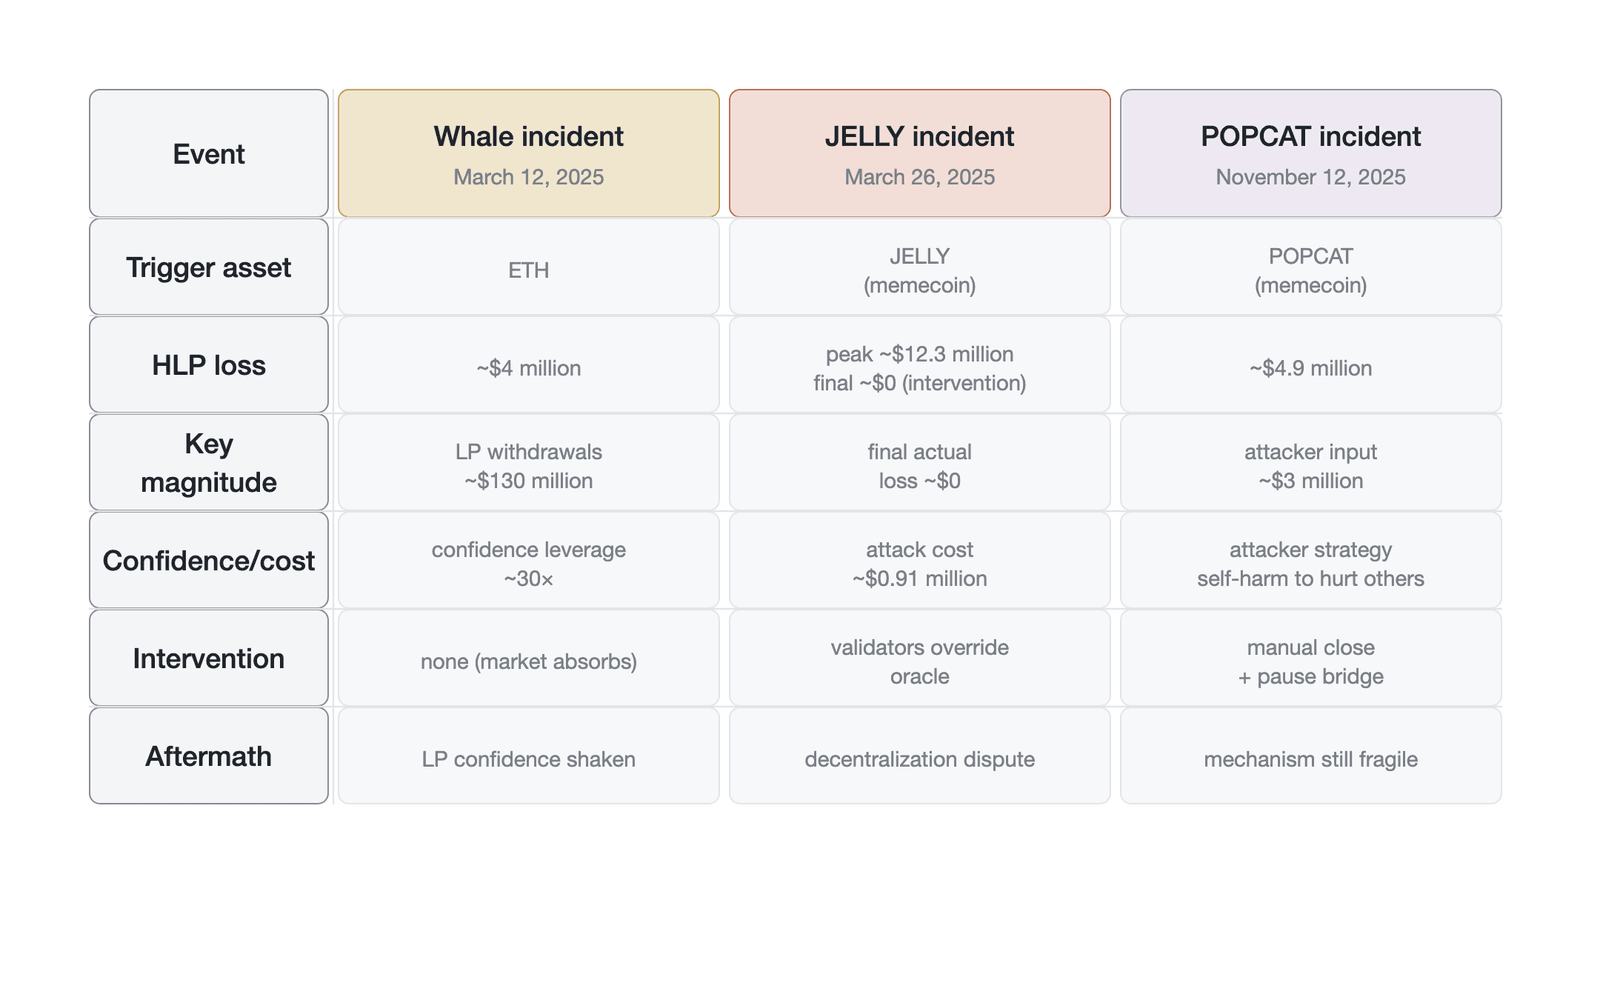
Figure 12-24. A comparison of Hyperliquid's three major risk events in 2025
Figure 12-24 provides a structured comparison of the three events across four dimensions: time, attack method, loss scale, and platform response. From it one can observe three progressive trends: the complexity of the attacks escalated from single-platform manipulation (the March 12 whale incident) to more complex attacks on thinly liquid meme coins, with JELLY embodying cross-chain spot/oracle manipulation and POPCAT embodying on-platform order-book spoofing combined with liquidation-mechanism arbitrage; the attackers' risk appetite shifted from arbitrage-for-profit to a cost-insensitive destructive strategy (the POPCAT attacker was willing to sacrifice about $3 million in principal); and the platform's response also evolved from passively absorbing the loss (the whale incident) to actively intervening in the price (the JELLY incident) and after-the-fact architectural reform. This evolutionary path shows that a market-based risk-underwriting mechanism must iterate its defensive capabilities in lockstep when facing continually evolving adversarial attacks.
12.6.3 The boundaries of decentralized governance
The JELLY incident is a textbook "incomplete contracts" case, proving that no rule system designed in advance can exhaust all malicious attack vectors. No matter how sophisticated the code, there always exist edge cases the rule-makers did not foresee. When such an edge case occurs, the system ultimately relies on a "guarantor of last resort" holding discretion. In traditional finance, this role is played by the central bank or the regulator; in Hyperliquid's case, this role is borne collectively by the validators. This fact pushes decentralized derivatives platforms into a fundamental dilemma, which can be stated precisely as follows: should a protocol whose core narrative is "decentralization" and "code is law" possess an emergency centralized "circuit breaker" when facing an attack capable of destroying it? If the answer is yes, then who should hold this circuit breaker? What are the trigger conditions? And how can its abuse be prevented? If the answer is no, then should the protocol accept the possibility of being destroyed by a deliberate attacker in order to preserve the purity of its decentralization?
Hyperliquid's answer is "validator consensus"—a middle path between fully centralized decision-making and fully ungoverned operation. Validators, as stakeholders in the protocol (typically required to stake a large amount of tokens), have an incentive to maintain the protocol's long-term health. By requiring a unanimous or supermajority vote to pass, this mechanism in theory both preserves the capacity for emergency intervention and reduces the risk of single-point abuse through collective decision-making. It must be squarely acknowledged, however, that when the JELLY incident occurred (March 2025, before the permissionless validator set had gone live, when the network still ran a small foundation-bootstrapped validator set), the Hyper Foundation controlled about 81% of the staked HYPE tokens, and the participation of external independent validators was extremely low. It was precisely this highly concentrated validator structure that allowed the emergency resolution to reach "unanimous passage" with zero opposition in about 2 minutes—a speed that in substance is closer to "a unilateral decision by the core team" than to genuine decentralized consensus. This reality means that Hyperliquid's actual position on the governance spectrum may be closer to G1–G2 than to G2. After the incident, the validator set was expanded to 16 nodes, but the foundation still operates five of them and controls the majority of staked tokens, and the node software remains closed-source. As the validator set decentralizes further, the credibility of this governance mechanism will rise accordingly, but the governance practice at the current stage should be evaluated as it truly is. In the JELLY incident, the validators' decision process was still highly centralized: the decision was made within a few minutes, the community had no time to participate in discussion, and the basis and process of the decision were not adequately recorded or made public. This "act first, explain later" model, though it saved the protocol at the moment of crisis, also posed a severe challenge to the platform's "decentralization" narrative. Critics point out that if validators can overwrite the oracle price and force liquidation within a few minutes, then what is the essential difference between this and the backroom operations of a centralized exchange?
This incident sparked a fierce debate in the community. Supporters argue that in the face of a deliberate malicious attack, protecting the interests of the protocol and users is the highest priority, and the validators' intervention was necessary and justified—just as central banks in traditional finance hold "lender of last resort" discretion during a systemic crisis. Opponents argue that this intervention undermined the fundamental principle of "code is law" and planted the seeds for future selective enforcement and conflicts of interest: if validators can overwrite prices in some situations, then who guarantees they will not abuse this power in other situations for their own benefit?
From a more macro perspective, the JELLY incident reveals an institutional reality of the current stage of DeFi development: absolute decentralization is difficult to achieve fully under current technical conditions. Almost all successful financial systems, whether traditional or crypto, maintain a fragile but necessary balance between rule rigidity and ultimate discretion. Traditional-finance CCPs have "default management committees" to handle extreme situations the rules cannot cover; central banks around the world hold "lender of last resort" discretion to respond to systemic crises; and even Ethereum itself once used a hard fork to "roll back" stolen funds after the 2016 DAO attack. Hyperliquid's validator consensus mechanism is, in essence, a preliminary but necessary practice of this age-old wisdom in a decentralized context. From an operational-security standpoint, the emergency-intervention mechanism itself also constitutes an attack surface: if an attacker could gain control of enough validators' keys or voting power through social engineering or technical means, they could exploit the same emergency-intervention mechanism to carry out a more destructive attack. Moreover, the process of validators completing a unanimous vote "within a few minutes" implies an efficient but possibly insecure communication channel (such as a Telegram group), and whether such channels themselves become a security hazard is worth examining. The design of an emergency-intervention mechanism must solve not only the governance problem of "who has the authority to intervene" but also the operational-security problem of "how the intervention process itself is protected."
After the incident, Hyperliquid quickly implemented a series of systematic fixes, seeking to plug the exposed loopholes without abandoning the market-based risk-underwriting model. It strictly segregated the liquidation vault's assets from the HLP main pool and set an independent ADL trigger threshold for the liquidation vault, thoroughly fixing the mechanism failure caused by risk commingling: this means that even if the liquidation vault's loss is negligible relative to HLP's total assets, ADL will be triggered as soon as it exceeds the threshold relative to the liquidation vault's own capital. On this basis, it introduced a dynamic position-cap formula based on real market capitalization and order-book depth, curbing the excessive leveraging of long-tail assets at the source: if a token's market capitalization is only $10 million, the system will no longer allow the accumulation of open interest of several million dollars on that instrument, so that an attacker cannot build an enormous position on a low-liquidity asset large enough to threaten the system. Third, it granted validators the power to delist abnormal assets through an on-chain vote, providing an institutionalized tool for responding to similar long-tail-asset manipulation in the future [40].
The POPCAT incident of November 2025, however, showed that although these fixes plugged the specific loopholes exposed in the JELLY incident, they did not fundamentally resolve the fragility of a market-based risk-underwriting mechanism in the face of deliberate manipulation. When an attacker is willing to bear a net loss of several million dollars to create larger-scale systemic destruction, any defense mechanism based on the assumption of economic rationality will face a challenge. This recognition leads us to a deeper proposition: the design of an insurance-fund mechanism is not only a problem of technical optimization but also a political-economy problem concerning risk, power, and trust. As the chapter title reveals, the insurance fund is the node where "technical design" and "political governance" intersect most deeply in the perpetual-futures system; its technical dimension can be optimized with actuarial models, but its governance dimension involves questions of power, trust, and the distribution of interests—questions that cannot be solved by code, but only constrained by institutions.
12.7 Chapter summary
With this, we have completed a systematic analysis of the institutional arrangement that is the insurance fund. As the concluding piece of Part Four, "Design: The Core Mechanisms of Perpetual Futures," this chapter extends the risk management of perpetual futures from the purely technical level to the institutional level of interest gaming, power distribution, and trust-building. The insurance fund and auto-deleveraging together constitute a dual socialization mechanism for responding to extreme risk. Through ex ante pooling, the insurance fund absorbs within the system the negative externalities generated by high-leverage trading, and its core output is not investment return but the irreplaceable settlement credibility and rule predictability—the concrete embodiment, in the crypto derivatives domain, of the core function of financial market infrastructure emphasized in the Bank for International Settlements' Principles for Financial Market Infrastructures. And when this mechanism's funds are exhausted, ADL, as the ultimate means of ex post allocation, is forced to activate, always facing an irreconcilable trilemma among solvency, long-term revenue, and user fairness. The roughly $650 million in excess haircut in the 10/10 event, and the near-zero profit-to-loss symmetry ratio, reveal through empirical data the fundamental inadequacy of static ADL strategies in the face of complex market environments.
The confidence-as-liquidity hypothesis proposed in this chapter reveals the deeper economic significance of the insurance fund. The fund's signaling function is far more important than its mere capacity to absorb capital. The empirical evidence from the Hyperliquid whale incident—"a $4 million actual loss triggering $130 million in panic withdrawals"—displays a correlational amplification effect of about 32.5 times, far exceeding the amplification of any capital leverage (although this factor may be affected by contemporaneous macro factors, social-media information cascades, and other confounders). The nonlinear "cliff effect" between confidence and the adequacy ratio shows that managing confidence is, in essence, the highest-order form of risk management.
The actuarial adequacy-ratio model transforms the vague qualitative question of "whether the fund is large enough" into a rigorous quantitative analysis based on the tail-risk distribution. The procyclical paradox that the adequacy ratio exhibits, however (accumulating when it is least needed and drying up when it is most needed), directly reveals the structural defect of relying on liquidation penalties as a single revenue source. The maturity mismatch between "the gradual accumulation of revenue" and "the sudden eruption of expenditure" is a fundamental challenge that insurance-fund design must squarely confront.
In addition, the existence of an insurance fund inevitably breeds a dual moral hazard: traders tend to take on greater risk because of implicit risk-bearing, while platform operators face the temptation to misappropriate funds or abuse discretion. The extreme case of FTX fabricating its insurance fund warns us that "being insured" by no means equals "being safer"; insurance itself may create new systemic risk. We therefore introduced the G0-to-G3 governance spectrum, pointing out that the governance of the insurance fund is often the weakest link in a platform's entire verifiability ladder. Visible size does not equal transparent rules; only when the process is open to scrutiny can trust be established.
Based on the above insights, we distill five design principles for building a robust mechanism: risk must be precisely priced to eliminate cross-subsidies; the platform's interests must be deeply bound to the system's robustness to preclude moral hazard; the operating process must have an extremely high degree of verifiability to establish trust; complex risks must be finely tiered and segregated to prevent contagion; and, at the same time, the "guarantor of last resort" holding ultimate discretion must be acknowledged and severely constrained by institutions. Figure 12-25 integrates the causal chain of the three chapters of Part Four into a single complete arc—from the routine regulation of the funding rate, to the eruption of a liquidation cascade, to the absorption by the insurance fund and the final allocation by ADL—intuitively presenting the hierarchical progression among these mechanisms.
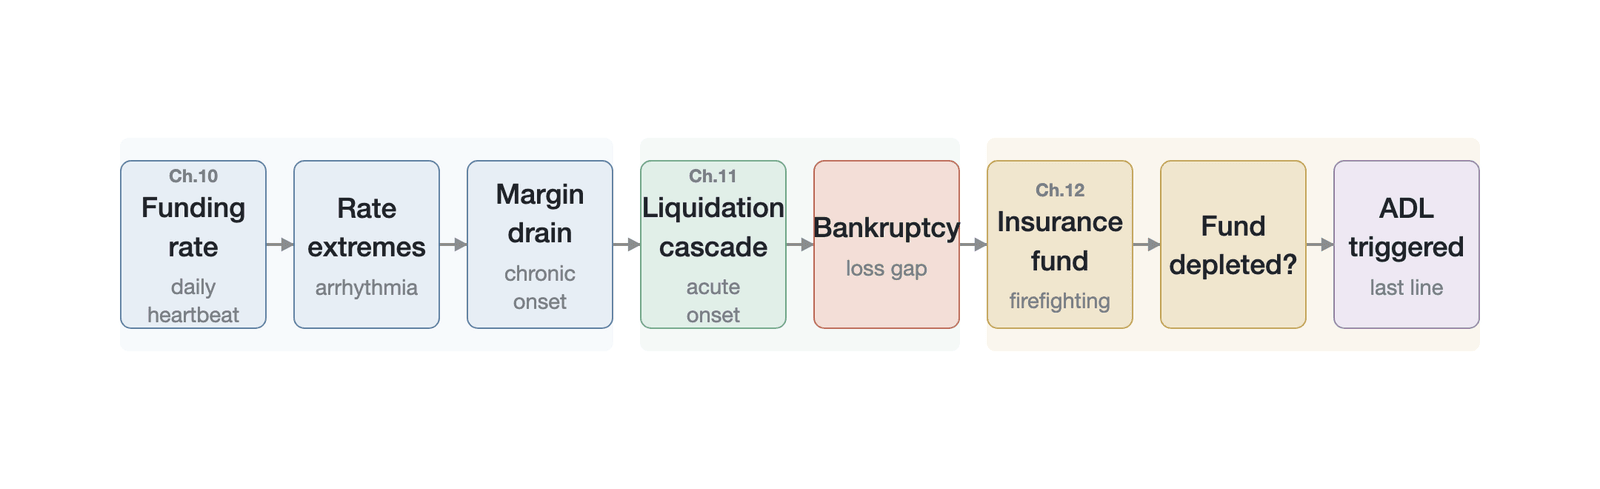
Figure 12-25. The complete causal arc of Part Four
With the end of this chapter, the complete arc of Part Four is now closed. We have clearly seen a tight causal chain: from the routine regulatory function of the funding rate in Chapter 10, to the systemic imbalance triggered when the rate mechanism fails under extreme conditions; from the continuous depletion of margin, to the large-scale chain liquidation and cascade reflexivity triggered by the liquidation engine in Chapter 11; and when this series of shocks finally breaks through individual defenses and produces a shortfall gap, this chapter's insurance fund steps in as a risk-absorption layer to fill the loss; and once the fund is exhausted, ADL, as the ultimate risk-allocation mechanism, forcibly apportions the loss to profitable traders. These three chapters are not a parallel enumeration of three independent mechanisms but a complete life-cycle narrative running from normal operation to extreme collapse to crisis cleanup. The design quality of this set of core mechanisms directly determines the safety, capital efficiency, and basic fairness of perpetual futures as a financial product, and it lays a systematic mechanistic foundation for our subsequent discussion of the market's price discovery, arbitrage behavior, liquidity evolution, and volatility characteristics.
Having understood how the various links of the market mechanism operate in coordination, the next part will formally enter the domain of price discovery, exploring how a bewildering welter of information is incorporated into prices, how external price benchmarks invisibly shape the form of the market, and just what level of informational efficiency the market attains in this friction-filled crypto world.
References
[1] Marshall, M. (2025). How \$3.21B vanished in 60 seconds: October 2025 crypto crash explained through 7 charts. Amberdata Research Blog. https://blog.amberdata.io/how-3.21b-vanished-in-60-seconds-october-2025-crypto-crash-explained-through-7-charts (accessed June 2026)
[2] FTI Consulting. (2025, December). Crypto crash Oct 2025: Leverage meets liquidity. https://www.fticonsulting.com/insights/articles/crypto-crash-october-2025-leverage-met-liquidity
[3] Decrypt. (2020, April). How Black Thursday reshaped the Bitcoin futures market. https://decrypt.co/26299/black-thursday-reshaped-bitcoin-futures-market-report
[4] Ledger Prime Research. (2021, August). Crypto's Black Thursday: The market crash of March 2020. https://www.research.ledgerprime.com/p/cryptos-black-thursday-the-market
[5] WhiteRabbit. (2020, March). Black Thursday for MakerDAO: \$8.32 million was liquidated for 0 DAI. Medium. https://medium.com/@whiterabbit_hq/black-thursday-for-makerdao-8-32-million-was-liquidated-for-0-dai-36b83cac56b6
[6] Jensen, M. C., & Meckling, W. H. (1976). Theory of the firm: Managerial behavior, agency costs and ownership structure. Journal of Financial Economics, 3(4), 305–360. https://doi.org/10.1016/0304-405x(76)90026-x
[7] Bank for International Settlements. (2012, April). Principles for financial market infrastructures. CPSS-IOSCO. https://www.bis.org/cpmi/publ/d101a.pdf
[8] Binance. (n.d.). Auto-deleveraging. Binance Support. https://www.binance.com/en/support/faq/auto-deleveraging
[9] Drift Protocol. (n.d.). Socialized loss & ADL. Drift Protocol Documentation. https://docs.drift.trade/
[10] Chitra, T. (2025). Autodeleveraging: Impossibilities and optimization. arXiv preprint, arXiv:2512.01112. https://arxiv.org/abs/2512.01112 https://doi.org/10.48550/arXiv.2512.01112
[11] CoinGlass. (2025). Liquidation data — October 10, 2025. https://www.coinglass.com/liquidation
[12] Lo, A. W. (2004). The adaptive markets hypothesis: Market efficiency from an evolutionary perspective. Journal of Portfolio Management, 30(5), 15–29.
[13] Diamond, D. W., & Dybvig, P. H. (1983). Bank runs, deposit insurance, and liquidity. Journal of Political Economy, 91(3), 401–419. https://doi.org/10.1086/261155
[14] Arkham Intelligence. (2025). Hyperliquid whale passes \$4M loss to HLP vault. Arkham Research. https://info.arkm.com/research/hyperliquid-whale-passes-4m-loss-to-hlp-vault
[15] Kahneman, D., & Tversky, A. (1979). Prospect theory: An analysis of decision under risk. Econometrica, 47(2), 263–291. https://doi.org/10.2307/1914185
[16] Banerjee, A. V. (1992). A simple model of herd behavior. The Quarterly Journal of Economics, 107(3), 797–817. https://doi.org/10.2307/2118364
[17] Bikhchandani, S., Hirshleifer, D., & Welch, I. (1992). A theory of fads, fashion, custom, and cultural change as informational cascades. Journal of Political Economy, 100(5), 992–1026. https://doi.org/10.1086/261849
[18] Shiller, R. J. (2019). Narrative Economics: How Stories Go Viral and Drive Major Economic Events. Princeton University Press. https://doi.org/10.1515/9780691189970
[19] The Block. (2023). FTX used random numbers to generate the size of its insurance fund. https://www.theblock.co/post/255352/ftx-used-random-numbers-to-generate-the-size-of-its-insurance-fund
[20] Asmussen, S., & Albrecher, H. (2010). Ruin probabilities (2nd ed.). World Scientific.
[21] Oak Research. (2025). Hyperliquid JELLY attack: Context, vulnerability, team solution. https://oakresearch.io/en/analyses/investigations/hyperliquid-jelly-attack-context-vulnerability-team-solution
[22] Halborn. (2025). Explained: The Hyperliquid hack (March 2025). https://www.halborn.com/blog/post/explained-the-hyperliquid-hack-march-2025
[23] Chainalysis. (2023). Oracle manipulation attacks rising: A unique concern for DeFi. https://www.chainalysis.com/blog/oracle-manipulation-attacks-rising/ (archived at web.archive.org)
[24] Smart Contract Hacking. (2025). Oracle manipulation & price manipulation attacks. https://smartcontractshacking.com/attacks/oracle-manipulation-attacks
[25] Solidus Labs. (2022). The Mango Markets exploit: An order book analysis. https://www.soliduslabs.com/post/mango-hack
[26] U.S. Securities and Exchange Commission. (2023). SEC charges Avraham Eisenberg with manipulating Mango Markets [Press release]. https://www.sec.gov/newsroom/press-releases/2023-13
[27] United States v. Eisenberg, No. 23-cr-10 (S.D.N.Y. May 23, 2025) (order granting Rule 29 motion and vacating conviction); see also CoinDesk. (2025, May 24). Mango Markets exploiter Avraham Eisenberg's fraud conviction overturned.
[28] Hart, O., & Moore, J. (1990). Property rights and the nature of the firm. Journal of Political Economy, 98(6), 1119–1158. https://doi.org/10.1086/261729
[29] Akerlof, G. A. (1970). The market for "lemons": Quality uncertainty and the market mechanism. The Quarterly Journal of Economics, 84(3), 488–500. https://doi.org/10.2307/1879431
[30] Spence, M. (1973). Job market signaling. The Quarterly Journal of Economics, 87(3), 355–374. https://doi.org/10.2307/1882010
[31] European Union. (2023). Regulation (EU) 2023/1114 of the European Parliament and of the Council of 31 May 2023 on markets in crypto-assets (MiCA). Official Journal of the European Union. https://eur-lex.europa.eu/eli/reg/2023/1114/oj
[32] CoinGecko. (2026, February). What is October 10th? Crypto's 10/10 mass market liquidation event. https://www.coingecko.com/learn/october-10-crypto-crash-explained
[33] Adrian, T., & Brunnermeier, M. K. (2016). CoVaR. American Economic Review, 106(7), 1705–1741.
[34] Acharya, V. V., Pedersen, L. H., Philippon, T., & Richardson, M. (2017). Measuring systemic risk. The Review of Financial Studies, 30(1), 2–47. https://doi.org/10.1142/9789814417501_0003
[35] Binance. (n.d.). Insurance fund & SAFU. Binance Support. https://www.binance.com/en/support/faq/insurance-fund
[36] dYdX. (n.d.). dYdX community dashboard. https://dydx.community/dashboard
[37] Hyperliquid. (n.d.). Hyperliquid vaults dashboard. https://app.hyperliquid.xyz/vaults
[38] Hyperliquid. (n.d.). Hyperliquid documentation. https://hyperliquid.gitbook.io/hyperliquid-docs
[39] The Block. (2025). Hyperliquid whale 50x leverage ETH event. https://www.theblock.co/post/344553/hyperliquid-whale-50x-leverage-eth
[40] Hyperliquid. (2025). Post-JELLY risk-management updates [Documentation, risk-management/clearinghouse section]. Hyperliquid Documentation. https://hyperliquid.gitbook.io/hyperliquid-docs (accessed June 2026; see the documentation's risk-management section)