On February 21, 2025, a security incident of unprecedented scale exposed the complex reality of how information propagates through crypto markets. More than $1.5 billion in digital assets was stolen from the cold wallet of Bybit, the world's second-largest exchange [1]. Although the movement of this enormous sum was fully public and transparent on the blockchain, the market's reaction exhibited a pronounced time lag and structural divergence. For nearly two hours after the anomalous transfer, the price of Ether moved only slightly. Only when Bybit's chief executive officer (CEO) formally confirmed the hack on social media did the price swing sharply within a few dozen minutes, with ETH falling rapidly from $2,828 to $2,708, a drop of 4.2% [2].
During this crisis, different markets absorbed the information at markedly different speeds and magnitudes. The perpetual futures market came under pressure first, and the spot market followed. Even more striking was the shock to market depth: within hours of the event's confirmation, the 1% market depth for Bitcoin, Ether, and the top 50 altcoins fell by 59%, plunging from $68 million to $28 million [3]. Why is one and the same piece of public on-chain information digested at different speeds across different trading venues? Why, when the data are fully public, does the market still exhibit an information-asymmetry window lasting as long as two hours? A second, more granular scenario reveals another face of the price discovery mechanism. At the level of market microstructure, price divergence for the same asset across different markets is common. For example, the last traded price of Bitcoin perpetual futures on one leading exchange might be $61,234, while the last traded price in the spot market of another major exchange is $62,087. Within the same second, the two prices differ by about 1.4%. Faced with two different prices for the same asset, which is the "real" one? The standard textbook answer is that the more efficient a market's price discovery, the closer its price lies to true value. Yet at this particular microstructural moment, the lower perpetual futures price did not arise because informed traders possessed fundamental information that Bitcoin should depreciate; it arose because a liquidation cascade was unfolding in the perpetual futures market. Forced-liquidation sell orders pushed the price below its fundamental level. Five minutes later, the liquidations ended, and the perpetual price recovered and reconverged with spot. The $853 gap generated during those five minutes was not information but mechanical noise. These two contrasting scenarios distill the central questions of this chapter: In digital asset markets dominated by perpetual futures, how does the process of price discovery unfold? And how does it differ fundamentally from traditional financial markets?
The perpetual futures market plays a dual role in price discovery. On the one hand, under normal market conditions, perpetual futures are an efficient price discovery instrument: high leverage, low barriers to entry, and abundant liquidity make them the venue of choice for informed traders to express their views, and information is incorporated into prices there fastest. On the other hand, under extreme market conditions, their mechanism design injects non-informational noise into prices: the liquidation mechanism, funding rates, and the way the mark price is calculated inject substantial mechanical noise, causing prices to deviate systematically from fundamentals. Understanding this dual character—accelerated information incorporation coexisting with noise injection—is key to assessing the efficiency of perpetual futures markets.
Systematically dissecting this process is key to understanding how crypto markets work. Section 13.1 establishes the theoretical foundations of price discovery and examines how information is converted into order flow. Section 13.2 constructs the three-stage price discovery model, decomposing price discovery into three separable processes: expression, aggregation, and transmission. Section 13.3 proposes the venue gravity model to explain why perpetual futures attract the most informed traders. Section 13.4 analyzes cross-market price competition through the information flow topology. Section 13.5 dissects the three pathways through which perpetual futures inject mechanical noise. Section 13.6 develops the ceiling-floor model to delineate the boundaries of efficiency. Sections 13.7 and 13.8 examine, respectively, the obstacles to price discovery under extreme conditions and the new paradigm brought by on-chain order book decentralized exchanges (DEXs). Drawing these analyses together, Section 13.9 summarizes the dual nature of perpetual futures in price discovery.
13.1 The theoretical foundations of price discovery
Price discovery is the most central function of financial markets. In essence, it aggregates the private information dispersed across the minds of countless participants into a single public, consensus price through the interaction of market mechanisms [4]. In classical microstructure theory, the Kyle model and the Glosten-Milgrom model provide the foundational framework for understanding this process. Yet the distinctive three-dimensional information space of crypto markets, their 24/7 continuous trading, extremely high leverage, and the transparency of on-chain data require a systematic reconstruction of these classical models. This section builds all the theoretical tools needed for the analysis that follows and shows how information is priced through order flow.
13.1.1 The three-dimensional information space of crypto markets
Information is the starting point of price discovery. In traditional financial markets, information is typically divided into public information (such as macroeconomic data and corporate earnings) and private information (such as insider knowledge and institutions' in-depth research). The underlying architecture of crypto markets—the blockchain—expands the information space from two dimensions to three, introducing an entirely new dimension: on-chain observable information.
To understand the structure of this three-dimensional information space systematically, Table 13-1 compares the three information types across four dimensions: accessibility, interpretation threshold, typical sources, and crypto-specific examples. This classification framework reveals a key difference: the boundary between public and private information is relatively clear in traditional finance, whereas the introduction of on-chain observable information blurs that boundary—it is technically open to everyone, yet in practical terms it may carry informational value only for a handful of specialized institutions.
| Information type | Accessibility | Interpretation threshold | Typical sources | Crypto-specific examples |
|---|---|---|---|---|
| Public information | Accessible to everyone | Relatively low | News media, official announcements, macroeconomic data releases | Exchange listing/delisting announcements, regulatory policies (e.g., the SEC or MiCA), on-chain governance voting results of protocols |
| Private information | Held by only a few | Relatively high | Internal decisions, in-depth investment research, high-frequency trading algorithm signals | A project team's soon-to-be-announced partnership, token unlock schedules, a market maker's current inventory state and risk exposure |
| On-chain observable information | Technically visible to everyone | Extremely high | Blockchain explorers, the mempool, on-chain analytics tools | Large fund transfers by whale addresses, computable liquidation thresholds in DeFi protocols, pending transactions not yet included in a block |
Table 13-1. A multidimensional comparison of three information types: public information, private information, and on-chain observable information (Data source: compiled by the author)
This three-dimensional information space fundamentally alters the nature of information asymmetry. In traditional markets, information asymmetry arises primarily from who possesses the information; in crypto markets, especially when confronting vast volumes of on-chain data, it arises more from who can interpret the information faster and more accurately. Even among participants of comparable technical ability, cognitive biases can produce systematically divergent readings of the same on-chain data. The anchoring effect leads observers to classify a large transfer as "internal wallet rotation," a high-frequency prior event; confirmation bias prompts people to selectively ignore anomalous features inconsistent with their existing judgment; and the availability heuristic, reinforced by the recent absence of major security incidents, further depresses risk assessments. Together, these cognitive factors and the technical barrier form a multilayered wall to information interpretation.
On-chain data has the characteristic of being "public but non-consensus." Although anyone can view every transaction through a blockchain explorer, the raw hexadecimal data are unreadable to ordinary investors. Only analytical teams with professional data-engineering capabilities—such as Nansen, Arkham, or quantitative hedge funds—can extract valuable trading signals from these vast datasets. As the Bybit hack demonstrated, even though the anomalous transfer had already occurred on-chain and was publicly visible, the market still lagged nearly two hours before reacting. Subsequent investigation revealed this to be a supply chain attack targeting the Safe{Wallet} multisig infrastructure: by compromising a developer's terminal, the attackers injected malicious code into the signing interface, so that the transaction was tampered with at the moment of signing—something Bybit's internal operational monitoring systems could barely detect in real time. This phenomenon is known as the transparency paradox: absolute data transparency does not deliver absolute information symmetry. The information delay stemmed not only from the inadequacy of external monitoring tools but also from the operational stealth of the attack itself: when a malicious transaction is disguised as a legitimate operation at the signing layer, even institutions with on-chain monitoring capabilities struggle to link the anomalous transfer to a security incident in the first instant. By raising the threshold of data processing, this paradox widens the information gap between technically advantaged institutions and ordinary retail investors.
Figure 13-1 shows the time lag between the anomalous on-chain transfer and the market price reaction during the Bybit hack.
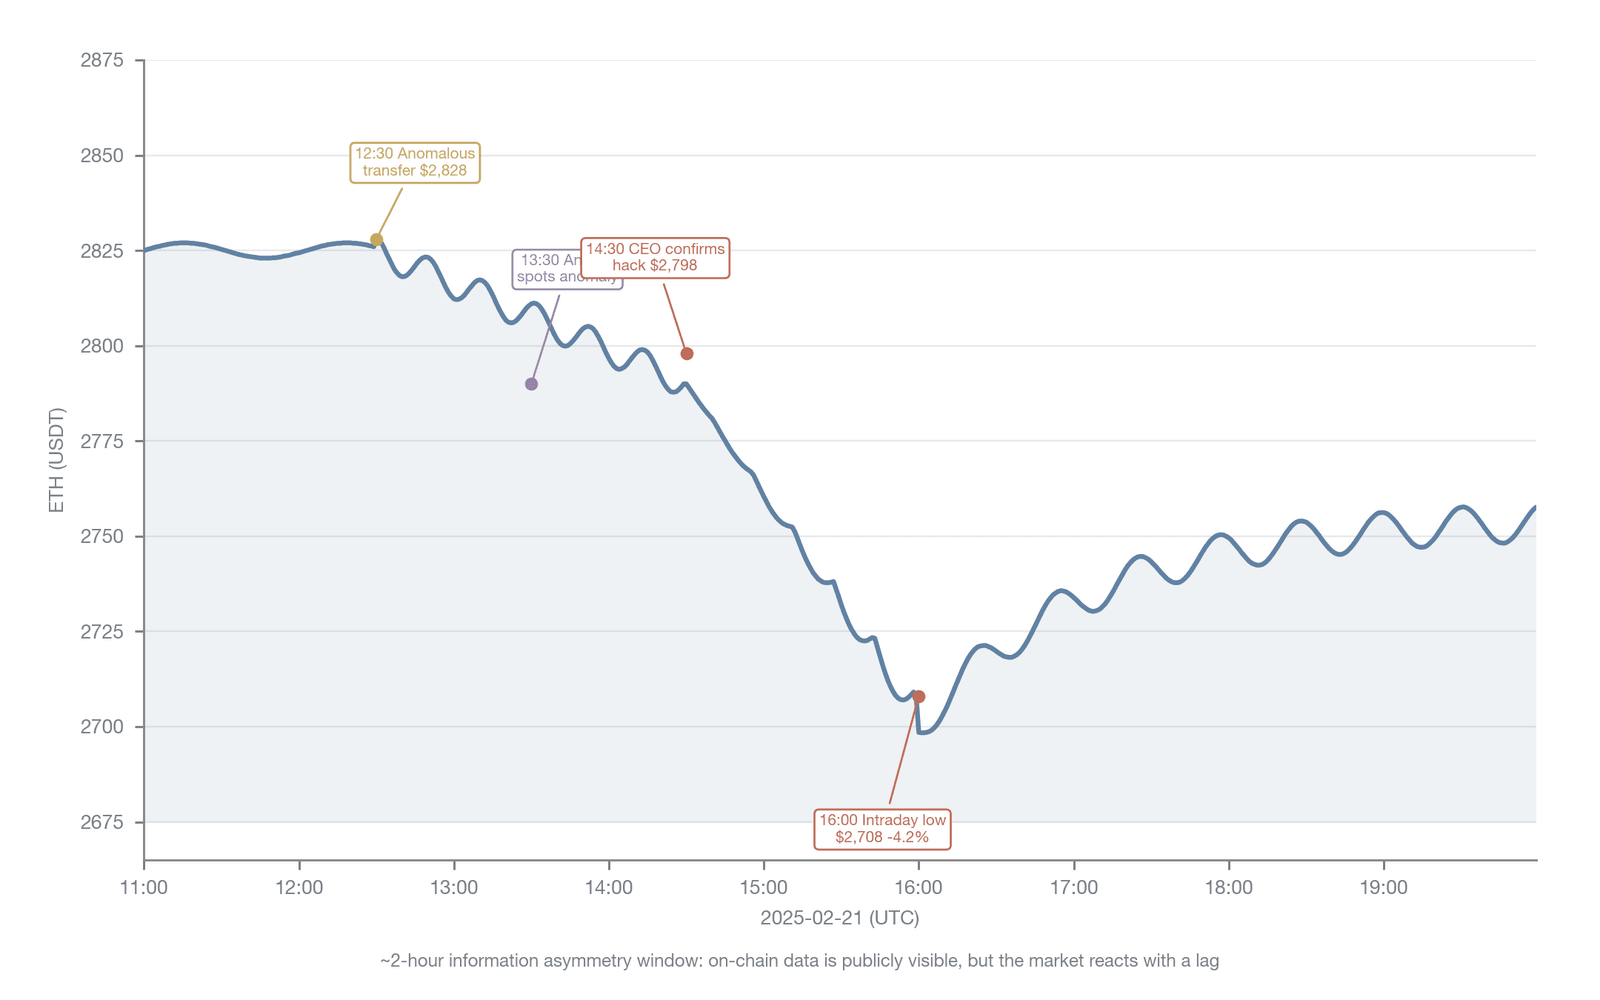
Figure 13-1. The information-asymmetry window and reaction timeline of the ETH price during the Bybit hack (price path is illustrative; key event points are empirical, per Kaiko/CoinDesk; time anchors are calibrated to the official timeline)
As shown in Figure 13-1, even though the on-chain data were fully public, the market reaction still lagged significantly, highlighting the gap between information access and information interpretation. In the nearly two hours after the anomalous on-chain transfer, only a handful of institutions with real-time monitoring and automated analytical capabilities exerted directional pressure on the price, while the vast majority of market participants did not begin to adjust their positions until the CEO publicly confirmed the incident on social media. This delay reveals that information asymmetry in crypto markets stems not from the inaccessibility of data but from the uneven distribution of the capacity to parse it.
Information asymmetry manifests not only in the delay of price reactions but also in dramatic shifts in liquidity structure. Figure 13-2 compares three key liquidity metrics before and after the confirmation of the Bybit hack: 1% market depth, Bybit's share of global liquidity, and ETH perpetual futures open interest.
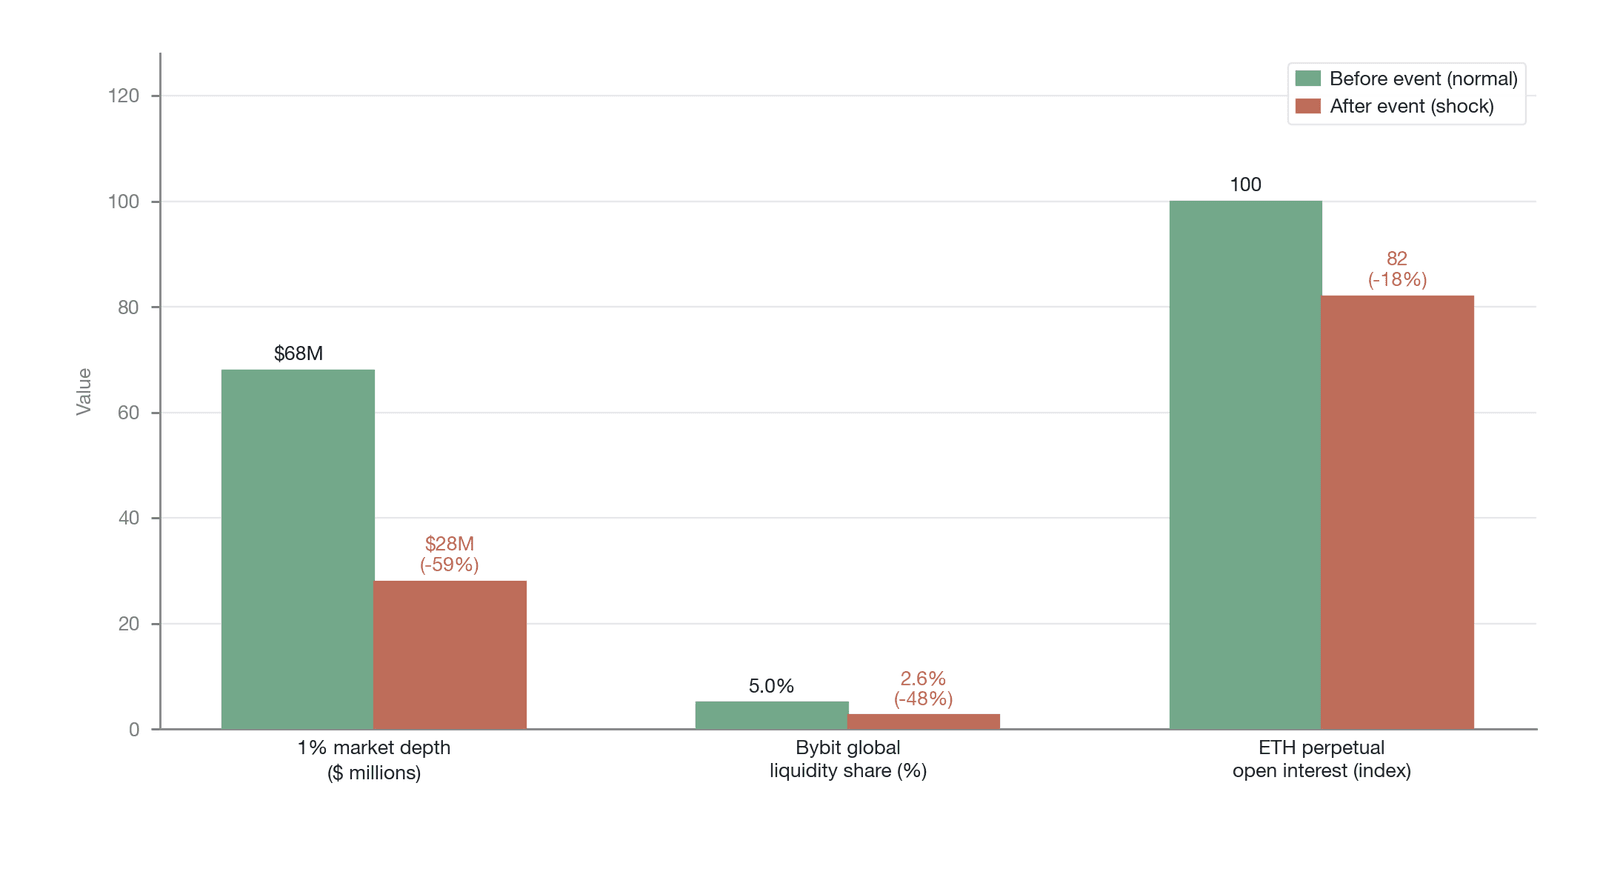
Figure 13-2. Changes in market liquidity depth before and after the Bybit hack (pre- and post-event depth relies on Kaiko paid data, not independently verified)
Figure 13-2 shows that at moments of high information asymmetry, the rational response of market makers is to withdraw liquidity. Market depth fell from $68 million to $28 million not linearly but in a concentrated fashion within the first 30 minutes after confirmation, then held at a low level for several hours; its evaporation took only a few dozen minutes, while recovery to pre-event levels took roughly several days, forming a pronounced asymmetry of "minute-scale evaporation versus day-scale recovery." This pattern reflects market makers' "retreat first, assess later" strategy when facing unquantifiable adverse-selection risk.
Having clarified the distinct features of the three information types, the transmission relationships among them are equally important. Figure 13-3 summarizes the overall architecture of the three-dimensional information space of crypto markets, together with the transmission paths and convergence nodes of each of the three information types.
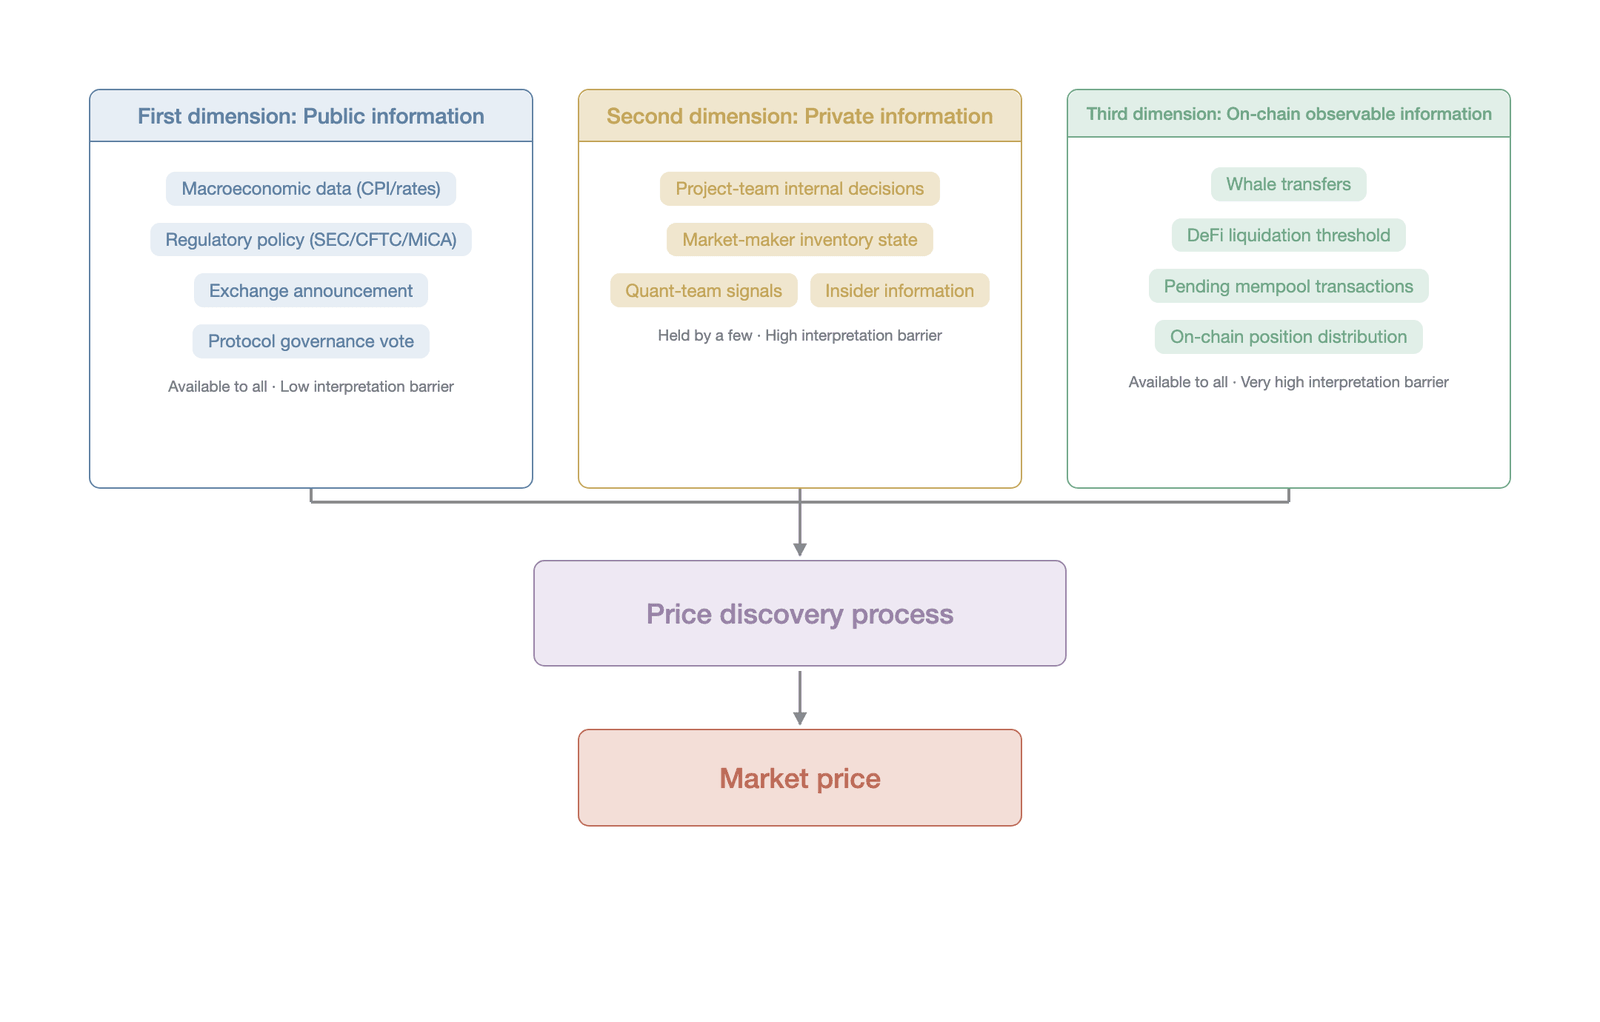
Figure 13-3. The three-dimensional information space of crypto markets and its transmission paths
Figure 13-3 reveals a core paradox of on-chain observable information: although such data are open to everyone, the extremely high interpretation threshold makes them function, in practical terms, much like private information—only a handful of specialized institutions can convert them into a trading advantage. This paradox challenges a classical assumption of the Kyle model: in the traditional framework, public information should be priced in instantly, yet the "public but non-consensus" character of on-chain data in crypto markets blurs the boundary between public and private information. In the price discovery analysis that follows, therefore, information cannot be classified by accessibility alone; the technical-capability threshold required for its interpretation must also be considered.
13.1.2 The Kyle model
To understand how information enters prices, we must look closely at the microstructure level. The classic model proposed by Albert Kyle in 1985 offers a concise and systematic game-theoretic framework [5]. The model divides market participants into three classes: informed traders, noise traders (or liquidity traders), and market makers.
In the crypto context, an informed trader might be an analyst who detects a hack early through on-chain monitoring, or a hedge fund that possesses some quantitative signal. Such traders hold private information about an asset's future value and seek to profit from it through trading. However, if they dump a large order all at once, they immediately alert market makers and trigger a large adverse price move (a substantial price impact). Informed traders therefore behave strategically: they split large orders into smaller ones and inject them into the market gradually over time.
Noise traders, by contrast, are participants who trade for non-informational reasons—for example, to hedge risk, rebalance a portfolio, or simply as retail investors driven by market sentiment. In the model, they play the role that directly determines market liquidity: they provide "cover" for informed traders. When market makers observe the order flow, they see the aggregate order flow, a blend of informed orders and noise orders, and cannot accurately distinguish the true source of each order. Without noise traders, every action of an informed trader would be perfectly identified by market makers, and the price discovery process would immediately stall.
Market makers, as liquidity providers, have as their core task to "learn from the order flow." They observe net buying or selling pressure and infer the underlying true value through Bayesian updating, adjusting their quotes accordingly. The magnitude by which market makers adjust their quotes is governed by a key parameter: Kyle's lambda ().
Mathematically, the price change is linear in net order flow: .
Kyle's lambda () measures the degree to which order flow impacts price; it simultaneously reflects two key market characteristics: market depth and the degree of information asymmetry. Specifically, the smaller is, the smaller the price change caused by absorbing an order of a given size, and the better the market depth; conversely, the larger is, the higher the proportion of "toxic" information (i.e., informed trading) that market makers believe the current order flow contains, so they mount a more aggressive price defense against each unit of net order flow. After major shocks such as hacks or severe enforcement actions by regulators, typically rises sharply. The measurement convention for net order flow must be made explicit (for example, in units of the base asset or in notional U.S. dollars); the dimension of is then determined as "price change per unit quantity." Different conventions can make the numerical value of differ by several orders of magnitude, so a consistent convention must be used for cross-market comparisons.
Figure 13-4 illustrates how the Kyle model operates in crypto markets.
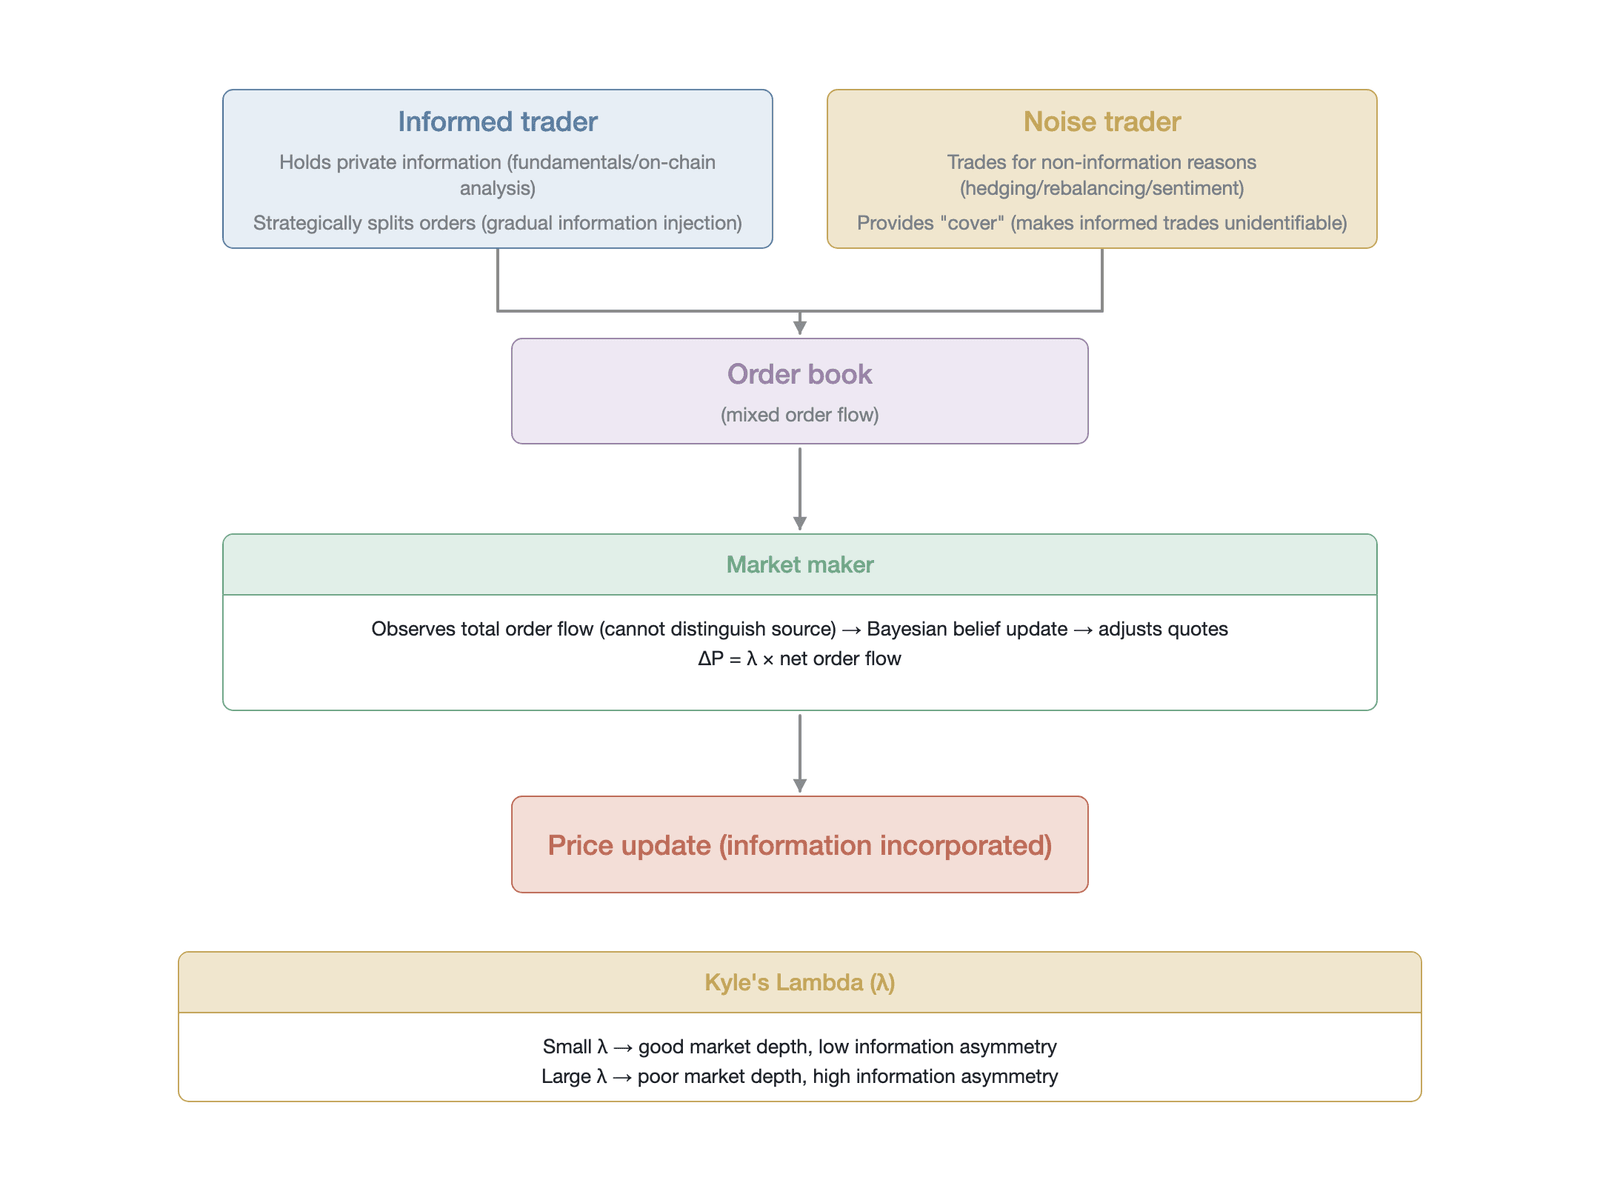
Figure 13-4. How the Kyle model operates in crypto markets
Figure 13-4 shows how market makers dynamically adjust their quotes by observing the aggregate order flow—a blend of informed orders and noise orders—thereby completing the conversion of information into price. In crypto markets, this mechanism is further complicated by the presence of competitive market making: multiple high-frequency trading firms compete in quoting simultaneously, which effectively compresses the bid-ask spread in normal times but can produce synchronized collective withdrawal during sudden shocks. This competitive market-making structure both accelerates price discovery in normal times and amplifies liquidity fragility in times of crisis.
13.1.3 Adverse selection and the bid-ask spread
If the Kyle model explains how prices move with order flow, then the model proposed by Glosten and Milgrom in 1985 answers another fundamental question: why the bid-ask spread exists, and how it reflects information asymmetry [6].
In a cryptocurrency order book, market makers post quotes on both the bid and the ask side, passively waiting for other traders to trade against them. This passivity exposes market makers to a systematic risk: adverse selection.
When an informed trader knows that Bitcoin's true value is above the current market quote, they buy (lifting the market maker's ask); when they know the true value is below the current quote, they sell (hitting the market maker's bid). This means that, when trading against informed traders, market makers suffer a systematic loss in a statistical sense. To offset this inevitable loss, market makers must earn profits from trades with noise traders (who buy and sell randomly).
The Glosten-Milgrom model therefore reaches a core conclusion: the bid-ask spread is, in essence, the market maker's pricing of adverse-selection risk.
The width of the spread is positively correlated with the "toxicity" of informed trading in the order flow (i.e., the proportion of informed traders in total order flow, denoted ). The market maker's ask and bid quotes equal, respectively, the conditional expected estimate of the asset's true value upon observing the arrival of a buy order or a sell order, and the difference between the two is the bid-ask spread.
In crypto markets, this mechanism is clearly borne out. For highly liquid assets such as Bitcoin and Ether, the sheer volume of noise traders (an extremely low ) keeps the bid-ask spread at leading exchanges such as Binance typically below one basis point (0.01%). This figure refers to the top-of-book spread during normal trading hours; in low-liquidity weekend periods or on the eve of major news releases, even the bid-ask spread for BTC can widen to several basis points. For small-cap, highly information-asymmetric altcoins, however, market makers face extremely high adverse-selection risk, and their spreads often reach tens or even hundreds of basis points. Moreover, on the eve of major news releases or extreme market moves, once market makers sense that adverse-selection risk is rising, they immediately cancel their tight quotes, causing spreads to widen rapidly.
Figure 13-5 depicts the quote-adjustment logic of market makers facing different types of traders in the Glosten-Milgrom model, and how adverse-selection risk determines the width of the bid-ask spread.
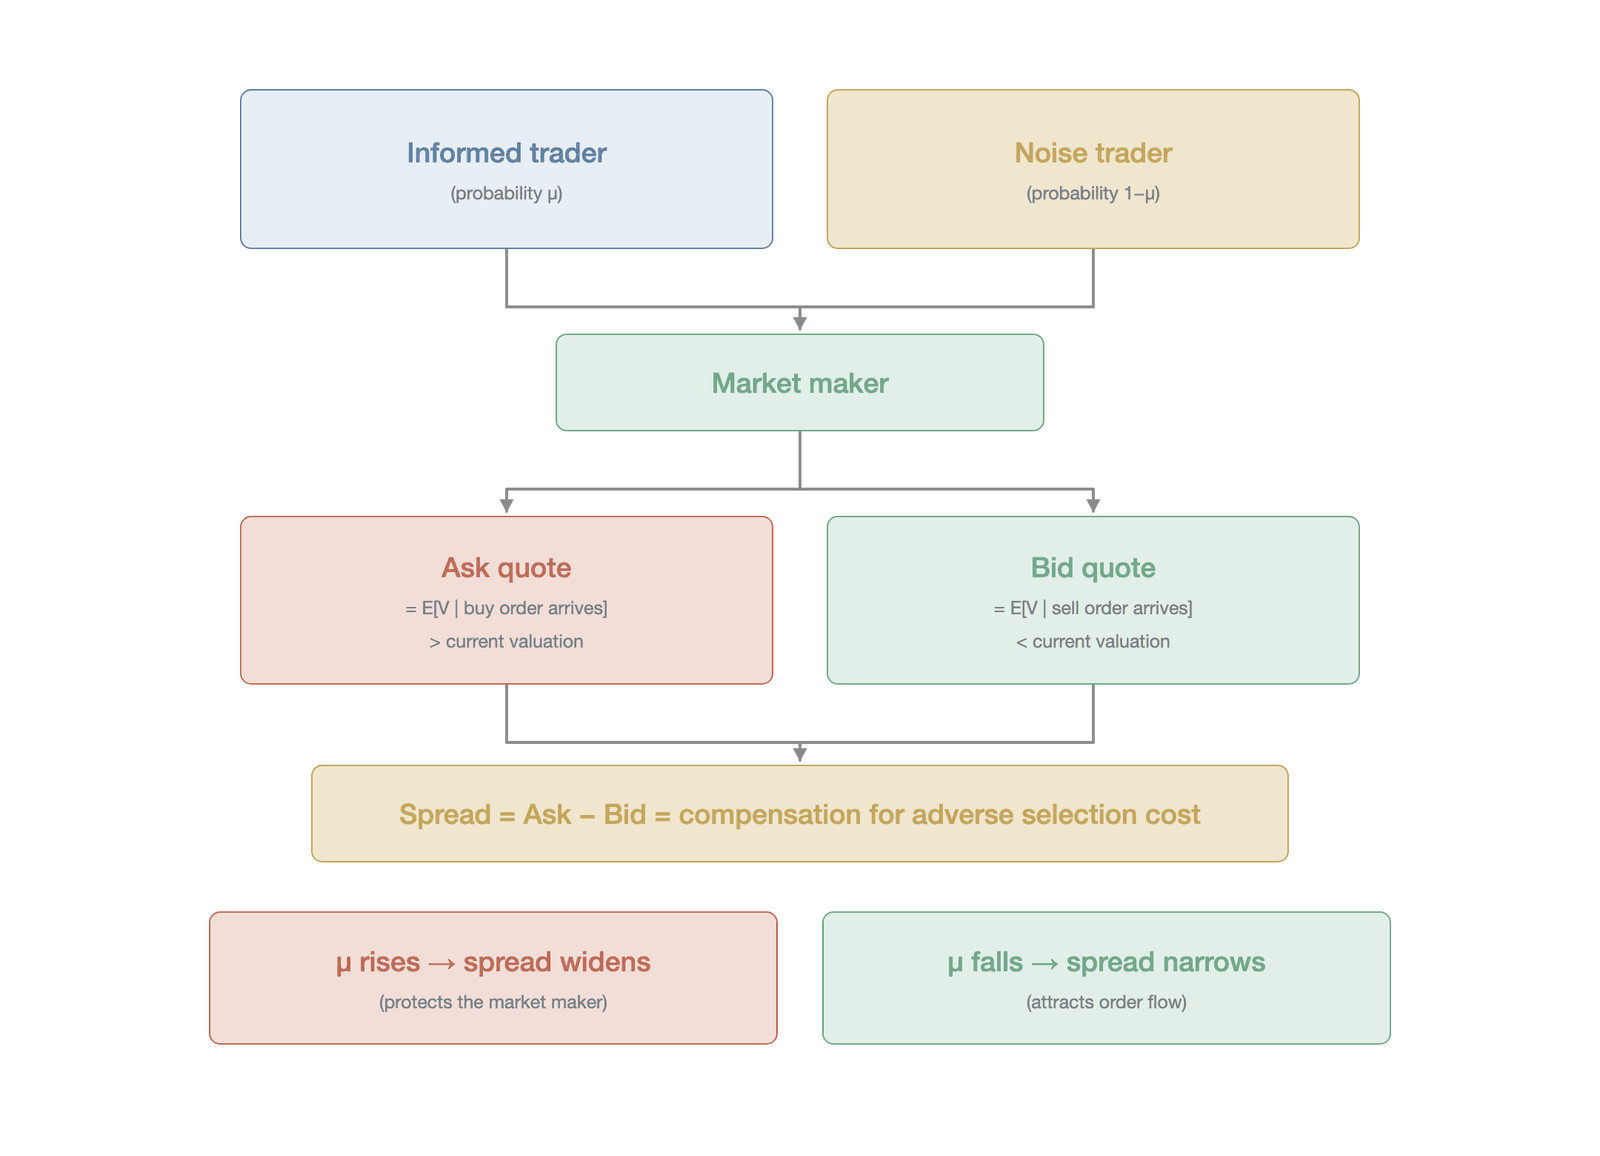
Figure 13-5. Adverse selection and the bid-ask spread formation mechanism in the Glosten-Milgrom model
Figure 13-5 shows that the bid-ask spread is not a simple transaction fee but a necessary compensation that market makers charge for adverse-selection risk in an environment of information asymmetry. In crypto markets, the manifestation of this mechanism differs especially sharply: for highly liquid assets such as BTC and ETH, the bid-ask spread is typically below one basis point, whereas for highly information-asymmetric altcoins, the spread can reach tens or even hundreds of basis points. This cross-asset divergence in spreads provides a direct quantitative indicator for assessing the quality of the information environment across different markets.
13.1.4 Order flow information metrics
The theoretical models show that order flow is the core carrier of information transmission. In quantitative finance and microstructure research, scholars have developed a variety of metrics to measure precisely the information content of order flow. In crypto derivatives markets, the following three metrics are especially important.
Order flow imbalance. Order flow imbalance (OFI) is the most direct measure of microstructural buy-sell pressure. Unlike traditional metrics that consider only executed trades, OFI, over a given time window, jointly accounts for all events that alter the state of the best bid and ask in the order book; these events include the execution of market orders, the submission of new limit orders, and the cancellation of existing limit orders.
Silantyev's (2019) empirical study of cryptocurrency perpetual futures markets revealed the powerful explanatory power of OFI [7]. In a study using Level 2 data for BitMEX's XBTUSD perpetual futures, OFI, over time windows from 10 seconds to 5 minutes, could explain 40% to 70% of mid-price changes (i.e., the explanatory power of the regression). This directly corroborates the core theory of the Kyle model: order flow carries information, and price impact reflects the process by which information is incorporated. This study is based on BitMEX data from 2019, when the market microstructure differed markedly from that of 2025: BitMEX used a single margin currency (BTC), and the degree of market-maker competition was far lower than in today's multi-exchange, unified-margin market structure. The core conclusion that order flow carries information has continued to be validated in subsequent research, but the specific values may differ under the more competitive market structure of today.
Trade flow imbalance. Trade flow imbalance (TFI) is a subset of OFI; it computes only the difference between the volume of aggressive buy market orders and the volume of aggressive sell market orders within a specific time period. Because executing a market order requires paying a liquidity premium (crossing the bid-ask spread), such "cost-bearing" trading behavior is generally considered to embody a stronger directional conviction.
Research shows that over very short time windows (such as 1 second or 10 seconds), OFI, which incorporates limit-order dynamics, has stronger explanatory power for price; but as the time window lengthens (beyond 1 minute), the explanatory power of TFI gradually approaches that of OFI, and the two converge. This is because high-frequency limit-order placement and cancellation (or market-maker adjustment) tend to contain more short-term noise, whereas substantive turnover of capital contributes to price discovery over longer time scales and gradually becomes comparable to OFI.
The theoretical difference above is clearly borne out in empirical data. Figure 13-6, based on Silantyev's (2019) BitMEX XBTUSD data, compares the regression explanatory power () of OFI and TFI for changes in the perpetual futures mid-price across time windows from 10 seconds to 5 minutes.
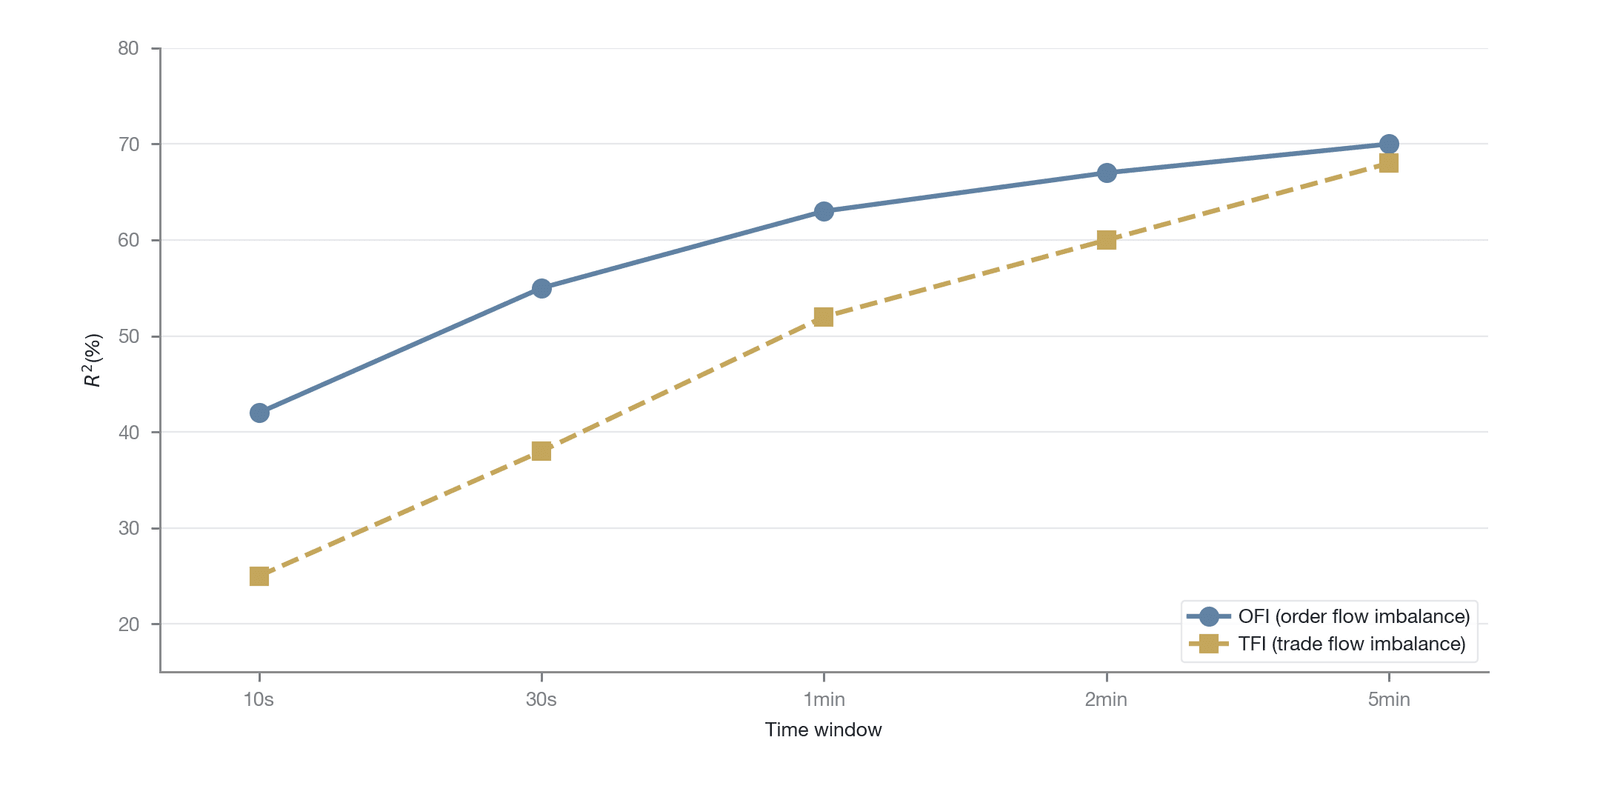
Figure 13-6. The time-window effect in the explanatory power of OFI and TFI for perpetual futures price changes (Data source: Silantyev, 2019 [7])
Figure 13-6 exhibits a pronounced convergence pattern: over the very short time windows of 10 and 30 seconds, the of OFI is significantly higher than that of TFI, because at high-frequency scales the submission and cancellation of limit orders carry rich instantaneous supply-and-demand information. As the time window lengthens beyond 1 minute, however, the explanatory power of TFI gradually approaches that of OFI, and the two converge. This convergence carries a profound microstructural implication: high-frequency limit-order dynamics contain considerable strategic-adjustment noise from market makers, whereas the substantive turnover of capital measured by market orders contributes to price discovery over longer time scales and gradually becomes comparable to OFI.
Volume-synchronized probability of informed trading. The VPIN metric, proposed by Easley, López de Prado, and O'Hara in 2012, is a major improvement on the traditional probability of informed trading (PIN) model [8]. The core innovation of VPIN is that it abandons "clock time" (such as each minute or each hour) as the unit of analysis and instead adopts "volume time."
Specifically, VPIN divides the continuous trade flow into "buckets" of equal volume. Only when the market has accumulated a specific amount of volume does the system advance one period. Within each volume bucket, it computes the degree of absolute imbalance between buyer-initiated volume and seller-initiated volume to estimate the "toxicity" of the order flow (the probability of informed trading).
This design is markedly well-suited to crypto markets. Crypto markets operate 24/7, and their liquidity and trading activity exhibit enormous intraday-rhythm differences across time zones (such as the Asian session versus the overlapping European and U.S. session). If a fixed time window were used, the metric would be full of noise during quiet periods. By anchoring on volume, VPIN naturally adapts to this time-varying feature: when trading is thin, VPIN updates slowly; during periods of sharp volatility and elevated volume, VPIN samples at high frequency, promptly reflecting the rise in information asymmetry.
In several historic crashes in crypto markets (such as the March 12, 2020 event), VPIN showed a pronounced upward trend hours before prices substantively plunged, indicating that informed traders (or panicked first-movers) had already begun to dump orders unidirectionally and that the adverse-selection risk facing market makers was accumulating sharply. VPIN is therefore not merely an academic tool for understanding price discovery but also an effective early-warning indicator under extreme conditions.
Figure 13-7 shows, respectively, the variation of Kyle's lambda across different market states and the alternation in the explanatory power of OFI and TFI across different time scales.
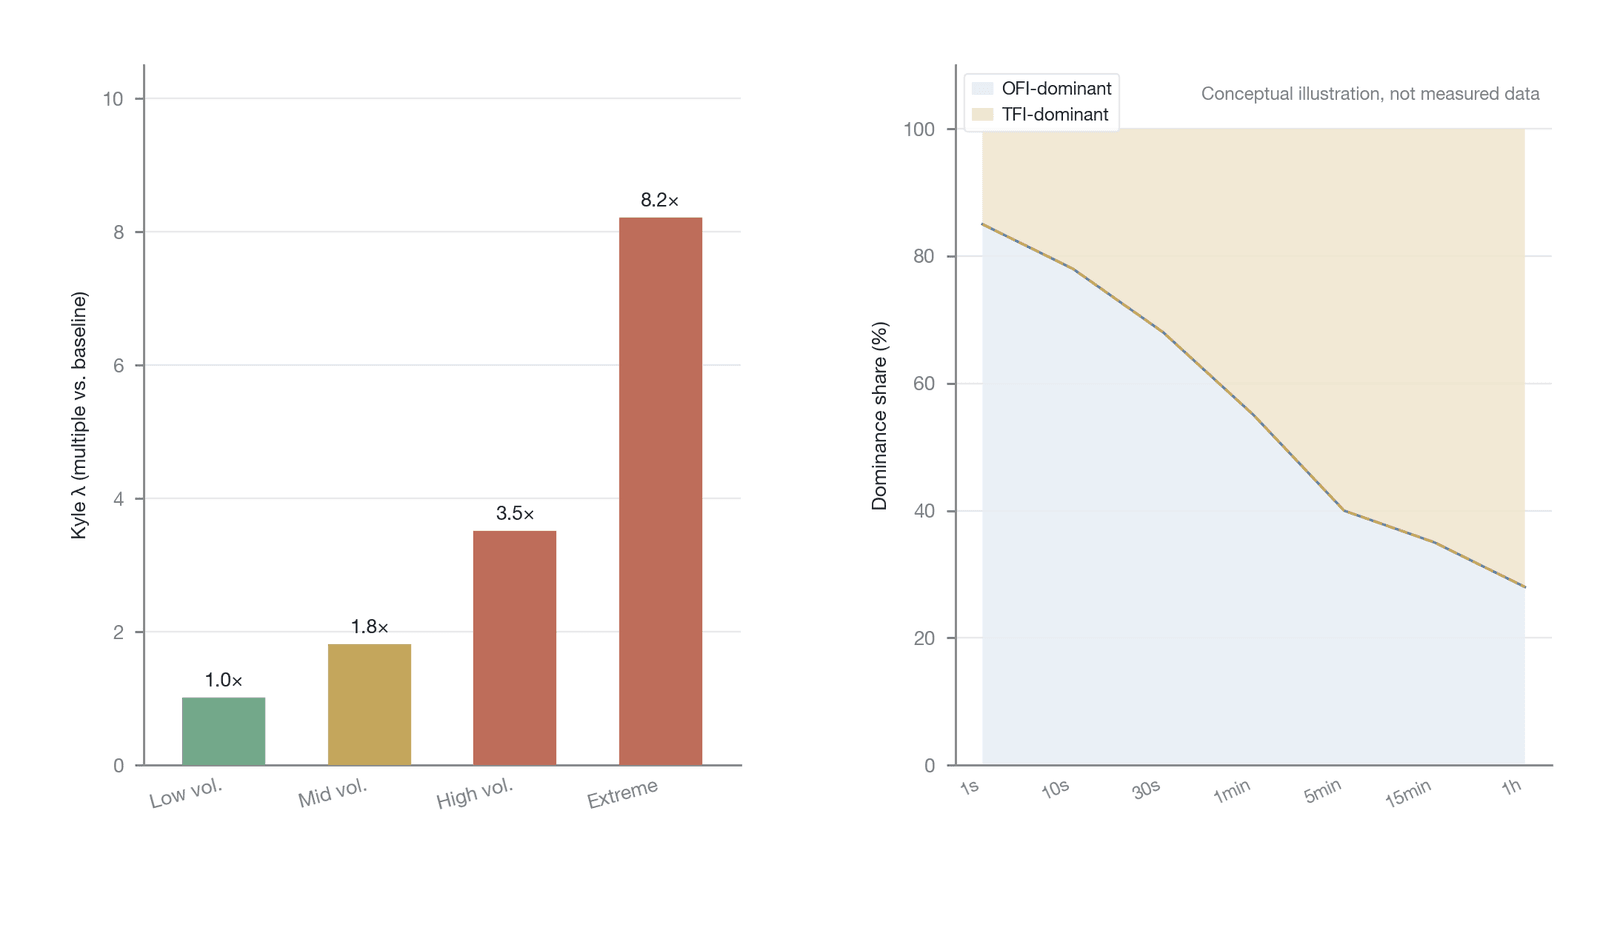
Figure 13-7. The market-state dependence of Kyle's lambda and the time-scale effect of OFI/TFI (conceptual illustration, not empirical data)
The left panel of Figure 13-7 shows that in extreme events, the drying up of liquidity causes the value of lambda to rise sharply and price impact to multiply; the right panel conceptually depicts the alternating relationship between OFI and TFI in leading price discovery across different time scales.
13.1.5 The distinctive features of crypto markets
Although the Kyle and Glosten-Milgrom models provide a solid theoretical foundation, applying them directly to crypto markets is inadequate. The microstructure of digital asset markets challenges and revises the classical assumptions along six key dimensions. The fragmentation across multiple trading venues breaks the classical models' premise of a single trading venue: the same asset trades simultaneously on hundreds of centralized exchanges (CEXs) and decentralized exchanges, turning price discovery into a cross-market network-transmission process in which arbitrageurs play the key role of information carriers. Extremely high leverage (perpetual futures, for instance, allow leverage of up to 100x) is, within the Kyle framework, equivalent to amplifying the capital efficiency of informed traders, enabling them to exert enormous price pressure on the market with very little principal and to accelerate the expression of information; but it also amplifies the destructive power of noise traders in equal proportion, sowing the seeds of liquidation cascades. The 24/7 continuous trading eliminates the "overnight information backlog" and the opening-auction gaps of traditional equity markets, allowing information to be priced continuously; yet during low-liquidity periods such as weekends or holidays, a small injection of information can trigger violent price swings. The heterogeneity of information types (such as the introduction of on-chain observable information) creates a wholly new information game that is "public yet highly asymmetric." Competitive market making changes the premise of a single monopoly market maker: fierce competition among multiple high-frequency trading firms greatly compresses the bid-ask spread and raises aggregation efficiency in normal times, but can lead to collective withdrawal and a liquidity vacuum during extreme crises. The embedding of mechanical noise is a feature unique to perpetual futures markets: the polarization of funding rates and the mechanical execution of forced-liquidation engines produce a deterministic, structural price impact () that differs from the price deviations rooted in irrational behavior found in traditional models.
These revisions do not negate the core logic of the classical models—prices are still discovered through information asymmetry in order flow—but they require us to treat "market structure" itself as a key variable in our analysis. The "multiple trading venues" feature in particular directly gives rise to the "three-stage price discovery model" and the "information flow topology" explored in the sections that follow.
13.2 The three-stage price discovery model
In traditional financial markets, price discovery is usually treated as a relatively concentrated black-box process. In the highly fragmented, multi-centered microstructure of crypto asset markets, however, price discovery must be decomposed into a multi-stage dynamic process. This section presents the first core theoretical contribution of this chapter: the three-stage price discovery model. The model divides the process by which information is transformed from an informed trader's private cognition into a market-wide consensus price into three interconnected stages: expression, aggregation, and transmission.
13.2.1 The expression stage
The starting point of price discovery is the expression of private information by informed traders. When an informed trader acquires new information about an asset's fundamentals (such as a macroeconomic data release, a protocol upgrade, or an anomalous on-chain fund movement), the first decision they face is not to trade directly but to choose a venue.
In crypto asset markets, the same asset often trades simultaneously in the spot and derivatives markets of dozens of centralized and decentralized exchanges. When choosing a venue in which to express information, informed traders are drawn chiefly by four dimensions of gravity: leverage availability, liquidity depth, anonymity, and transaction cost. This selection mechanism is developed in detail in the "venue gravity model" of Section 13.3. Empirical research shows that, because perpetual futures hold significant advantages along these dimensions, informed traders tend to submit orders in the perpetual futures market first [9].
Once a venue is chosen, informed traders convert their private information into actual trading instructions by submitting market or limit orders. The efficiency of this process is termed expression efficiency, and it depends on how accommodating the market microstructure is to information traders. If the market offers high leverage and low-latency API access, informed traders can express their information at very low capital and time cost, and expression efficiency is high; conversely, if the market lacks liquidity or imposes strict access restrictions, information expression is impeded.
The binary division of traders into informed and noise traders in Kyle's (1985) classic framework requires substantial extension in crypto asset markets. In that framework, informed traders hold private information about an asset's fundamentals while noise traders trade out of liquidity needs or random motives, and the boundary between the two is assumed to be clear and stable. Yet crypto markets contain a large intermediate category with markedly different behavioral characteristics: narrative-driven traders. These traders are driven by market narratives circulating on social media, by the guidance of key opinion leaders (KOLs), and by gamified platform elements (such as copy trading, profit leaderboards, and community contests). Subjectively, they are convinced they possess valuable information, but in reality they are responding to a social amplification loop: after information is repeatedly forwarded and emotionally colored across Twitter (X), Telegram groups, and Discord communities, its original signal content has been severely diluted or even wholly distorted. The key difference between narrative-driven traders and pure noise traders lies in the persistence and directionality of their behavior: the price impact of pure noise trading is statistically transient, because the directions of random trades cancel one another out; whereas narrative-driven traders, sharing the same narrative frame, trade in a manner highly correlated in both time and direction, generating persistent directional pressure that drives prices away from fundamental value for extended periods. The existence of this intermediate category poses a distinctive challenge to signal extraction in the expression stage: in later stages, market makers and aggregation mechanisms face not only the classic "signal plus white noise" structure but also this "colored noise" component, which carries a persistent bias while conveying no genuine fundamental information.
13.2.2 The aggregation stage
The orders produced in the expression stage flow into a specific venue's central limit order book (CLOB) or automated market maker (AMM) liquidity pool, entering the aggregation stage. At this stage, market microstructure mechanisms (chiefly market makers and the matching engine) process these orders and extract the information embedded within them, forming that venue's local consensus price.
The core challenge of the aggregation stage lies in separating signal from noise. When market makers receive order flow, they face adverse-selection risk: they cannot directly distinguish whether an order comes from an informed trader holding private information (signal) or from a noise trader acting on liquidity needs or sentiment (noise). Market makers respond to this risk by adjusting their bid and ask quotes.
When an informed trader's buy order consumes sell-side liquidity on the order book, it produces a price impact. According to microstructure theory, this price impact can be decomposed into three components. The information component is permanent: once new information is incorporated into the price, the price does not revert—this is the effective output of price discovery. The liquidity component is transient: it arises from a price shift due to momentary insufficient depth, and once market makers replenish liquidity the price partially reverts. The mechanical component is non-informational volatility: forced trading triggered by mechanisms such as liquidation causes violent price swings, and after the impact passes the price usually reverts completely.
Aggregation efficiency measures the market mechanism's ability to accurately extract the information component from order flow while filtering out the liquidity and mechanical components. In a normal market with ample liquidity, aggregation efficiency is high; but during extreme volatility, the forced-liquidation orders triggered by the liquidation mechanism (mechanical noise) can swamp genuinely informative orders, causing aggregation efficiency to plummet.
13.2.3 The transmission stage
In the highly fragmented crypto market, once information has been aggregated into a price at a particular venue (the leading market), it must diffuse through transmission mechanisms to all other trading venues (the following markets) before a final market-wide consensus price can form. This is the transmission stage.
The transmission stage relies chiefly on two mechanisms. The direct price chain (the arbitrage mechanism) depends on high-frequency arbitrageurs monitoring price differences across markets. When the price in the leading market (such as Binance perpetual futures) rises on new information while the price in a following market (such as certain regional spot exchanges or DEXs) has not yet reacted, arbitrageurs sell in the leading market and buy in the following market. This cross-market arbitrage forces the following market's price to converge toward the leading market's by consuming the following market's liquidity [4]. The indirect price chain (the oracle mechanism) serves decentralized finance protocols: when the leading market's price moves, oracle networks (such as Chainlink) capture these movements and update the on-chain price feed, directly altering the pricing benchmark of on-chain derivatives or lending protocols.
Transmission efficiency depends on the friction costs of cross-market arbitrage (including transaction fees, withdrawal delays, network congestion, and so on) and on the update frequency of oracles. Makarov and Schoar's (2020) empirical study notes that although the arbitrage efficiency of crypto markets keeps improving, during periods of sharp market volatility cross-exchange price differences can persist for minutes or even longer, indicating that transmission efficiency is significantly impaired under stress [10].
The analysis above, however, implicitly treats arbitrageurs as rational agents with unlimited capital and perfect execution—an assumption that is far from holding in reality. As Shleifer and Vishny (1997) argued in their classic paper on "the limits of arbitrage" [11], real-world arbitrageurs face serious capital constraints and agency problems, and these constraints are especially pronounced in the transmission stage of crypto markets. First, crypto arbitrageurs typically use leverage to amplify capital efficiency, their own capital is limited, and in extreme conditions they cannot serve as a price-correcting force; on the contrary, they may become passive amplifiers of price dislocations through margin calls or even forced liquidation. Second, cross-exchange arbitrage requires arbitrageurs to pre-position capital across multiple exchanges (the pre-positioned inventory model), because crypto assets lack a cross-exchange clearing and settlement mechanism, so once funds are deposited at one exchange they are locked within that exchange's account system. This pre-positioned model entails a high capital-locking cost: arbitrageurs must maintain idle funds at every potential arbitrage venue, and the opportunity cost of those funds is especially significant in a high-interest-rate environment. More importantly, the sources of friction in the transmission stage must be distinguished along two dimensions of entirely different nature. Technical transmission friction—including transfer-confirmation delays caused by blockchain network congestion, cross-chain bridge processing times, and the like—is essentially a physical constraint of infrastructure performance that improves as a trend with technological progress. Institutional transmission friction—that is, exchanges deliberately suspending withdrawal processing, rate-limiting their API interfaces, or even temporarily shutting down during extreme conditions—is by contrast a deliberate decision by exchanges based on their own risk-control logic. The latter's impact in extreme events often far exceeds the former's: when several major exchanges suspend withdrawals simultaneously, the physical channels for cross-exchange arbitrage are fundamentally severed, and no matter how much capital or how fast an execution speed an arbitrageur possesses, they cannot complete the transfer of positions across exchanges. This means that the collapse of transmission efficiency under stress is not merely a matter of rising friction costs but a structural rupture of the arbitrage channels.
13.2.4 Total efficiency
The three-stage price discovery model provides a quantitative framework for assessing the quality of market-wide price discovery. The total price discovery efficiency of the market is not the simple sum of the efficiencies of these three stages but their product:
The rationale for constructing the total-efficiency formula as a product rather than a weighted sum derives from the serial structure among the three stages. Information must pass sequentially through expression, aggregation, and transmission to complete its transformation from private cognition into a market-wide consensus price; this process is essentially a serial pipeline rather than three interchangeable parallel paths. In a serial system, if the efficiency of any one link approaches zero, the output of the entire pipeline approaches zero—precisely the "bottleneck effect" naturally captured by the mathematical properties of multiplication. A weighted-sum model (such as ), by contrast, implicitly assumes that the stages can compensate for one another—that high expression efficiency can offset low transmission efficiency—but this runs counter to the physical reality of information transmission: no matter how efficiently informed traders express information, if the arbitrage channels are completely severed (transmission efficiency of zero), the information cannot reach the following markets. In this model, we bound the value of each stage's efficiency to the interval , where 1 represents the theoretical frictionless ideal state (information is processed completely, instantly, and losslessly at that stage) and 0 represents the complete failure of that stage. The product formula is a first-order approximation of the three-stage process. In reality, nontrivial interactions and feedback exist among the three stages (for example, persistently low transmission efficiency will suppress informed traders' expression in the leading market, and high noise in the aggregation stage may induce them to delay or disperse their orders); a more complete model would need to introduce inter-stage feedback terms to capture these second-order effects. But the analysis in this chapter shows that the first-order product approximation already suffices to reveal the core fragility of price discovery in crypto markets.
This multiplicative relationship reveals a key fragility of price discovery in crypto asset markets: the weakest-link effect. Even if the market performs with extremely high efficiency at one or two stages, a serious failure at just one stage causes the overall price discovery function to collapse.
For example, during the extreme liquidation crisis of October 2025, informed traders could still submit orders efficiently (high expression efficiency), but as a flood of liquidation orders (mechanical noise) poured into the order book, market makers could not effectively separate signal from noise, and aggregation efficiency fell sharply; at the same time, a surge in Ethereum-mainnet gas prices delayed on-chain transfers, and with several exchanges suspending withdrawal processing due to system overload, cross-market margin-call delays impeded the arbitrage channels, and transmission efficiency deteriorated sharply. Ultimately, this caused the market-wide total price discovery efficiency to approach a standstill within a short time, with severe dislocations in prices across venues.
By decomposing price discovery into these three stages, researchers and regulators can more precisely locate the efficiency bottlenecks in market microstructure, providing a theoretical basis for optimizing trading mechanisms and designing more resilient DeFi protocols.
Figure 13-8 presents, as a flowchart, the complete transmission path of the three-stage price discovery model and the efficiency bottleneck at each stage.
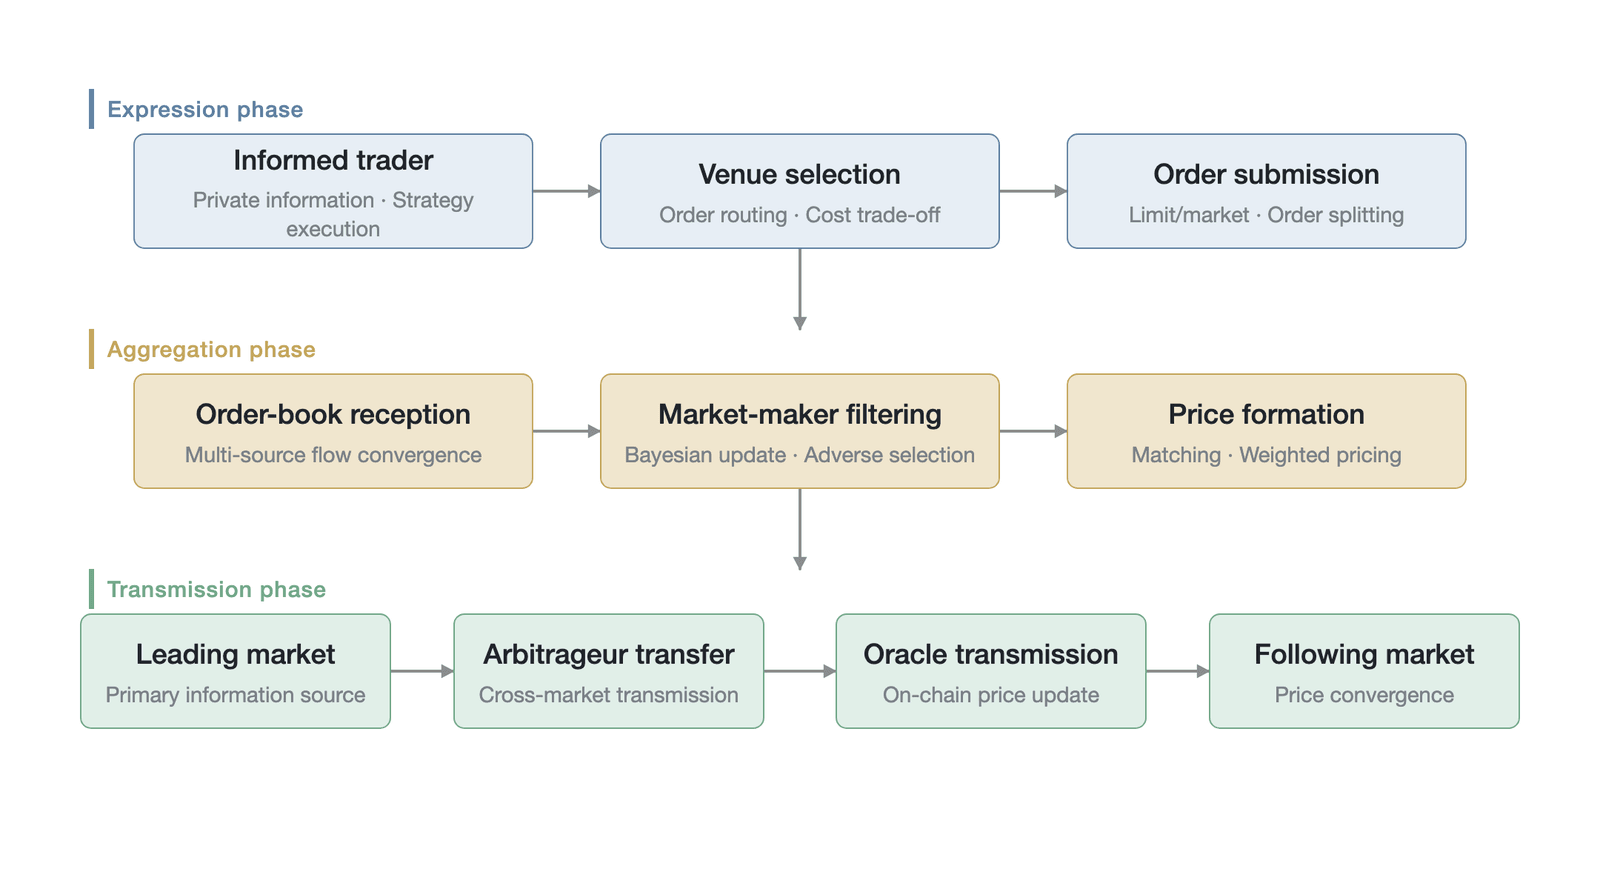
Figure 13-8. The complete transmission process of the three-stage price discovery model
As shown in Figure 13-8, information passes in turn through the expression stage of venue selection and order submission, the aggregation stage of order book matching and market-maker filtering, and the transmission stage of arbitrage and oracle diffusion, ultimately forming a market-wide consensus price.
The core of the aggregation stage lies in extracting the genuine information signal from order flow. Figure 13-9 decomposes the price impact triggered by a large trade into three components of different nature: the permanent information component, the transient liquidity component, and the non-informational mechanical component.
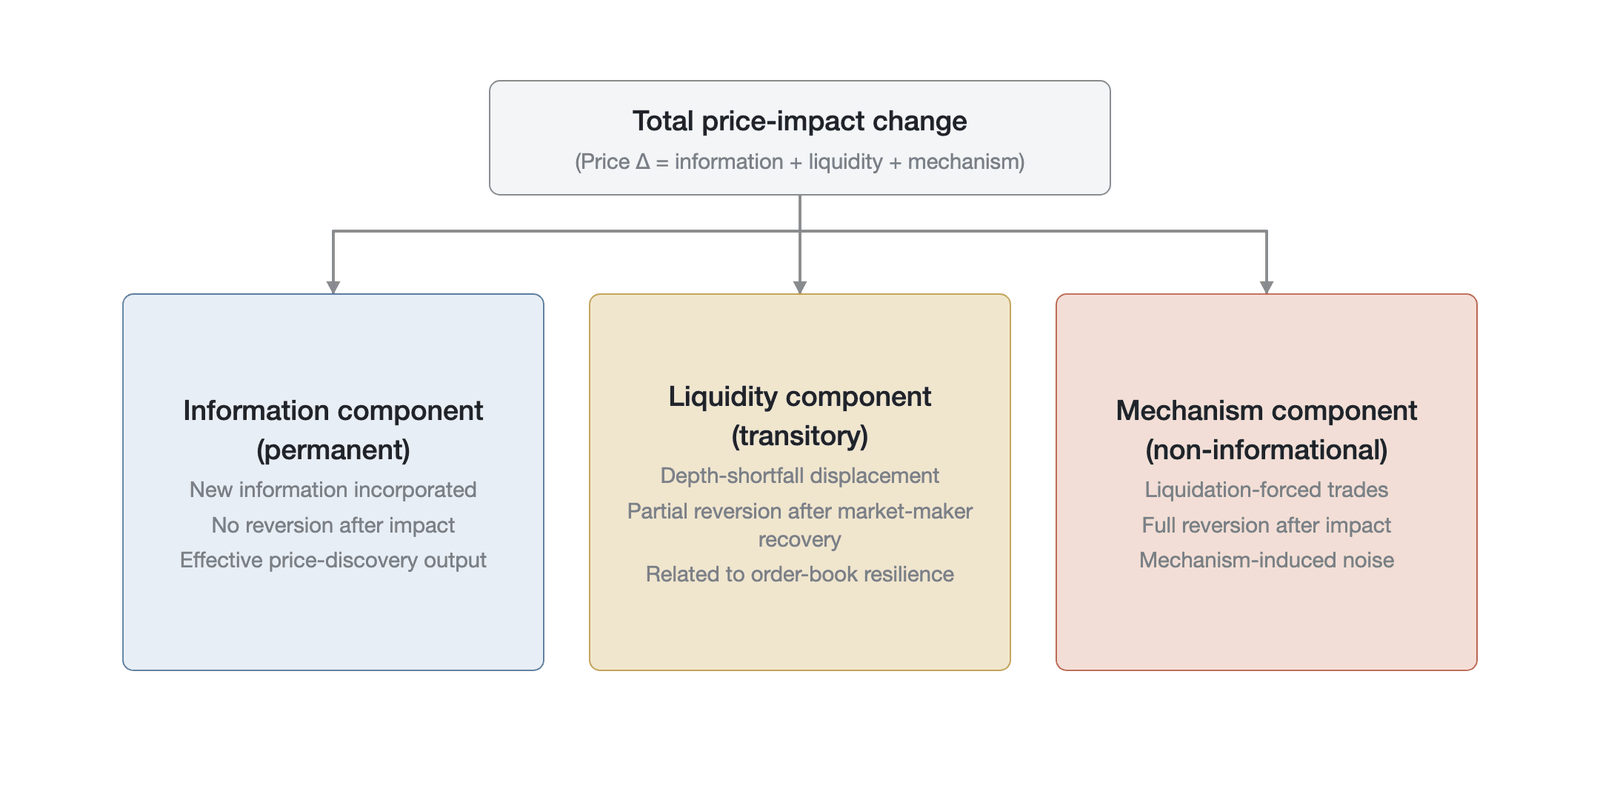
Figure 13-9. Decomposition of price impact into information, liquidity, and mechanical components (conceptual decomposition, no quantitative data)
Figure 13-9 clearly shows the differing behavior of the three components along the time dimension: the information component produces a permanent shift in the price level after the impact, and the price no longer returns to its original position—this is the evidence that new information has been absorbed by the market; the liquidity component exhibits the classic "impact-and-revert" pattern, reflecting a transient deviation caused by momentary insufficient depth; and the mechanical component (such as the selling pressure triggered by forced liquidation) usually reverts completely once the impact fades, because these trades carry no information about the asset's fundamentals. This decomposition framework shows that the core task of the aggregation stage is to separate the information component effectively from the other two—only the permanent information component constitutes the effective output of price discovery, while the liquidity and mechanical components are noise to be filtered out.
Figure 13-10, by setting specific efficiency-parameter values, quantitatively illustrates the computed results of the multiplicative relationship among the three-stage efficiencies under two representative states: a normal market and a liquidation-intensive period.
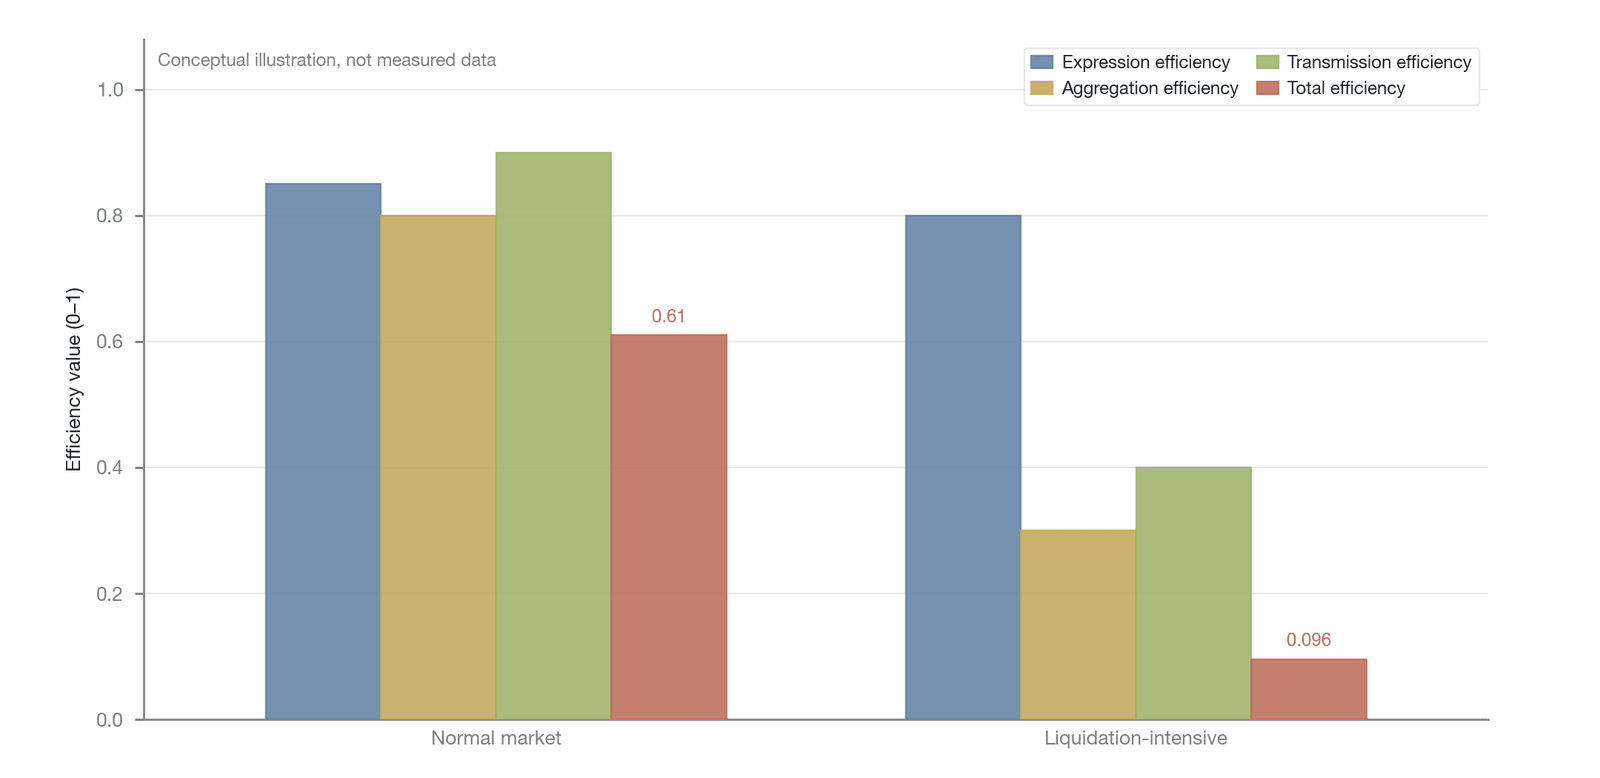
Figure 13-10. The multiplicative relationship of three-stage efficiency under different market states (conceptual illustration, not empirical data)
The computed results in Figure 13-10 reveal a key nonlinear feature: in a normal market, assuming expression efficiency of 0.85, aggregation efficiency of 0.80, and transmission efficiency of 0.90, the product of the three is about 0.61, meaning that about 39% of the information value is lost or delayed in transmission on the way from information generation to market-wide pricing. When the market enters a liquidation-intensive period, however, even if expression efficiency remains at 0.80, aggregation efficiency plunges to 0.30 due to mechanical noise and transmission efficiency falls to 0.40 due to impeded arbitrage channels, the total efficiency is only 0.096—less than one-sixth of the normal level. This feature, in which "the collapse of any single link can paralyze the entire pipeline," is precisely the empirical basis for constructing the total-efficiency formula as a product rather than a weighted sum.
13.3 The venue gravity model
In the three-stage model of Section 13.2, the core of the expression stage is informed traders' choice of venue. As noted in Section 13.1.5, the trading venues of crypto asset markets are highly fragmented. Empirical data show, however, that price discovery is not distributed evenly across these venues but is instead highly concentrated. This section presents the second core theoretical contribution of this chapter: the venue gravity model, which explains why perpetual futures have become the absolute center of price discovery in crypto markets.
13.3.1 Informed traders' venue preferences
In traditional financial markets, the spot market is usually the cornerstone of price discovery, while the futures market plays a supporting role in risk management and price discovery. In crypto asset markets, however, this relationship has fundamentally reversed. According to CoinGlass's 2025 annual report, the crypto derivatives market recorded total trading volume of about $85.70 trillion for the full year [12]; of this, perpetual futures held the dominant position, with an estimated share of about 93% documented in industry research by Ruan and Streltsov and others [13]. Notional trading volume, however, has significant limitations as a measure of market activity. Because perpetual futures embed high leverage, notional volume is greatly inflated by the leverage multiple: a trader using 100x leverage who opens a position with $1,000 of principal generates $100,000 of notional volume, yet their actual risk capital is only $1,000. Moreover, notional volume can be distorted by wash trading (discussed in detail in Section 13.7.2). More analytically valuable measures therefore include open interest (OI), which reflects the scale of capital actually locked in the market and the commitment of positions, and leverage-adjusted, capital-weighted trading volume, which seeks to recover the true flow of risk capital behind trading volume. Even so, $85.70 trillion of notional volume, even after adjusting for leverage, still clearly indicates that the perpetual futures market has far surpassed the spot market in the absolute scale of capital activity.
The pioneering study by Alexander and colleagues (2020) shows that perpetual futures traded on unregulated exchanges are the strongest driver of Bitcoin price discovery [9]. A number of subsequent studies, including Ruan and Streltsov's (2024) analysis based on high-frequency order book data, further confirm the leading role of perpetual futures in price discovery [13].
Why do informed traders so favor perpetual futures? This is no accident but is determined by the endogenous properties of market microstructure. The venue gravity model holds that a trading venue's ability to attract information flow (its "gravity") depends on the combined performance across four key dimensions.
13.3.2 The four dimensions of gravity
We define the information gravity of a trading venue as a function of four dimensions:
Specifically, leverage availability () satisfies informed traders' core demand for maximum risk exposure with minimum capital; the leverage of up to 10x–125x on perpetual futures lets them express private information with extremely low capital commitment, whereas the spot market lacks endogenous leverage and traditional futures markets have leverage capped by regulation. Liquidity depth () determines the price-impact cost of executing large orders; 2025 data show that the ±1% two-sided liquidity depth for Bitcoin on Binance perpetual futures far exceeds that of any single spot market, and deep liquidity allows large information trades to be absorbed covertly and at low cost [12]. Anonymity () allows informed traders to defer the point at which their identity and intent are identified; DEX perpetual futures offer the highest pseudonymity, while CEX perpetual futures achieve a "hidden in the crowd" effect by blending order flow into a vast stream of retail trades. Yet the anonymity dimension contains a profound regulatory tension. On the one hand, anonymity lowers informed traders' cost of information leakage, making them more willing to express private information and thereby promoting price discovery; on the other hand, it also provides cover for insider trading and market manipulation. The FATF Travel Rule requires virtual asset service providers to transmit sender and receiver identity information for transfers above a certain amount, the EU's Markets in Crypto-Assets (MiCA) regulation imposes comprehensive customer-due-diligence obligations on crypto asset service providers, and the U.S. Bank Secrecy Act (BSA) extends compliance reach into the crypto domain through the suspicious activity report (SAR) regime. These regulatory frameworks are systematically narrowing the space for anonymous trading, which means that the anonymity dimension in the gravity model is not a static parameter but a time-varying factor being structurally weakened by institutional forces. Transaction cost efficiency () must be understood from a "full cost" perspective rather than by focusing on explicit fees alone. The explicit advantages of perpetual futures—no rollover cost, no option time decay, and lower trading fees (makers often receive rebates)—are indeed significant, but the full cost of actual trading must also incorporate the following implicit dimensions: the holding cost of the funding rate, which during periods of crowded leverage can exceed 100% annualized and, for informed traders who need to hold positions for several days or more, can erode or even reverse trading profits; market-order slippage, a function of the ratio of order size to order book depth, which can significantly amplify execution costs during thin-liquidity periods; and the opportunity cost of margin capital being locked up, which likewise cannot be ignored, especially in a high-interest-rate environment. The advantage of perpetual futures in transaction cost efficiency therefore still holds in most situations, but their full cost is far higher than the impression given by observing fee rates alone.
As the following table shows, perpetual futures exhibit significant advantages along all four dimensions, forming a strong "gravitational field" that draws the vast majority of the market's information trading to them.
Table 13-2 compares the relative performance of four trading venues across the four dimensions of the gravity model.
| Dimension | Perpetual futures | Spot market | Traditional futures | Options market |
|---|---|---|---|---|
| Leverage availability | 10x–125x, endogenous to product design | No endogenous leverage, relies on external financing | 5x–20x, constrained by regulation | Embedded leverage but limited by option premiums |
| Liquidity depth | BTC ±1% depth exceeds $50 million | Dispersed across multiple exchanges, low depth at any single one | Concentrated but limited by trading hours | Depth fragmented across strike prices and expiration dates |
| Anonymity | CEXs blend orders into massive retail order flow; DEXs offer pseudonymity | CEXs require KYC; DEXs are pseudonymous | Strictly regulated, low anonymity | Strictly regulated, low anonymity |
| Transaction cost efficiency | No rollover cost, low fees (makers often receive rebates) | Relatively higher fees, no leverage amplification | Rollover costs and expiry-roll friction | Time decay constitutes a holding cost |
Table 13-2. Comparison of four trading venues across the four dimensions of the venue gravity model (liquidity depth data source: CoinGlass 2025 Annual Report [12], representing data at a specific snapshot point)
The "BTC ±1% depth exceeds $50 million" figure in Table 13-2 is a snapshot value at a specific observation point, whereas liquidity depth itself is highly time-varying. During market pullbacks, market makers contract their quotes, and depth can shrink dramatically to one-third of the normal level or even lower. More importantly, two-sided total depth (bid plus ask combined) masks the asymmetry between the buy and sell directions: in trending conditions, the counter-trend direction (for example, the buy-side depth during a downtrend) is usually significantly thinner than the with-trend direction, and it is precisely the counter-trend-side depth that determines the actual price impact when an informed trader builds a counter-trend position. When analyzing the liquidity constraints on price discovery, therefore, one should use directional depth rather than two-sided total depth as the benchmark.
13.3.3 Trading volume and the gravity advantage
The gravity advantage of perpetual futures is most directly reflected in trading volume. As Figure 13-11 shows, from 2020 to 2025 the trading volume of perpetual futures grew explosively. In 2025, global crypto derivatives trading volume reached $85.7 trillion; according to CryptoQuant's exchange-ratio data, the perpetual-to-spot volume ratio climbed to around 3.3, and at leading exchanges such as Binance this ratio at times reached as high as 5.1 [14].
The concentration of trading volume is not only the result of gravity but also a cause of its reinforcement. Liquidity exhibits network effects: the more informed traders choose perpetual futures, the more inclined market makers are to provide liquidity there; and deeper liquidity in turn attracts still more traders, forming a positive feedback loop.
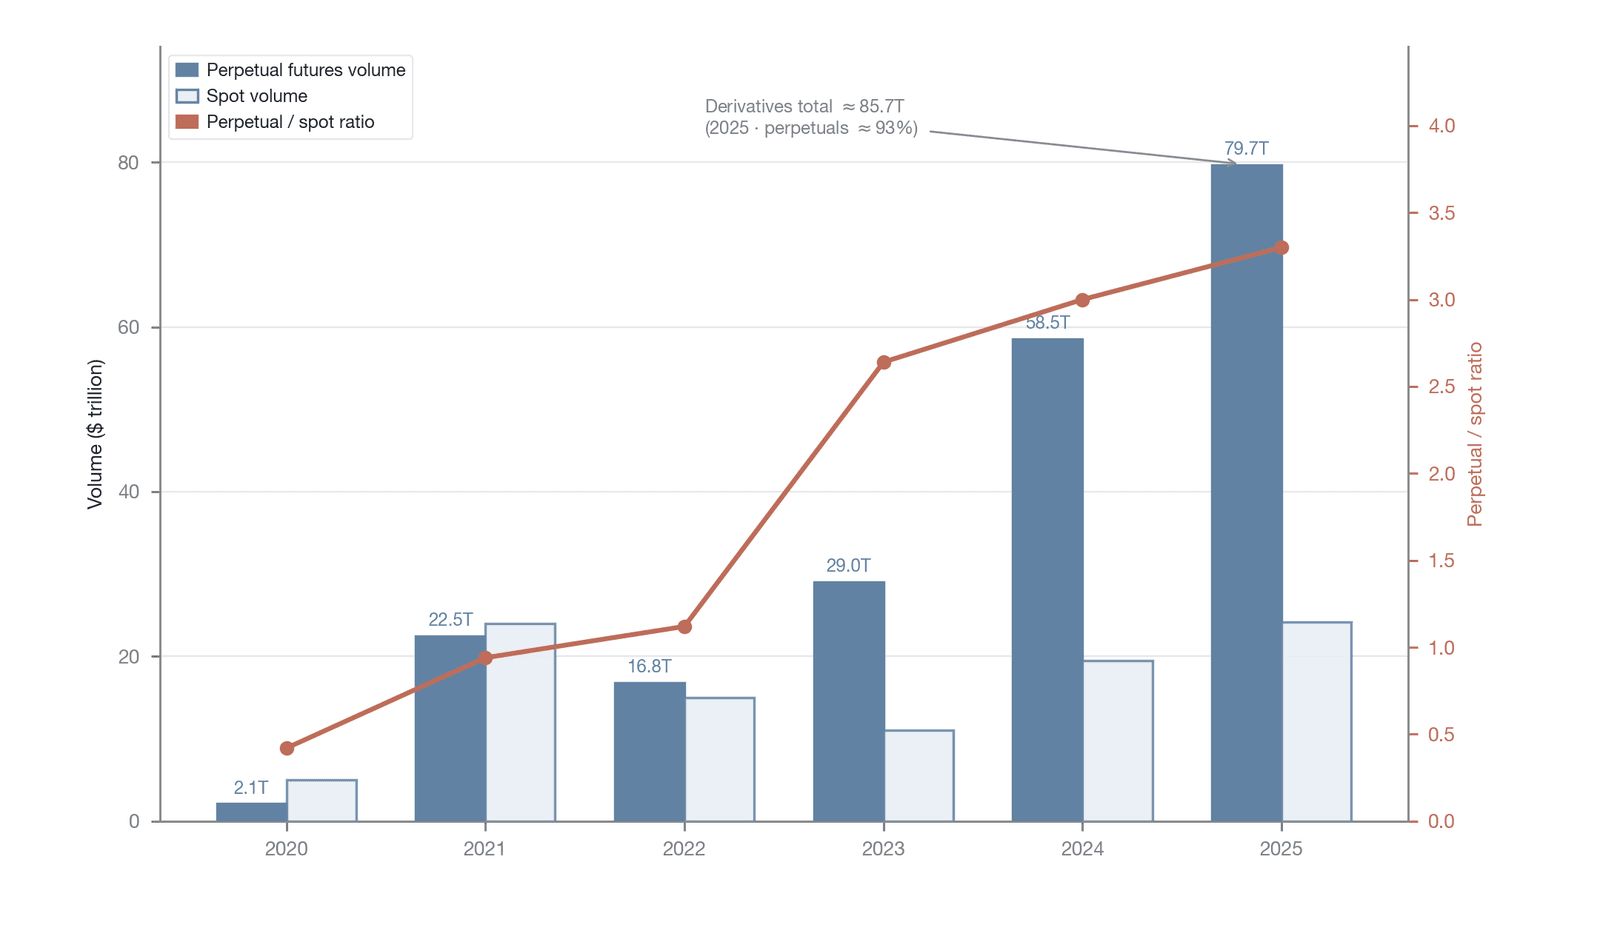
Figure 13-11. Annual trading volume growth of perpetual futures and spot markets (2020–2025)
Figure 13-11 shows that perpetual futures trading volume has grown exponentially, and its volume ratio relative to spot has climbed continuously, reflecting a structural shift of market liquidity and pricing power toward perpetual futures.
Figure 13-12 uses a pie chart to show how the total 2025 crypto derivatives trading volume of $85.7 trillion was allocated among perpetual futures, dated delivery futures, and options.
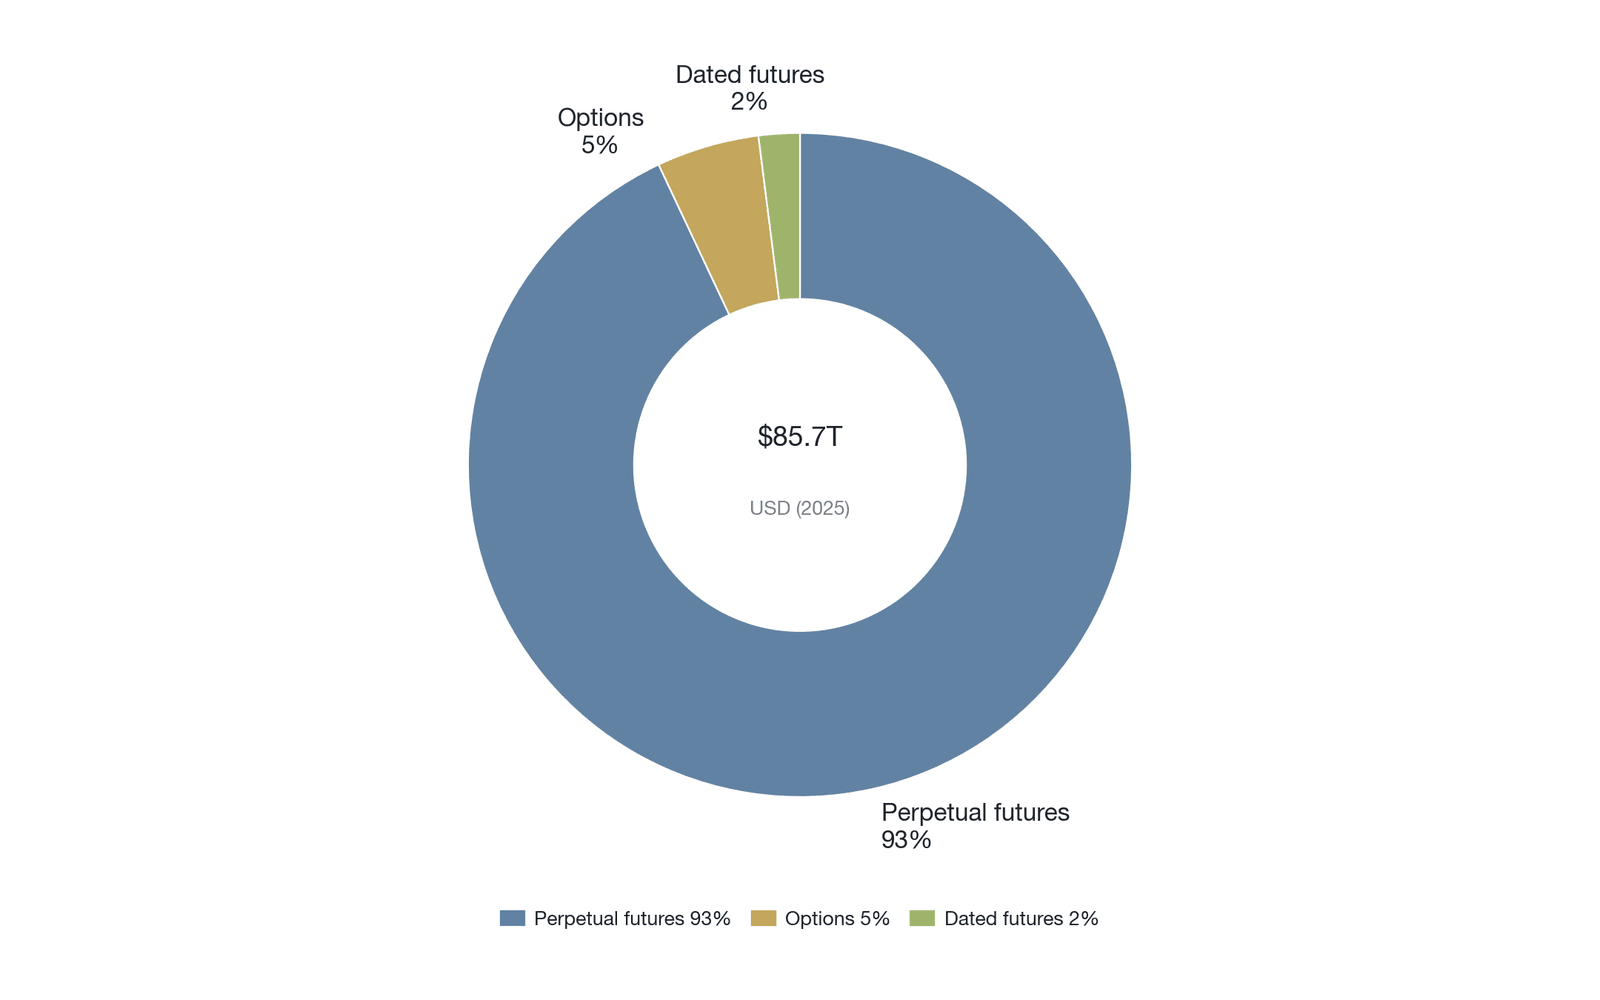
Figure 13-12. Product structure distribution of the crypto derivatives market in 2025
Figure 13-12 shows that perpetual futures accounted for about 93% of the derivatives market, with options and dated futures accounting for only a tiny fraction. This highly concentrated product structure indicates that the design features of no expiry and continuous settlement confer a structural advantage on perpetual futures in trader preference. This landscape also means that the pricing mechanisms of perpetual futures (including the funding rate and the mark price) effectively serve as the price benchmark for the entire crypto derivatives ecosystem.
13.3.4 Funding rates and basis
Perpetual futures are called "perpetual" because they have no delivery date. To anchor the perpetual price to the spot index price, the market introduced the funding rate mechanism. This mechanism is not only a tool for price anchoring but also a highly valuable second-order information signal unique to perpetual futures markets.
When the perpetual price is above the spot price (a positive basis), the funding rate is positive and longs pay shorts; the reverse holds otherwise. As Figure 13-13 shows, this forms a negative feedback loop that incentivizes arbitrageurs to enter and close the price gap.
At the microstructure level, however, extreme values of the funding rate reveal the extreme tilt of market sentiment and the degree of leverage crowding. One widely discussed, representative observation holds that a nonlinear "U-shaped" relationship may exist between the funding rate and subsequent asset returns (see Figure 13-14). When the funding rate is at an extreme negative value (Q1, extremely crowded shorts), a short squeeze often follows and drives the price sharply higher; when the funding rate is at an extreme positive value (Q5, extremely crowded longs), a price plunge triggered by long liquidations often follows. The single-asset empirical evidence in the cited Presto Research [15] mainly finds that the contemporaneous funding rate has limited forward-looking predictive power for future returns; the quintile U-shaped pattern above is a representative illustration based on the logic of rate extremes, not a direct conclusion of that study. The funding rate itself has thus become an important information input for informed traders in constructing strategies.
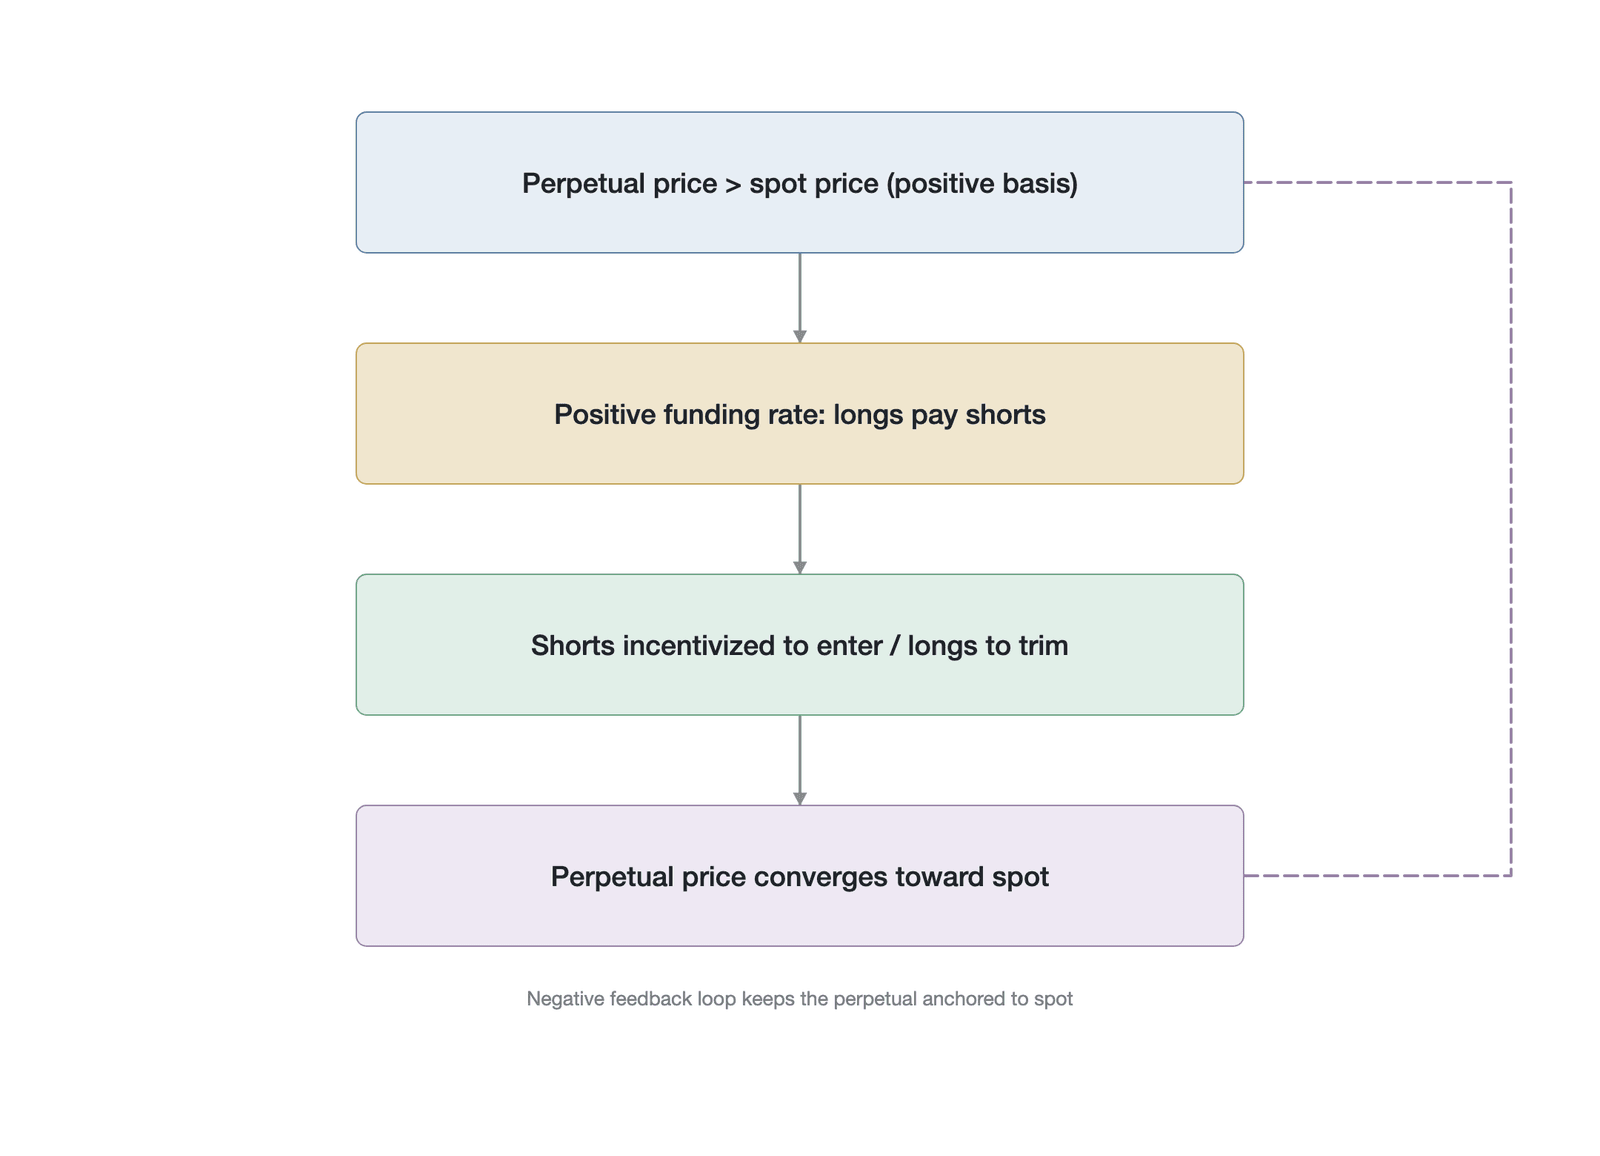
Figure 13-13. The price anchoring and negative feedback loop of the funding rate mechanism
Figure 13-13 shows that the funding rate not only drives the derivatives price back toward spot; its extreme values also constitute a second-order information signal measuring the market's leverage crowding and fragility.
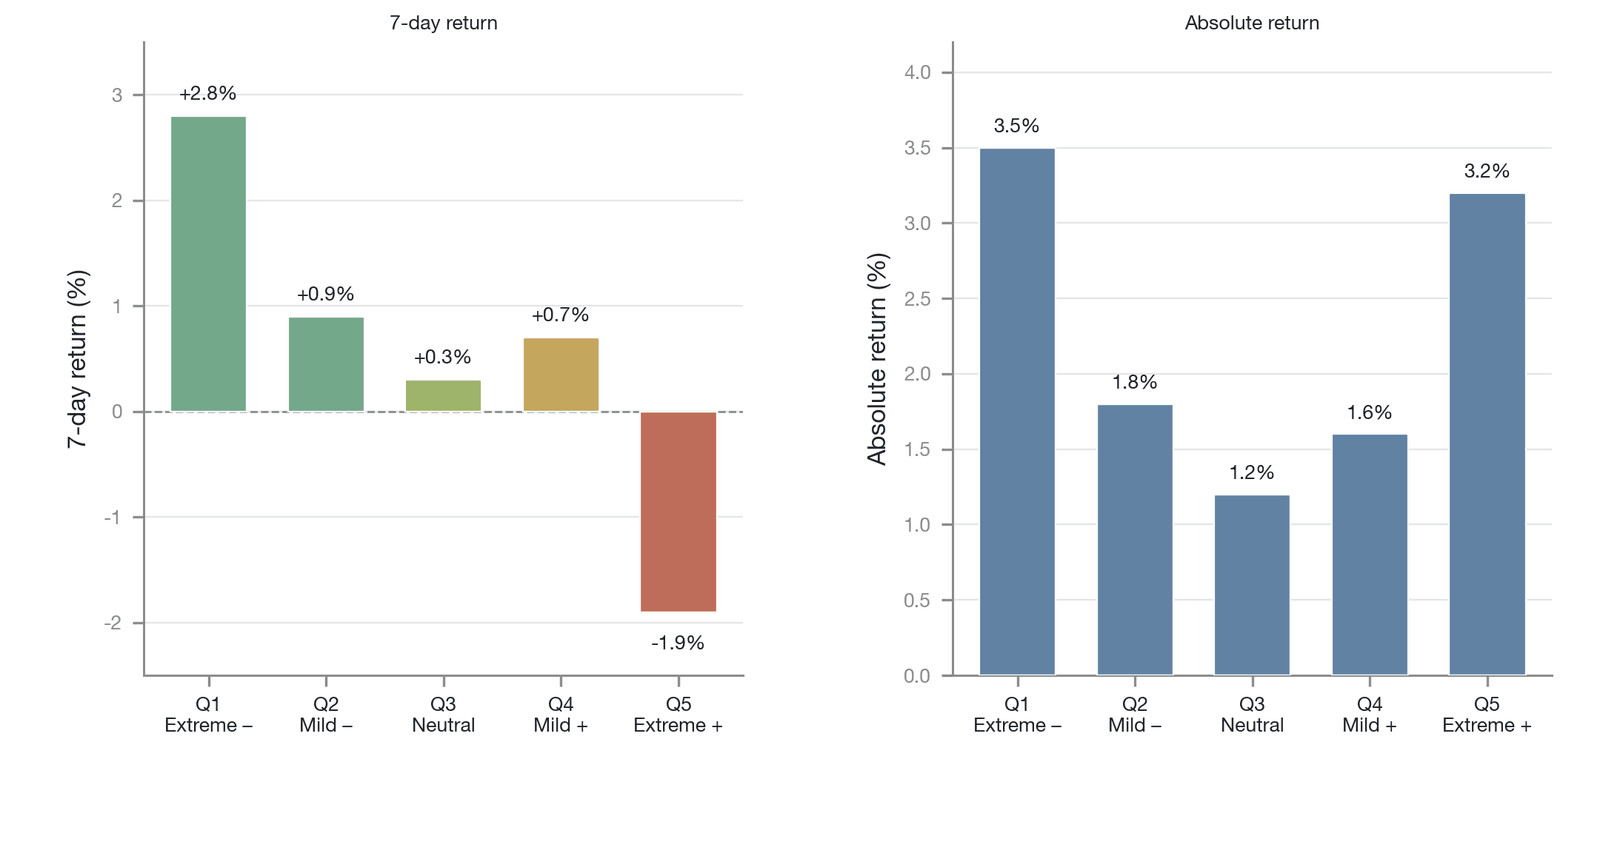
Figure 13-14. The nonlinear relationship between funding rate quintiles and subsequent 7-day returns (representative illustration: the quintile partition is a representative construction by the author based on the logic of rate extremes; the cited Presto Research [15] does not directly present this quintile conclusion)
Figure 13-14 illustrates, in representative terms, that both extreme negative rates and extreme positive rates correspond to higher absolute subsequent volatility, forming a pronounced U-shaped profile. This depiction suggests that when the funding rate deviates from its normal range, the market is accumulating directional risk, and the subsequent mean reversion is often accompanied by violent volatility. The funding rate is therefore not only a mechanical tool for anchoring to spot but has also evolved into a second-order signal for measuring market fragility and forecasting short-term volatility.
The robustness of the U-shaped relationship above, however, requires several important qualifications. First, extreme funding rates tend to cluster during macro-regime shifts (such as an abrupt turn in Federal Reserve monetary policy, major geopolitical events, or regulatory shocks), so the predictive power of extreme rate values may derive in part from the mean reversion of a macro risk premium rather than from a pure crypto-market microstructure phenomenon. Stripping macro factors out of the rate signal is a necessary step for testing its independent predictive power, but the literature currently lacks such control analyses. Second, the funding-rate formulas used by different exchanges differ substantively (the specific settings of each exchange's interest-rate-minus-premium component, clamp boundaries, and final rate cap are given in Section 13.5.2), so the funding rates quoted by different exchanges at the same moment may differ significantly, and the sensitivity of the U-shaped relationship to the calculation methodology has not been systematically tested. Third, as the "funding rate hunter" strategy grows increasingly popular and crowded among quantitative funds and retail traders, the contrarian trading alpha based on extreme rates may be undergoing structural decay: as ever more traders try to exploit the same signal, its predictive power is weakened by strategy reflexivity.
13.3.5 The dynamics of the gravity model
Venue gravity is not static. An important corollary of the gravity model is state dependence: under different market states, the weights of the dimensions change, leading to a dynamic reconfiguration of the distribution of information gravity.
Using Hasbrouck's information share (IS) model to compute values, one can clearly observe that this dynamic reconfiguration exhibits several typical market states empirically. The IS estimates below are composite estimates based on a number of empirical studies; because different studies differ in sample period, data frequency, and choice of exchange set, they are presented as ranges. In the normal market state, CEX perpetual futures, by virtue of extremely high leverage and deep liquidity, hold about 50%–60% of the information share and are the core venue of price discovery. In the stressed market state (such as a macro shock), when sudden macro news (such as an unexpected Federal Reserve rate hike) is announced, informed traders urgently need the most efficient instrument to express information, and at this point the high-leverage, low-latency advantages of perpetual futures are further amplified, so their information share may climb to 60%–70%.
Analyzing the crisis state requires introducing a key typological distinction, because crises of different nature affect the leadership of price discovery in entirely different ways. The first type is the pure mechanical crisis, whose typical form is a liquidation cascade—a chain of forced liquidations triggered by technical factors (such as a single large account being liquidated, or insurance-fund depletion triggering auto-deleveraging (ADL)) with no input of major new information. In such a crisis, the perpetual futures market is flooded with market orders forcibly issued by the liquidation engine; these orders carry no information about the asset's fundamentals but are pure mechanical noise. Market makers withdraw liquidity because inventory risk is too high, causing aggregation efficiency to collapse. At this point, the spot market, because it has no forced-liquidation mechanism, becomes by contrast a relatively pure information source, and its information share may overtake perpetual futures; based on a composite estimate from several studies, the spot market's IS share in this scenario can reach about 35%–45% or even higher, while the IS share of perpetual futures may fall to 30%–40%. The second type is the information-mechanical compound crisis, whose typical form is a major news event superimposed on a liquidation cascade—for example, in the Bybit hack the release of information about the security breach simultaneously triggered large-scale liquidations. In such a crisis, the market must process two entirely different kinds of price signal at once: an informational signal about the fundamental meaning of the event, and mechanical noise produced by liquidations. Because informed traders still prefer the derivatives market with the highest leverage efficiency to express their judgment about the event's fundamental meaning, the informational order flow in the leading derivatives market mixes with mechanical noise, but the information density of the former is sufficient to keep the derivatives market's IS share stable or even higher; based on a composite estimate from several studies, the leading derivatives market's IS share in this scenario can reach about 50%–60% or higher. This distinction explains a superficial paradox: whether the IS share of perpetual futures rises or falls in a crisis depends on the information structure of the crisis rather than on the magnitude of volatility alone.
State dependence indicates that price discovery leadership in crypto markets is not fixed at a single venue but switches dynamically between perpetual futures and the spot market according to the nature of the crisis.
Figure 13-15 compares the distribution of information share across trading venues under three market states: normal, stressed, and crisis.
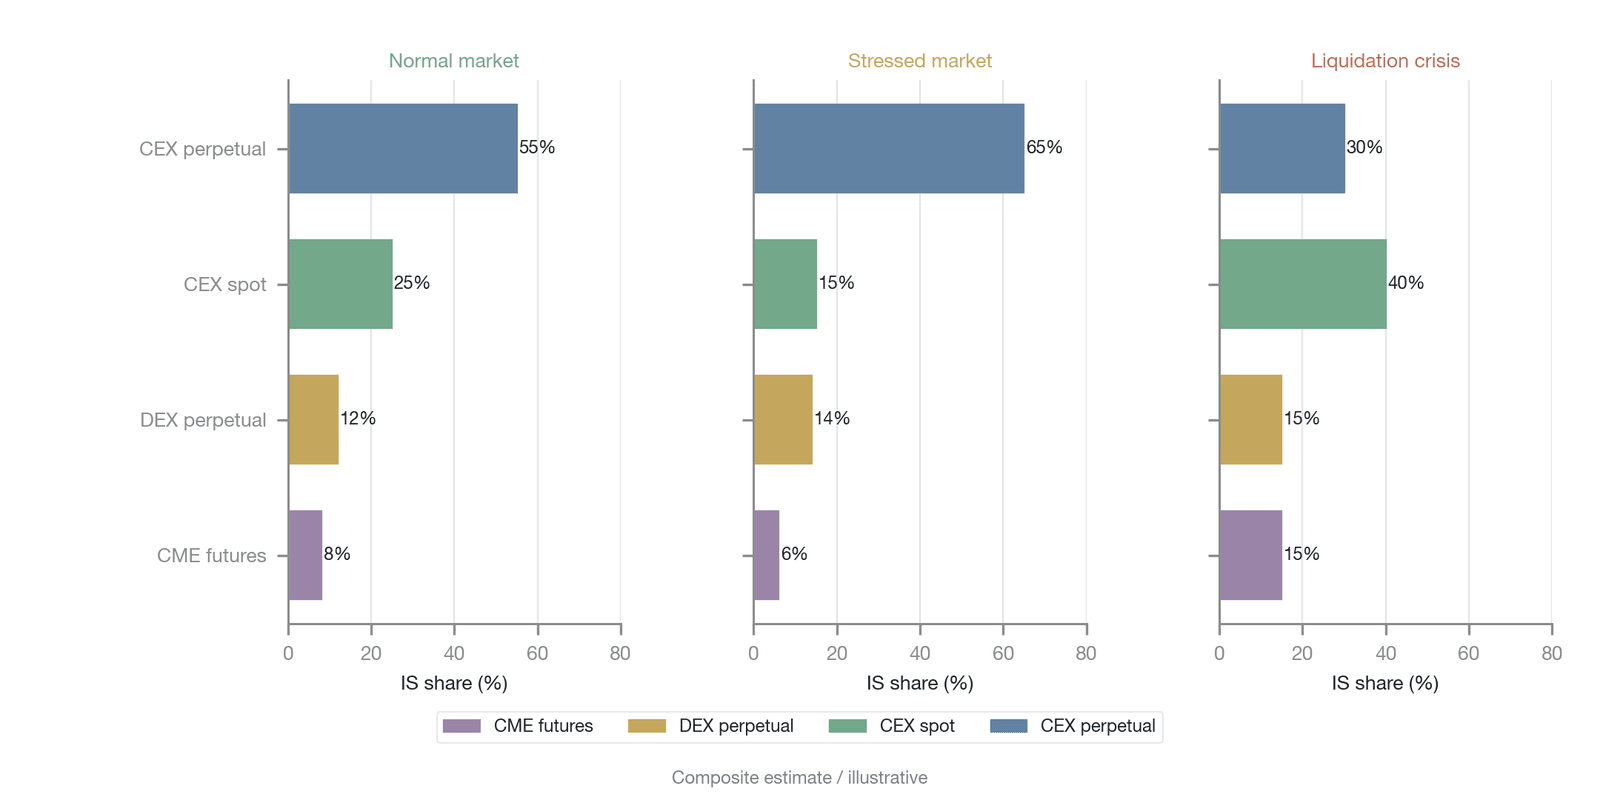
Figure 13-15. The distribution of information share across normal, stressed, and crisis market states (here "crisis" denotes a pure mechanical crisis / liquidation cascade; information shares are composite estimates / illustrative values)
Figure 13-15 shows that in normal and stressed markets, CEX perpetual futures dominate the information share. In the crisis state, the distribution of price discovery leadership depends on the information structure of the crisis: in a pure mechanical crisis (liquidation cascade), the perpetual market is swamped by mechanical noise and the spot market passively takes over price discovery leadership; whereas in an information-mechanical compound crisis, informed traders' need to express the event's meaning keeps the leading derivatives market at the center of information.
13.3.6 The gravity divergence between CEX and DEX perpetual futures
Entering the 2024–2025 cycle, as "intent-centric" architectures and high-performance application chains (such as Hyperliquid) matured, decentralized perpetual futures began to pose a substantive challenge to the gravity of centralized exchanges.
As Figure 13-16 shows, by the end of 2025 the monthly trading volume of DEX perpetual futures had surpassed $1 trillion, and their share of the entire perpetual futures market had climbed to 22% [12]. However, similar to the trading-volume authenticity challenge facing CEXs (discussed in detail in Section 13.7.2), DEX volume likewise carries significant distortion risk. The fierce competition among Perp DEXs in 2025 spawned a large amount of trading activity of a non-price-discovery nature: airdrop farming drives traders to inflate volume in order to obtain token allocations, trading-mining mechanisms directly incentivize volume inflation through fee rebates, and bot farming manufactures fake activity on low-liquidity pairs through automated strategies. Although these activities contribute notional volume, they contain almost no price discovery information. The proportion of the 22% market share that genuinely represents informed traders expressing private information—that is, effective price discovery activity—may therefore be significantly lower than the notional figure implies.
Although CEXs (particularly Binance and OKX) still hold a significant advantage in absolute liquidity depth and the scale of institutional custody, DEXs hold an irreplaceable advantage along two gravity dimensions: "anonymity" and "censorship resistance." This differentiation in gravity dimensions has led to a stratification of informed traders: macro and institutional informed traders rely mainly on CEX perpetual futures, because they need extremely deep liquidity to absorb large orders and have strict compliance requirements. By contrast, on-chain-alpha and long-tail-asset informed traders increasingly favor DEX perpetual futures. For newly issued tokens or long-tail assets not yet listed on top CEXs, DEX perpetual futures are often the only leveraged shorting instrument, so for these specific assets DEX perpetual futures hold absolute pricing power.
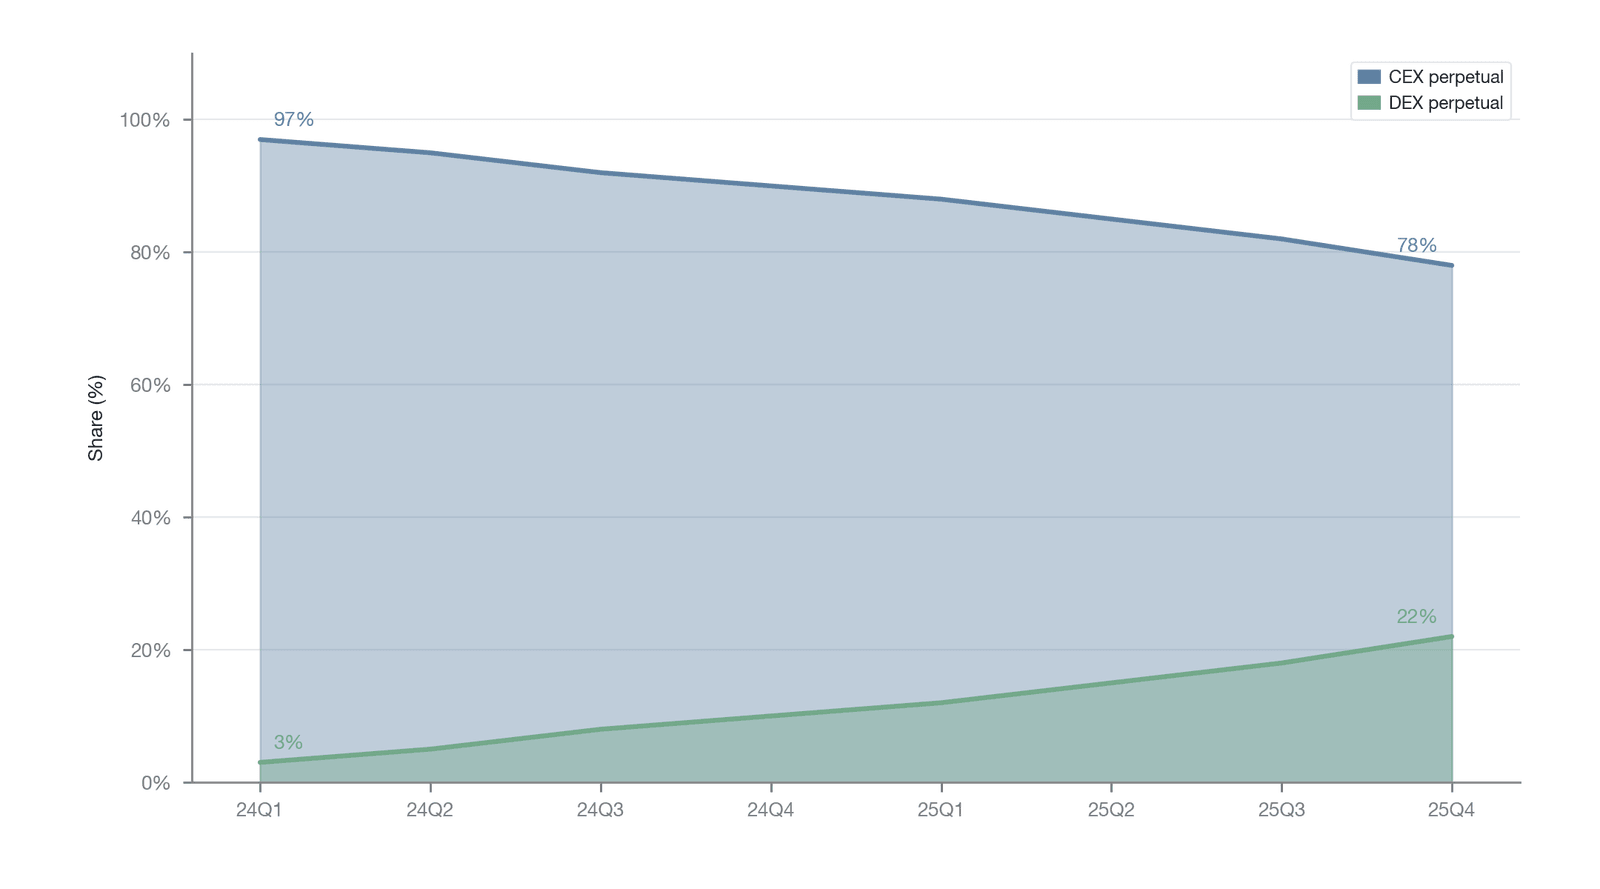
Figure 13-16. Comparison of CEX and DEX perpetual futures trading volume shares (2024–2025; shares measured on a notional-volume basis)
Figure 13-16 shows that the DEX perpetual futures market share rose steadily from 2024 to 2025, reflecting that high-performance application chains have begun to substantively divert CEX gravity in terms of liquidity and execution efficiency. This diversion has not occurred evenly: for mainstream assets such as BTC and ETH, CEXs still maintain an absolute liquidity advantage; but for long-tail assets and newly issued tokens, DEX perpetual futures have become the only leveraged shorting instrument and therefore hold pricing power for these specific assets. This differentiated distribution of gravity foreshadows a possible future price discovery landscape with a dual-track structure of "CEX dominance for mainstream assets, DEX dominance for long-tail assets."
Yet the "censorship resistance" gravity advantage of DEXs is itself facing a severe test against legal reality. The 2022 sanctioning of Tornado Cash by the U.S. Treasury's Office of Foreign Assets Control (OFAC) established for the first time the precedent that a government can add a smart contract address to a sanctions list; although this decision went back and forth under judicial review, its institutional signal has profoundly changed the compliance-risk expectations for decentralized protocols. For Perp DEXs, the key point is that "censorship resistance" does not equal legal immunity. Take Hyperliquid: the core of its high-performance architecture (a centralized sequencer) is both the technical basis for achieving sub-second finality and a natural chokepoint for sanctions compliance and a single point of failure for the system—regulators can achieve trade censorship by pressuring the entity operating the sequencer, as demonstrated by the emergency coordination among validators to shut down a market during the JELLY event of March 2025. More broadly, any DEX with an identifiable operating entity at the physical-infrastructure layer needs to draw a more careful distinction between "technical feasibility" and "legal enforceability" in its censorship-resistance claims.
13.4 The information flow topology
Following from the fragmented market structure described above, the formation of the "true price" is no longer an isolated process within a single market but a dynamic outcome of a multi-market game. This section presents the information flow topology, the third core theoretical contribution of this chapter (CC3), as a theoretical framework that systematically reveals the cross-market transmission mechanism of price discovery and explores the roles and standing of different types of markets in price discovery.
13.4.1 Constructing the topology
To describe systematically the price discovery process in a fragmented market, we construct the information flow topology. In this directed weighted graph , the set of nodes represents the trading venues (such as Binance perpetual futures, Coinbase spot, Hyperliquid, and so on), the set of directed edges represents the direction in which price signals are transmitted, and the weight function reflects the strength of information transmission (such as the elasticity of price-signal transmission per unit time). Here takes strictly positive values—that is, if an edge exists, its weight must be greater than zero (the absence of a transmission relationship corresponds to the absence of an edge, not to a weight of zero).
Within this topological structure, information flow is not evenly distributed. High-liquidity, low-transaction-cost derivatives markets typically serve as "information source" nodes, reflecting new market information first; while spot markets with weaker liquidity or higher transaction costs serve as "receiving" nodes, passively following price changes. Arbitrageurs play the role of "connectors" in this network, closing price deviations through cross-market arbitrage strategies and thereby completing the physical transmission of information flow. When arbitrage friction (transaction fees, network latency, fund-transfer times, and so on) is low, the topology is strongly connected and prices tend to be consistent; when friction rises, connectivity declines and persistent price differences appear among nodes.
Figure 13-17 constructs an information flow topology of crypto asset markets centered on Binance perpetual futures.
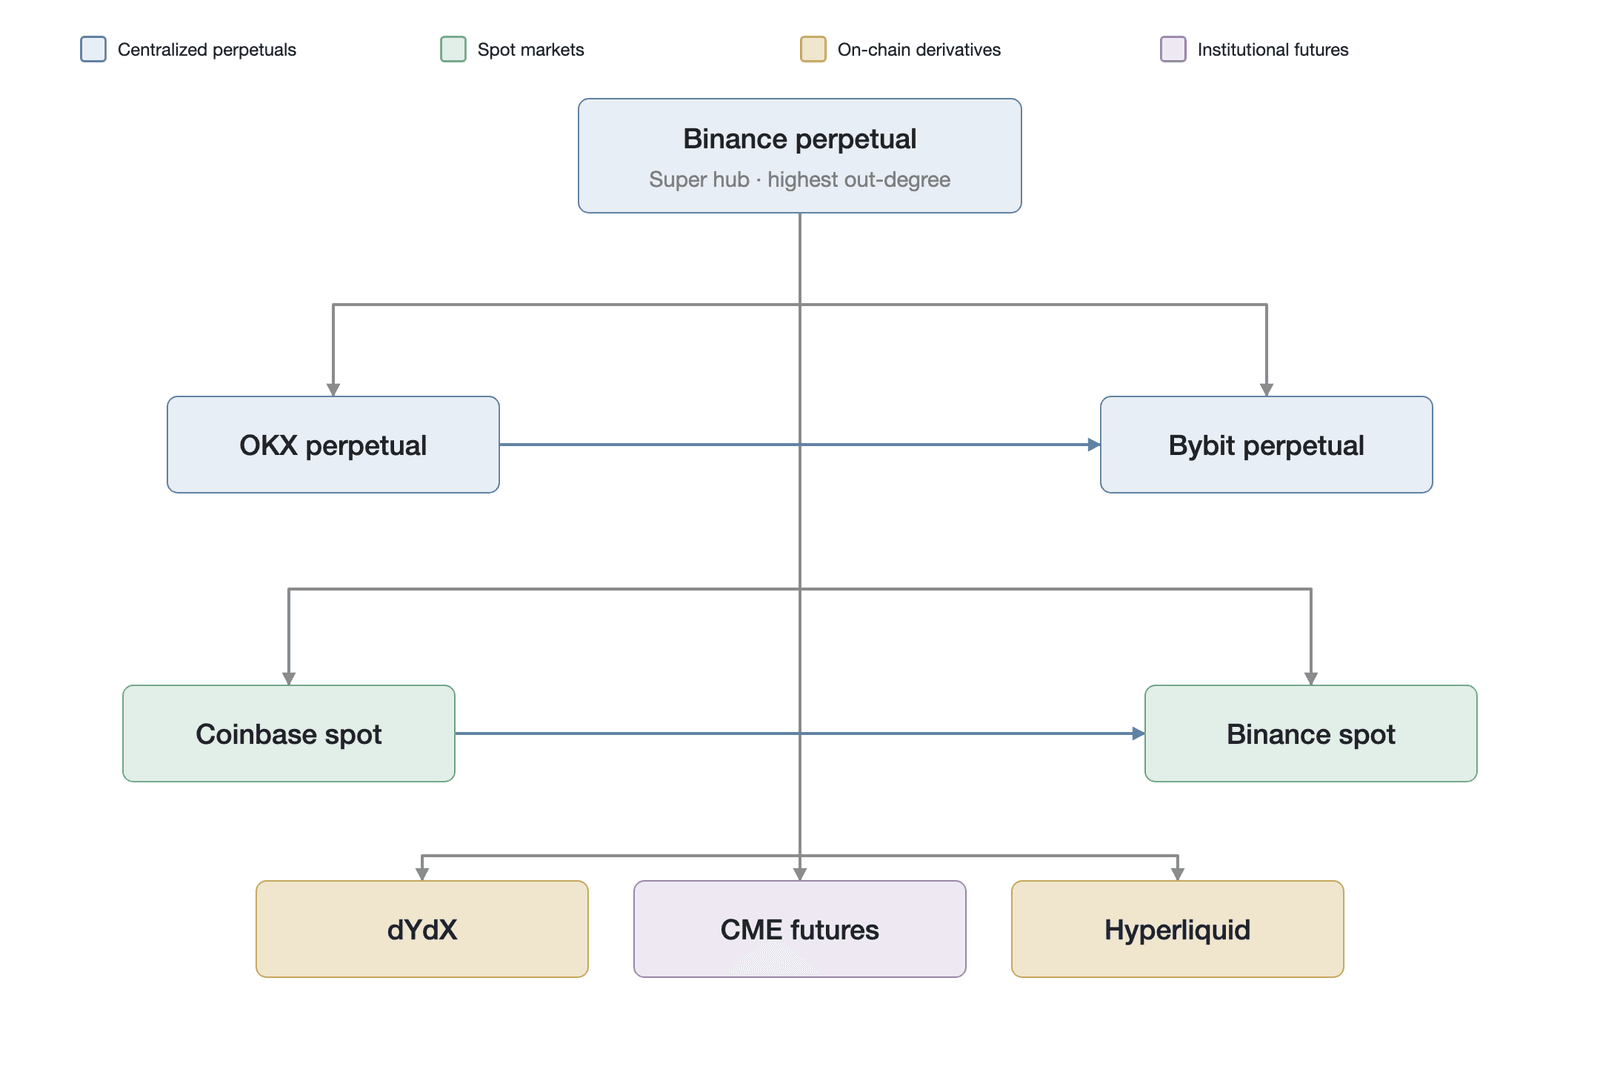
Figure 13-17. The information flow topology of crypto asset markets
Figure 13-17 shows the information transmission paths centered on Binance perpetual futures; directionally asymmetric information flows exist among CEX perpetuals, CEX spot, DEXs, and traditional financial markets, and the weights of the directed edges reflect the relative strength of transmission.
The topological structure depicted above reveals a core fact: in today's crypto market, Binance perpetual futures are the "super-hub" of the information flow network, with an out-degree far higher than that of any other node, meaning that the price signals produced by this market radiate unidirectionally to almost all other markets. At the same time, the index price and oracles, though they generate no trades themselves, constrain the price boundaries of the entire network in reverse by serving as the benchmark for liquidation and funding rate calculations.
13.4.2 Measurement tools
In empirical finance, the standard tools for measuring the contribution of different markets to price discovery comprise two classic models.
The Hasbrouck information share model is based on the residual covariance matrix of a vector error correction model and measures the proportion of the efficient price variance contributed by a given market [4]. Its core logic is that the market leading price discovery usually has higher volatility innovations—that is, that market reacts most sharply and rapidly to new information. The mathematical expression of the IS model can be summarized as:
where is the weight of market in the common trend (i.e., the common-factor loading derived from the moving-average representation of the vector error correction model), and is the variance of that market's innovation term. Note that here denotes the standard deviation of market 's innovation term, with a different meaning from the volatilities used earlier. The expression above is the form after the innovation covariance has been diagonalized (orthogonalized); the general case requires a Cholesky decomposition, and the IS model is fairly sensitive to the Cholesky orthogonalization order of the error covariance matrix, with results depending on the ordering, so in practice one usually needs to compute upper and lower bounds to determine the final share.
The Gonzalo-Granger component share model, by contrast, focuses on the error-correction speed of each market's price toward the common trend [16]. The higher a market's CS share, the smaller its responsibility for correcting price deviations—that is, other markets must "move toward" it. Unlike the IS model, the CS model measures a market's capacity to lead permanent price shocks rather than its contribution to short-term volatility.
Table 13-3 compares the features of Hasbrouck IS, Gonzalo-Granger CS, and their joint use.
| Measurement method | Core principle | Advantage | Limitation |
|---|---|---|---|
| Hasbrouck IS | Measures each market's contribution to the efficient price variance | Directly quantifies the proportion of information contribution | Sensitive to the Cholesky decomposition order; requires computing upper and lower bounds |
| Gonzalo-Granger CS | Measures each market's error-correction speed | Does not depend on orthogonalization; yields a unique result | Reflects only long-term adjustment, ignoring short-term information shocks |
| IS and CS combined | Integrates short-term volatility contribution and long-term adjustment capacity | Provides a more comprehensive picture of price discovery | Higher computational complexity; requires high-frequency synchronized data |
Table 13-3. Comparison of price discovery measurement methods: Hasbrouck IS, Gonzalo-Granger CS, and their joint use (Data source: compiled by the author)
When assessing the price discovery efficiency of crypto markets, researchers usually use these two measurement tools in combination to obtain more comprehensive market-microstructure insight. Putniņš (2013) further proposed the information leadership share, which eliminates the interference of noise in the measurement by standardizing the ratio of IS to CS [17].
13.4.3 The empirical landscape
A large body of empirical research shows that in the current crypto asset price discovery environment, the perpetual futures markets of centralized exchanges hold a dominant position. Cosenza and Stalder (2024), using high-frequency data to analyze the price discovery process for Bitcoin in a fragmented market, found that unregulated exchanges (especially Binance) are the primary source of price discovery, and that their perpetual futures and spot markets together contribute more than 50% of the information share [18]. The study by Entrop, Frijns, and Seruset (2020) further confirms that during periods of rising volatility and increasing market uncertainty, the contribution of the futures/perpetual market to price discovery strengthens significantly [19]. Dimpfl and Peter's (2021) cross-exchange analysis reveals a historic shift of price discovery leadership from Bitfinex to Binance [20]. The dominance of unregulated venues in price discovery itself faces regulatory-event risk. The $4.3 billion settlement Binance reached with the U.S. Department of Justice and the CFTC in November 2023 shows that enforcement actions targeting dominant venues can lead to a sudden reconfiguration of the information flow topology. Moreover, after the approval of the spot Bitcoin exchange-traded fund (ETF) in January 2024, the IS share of CME and regulated markets has grown significantly, and the "unregulated-venue-dominance" pattern is being changed by institutional forces.
Figure 13-18 compares the Hasbrouck IS and Gonzalo-Granger CS shares of the major trading venues.
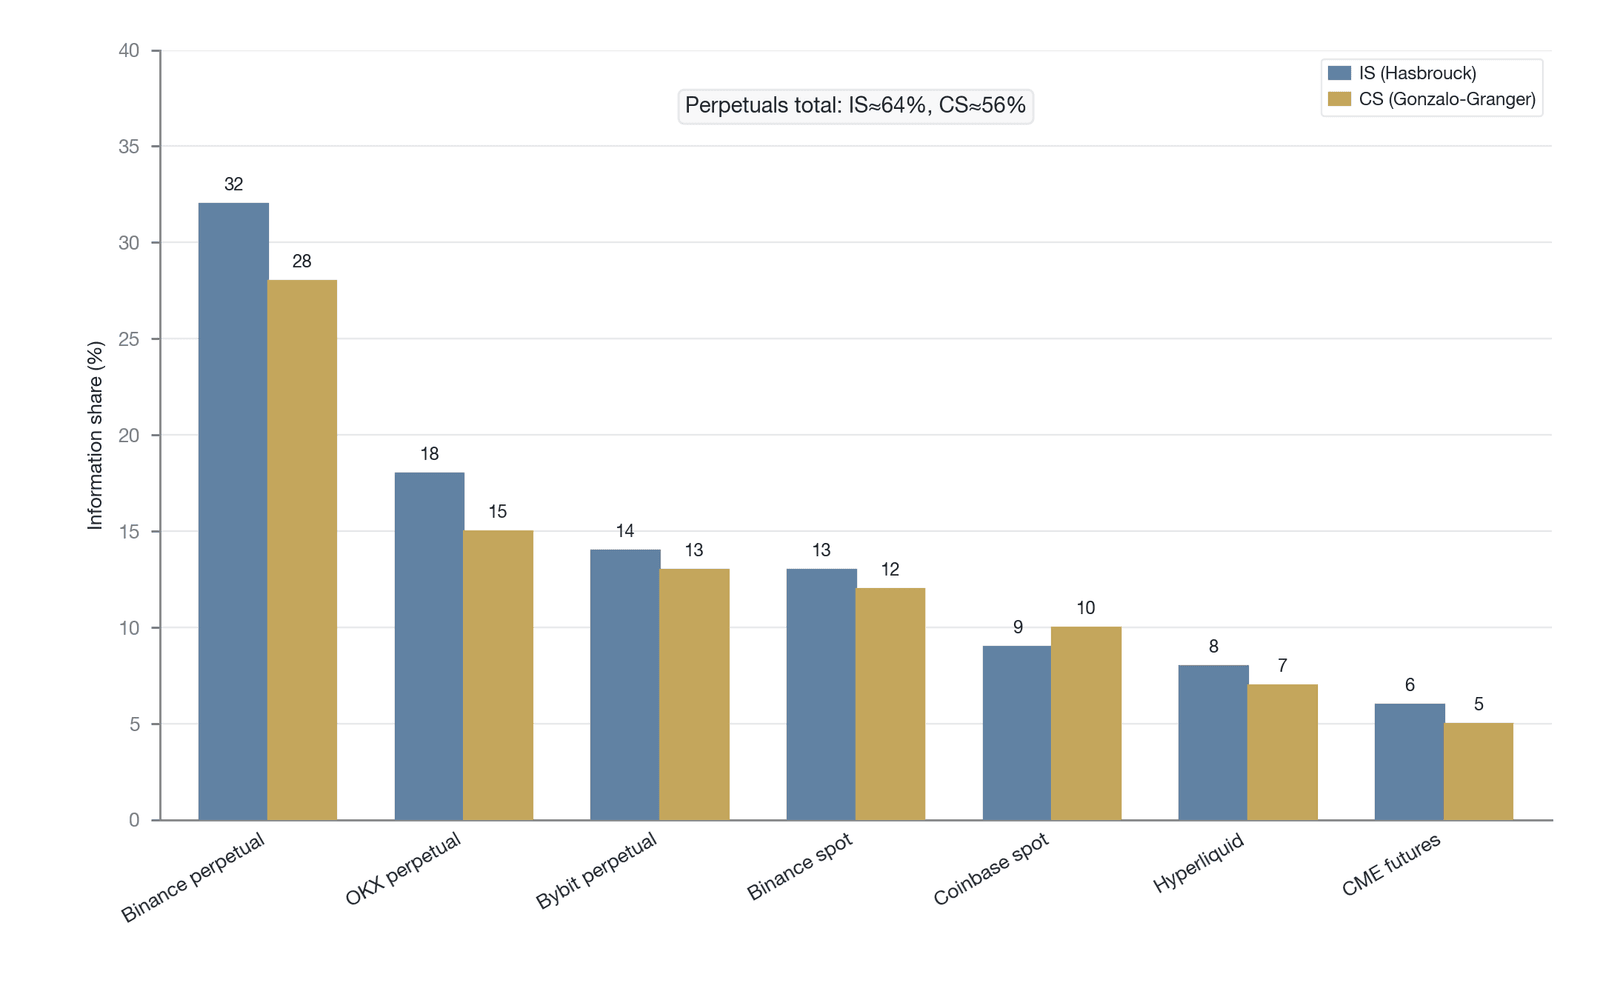
Figure 13-18. Comparison of Hasbrouck IS and Gonzalo-Granger CS shares across major trading venues (synthesizing multiple studies [18][19]; CME reflects a pre-2024-spot-ETF sample)
Figure 13-18 synthesizes the results of multiple empirical studies, showing that the three major CEX perpetual futures (Binance, OKX, Bybit) together contribute about 64% of the IS share and 56% of the CS share, confirming the dominant position of the derivatives market in price discovery; after including perpetual DEXs such as Hyperliquid, the combined IS of all perpetual futures is about 72%.
As the figure above shows, Binance perpetual futures are the "price leader," with an IS share of about 32% and a CS share of about 28%, both significantly higher than those of other venues. By comparison, traditional financial markets (such as CME futures) contribute only about 6%, which is related to factors such as their weekend closures, higher barriers to trading, and contract-size limits. However, CME's IS share is not proportional to its systemic importance: CME is the main channel for institutions to allocate crypto exposure in a compliant manner, its settlement price is used in the net-asset-value calculation of various ETFs, and the gap effect produced by its trading-session closes and opens can itself be an information event. This 6% IS figure comes from research samples predating the approval of the spot Bitcoin ETF in 2024, since which the landscape has undergone a structural change: CME's institutional trading volume and information share have grown significantly, and the weight of regulated markets in price discovery is rising systematically.
High-performance DEXs, represented by Hyperliquid, are rising rapidly. Although their IS share is currently about 8%, their low latency, on-chain transparency, and permissionless access are attracting a growing number of market makers and arbitrageurs. As DEX infrastructure continues to improve, their weight in the price discovery topology is likely to rise further.
13.4.4 Three types of leaders
Based on the analysis of the information flow topology, we can divide the trading venues in crypto markets into three distinct types of price discovery leaders (Table 13-4). This classification system goes beyond the traditional "spot versus futures" binary and provides a more granular portrait of market roles.
| Leader type | Core characteristics | Typical examples | Operating mechanism | IS contribution |
|---|---|---|---|---|
| Information-efficiency type | Extremely low trading friction, high leverage, dense high-frequency trading | Binance perpetuals, OKX perpetuals | Absorbs incremental information such as macro data and industry news the fastest, producing the initial price jump | ~50%–65% |
| Arbitrage-hub type | Deep spot markets with fiat on/off-ramps | Binance spot, Coinbase spot | Serves as the benchmark leg for cross-instrument (spot-perpetual) and cross-exchange arbitrage, anchoring excessive deviations of derivatives | ~20%–30% |
| Price-benchmark type | Indices aggregating multiple data sources, widely referenced | Oracles (e.g., Chainlink), CEX index prices | Generates no trades itself, but by serving as the benchmark for liquidation and funding rate calculations, constrains the price boundaries of trading markets in reverse | Indirect influence |
Table 13-4. The three types of price discovery leaders in crypto markets and their operating mechanisms (Data source: compiled by the author)
These three types of leaders form a mutually constraining closed loop in the topology: information-efficiency markets produce price innovations, arbitrage-hub markets validate and transmit prices, and price-benchmark markets ensure the long-term anchoring of the entire system. This triangular checks-and-balances relationship functions well under normal market conditions, but in extreme conditions it can rupture as arbitrage friction rises sharply—precisely the issue the next subsection discusses.
13.4.5 Arbitrage friction and transmission delay
Information transmission in the topology is not instantaneous but is limited by arbitrage friction. Under normal market conditions, the arbitrage cost between CEXs is about 8–12 basis points and the price-convergence time is about 0.5–2 seconds; the arbitrage cost between a CEX and a DEX is higher, about 22–26 bps, with a convergence time of about 8–15 seconds. These cost estimates represent explicit transaction costs under ideal conditions. The "8 to 12 basis points" range is achievable only for institutional arbitrageurs who have pre-positioned capital across multiple exchanges, and this implies a significant capital-locking cost. The actual full cost of arbitrage also includes cross-exchange withdrawal delays (10 minutes to several hours under normal conditions, and possibly suspended by exchanges under extreme conditions), basis risk during execution, and the opportunity cost of maintaining margin at multiple exchanges simultaneously. The effective full cost of arbitrage may therefore be several times the explicit cost. When the market encounters an extreme event, these frictions are amplified sharply, causing significant delays and discontinuities in price transmission.
The Bybit hack of February 21, 2025 provides a typical observational slice [1]. In that event, Bybit's Ethereum cold wallet was attacked by the North Korean hacking group Lazarus Group, with losses of about $1.4–1.5 billion in ETH and related derivative assets. According to Kaiko Research's analysis, the market did not begin to react on a large scale until about an hour after the hack occurred (i.e., after the CEO publicly confirmed it), and this delay itself reveals the persistence of information asymmetry: although blockchain data are public, the signal of a major event cannot be identified by the market instantly [3].
Figure 13-19 tracks the speed of price reactions across trading venues and the change in cross-market price differences during the Bybit hack.
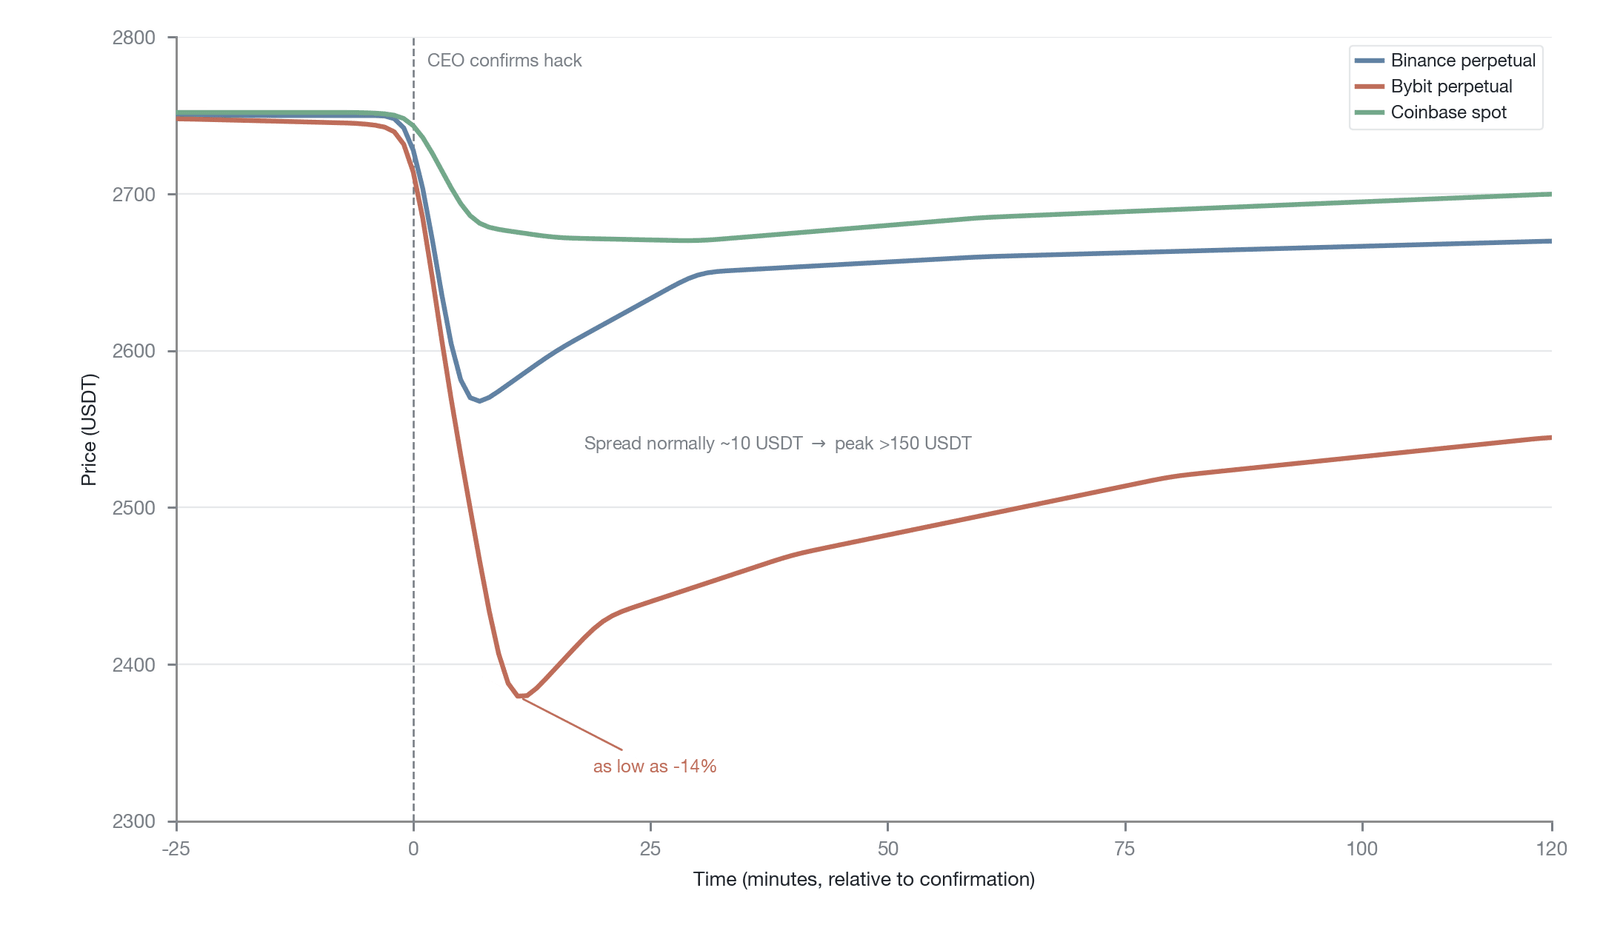
Figure 13-19. Cross-market price reactions and spread widening during the Bybit hack (price paths are illustrative; key values per Kaiko Research [3])
Figure 13-19 shows that after the event was confirmed, Binance perpetuals, Bybit perpetuals, and Coinbase spot differed significantly in reaction speed and depth of decline; the figure also marks the price difference between Binance perpetuals and Coinbase spot widening from the normal level of about 10 USDT to over 150 USDT at one point.
The market reaction after the event's confirmation exhibited three levels of characteristics. In terms of reaction speed, Binance perpetual futures reacted first, completing a repricing of about 7% within 5 minutes, whereas the Coinbase spot market exhibited a significant delay of about 8 seconds with a smaller decline (about 2%–3%), a stratification fully consistent with the prediction of the information flow topology. At the same time, Bybit perpetual futures exhibited an excess decline far exceeding that of other markets (reaching about 14% at one point), which included the market's pricing of the credit risk to Bybit's platform solvency; this credit-risk premium is pure local noise and should not be regarded as information about ETH fundamentals. On the arbitrage dimension, a cross-exchange price difference of over 150 USDT would normally be closed quickly by arbitrageurs, but at the moment of crisis, as large numbers of market makers withdrew liquidity (Bybit's 1% market depth fell from $68 million to $28 million within hours of the event, a decline of 59%), and with restricted fund transfers and excessive one-sided risk, arbitrage friction tended toward infinity and the information-transmission chain ruptured [3].
According to Kaiko Research's statistics, in the first hour after the CEO confirmed the hack, the cumulative volume difference for the ETH-USDT pair alone reached negative $52 million, including a single large sell order of about $500,000 [3].
13.4.6 The state dependence of the topology
The information flow topology is not a static structure but is highly state-dependent. As the market environment evolves from a normal state to a stressed state and then to a crisis state, the node weights and connectivity of the topology undergo a systematic dynamic reconfiguration.
Figure 13-20 shows the dynamic evolution of the information flow topology from a normal state to a crisis state.
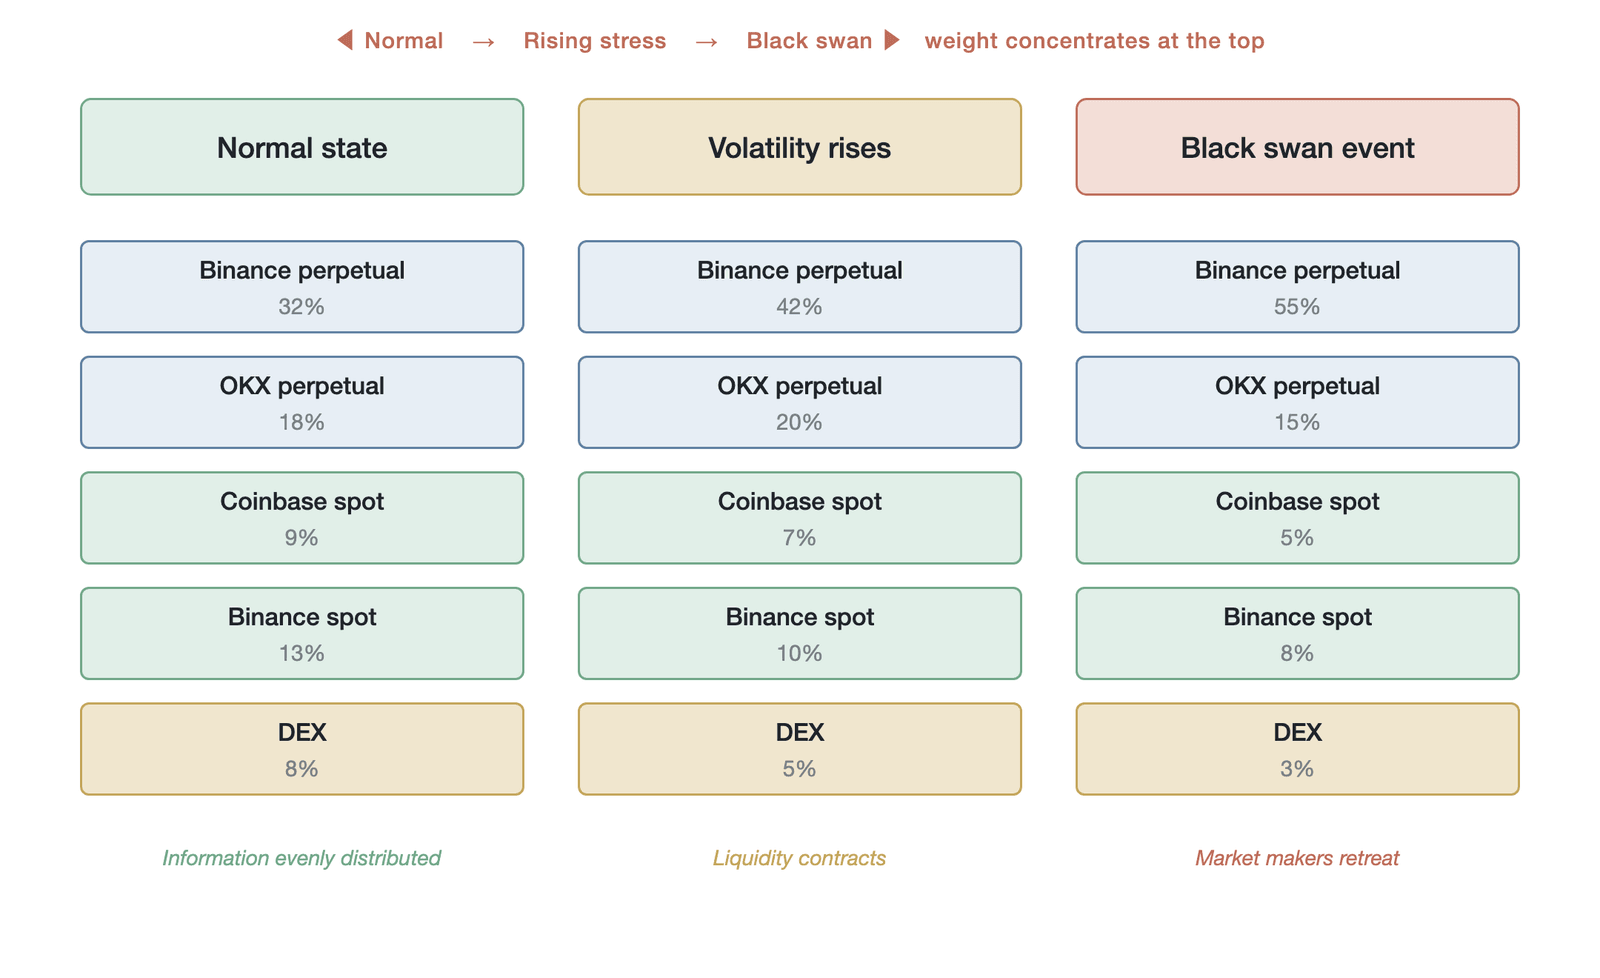
Figure 13-20. The evolution of the information flow topology from normal to stressed to crisis states (here "crisis" denotes an information-mechanical compound crisis; venue IS values are illustrative)
Figure 13-20 shows that as the market evolves from a normal state to a crisis state, the weight of price discovery gradually concentrates in the leading platforms, and the IS share of peripheral nodes shrinks dramatically. This concentration dynamic reminds us that static IS/CS measurements must be interpreted together with the market state; otherwise one would underestimate the distortion of price signals caused by the structural collapse of liquidity under extreme conditions.
In the normal state, market volatility is calm and liquidity is ample. The topology exhibits a multi-center feature, with CEX spot and leading DEXs able to maintain a certain price discovery share (for example, Coinbase spot at about 9% IS and Hyperliquid at about 8%), arbitrage channels flowing freely, and cross-market price differences kept within a normal range.
In the stressed state, macro data releases or local negative news drive volatility higher. Market makers contract their quote widths and lower their quoting depth, and liquidity concentrates in Binance perpetual futures, which have the lowest trading cost. At this point, the IS share of Binance perpetuals rises from about 32% in the normal state to about 42%, while the shares of DEXs and second-tier CEXs decline accordingly. The "centralization" of the topology deepens.
In the crisis state, the mode of reconfiguration of the topology depends on the information structure of the crisis, an analysis consistent with the typological framework of Section 13.3.5. Following the crisis typology of Section 13.3.5, in an information-mechanical compound crisis (a major news event superimposed on a liquidation cascade, such as the Bybit hack), the cross-market arbitrage mechanism fails on a large scale, and the connectivity of the topology declines sharply; yet price discovery instead becomes "highly centralized": informed traders still prefer the leading derivatives market with the highest leverage efficiency to express their judgment about the event's fundamental meaning, the leading derivatives node becomes the most important information source, and other nodes are largely reduced to "price takers" or fall into liquidity exhaustion. In a pure mechanical crisis (a liquidation cascade triggered by high leverage, with no input of major new information), by contrast, the price signal of perpetual futures is polluted by large amounts of mechanical noise, its IS share instead declines, and leadership temporarily shifts to the spot market, which is not affected by the forced-liquidation mechanism (see the analysis in Section 13.3.5). This distinction means that the degradation of the topology in a crisis state does not follow a single pattern: an information-mechanical compound crisis causes the topology to concentrate extremely on the leading derivatives node, whereas a pure mechanical crisis may cause a temporary shift of information-flow leadership from the derivatives market to the spot market.
Beyond the three market states above, regulatory shock constitutes a fourth type of trigger for topological reconfiguration. When regulators take enforcement action against a dominant venue (such as restricting a particular exchange's operations in a given jurisdiction), the information flow topology may undergo an abrupt change within days, traders are forced to migrate to alternative venues, and lead-lag relationships may fully reverse in the short term. This regulation-driven topological reconfiguration is entirely different in nature from the market-volatility-driven state transitions: the latter are endogenous and continuous and usually recover as volatility subsides; the former is exogenous and discrete, and its impact may be a permanent structural change rather than a temporary deviation.
This state dependence indicates that when assessing the price discovery efficiency of crypto assets, one must consider the macro and micro environment the market is in. Static IS/CS measurements often mask the risk of a structural collapse of liquidity under extreme conditions. For regulators and risk managers, what matters is not how high price discovery efficiency is in the normal state but how severe the degradation of the topology is in the crisis state, because it is precisely at these moments that the distortion of price signals causes the greatest economic losses.
13.5 The three pathways of mechanical noise
In the previous section, we established the dominant position of perpetual futures in price discovery. This leadership, however, is not without cost. The distinctive microstructure design of perpetual futures markets (high leverage, automatic liquidation, and the funding rate mechanism), while raising capital efficiency and the speed of information absorption, also endogenously produces a non-information-driven price volatility—that is, mechanical noise.
This section presents the fourth core theoretical contribution of this chapter (CC4): perpetual futures are not merely the engine of price discovery but also a source of disturbance to the price system of the entire crypto market. Through three specific pathways—liquidation cascades, funding rate extremes, and the mark price EMA delay—it analyzes how this mechanical noise is generated, amplified, and transmitted outward.
13.5.1 Liquidation-driven price displacement
Crypto derivatives markets widely adopt deterministic automatic liquidation mechanisms, but their concrete implementation is far more complex than the simplified narrative of "forced liquidation at market." When an account's maintenance margin ratio falls below a specific threshold, the risk engines of leading exchanges (such as Binance and OKX) do not dump the entire position at once but adopt a tiered-liquidation strategy: they divide the position into several tiers according to its size and close it batch by batch starting from the outermost tier, with each batch executed at a different price level, in the hope of reducing the market impact while controlling risk. In terms of execution, the liquidation engine usually issues aggressive limit orders rather than pure market orders—that is, it completes the liquidation with limit orders posted near the current best opposing price, rather than unconditionally accepting any price. Moreover, when counterparty liquidity is severely insufficient during liquidation and the insurance fund's consumption reaches a preset threshold, some positions are not executed on the open market but enter the auto-deleveraging (ADL) process, in which the system directly designates counterparties among profitable traders to complete the closeout. Although tiered liquidation and the limit-order mechanism can effectively mitigate market impact in a normal volatility environment, in situations of extreme liquidity exhaustion (order book depth plunging to a few percent of the normal level), aggressive limit orders cannot obtain sufficient fills against thin quotes, the successive batches of tiered liquidation are triggered in quick succession within an extremely short time, and their actual effect degrades to a behavior pattern close to market liquidation. This mechanism design, while protecting the exchange from bad-debt risk, therefore still creates enormous "mechanical selling pressure" under extreme conditions, driven not by any new information about the asset's fundamentals but by the deterministic execution of system rules.
When the market encounters an initial downward shock, the first batch of long liquidations triggered produces additional selling, driving the price down further and thereby triggering the liquidation of more highly leveraged positions. This positive feedback loop is called a liquidation cascade. During the cascade, the violent price decline departs entirely from the guidance of fundamental information and is driven purely by system rules and liquidity exhaustion. This liquidation-driven, non-informational volatility—that is, the "mechanical volatility" defined in Section 11.8.3 of Chapter 11—is denoted in this chapter by the symbol to distinguish it from information-driven volatility ; its full formalization (the liquidation reflexivity equation, the divergence criterion , and the four-stage dynamics) appears in Chapter 11, Sections 11.3 and 11.5. Here is the liquidation gain coefficient defined in Chapter 11 and is unrelated to this chapter's topology or venue information gravity .
The crypto market flash crash of October 10–11, 2025 is an extreme manifestation of this mechanism [21]. Over the course of a single weekend, forced liquidations of over $19 billion occurred market-wide (on CoinGlass's basis, approximately $19.1–19.4 billion), a scale roughly 19 times that of the March 12, 2020 event (see Section 13.7.1). The average intraday maximum drawdown of about 1,600 tokens approached 60%, and hundreds of small-cap tokens lost 70%–90% of their quoted value on at least one trading venue.
Figure 13-21 simulates the dynamic evolution of price, visible liquidation notional, and open interest during a typical liquidation cascade event.
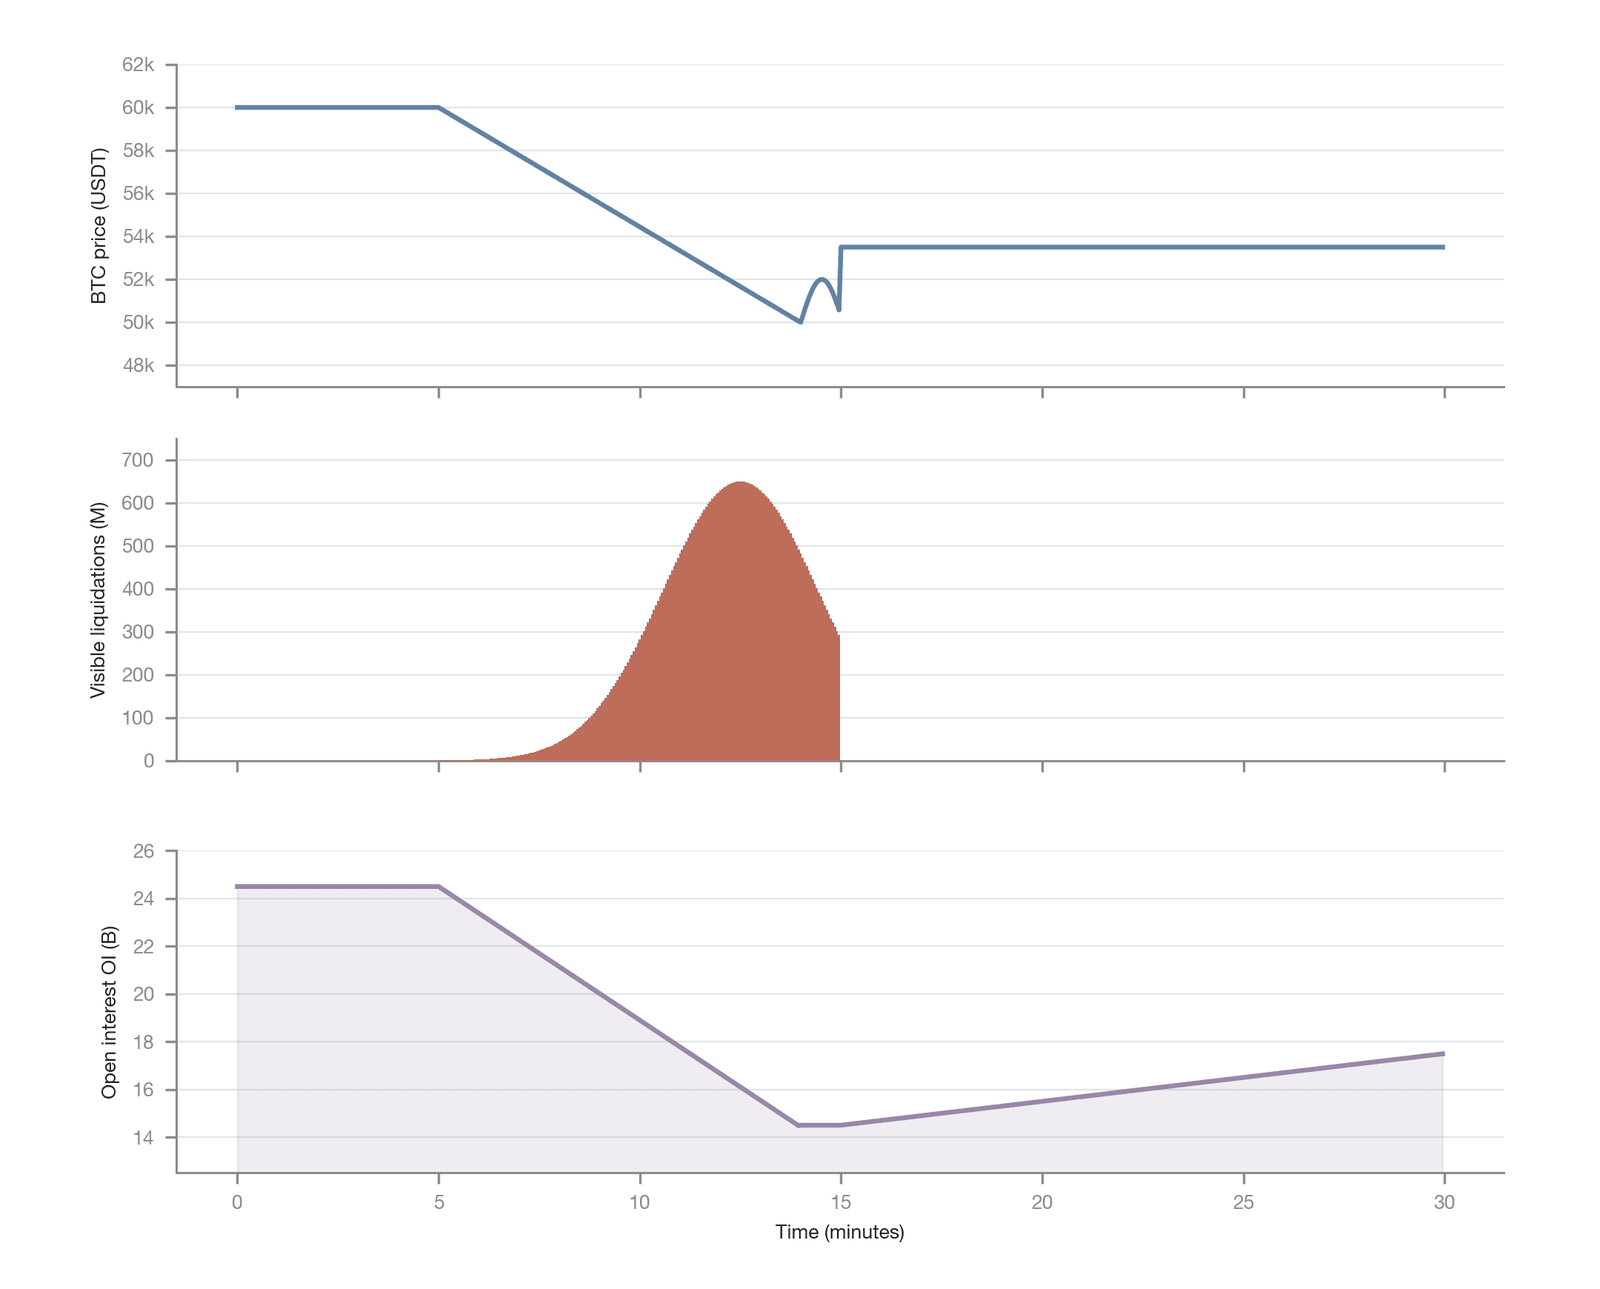
Figure 13-21. The dynamic evolution of price, visible liquidation notional, and open interest during a liquidation cascade (conceptual illustration: simulated data, not empirical)
Figure 13-21 simulates a typical liquidation cascade: after the initial trigger, the price probes downward nonlinearly, the visible liquidation notional grows exponentially, and open interest shows a cliff-like drop of about 40%.
In the "peak pressure" phase of the liquidation cascade, the depth of the price decline far exceeds the reasonable range of the initial information shock. This overshoot caused by forced liquidation is the most typical mechanical noise. The destructive power of a liquidation cascade stems from three mutually reinforcing factors. At the level of deterministic execution, the automatic liquidation engine executes unconditionally according to preset rules, without regard to market liquidity conditions or price reasonableness—as Greco noted in his analysis of the October 2025 event, "deterministic automation is predictable, and predictability is exploitable" [21]. On the liquidity dimension, during the cascade market makers withdraw their quotes as risk rises sharply, causing order book depth to plunge, so that the liquidation sell orders face a market whose liquidity is shrinking sharply, and every forced liquidation causes a larger price impact. Cross-margin contagion further amplifies the crisis: under a unified account system, the depreciation of a single collateral asset can trigger the simultaneous liquidation of multiple unrelated positions—as in the October 2025 event, when the local liquidity exhaustion of Ethena's USDe on Binance's internal order book (falling to about $0.65 at one point, a discount of about 35%) triggered chain liquidations across all products through the cross-margin mechanism of the unified account [21]. This discount was mainly a pricing distortion of Binance's single low-liquidity USDe pair—over the same period the deviation on Curve was under 100 basis points, Bybit was only about $0.92, and the Ethena protocol maintained over-collateralization and normal redemptions, so the 35% does not reflect USDe's true solvency risk (see the related analysis in Chapter 11). Unified margin does not alter the fundamental correlations among assets in a normal market (the correlation among BTC, ETH, and altcoins is usually between 0.3 and 0.6), but under liquidation contagion it creates an endogenous tail-correlation jump: the depreciation of a single collateral asset causes unrelated positions to be liquidated simultaneously, so that the realized correlation can spike to nearly 1.0. This "tail-correlation regime shift" poses a fundamental challenge to models such as Value at Risk (VaR) that rely on historical correlations for risk measurement. The "margin spiral" framework proposed by Brunnermeier and Pedersen (2009) provides a theoretical basis for understanding this endogenous correlation mechanism [22].
At the tail of the liquidation cascade, the auto-deleveraging (ADL) mechanism constitutes an independent and far-reaching noise-transmission pathway. The trigger condition for ADL is usually tied directly to the state of the exchange's insurance-fund consumption: when the liquidation engine cannot complete a closeout on the open market at the bankruptcy price or better, and the insurance fund's balance falls below a preset threshold, the system initiates the ADL process, no longer relying on open-order-book matching but instead forcibly selecting counterparties among profitable traders to take on the liquidated position. The selection of counterparties follows a specific priority-ranking logic: most leading exchanges (such as Binance and Bybit) use the product of profit rate and leverage multiple as the ranking metric—that is, the accounts with the richest profits and the most aggressive leverage use are selected first. The original intent of this design is to prioritize reducing the positions with the most concentrated risk in the system, but it triggers a highly destructive chain reaction. The typical business model of a market maker is to hold hedged positions in multiple markets simultaneously—for example, going short in the perpetual futures market to hedge a long exposure in the spot market. When the ADL mechanism forcibly liquidates their profitable short leg in perpetual futures, the originally risk-neutral portfolio instantly becomes a one-directional naked exposure. Facing this sudden risk exposure, the market maker's rational response is to immediately withdraw all remaining quotes from the market to avoid further losses in an extreme-volatility environment. This withdrawal manifests at the micro level as a further collapse of order book depth, and at the macro level as a chain exit of liquidity supply: the retreat of one market maker intensifies price volatility, which prompts more market makers to trigger their own risk-control thresholds and exit one after another. ADL is therefore not only the last line of defense of the liquidation cascade; it is itself a noise amplifier: by destroying market makers' hedge structures, ADL turns a position-level risk event into a market-wide liquidity crisis.
The analysis of the liquidation cascade above focuses on its mechanical layer: insufficient margin triggers the liquidation engine, liquidation orders consume liquidity, and the price decline triggers more liquidations—each link of this positive feedback loop is the automatic execution of deterministic rules. In reality, however, the liquidation cascade is also overlaid with an equally important, and possibly even more forceful, behavioral amplification layer. Data platforms such as CoinGlass and Hyblock Capital broadcast market-wide liquidation data in real time, and the token, direction, and amount of every large forced liquidation are pushed to traders' screens and social-media feeds within seconds of its occurrence. This unprecedented transparency of the liquidation process creates a reflexive behavioral feedback mechanism: when traders observe that large-scale liquidations are occurring, they close positions preemptively to avoid risk on the expectation that "the cascade is not yet over," or actively build short positions to profit from the expected further decline—behavior that may be termed "liquidation front-running." Because the dense liquidation price levels displayed by liquidation heatmaps provide market participants with common knowledge about the price levels at which the next wave of forced liquidations may be triggered, traders' expectations and actions tend to become self-fulfilling: when enough participants make the same directional trading decision based on the same information, this itself generates pressure that moves the price toward the liquidation-dense zone. From the perspective of price discovery, the existence of this behavioral layer means that the total price displacement in a liquidation cascade cannot simply be classified as pure mechanical noise . The mechanical component (the forced liquidations executed by the liquidation engine according to rules) indeed carries no information about the asset's fundamentals and belongs to the mechanical component defined in Section 13.2.2, and it should revert completely after the price impact fades. The behavioral-expectation component, however, is more complex: traders' active responses to liquidation data may partly reflect their genuine assessment of the market's fragility structure (leverage distribution, liquidity depth, insurance-fund adequacy), and this assessment itself carries valid information about the state of the market's systemic risk. To treat all price displacement during a liquidation cascade as noise to be filtered out may therefore lead to an underestimation of the market's actual risk level. A more careful analytical framework should decompose the price change during a cascade into a mechanical component and a behavioral-expectation component, and recognize the ambiguity of the latter's informational nature.
13.5.2 The distortionary effects of funding rate extremes
The mechanism by which perpetual futures anchor to the spot price through the funding rate has already been developed in Section 13.3.4. In one-directional conditions, however, the funding rate often moves toward extremes, thereby producing serious distortions in traders' position behavior and in asset prices [23].
In an extremely bullish market, crowded long sentiment drives the funding rate to surge. Taking the standard mechanism of settlement every 8 hours as an example, when a single rate reaches 0.1%, the annualized cost of holding a long position exceeds 100%. Three mechanism details must be noted when interpreting funding rate extremes. First, most exchanges set a cap on the final rate (such as Binance's ±0.75% per 8 hours) and set an additional clamp boundary on the "interest-rate-minus-premium-index" difference (such as Binance's ±0.05%); the 0.1% in the example is far from touching that cap. Second, the standard 8-hour settlement frequency is diverging: Hyperliquid already settles hourly, and some protocols are experimenting with continuous funding mechanisms; a higher settlement frequency lowers the absolute value of any single rate but raises the temporal resolution of the rate signal. Third, the actual rate consists of two parts—an interest-rate component (fixed or semi-fixed) and a premium index (a dynamic component reflecting the basis between perpetual futures and spot); discussing only the extreme total rate without decomposing its constituents omits the independent information content of the two components. This high holding cost produces two effects: first, it forces some capital-inefficient longs to close out, generating selling pressure unrelated to fundamentals; second, it attracts arbitrageurs to buy in the spot market and go short in the contract market (i.e., "spot-perpetual" basis arbitrage), artificially increasing spot buying and contract selling.
This funding rate extremization recurs in historical data. Figure 13-22 selects data from a typical bull-market phase of BTC perpetual futures, overlaying the 8-hour change sequence of the funding rate with the price path and the annualized holding cost.
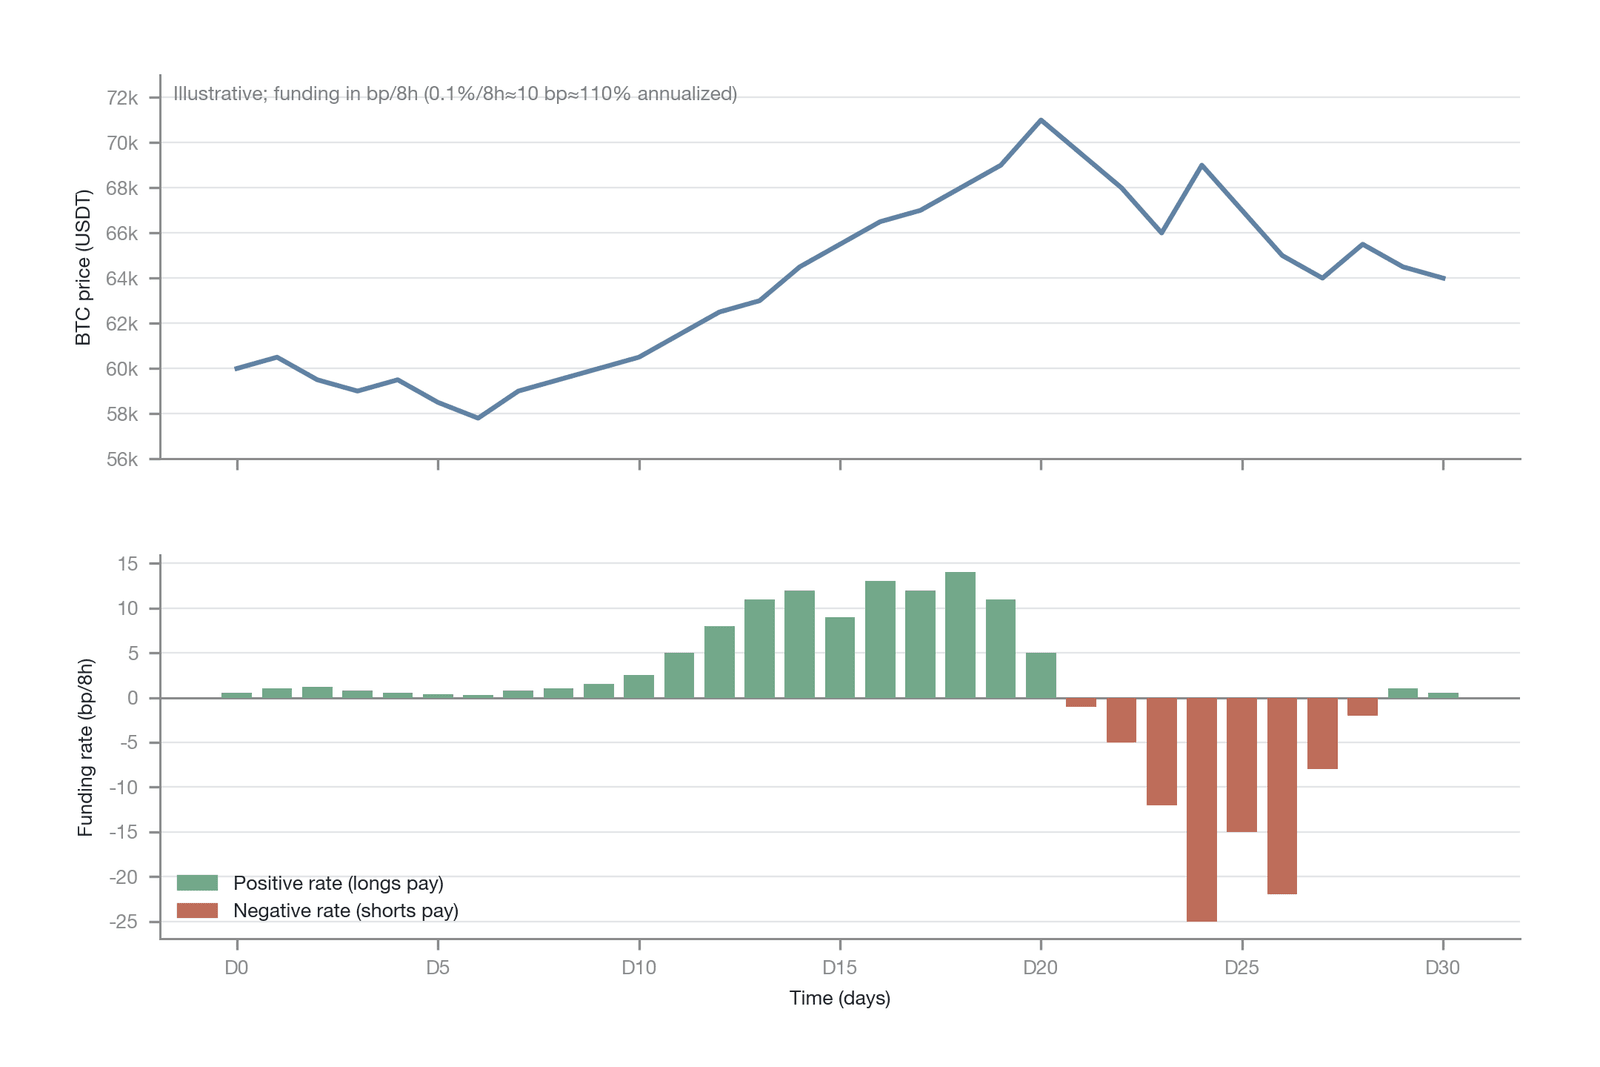
Figure 13-22. The distortionary effect of funding rate extremes on the BTC price and holding cost (representative illustration; rates measured in basis points per 8 hours, 0.1% per 8 hours ≈ 10 basis points ≈ approximately 110% annualized)
Figure 13-22 clearly shows the two distortionary effects of funding rate extremization. In the crowded-long phase (the high-rate interval marked in the figure), a single 8-hour rate of 0.1% translates into an annualized cost of over 100%, and this staggering holding cost causes all participants except the highest-conviction longs to bleed continuously—market makers and capital-inefficient trend-followers are forced to close out and exit, and the resulting selling pressure is driven entirely by the rate mechanism and is unrelated to BTC's fundamental valuation. At the same time, the extreme positive rate attracts large numbers of "spot-perpetual" basis arbitrageurs to enter: they buy BTC in the spot market and go short in the perpetual futures market to collect the high funding rate subsidy, and this purely arbitrage-motivated trading further artificially alters the supply-and-demand structure of the spot and contract markets.
The reverse extreme is equally destructive. In a panic-selling phase, the funding rate can turn deeply negative (for example, on February 28, 2026, the annualized BTC funding rate briefly fell to about −6% (on an annualized/aggregate basis, not a value within a single-settlement clamp boundary)), meaning that shorts must pay a high fee to longs [24]. Such negative rates attract contrarian arbitrageurs to build long positions, but their motive is not a bullish view on fundamentals but rather to collect the rate subsidy. Once the rate returns to normal, these "rate hunters" close out en masse, generating price volatility unrelated to information.
The mechanical noise produced by funding rate extremization has an important feature: 8-hour periodicity. Because the funding rate at leading exchanges is settled every 8 hours (00:00, 08:00, and 16:00 UTC), before and after the settlement moment, traders' position-adjustment behavior produces regular price disturbances. This periodic noise is clearly visible in high-frequency data and has been widely exploited by quantitative trading firms. The strategy faces significant execution constraints: the actual trading window is extremely narrow (usually effective only within 1 to 5 minutes before and after settlement), broad awareness of the strategy has led to high crowding, and the mean-reversion positions built during periods of extreme rates face directional tail risk, because an extreme rate is sometimes a signal of a persistent trend rather than a brief deviation.
13.5.3 The EMA delay of the mark price
To prevent market manipulation and price wicks from triggering unnecessary liquidations, the vast majority of CEXs adopt a mark price mechanism [25]. The mark price is usually calculated based on the following formula:
where is the weighted index price across multiple spot exchanges, and is the exponential moving average of the difference between the perpetual futures' last traded price and the index price; here basis is defined as the perpetual futures' last traded price minus the index price (a positive value indicates a premium). The decay factor of the EMA determines the length of the smoothing window: the longer the window, the stronger the smoothing effect, but also the greater the delay. This formula is a conceptual, simplified expression, and the actual implementations of different exchanges differ significantly (and at the contract level are all fixed-point arithmetic, involving rounding to the tick). Binance uses a three-value median method, that is, , where is the last traded price, , and ; Bybit uses . The EMA window parameters also differ significantly; for example, Binance uses a simple moving average of the 30-second basis for Price2 (1 minute before September 2025) rather than an exponentially weighted one. These implementation differences directly affect the specific path and magnitude of the EMA-delay noise, causing different exchanges to produce different degrees of mark-price deviation in the same market event.
Although EMA smoothing effectively filters out instantaneous high-frequency noise, it necessarily introduces a phase delay mathematically. When the market moves rapidly in one direction, the reaction of the mark price lags significantly behind the true last traded price and the spot index price.
Figure 13-23 compares the delay and cumulative deviation of the mark price relative to the spot index under different EMA windows.
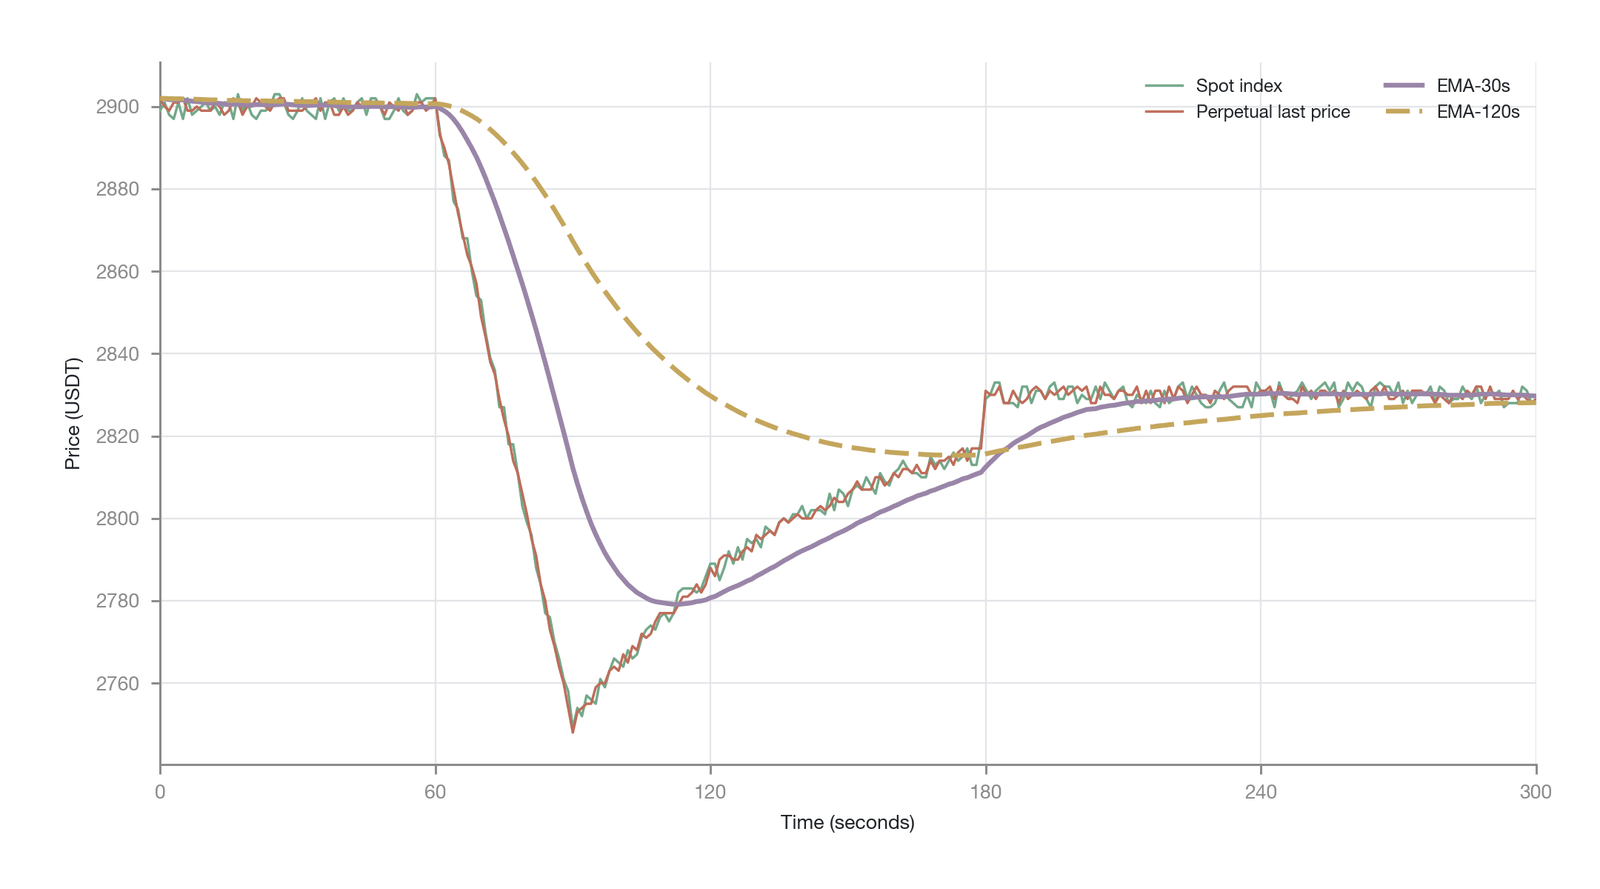
Figure 13-23. The delay and cumulative deviation of the mark price under different EMA windows (illustrative price path demonstrating EMA phase delay, not empirical market data)
Figure 13-23 compares the performance of the spot index price, the perpetual futures' last traded price, and the mark price under different EMA windows (30 seconds, 120 seconds) in a rapidly falling market, intuitively demonstrating the phase delay introduced by EMA smoothing: the longer the window (such as 120 seconds), the more pronounced the lag of the mark price and the larger its cumulative deviation relative to the spot index.
EMA smoothing produces two contradictory effects. As for delayed liquidation, when the true price rapidly breaks below the liquidation-trigger line, the mark price may still be in the safe zone because of the EMA's smoothing, which means that positions that should have been liquidated persist temporarily and accumulate enormous latent liquidation pressure at the low price level; once the mark price finally catches up with the true price, the deferred liquidation instructions erupt all at once, forming an even more violent secondary shock. As for cumulative deviation, in a persistent one-directional move the deviation between the EMA mark price and the true price keeps widening: a longer EMA window (such as 120 seconds), while providing stronger resistance to manipulation, also means a larger cumulative deviation. This deviation not only affects the timing of liquidation but also distorts the calculation of the funding rate (because the rate is usually based on the deviation between the mark price and the index price), thereby feeding the noise of pathway three back into pathway two and forming cross-contamination.
13.5.4 The superposition effects of the three pathways
The three pathways above do not exist in isolation; in actual markets they often interweave and superimpose in resonance. Because these noise sources arise from deterministic system rules (the funding rate settled every 8 hours, the fixed-parameter EMA algorithm, the explicit maintenance margin ratio), they exhibit high periodicity and predictability in the time series.
Understanding the noise characteristics of a single pathway is important, but in reality the three pathways are often active simultaneously, interweaving and superimposing. Figure 13-24, through a time-series simulation, unfolds the three noise pathways in layers over a multi-day window and superimposes them into a total-noise curve in the bottom panel, revealing how the composite noise peaks cluster around the funding rate settlement moments.
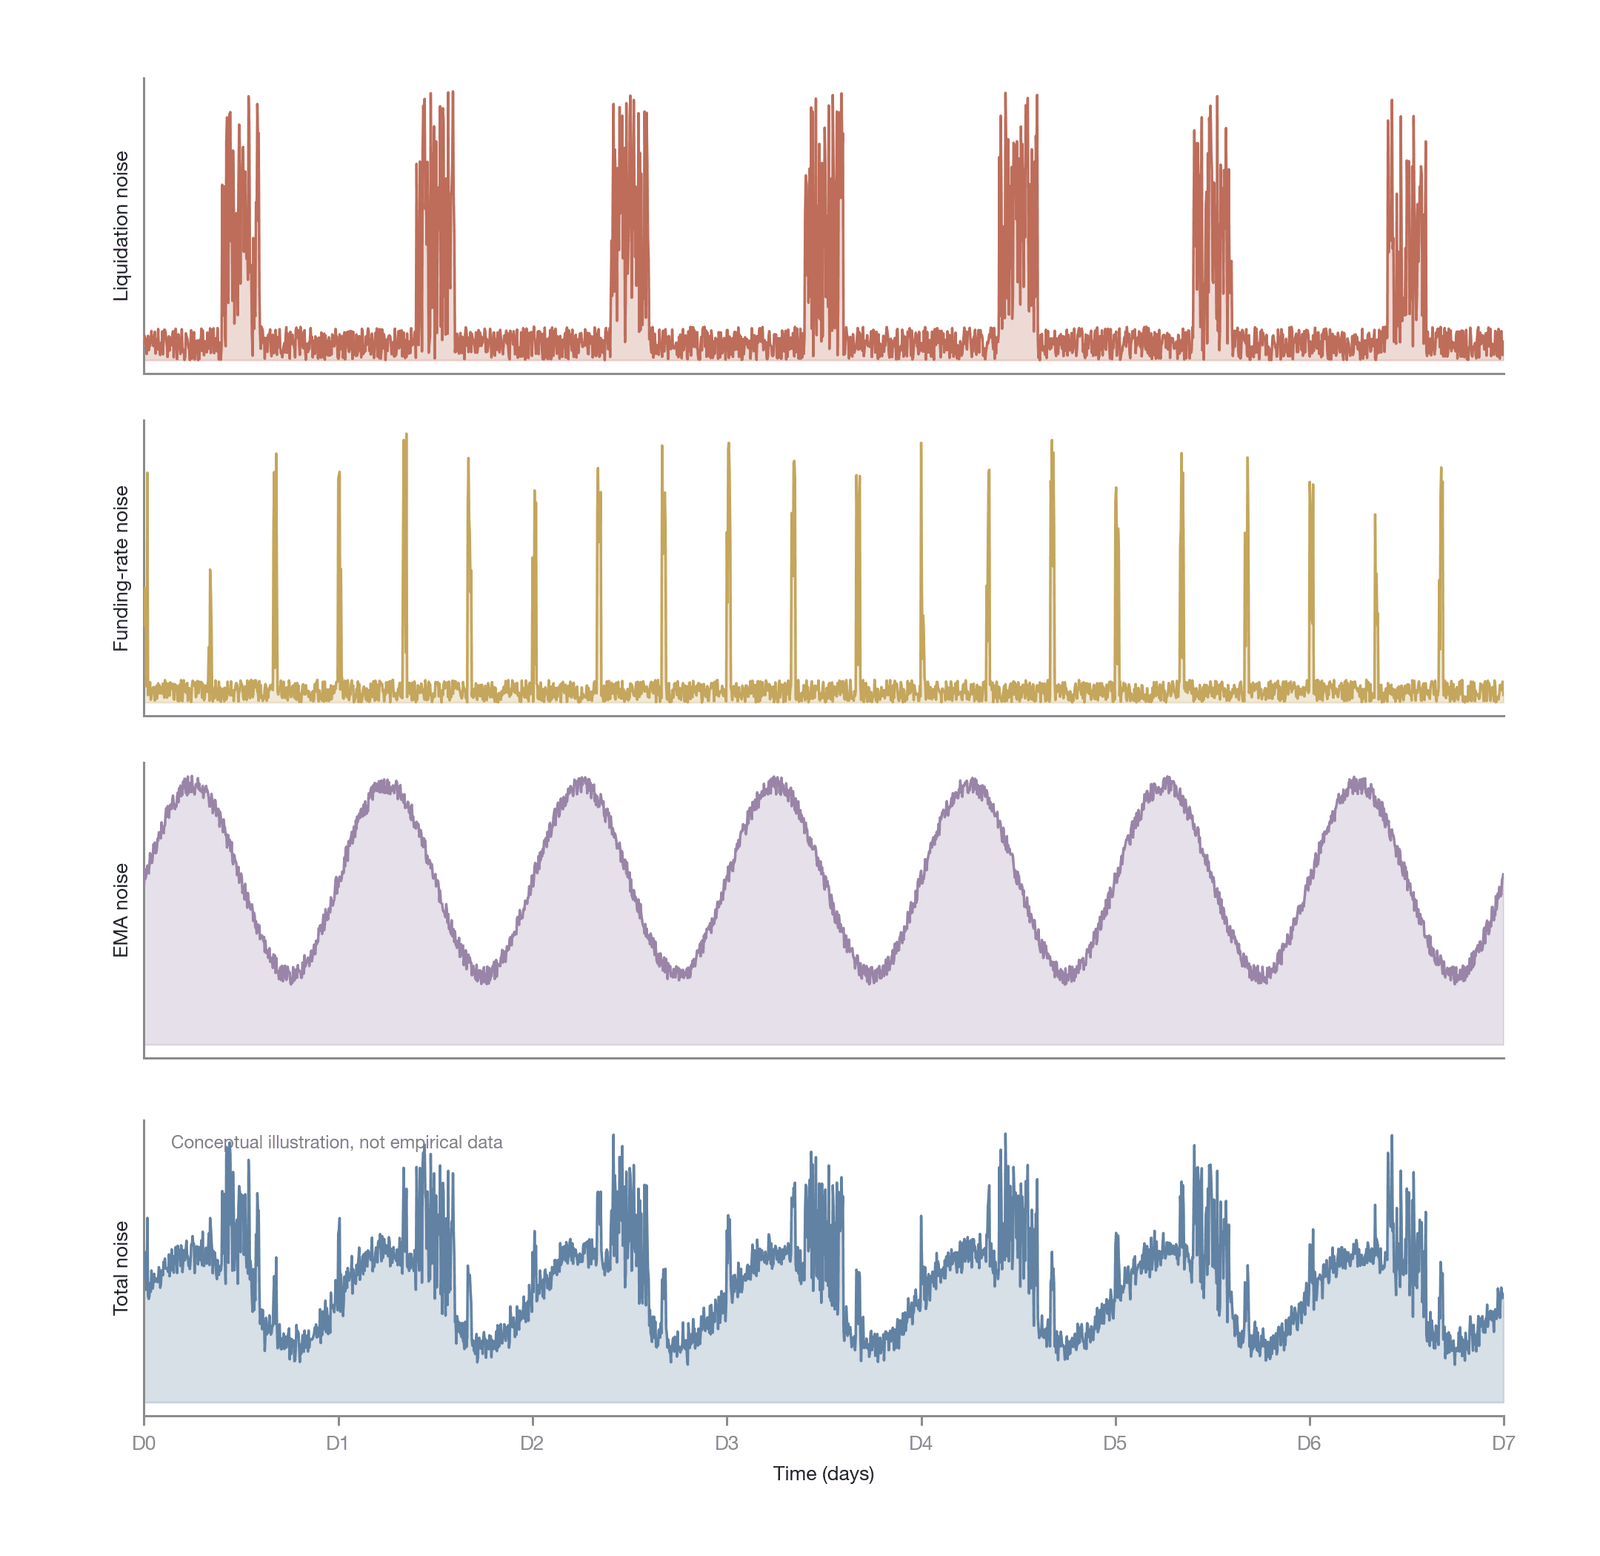
Figure 13-24. Time-series superposition and periodic patterns of the three mechanical noise pathways (conceptual illustration: simulated data, not empirical)
The four-layer panel structure of Figure 13-24 reveals the markedly different temporal-frequency characteristics of each pathway. The first panel shows the sporadic, pulse-like feature of liquidation-driven noise: its intraday distribution is not even but clusters around the alternation of the Asian and European/U.S. sessions, because cross-time-zone liquidity gaps tend to expose the fragility of highly leveraged positions at these moments. The second panel presents the highly regular 8-hour periodicity of funding-rate-extremization noise—about 15 to 30 minutes before each settlement at 00:00, 08:00, and 16:00 UTC, position-adjustment behavior forms an identifiable price pulse. The third panel shows the persistent, low-frequency deviation of mark-price EMA-delay noise, accumulating monotonically during trending conditions. The bottom superposition panel is the most critical: when a liquidation pulse happens to overlap with a funding settlement window (as in the peak region marked in the figure), the resonance of the three noise sources makes the total noise magnitude far exceed the simple sum of any single pathway.
As the simulated results in the figure above show, the noise of the three pathways exhibits different frequency characteristics along the time axis:
These frequency differences have direct significance for the design of quantitative trading strategies. Table 13-5 systematically summarizes the attribute differences of the three noise pathways and their superposition effect along three dimensions: temporal-frequency characteristics, trigger conditions, and ex ante predictability. This classification provides a practical analytical framework for identifying noise-dominated periods versus signal-dominated periods.
| Noise pathway | Temporal-frequency characteristics | Trigger condition | Predictability |
|---|---|---|---|
| Pathway 1: Liquidation cascade | Sporadic, but with intraday clustering | Price breaks through a liquidation-dense zone | Moderate (can be anticipated via OI distribution and leverage ratios) |
| Pathway 2: Funding rate extremes | Strict 8-hour periodicity | Severe long-short imbalance | High (both settlement times and rates are observable) |
| Pathway 3: EMA delay | Persistent low-frequency deviation, accumulating during trends | Rapid one-directional moves | High (EMA parameters are public; deviation is computable) |
| Three-pathway superposition | Composite periodicity, peaking around funding settlement windows | A combination of the above conditions | Moderate-to-high (the overall pattern is identifiable) |
Table 13-5. Comparison of the attributes of the three mechanical noise pathways and their superposition effect (Data source: compiled by the author)
High-frequency trading firms and quantitative market makers exploit precisely this predictable mechanical noise to extract profits through statistical arbitrage strategies. For example, in the minutes before funding settlement, market makers can anticipate the direction of position adjustment and position themselves in advance; near a liquidation-dense zone, algorithmic traders can predict the trigger point of a cascade by monitoring the distribution of open interest. A distinction must be drawn: the "moderate predictability" in Table 13-5 refers to the quality of the ex ante directional risk signal, not to the profitability of actual trading. The data provided by liquidation heatmaps (such as CoinGlass and Hyblock) are mostly probabilistic estimates based on position distribution rather than precise data on exchanges' actual liquidation thresholds. Strategies that trade around a cascade face serious execution challenges, and the strategy itself may amplify the cascade through a reflexivity mechanism. This "noise-hunting" behavior itself constitutes part of the market microstructure, partly mitigating the magnitude of mechanical noise, but also further increasing the market's complexity.
13.5.5 Cross-market transmission of noise
Bringing together the analysis above, we must recognize a key fact: the mechanical noise produced by perpetual futures is not confined within the derivatives market. Through cross-market arbitrage and oracle price-feed mechanisms, this noise is amplified and transmitted to the entire crypto asset ecosystem, forming a systemic "contamination."
Figure 13-25 presents, as a flowchart, the complete chain by which noise inside perpetual futures is transmitted to the market at large through the arbitrage and oracle mechanisms.
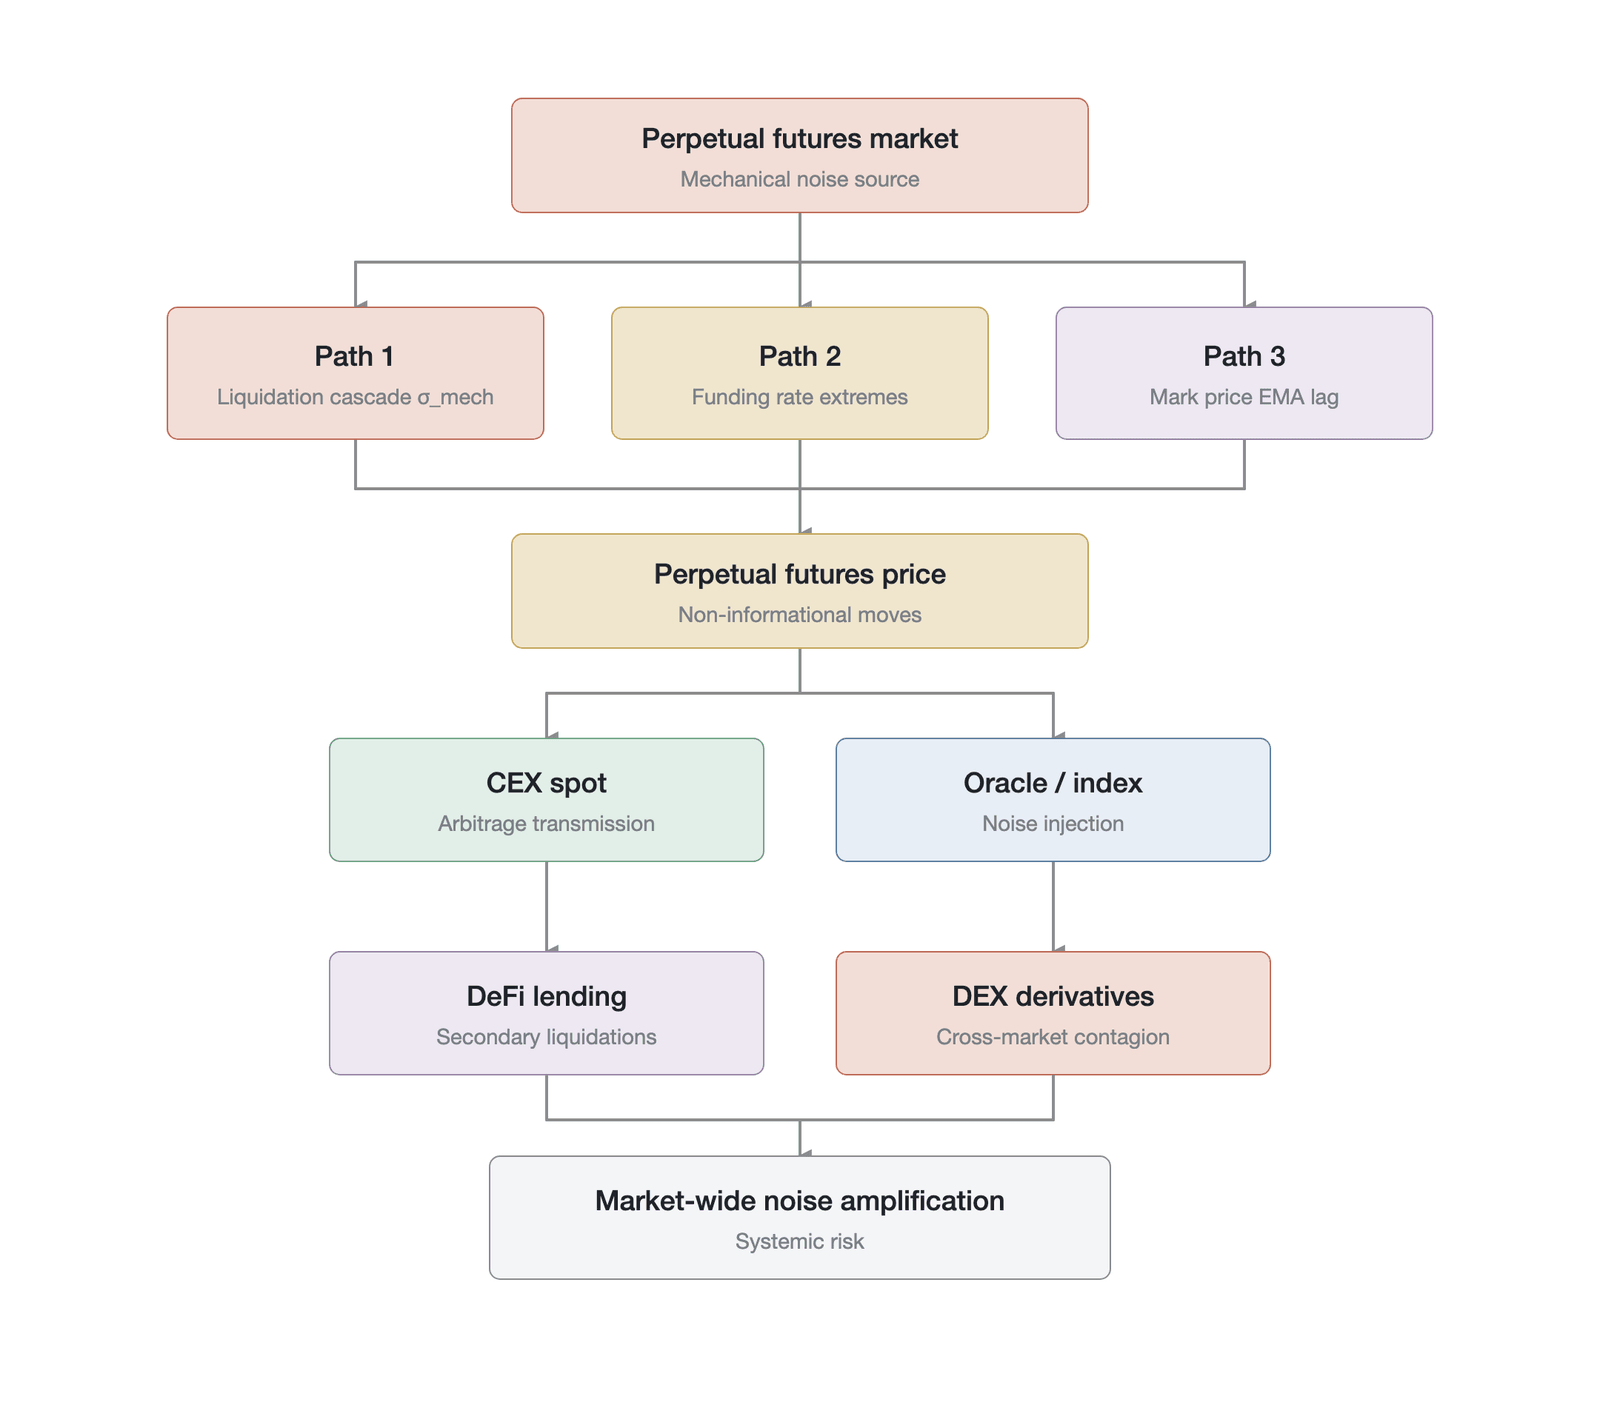
Figure 13-25. The cross-market transmission chain of mechanical noise in perpetual futures
Figure 13-25 shows how the three types of non-informational volatility inside perpetual futures trigger secondary liquidations in DeFi lending and DEX derivatives through the arbitrage and oracle mechanisms, ultimately amplifying into market-wide systemic noise.
The complete chain of noise transmission begins inside perpetual futures. The three pathways—liquidation cascades, funding rate extremes, and EMA delay—first produce non-informational price volatility within the perpetual futures market. Subsequently, after observing the violent price decline in perpetual futures, cross-market arbitrageurs execute corresponding sell operations in the spot market, transmitting the derivatives market's noise to the spot market. Because arbitrageurs cannot distinguish information-driven price changes from mechanical-noise-driven price changes, the two are transmitted indiscriminately. The noise-polluted CEX spot price then enters the on-chain price index through the aggregation mechanism of oracles such as Chainlink; although oracles usually adopt manipulation-resistant designs such as the median or weighted average, when the spot prices of multiple CEXs are simultaneously polluted by noise, the aggregated index price likewise deviates from true fundamental value.
The polluted oracle price feeds back into DeFi lending protocols (such as Aave and Compound), causing the valuation of on-chain collateral to fall; when the valuation drops below the liquidation threshold, the automatic liquidation mechanism of the DeFi protocol is triggered, producing forced on-chain selling—this is a "secondary cascade" triggered by perpetual futures noise at an entirely different market layer [21]. The on-chain selling pressure produced by DeFi liquidation further depresses DEX and CEX spot prices, feeds back into the oracle and perpetual futures index prices, and completes the closed loop of positive feedback.
Each link of the transmission chain has an intermediate buffering mechanism, so that the transmission of noise is not a perfectly lossless channel. Oracles such as Chainlink have a deviation threshold (such as 0.5%) and a heartbeat interval (as long as 1 hour for some assets), triggering an on-chain update only when the price change exceeds the threshold; the health-factor buffer of lending protocols such as Aave (health factor > 1) is sufficient to absorb the impact of small price fluctuations. The "complete chain" above is therefore fully activated only in the extreme case where the speed and magnitude of the price change simultaneously break through all buffer thresholds. In qualitative terms, the noise transmission ratio in the arbitrage-transmission link is about 1:1, the oracle-aggregation link produces a decay of about 0.6 to 0.8 due to median aggregation and the deviation threshold, and the DeFi-liquidation link may produce an amplification of 1.2 to 2.0 due to the leverage effect within the protocol. In addition, the oracle link itself faces distinctive operational risk: the 2022 Mango Markets incident showed that an attacker can deliberately distort an oracle price feed by manipulating a thin-liquidity spot market, thereby triggering cascade liquidations in DeFi protocols—so the noise-transmission chain can not only be passively activated but also actively weaponized.
As the October 2025 flash crash revealed, the local liquidity exhaustion of USDe on Binance's internal order book (mechanical noise in a single market) ultimately evolved, through the cross-margin mechanism of the unified account and cross-market arbitrage transmission, into a market-wide liquidation disaster of over $19 billion [21]. This event fully demonstrated that, under today's highly interconnected microstructure, perpetual futures have become the "public noise source" of the entire crypto financial system.
This recognition has profound implications for policy and risk management. For regulators, focusing on the risk of a single market is not enough; they must examine the noise-spillover effect of the perpetual futures market from a systemic perspective. For exchanges, introducing mechanisms such as tiered liquidation, multi-source oracle aggregation, and minimum-liquidity filters is a key engineering measure for severing the noise-transmission chain. For investors, understanding the existence and transmission paths of mechanical noise helps distinguish "signal" from "noise" in extreme conditions and avoid making wrong investment decisions amid non-informational price volatility.
13.6 The ceiling-floor model
The price discovery efficiency of perpetual futures is not a static constant but a dynamic variable that fluctuates violently between a theoretical ceiling and an insurmountable floor. This section presents the "ceiling-floor model," the fifth core theoretical contribution of this chapter (CC5), as a unified analytical framework for assessing price discovery in crypto derivatives markets. The core insight of this model is that perpetual futures are not simply "more efficient" or "less efficient" than traditional markets; rather, they have entirely distinct efficiency characteristics: extremely high efficiency in normal markets, but the potential for systemic failure in extreme markets. Understanding these "distinct efficiency characteristics" is of greater theoretical and practical value than assigning a static efficiency score.
13.6.1 The ceiling
The ceiling of price discovery efficiency represents the theoretical upper bound of a market's ability to convert information into price in its optimal state. This upper bound is not determined by a single factor but is jointly shaped by three core dimensions: the number and information quality of informed traders, the rate at which information is generated, and the quality of the market microstructure.
In crypto markets, the height of the ceiling is directly related to the richness of the information environment. As on-chain analytics tools (such as Nansen, Arkham, and Dune Analytics) proliferate, the threshold for information interpretation falls sharply, enabling more participants to become informed traders. More informed traders mean more private information and on-chain observable information injected into the market, thereby raising the theoretical upper bound of price discovery. In addition, the participation of high-frequency market makers and extremely deep liquidity pools ensure that order flow can be absorbed with minimal friction, further raising the quality of the microstructure. In the venue gravity model of Section 13.3, the systematic advantages of perpetual futures across the four dimensions of leverage availability, liquidity depth, anonymity, and transaction cost are the microstructural basis for their ceiling being higher than the spot market's.
The ceiling can be summarized by the following functional relationship:
Along all three dimensions, the perpetual futures market exhibits structural advantages. The availability of leverage allows informed traders to express a stronger information signal with less capital; deep liquidity ensures that large orders do not produce excessive price impact; and 24/7 continuous trading ensures that information can be priced in instantly at any moment. Together, these features push the ceiling of perpetual futures to the highest level among all crypto trading venues.
13.6.2 The floor
Opposite the ceiling, the floor of price discovery efficiency represents the lower bound of a market's performance in its worst state. In the perpetual futures market, this floor is set by mechanical noise and is insurmountable in nature. As long as perpetual futures rely on leverage and a forced-liquidation mechanism, mechanical noise cannot fall to zero.
The depth of the floor is jointly determined by the three noise-injection pathways analyzed in Section 13.5:
Among these, liquidation-driven mechanical volatility () is the most destructive noise source. In extreme markets, these three pathways act simultaneously, injecting into prices large amounts of selling or buying pressure that contain no fundamental information at all. In today's mainstream perpetual futures design, the leverage function inherently depends on some form of forced risk-clearing mechanism, so mechanical noise is an endogenous feature that the perpetual futures market must accept. Alternative designs are exploring different trade-off paths; for example, Curve's LLAMMA soft-liquidation mechanism allows a position to smoothly transform its collateral form (gradually converting from a volatile asset into a stablecoin) as it approaches the liquidation threshold, rather than triggering hard-liquidation-style forced selling. Such designs can significantly reduce the instantaneous impact of a liquidation event on the order book, but they cannot fully eliminate mechanical noise: even the collateral-form conversion in a soft liquidation still produces observable market order flow and exerts non-informational pressure on the price. This logic reveals a profound design paradox: the very same mechanism (leverage) that gives perpetual futures the highest ceiling also sets their highest floor.
Although the floor cannot be eliminated, it can be lowered by engineering means (that is, by reducing the destructive power of mechanical noise). For example, optimizing cliff-edge liquidation into gradual liquidation or introducing a vault-takeover mechanism (see Section 11.4) can significantly reduce the impact of a single liquidation on the order book; raising the settlement frequency of the funding rate (such as from once every 8 hours to once per hour or continuous settlement; see Section 10.5) can reduce the price distortion from rate arbitrage; and optimizing the calculation logic of the mark price to reduce reliance on a single spot price source (see Chapter 14) can also lower the floor to some extent. Each optimization can lower the floor, but none can bring it to zero.
13.6.3 The state dependence of efficiency
In reality, the price discovery efficiency of perpetual futures exhibits pronounced state-dependent fluctuation between the ceiling and the floor, which can be divided into three typical phases.
In a normal market, mechanical noise is dormant, and the efficiency curve runs close to the ceiling. At this time, informed traders' information is expressed and aggregated efficiently, and perpetual futures exhibit price discovery leadership far exceeding that of the spot market. The information flow topology of Section 13.4 shows that in this state, the information share of Binance perpetual futures is usually about 30%–40%, and its perpetual and spot markets combined can exceed 50%, making it a widely recognized center of price discovery.
In a liquidation-intensive period, however, as the chain reaction of leveraged liquidations is triggered, mechanical noise surges exponentially. At this time, the efficiency curve plunges sharply, approaching the floor set by the mechanism. Price changes no longer reflect the updating of fundamental information but are driven entirely by order book depth and the selling force of the liquidation engine. In this phase, perpetual futures not only lose their price discovery efficacy but become a source of contamination that outputs mispricing signals to the entire crypto ecosystem, and the cross-market noise-transmission paths analyzed in Section 13.5 are fully activated at this moment.
In the recovery period after a crisis, the rebound of efficiency exhibits a pronounced asymmetry. The decline of efficiency usually occurs instantaneously (accompanying a liquidation cascade), but the rebound is a slow process. This is because the loss of liquidity tends to be sudden, whereas market makers reassessing risk, replenishing inventory, and restoring normal quotes take considerable time. This asymmetry is fully consistent with the liquidity-resilience feature analyzed in Section 8.5: liquidity is lost far faster than it recovers. From the perspective of behavioral finance, the asymmetry of recovery stems not only from the mechanical process of market makers replenishing inventory but also from the pervasive loss of trust after a crisis. The core finding of prospect theory shows that the degree of persistent risk aversion after experiencing a loss systematically exceeds what rational Bayesian updating would predict, and trust, as a psychological variable, naturally recovers more slowly than balance-sheet variables such as inventory. This means that the actual efficiency-recovery time may be significantly longer than the prediction given by a pure microstructure model based on inventory-adjustment logic. In practice, this means that just after a liquidation crisis subsides, market participants cannot assume that price discovery efficiency has recovered immediately; they must wait for microstructure indicators such as the bid-ask spread and order book depth to improve substantively before trusting the perpetual price as an accurate reflection of fundamentals.
Figure 13-26 visualizes the ceiling-floor model, marking the moments in four historical crises when efficiency plunged from the ceiling to the floor.
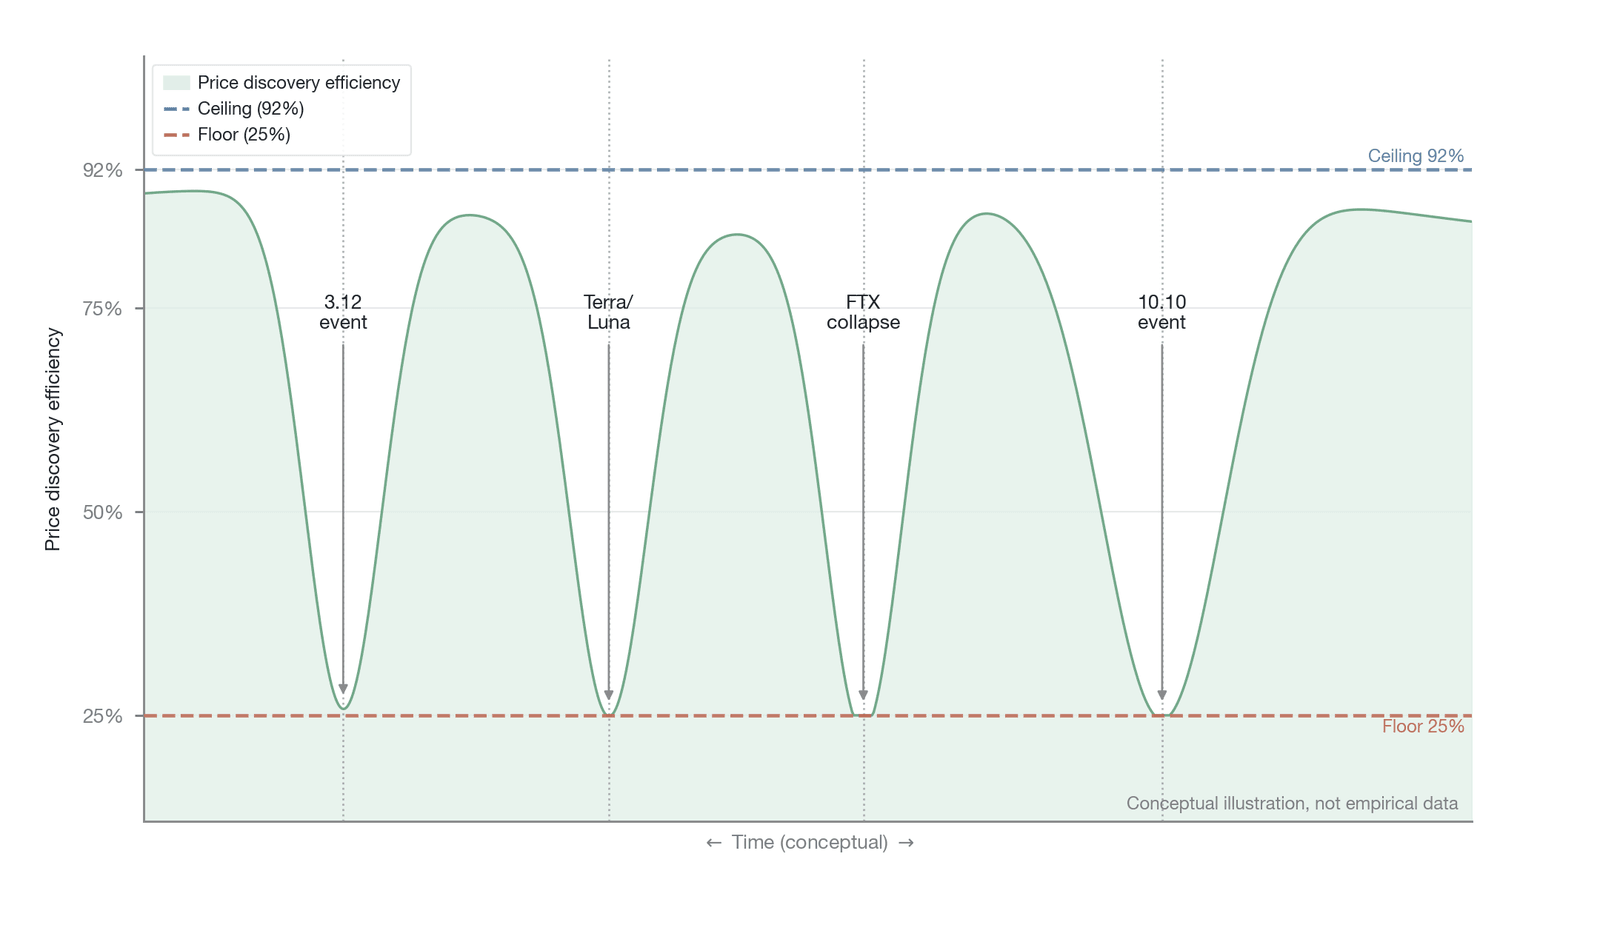
Figure 13-26. The ceiling-floor model of perpetual futures price discovery efficiency (conceptual illustration, not empirical data)
Figure 13-26 shows that the price discovery efficiency of perpetual futures runs close to the ceiling in normal markets, plunges to near the floor in a liquidation crisis, and exhibits an asymmetric recovery characteristic of "fast decline, slow rebound." The four historical crisis events marked in the figure clearly show the moments of efficiency plunge.
13.6.4 How to raise the ceiling and lower the floor
Having understood the determinants of the ceiling and the floor, market designers face two relatively independent engineering problems: raising the ceiling and lowering the floor (Table 13-6). These two directions can and should be pursued simultaneously, because they determine, respectively, the market's competitiveness in good times and its resilience in bad times.
The path to raising the ceiling focuses mainly on optimizing the information environment and market structure. This is a question of "how to make signals clearer and transmission faster." Specific paths include developing more advanced on-chain data-parsing tools to reduce information asymmetry (such as the application of AI agents in information processing discussed in Section 4.5); introducing high-frequency arbitrage algorithms to accelerate cross-market information transmission and reduce the transmission-stage friction analyzed in Section 13.4; attracting informed traders and high-quality market makers through a more reasonable fee structure (such as a maker rebate mechanism); and building deeper liquidity pools so that large information-driven trades can be absorbed by the market at a lower impact cost.
The path to lowering the floor is entirely a matter of protocol mechanism design. This is an engineering challenge of "how to minimize mechanical noise while retaining the leverage function." Beyond the gradual liquidation and high-frequency funding settlement mentioned earlier, optimizing the auto-deleveraging trigger logic to reduce improper interference with the profitable side, expanding the buffering capacity of the insurance fund to absorb liquidation impacts, and implementing a more refined cross-asset margin-assessment model to avoid the "weakest-link" effect of unified margin are all effective means of preventing efficiency from completely collapsing under extreme conditions.
| Engineering direction | Core question | Key pathways | Related sections |
|---|---|---|---|
| Raise the ceiling | How to make signals clearer and transmission faster | Proliferation of on-chain analytics tools, AI-agent information processing, market-maker incentive optimization, reduction of cross-market arbitrage friction | 4.5, 13.3, 13.4 |
| Lower the floor | How to minimize mechanical noise while retaining leverage | Gradual liquidation, high-frequency funding settlement, mark price optimization, improved ADL logic, insurance fund expansion | 10.5, 11.4, 14 |
Table 13-6. Engineering pathways for raising the price discovery ceiling and lowering the floor (Data source: compiled by the author)
13.6.5 A comparison of three markets
Applying the ceiling-floor model to different market types clearly reveals their essential differences in price discovery (Table 13-7).
| Market type | Ceiling | Floor | Range width | Efficiency profile |
|---|---|---|---|---|
| Traditional futures (e.g., CME) | Medium-high: mature information environment; since CME BTC futures launched in 2017, they have traded nearly 23 hours on weekdays (Sunday to Friday, 17:00–16:00 CT, including a 1-hour break), but still cannot trade on weekends and holidays; institutional participation increased markedly after the 2024 spot ETF approval | Low: liquidation cascades are tightly constrained by the periodic "leverage reset" at expiry, the central counterparty default waterfall, and price limits and circuit breakers | Narrow | Relatively stable efficiency; "not the best, but never too bad" |
| Crypto spot (e.g., Coinbase) | Medium: good information environment and 24/7 trading, but the lack of leverage limits informed traders' "expressive power" | Extremely low: no forced-liquidation mechanism, almost no mechanical noise | Medium | "No mechanical noise, but insufficient information expression" |
| Perpetual futures (e.g., Binance) | Highest: high leverage + deep liquidity + low barriers + 24/7, the fullest expression of informed trading | Highest: liquidation cascades + rate distortion + mark price delay, the largest mechanical noise | Widest | "Best at its best, worst at its worst, most volatile" |
Table 13-7. Comparison of three market types under the ceiling-floor model of price discovery (Data source: compiled by the author)
The ceiling of traditional futures, although benefiting from a mature information environment and the depth of institutional participants (especially after the approval of the spot Bitcoin ETF in January 2024, which significantly raised CME's institutional trading volume and information share), is still limited by trading interruptions on weekends and holidays (CME BTC futures trade on weekdays from Sunday to Friday, 17:00–16:00 CT, nearly 23 hours, not around the clock without interruption). Its floor is effectively constrained jointly by the central counterparty's risk-management system, the "periodic leverage reset" at expiry, and price limits and circuit breakers. Price limits and circuit breakers are institutional buffers unique to traditional futures markets: when a price change reaches a preset threshold, trading is forcibly suspended or restricted within a certain band, thereby providing market participants a window to reassess information and replenish liquidity, and effectively interrupting the positive feedback loop of panic selling. By contrast, crypto perpetual futures, while trading 24/7 without interruption, completely lack such circuit-breaker mechanisms—precisely one important institutional reason their floor is higher than that of traditional futures. For this reason, the efficiency-fluctuation range of traditional futures is relatively narrow, exhibiting a stable but non-optimal character.
The ceiling of crypto spot is limited by the lack of leverage; informed traders can only express their views at 1:1 capital efficiency, which within the Kyle model framework implies a lower intensity of information expression. But its floor is nearly zero, because without a forced-liquidation mechanism there is no mechanical noise. The efficiency profile of crypto spot is "stable but insufficient."
The ceiling of perpetual futures is the highest, because the four-dimensional gravity of leverage, liquidity, anonymity, and low cost (Section 13.3) makes informed traders' information expression the fullest. But its floor is also the highest, because liquidation cascades, rate distortion, and mark-price delay (Section 13.5) constitute the strongest source of mechanical noise. This combination of "highest ceiling + highest floor + widest range" means that perpetual futures are a widely recognized price discovery leader in normal markets but may exhibit the most severe price distortion in extreme markets.
Perpetual futures are not "more efficient" or "less efficient" than traditional markets—they are "more efficient in normal markets, possibly less efficient in extreme markets, with a range of efficiency fluctuation far greater than that of traditional markets." This is a "distinct efficiency profile," not a simple "better" or "worse."
Figure 13-27 uses a bar chart to compare the ceiling height, floor depth, and efficiency-range width of the three markets: traditional futures, crypto spot, and perpetual futures.
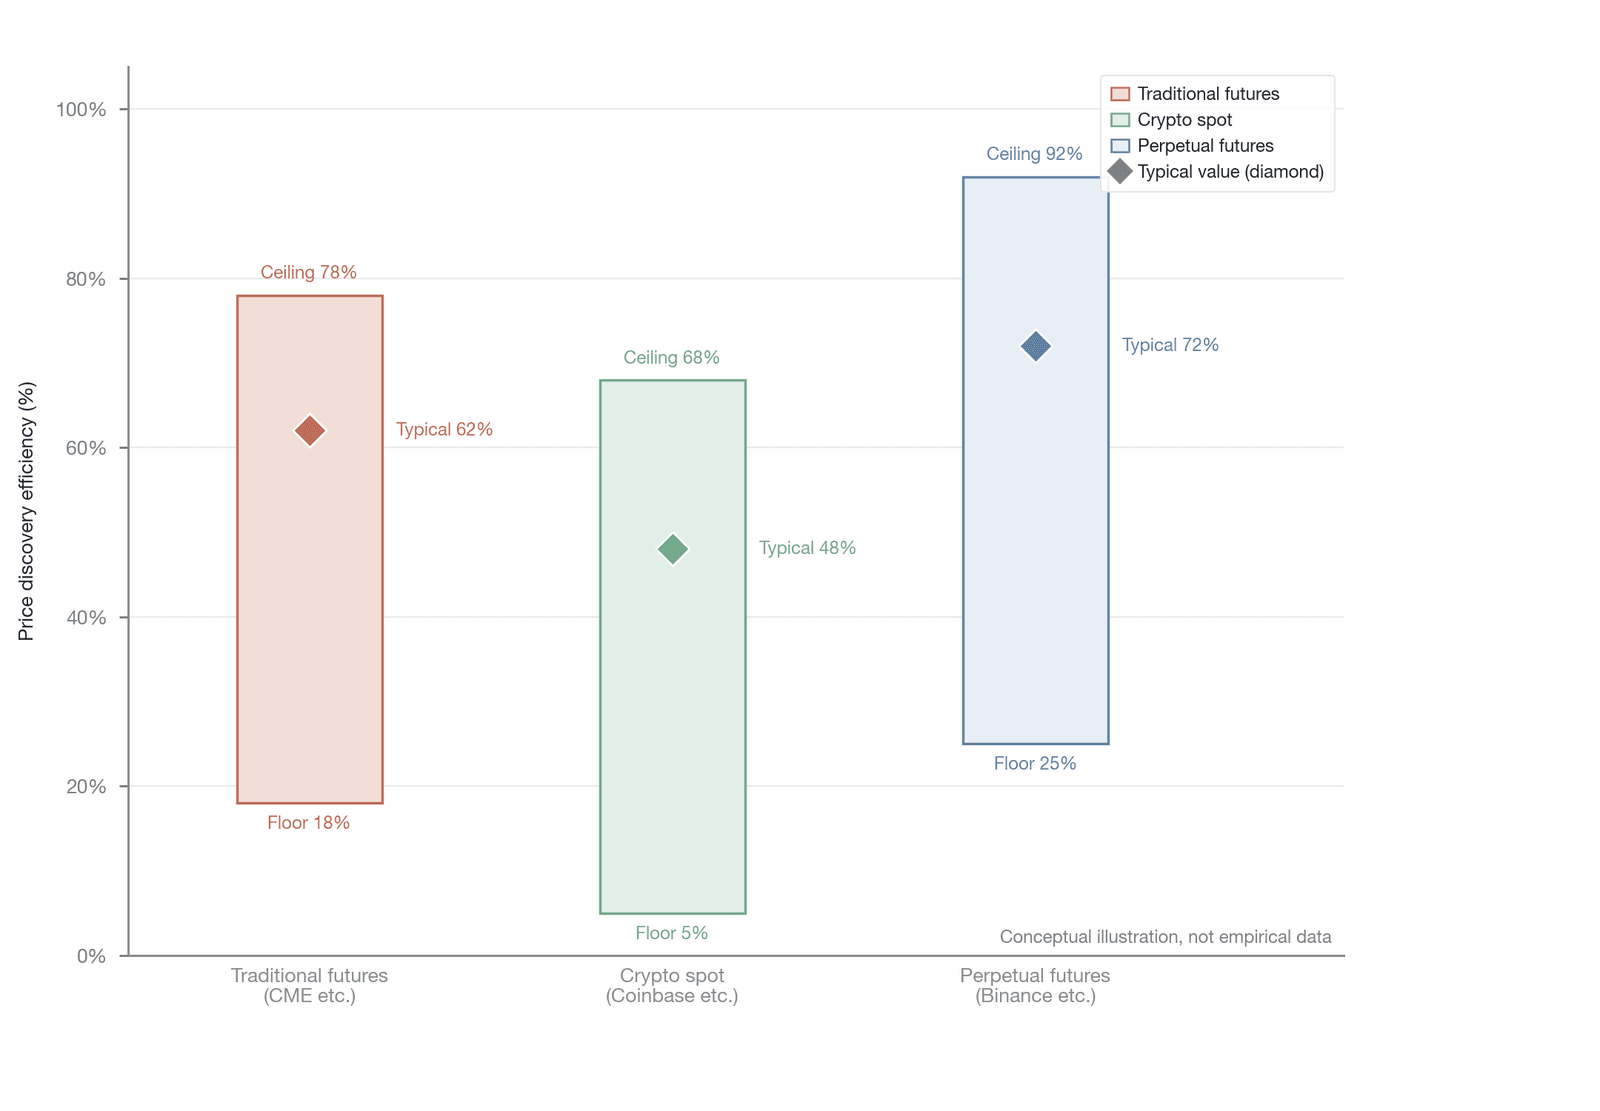
Figure 13-27. Ceiling-floor comparison of traditional futures, crypto spot, and perpetual futures (conceptual illustration, not empirical data; value conventions consistent with Figures 13-26 and 13-38)
The comparison in Figure 13-27 vividly confirms the markedly different efficiency profiles of the three markets. The distance between the ceiling and floor of traditional futures is the narrowest, reflecting how their mature institutional constraints (price limits, central counterparty clearing, periodic expiry) lock efficiency fluctuation into a small range—at the cost of a ceiling that is not as high as that of perpetual futures. The floor of crypto spot nearly touches the zero line (because there is no forced-liquidation mechanism), but its ceiling is also clearly lower, because the lack of leverage limits informed traders' capacity for information expression. The visual image of perpetual futures is the most striking: the ceiling is the highest and the floor is also the highest, and the range between them is the widest of the three. This graphical comparison captures the core paradox of price discovery in perpetual futures—the same mechanism (leverage) both pushes the ceiling to the highest and raises the floor to the highest.
13.7 Obstacles to price discovery
After analyzing the three injection pathways of mechanical noise in Section 13.5, this section broadens the view to the wider obstacles to price discovery. Four forces—the reflexivity of liquidation cascades, the signal pollution of market manipulation, the amplification effect of behavioral biases, and the transmission delay of information friction—appear simultaneously and reinforce one another under extreme conditions, leading to a systemic failure of price discovery. If the ceiling-floor model of Section 13.6 describes the "boundaries" of efficiency, this section dissects the specific "forces" that push efficiency toward the floor.
13.7.1 Liquidation cascades and price overshoot
The liquidation cascade is the most destructive microstructure phenomenon in crypto derivatives markets. It is not merely a risk-clearing process but a classic reflexive feedback loop that can drive prices far from fundamentals and produce enormous overshoot.
The basic mechanism of this feedback loop has already been defined in Section 13.5.1: an initial downward shock triggers forced liquidations, the liquidation sell orders depress the price, and this in turn triggers the liquidation of still deeper positions. The reflexivity perspective of Section 13.7.1 further highlights the amplifying role of market-maker behavior in this loop: facing concentrated non-informational selling pressure, market makers, to avoid adverse-selection risk and inventory risk, usually choose to withdraw orders or widen the bid-ask spread sharply, causing the buy-side depth of the order book to plunge; a new wave of liquidation sell orders is then executed against an even thinner order book, producing a more severe price impact than the previous round, until the leverage is fully cleared or external intervention occurs.
Figure 13-28 presents, as a flowchart, the positive feedback loop mechanism of the liquidation cascade and its amplification path.
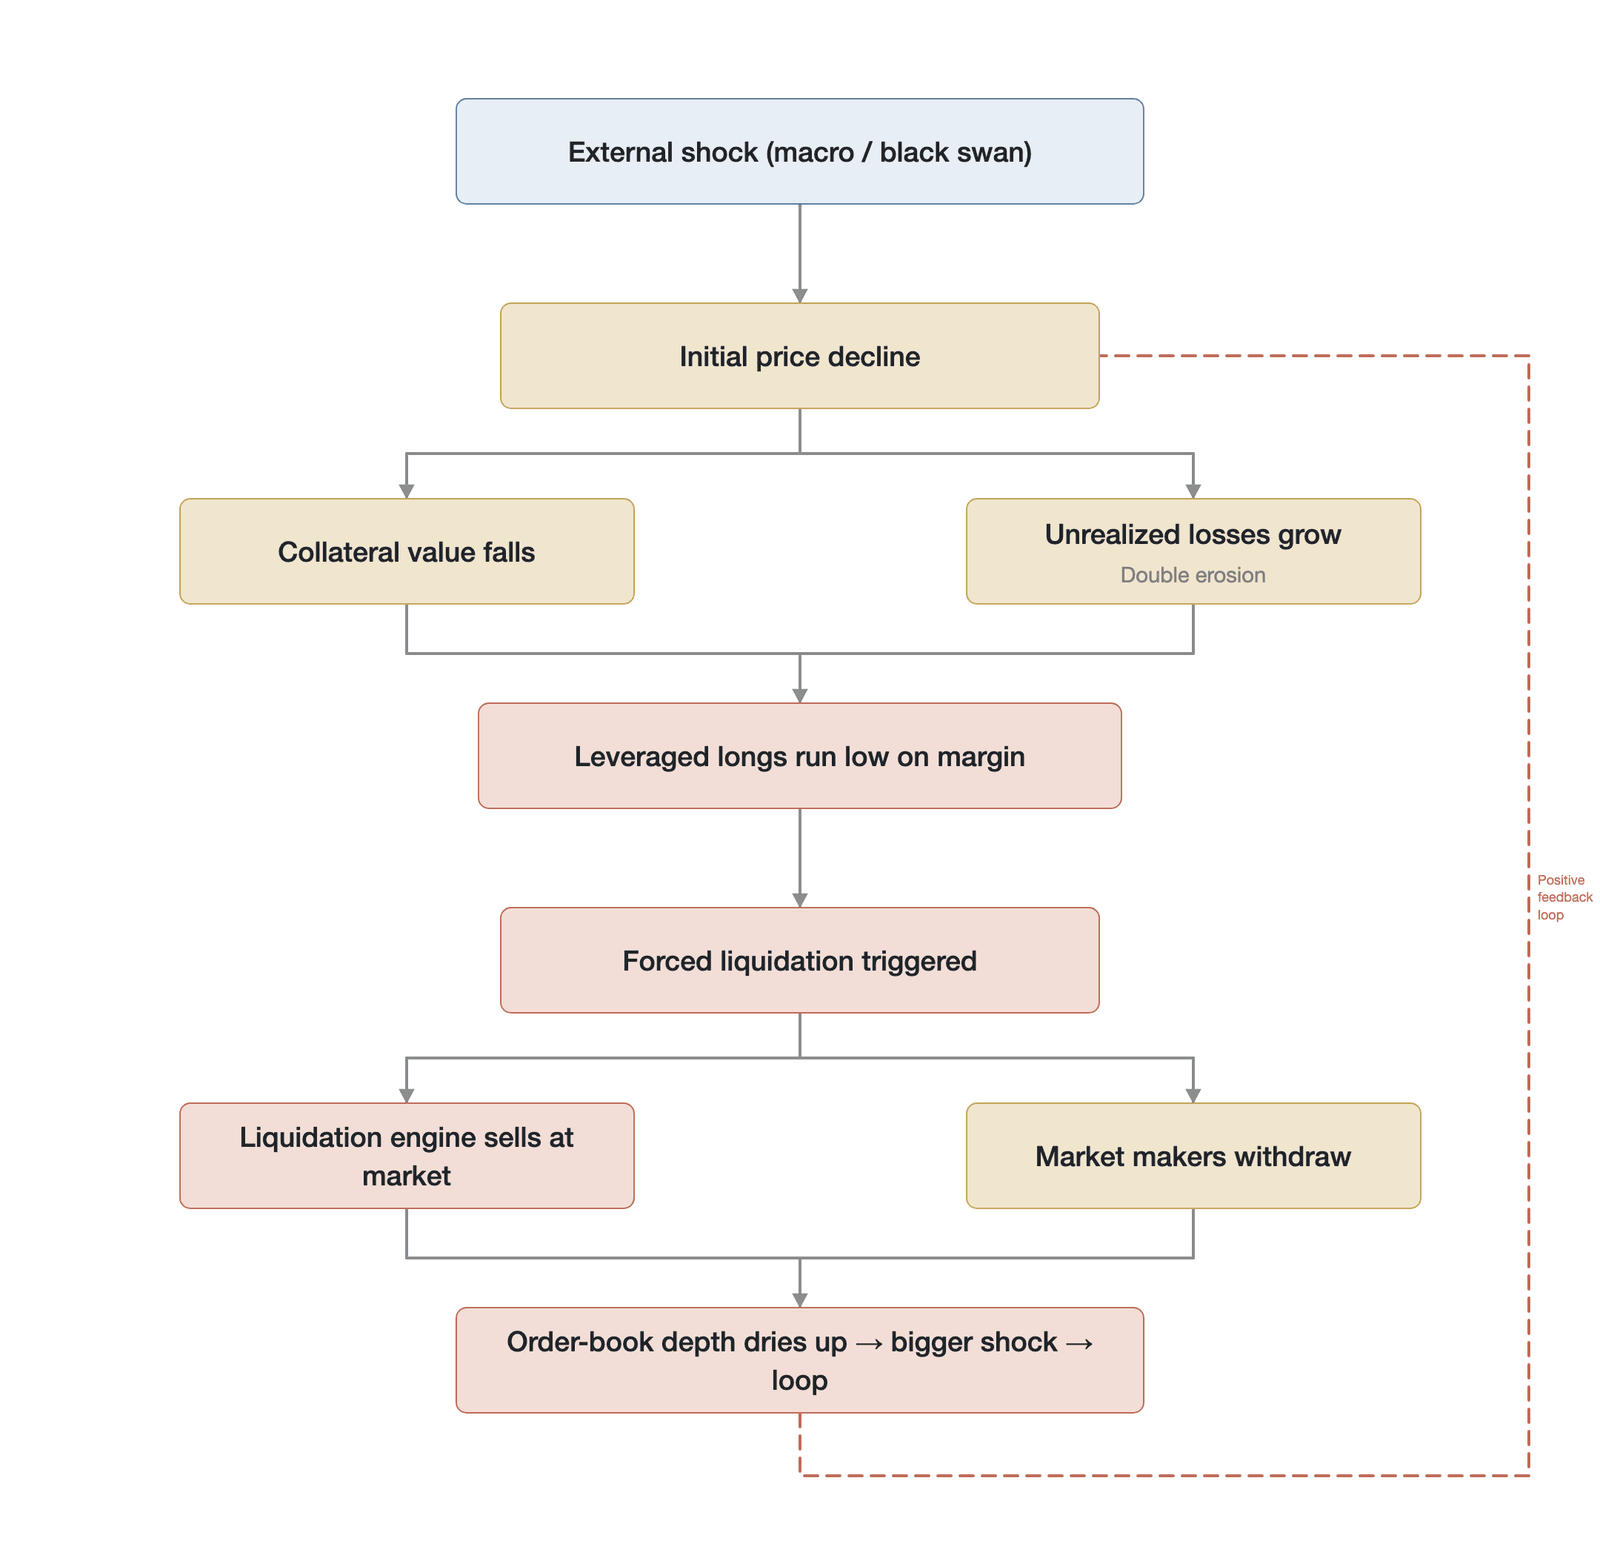
Figure 13-28. The reflexive positive feedback loop of a liquidation cascade
Figure 13-28 shows the complete positive feedback chain from external shock, double erosion, insufficient margin, forced liquidation, and market-maker withdrawal to the exhaustion of order book depth, as well as the superimposed amplification of this loop by panic contagion.
Two important amplification mechanisms are also nested within the liquidation cascade. The double-erosion effect is one key link: under the unified-margin model, a price decline not only increases unrealized losses but also simultaneously depreciates the crypto asset serving as collateral, accelerating the depletion of the margin balance from two directions at once. FTI Consulting noted in its 2025 report that unified margin is "highly efficient in calm markets" but that "under stress, the same design ties the portfolio to its weakest asset" [26]. On this basis, panic contagion further amplifies the crisis: liquidation data (such as "$X hundred million liquidated in the past hour") spread rapidly through social media, triggering panic selling by retail investors, and this sentiment-driven selling pressure superimposes on the mechanical selling pressure, further intensifying the liquidity crisis.
From a historical-data standpoint, the scale and destructive power of liquidation cascades exhibit an alarming escalating trend. Table 13-8 summarizes the key parameters of four landmark liquidation events in crypto markets:
| Event | Date | 24h liquidations (approx.) | BTC max drawdown (approx.) | Core trigger | Key structural feature |
|---|---|---|---|---|---|
| March 12 event | March 2020 | $1 billion | ~50% | COVID panic + BitMEX structural flaw | Single-exchange dominance, order book depth to zero |
| Terra/Luna | May 2022 | $2 billion | ~22% | Algorithmic stablecoin depegging | Cross-protocol contagion, compounded by DeFi liquidations |
| FTX bankruptcy | November 2022 | $2.8 billion | ~25% | Exchange solvency crisis + fraud | Trust crisis, withdrawal run |
| October 10 event | October 2025 | Over $19 billion | ~14.5% (spot; perpetuals ~16%–17%) | Macro shock + unified-margin risk | ADL mechanism, USDe depegging, infrastructure freeze |
Table 13-8. Comparison of key parameters across four landmark liquidation events in crypto markets (Data source: compiled by the author, based on public market data)
Figure 13-29 uses a bar chart and a line chart to compare the 24-hour visible liquidation notional and the BTC maximum drawdown across four events: the March 12, 2020 event, the Terra/Luna collapse of 2022, the FTX bankruptcy of 2022, and the October 10, 2025 event.
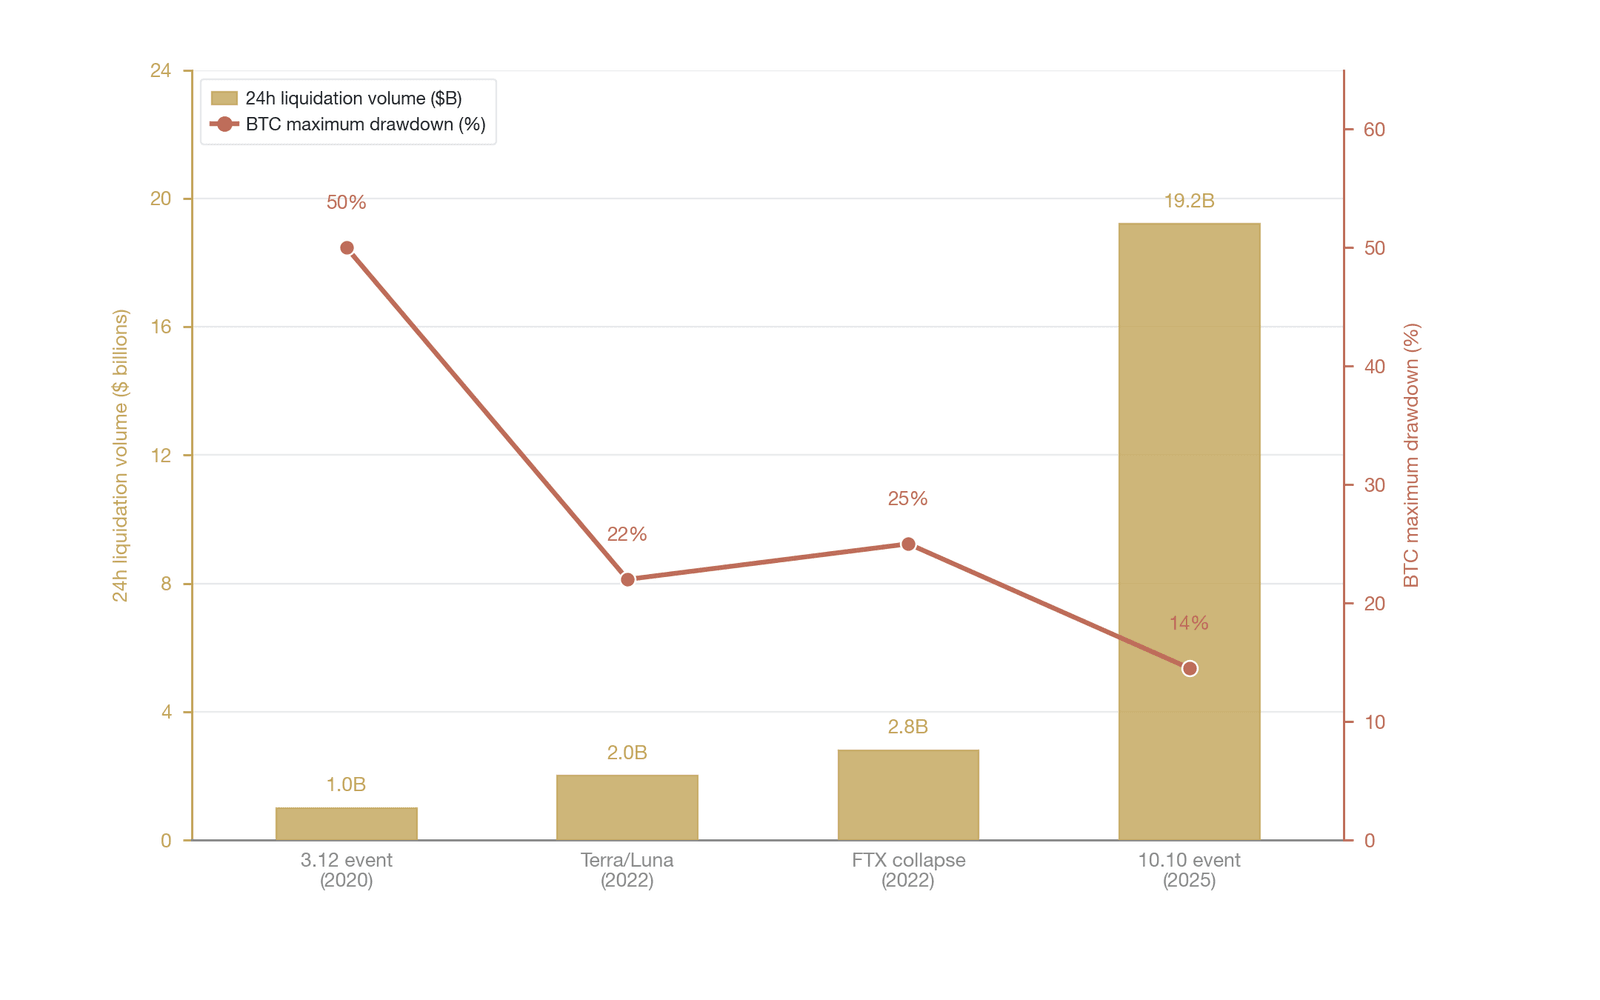
Figure 13-29. Comparison of the scale and impact of four major liquidation cascade events (Data source: [27][26])
Figure 13-29 shows that from the March 12 event of 2020 to the October 10 event of 2025, the 24-hour visible liquidation notional grew about 19-fold; at the same time, the BTC maximum drawdown on the whole did not rise but fell—the accumulation of tail risk is reflected mainly in the sharp swelling of liquidation scale rather than in a widening of the price decline.
Whether the 19-fold growth in visible liquidation notional is linearly related to the growth of the market's total open interest (OI) deserves closer examination. From 2020 to 2025, the total OI of the crypto derivatives market grew from under $10 billion to on the order of $100 billion, an increase of about 10-fold, while over the same period the visible liquidation notional grew nearly 19-fold, meaning that the liquidation risk per unit of OI is rising rather than falling. Behind this superlinear trend is the systematic climb in the ratio of the market's total leverage to market capitalization: the proliferation of the unified-margin model allows the same principal to leverage a larger notional exposure, and cross-asset margin sharing further amplifies the effective leverage level. As the scale of perpetual futures continues to expand, a key question emerges: can the risk-absorption capacity of exchange insurance funds and ADL mechanisms keep pace with this superlinear growth? The scale of insurance funds grows mainly through the linear accumulation of liquidation surplus, whereas the tail risk they must bear swells at a nonlinear rate, which suggests the possible existence of a critical threshold: beyond it, existing risk-mitigation mechanisms will be unable to absorb liquidation shocks effectively, and the intensity of systemic crises will jump up in a step change.
In the March 12 event of 2020, the order book structure of BitMEX collapsed completely. According to Multicoin Capital's microstructure autopsy, only about $20 million of buy orders remained on the BitMEX order book at the time, yet they had to absorb over $200 million of long-liquidation selling pressure [27]. The Bitcoin price broke below $4,000 within minutes, and this price level reflected not fundamental information but purely the product of a market-structure failure. BitMEX's structural flaw lay in its accepting only BTC as margin collateral, which meant that all long positions naturally bore the double-erosion effect. Had BitMEX not briefly gone offline for "system maintenance," interrupting the operation of the liquidation engine, the price would very likely have reached levels far below fundamentals.
By the October 10 event of 2025, the visible liquidation notional reached an unprecedented height. According to preliminary estimates from multiple parties, over $19 billion of leveraged crypto positions were forcibly liquidated in about a day, roughly 19 times the March 12 event (Greco [21] and FTI Consulting [26] gave similar estimates based on different methodologies, but because exchanges use inconsistent liquidation-data disclosure standards, this figure should be regarded as an order-of-magnitude estimate rather than a precise statistic). The BTC price plunged during the event from an intraday high of about $122,500 to about $104,800 in spot (a maximum drawdown of about 14.5%; perpetual futures, due to depth exhaustion, wicked lower at some venues, to about $102,000), then partially rebounded to about $113,000 within hours, but full recovery to pre-event levels took several weeks. This event introduced several new structural risk dimensions. The unified-margin system tied the fate of a portfolio to its weakest-performing asset; exchange interfaces froze due to the surge in traffic, so that traders could not add margin or manage risk; and the auto-deleveraging mechanism forcibly closed counterparties' profitable positions, instantly turning a perfectly hedged portfolio into a naked exposure. As FTI Consulting noted, the ADL mechanism essentially introduces "rule risk": a trader's strategy may be logically flawless, but at the most critical moment the exchange's survival rules do not allow that strategy to persist [26].
In these extreme events, the imbalance of the order book reached a pronounced degree. FTI Consulting's report shows that on the day of the October 10 event, the top-of-book depth for BTC shrank by more than 90%, and the bid-ask spread widened from single-digit basis points to double-digit percentages [26]. The symmetrically distributed bid and ask depth of a normal market became extremely asymmetric during the crisis: buy-side depth nearly vanished, while the sell side piled up with vast liquidation sell orders and panic selling. At this point, the "information machine" of the aggregation stage defined in Section 13.2 was already paralyzed: the order book no longer aggregated information but merely mechanically processed the liquidation engine's selling instructions. The typical behavior pattern of market makers in extreme conditions can be summarized as "retreat first, assess later": when volatility surges and liquidation selling pressure pours in in concentration, a market maker's optimal strategy is to immediately withdraw all quotes to avoid inventory risk, rather than attempting to keep providing liquidity amid the chaos. This collective withdrawal is a rational individual decision, yet it leads to a catastrophic collective outcome: the order book loses its liquidity supply at precisely the moment liquidity is most needed. After the crisis subsides, the market makers' return process follows an entirely different dynamic. The typical indicators by which market makers assess a "safe" return include a retreat in realized volatility (usually needing to fall below one-third of the crisis peak), a significant decline in liquidation volume (indicating that the leverage clearing is essentially complete), and a stabilization of OI (indicating that the risk of a new round of passive liquidation has fallen sharply). As these conditions are gradually met, market makers rebuild positions tentatively, starting from extremely wide quotes with small orders. The speed of spread narrowing is therefore far slower than that of its widening—this "minute-scale evaporation, day-scale recovery" temporal asymmetry and its behavioral-finance roots were developed in Section 13.6.3.
The damage of the liquidation cascade to price discovery is ultimately reflected in the distortion of the order book's microstructure. Figure 13-30 uses depth snapshots to compare the bid and ask distribution of BTC-USDT perpetual futures in a normal market versus at the peak of a liquidation crisis.
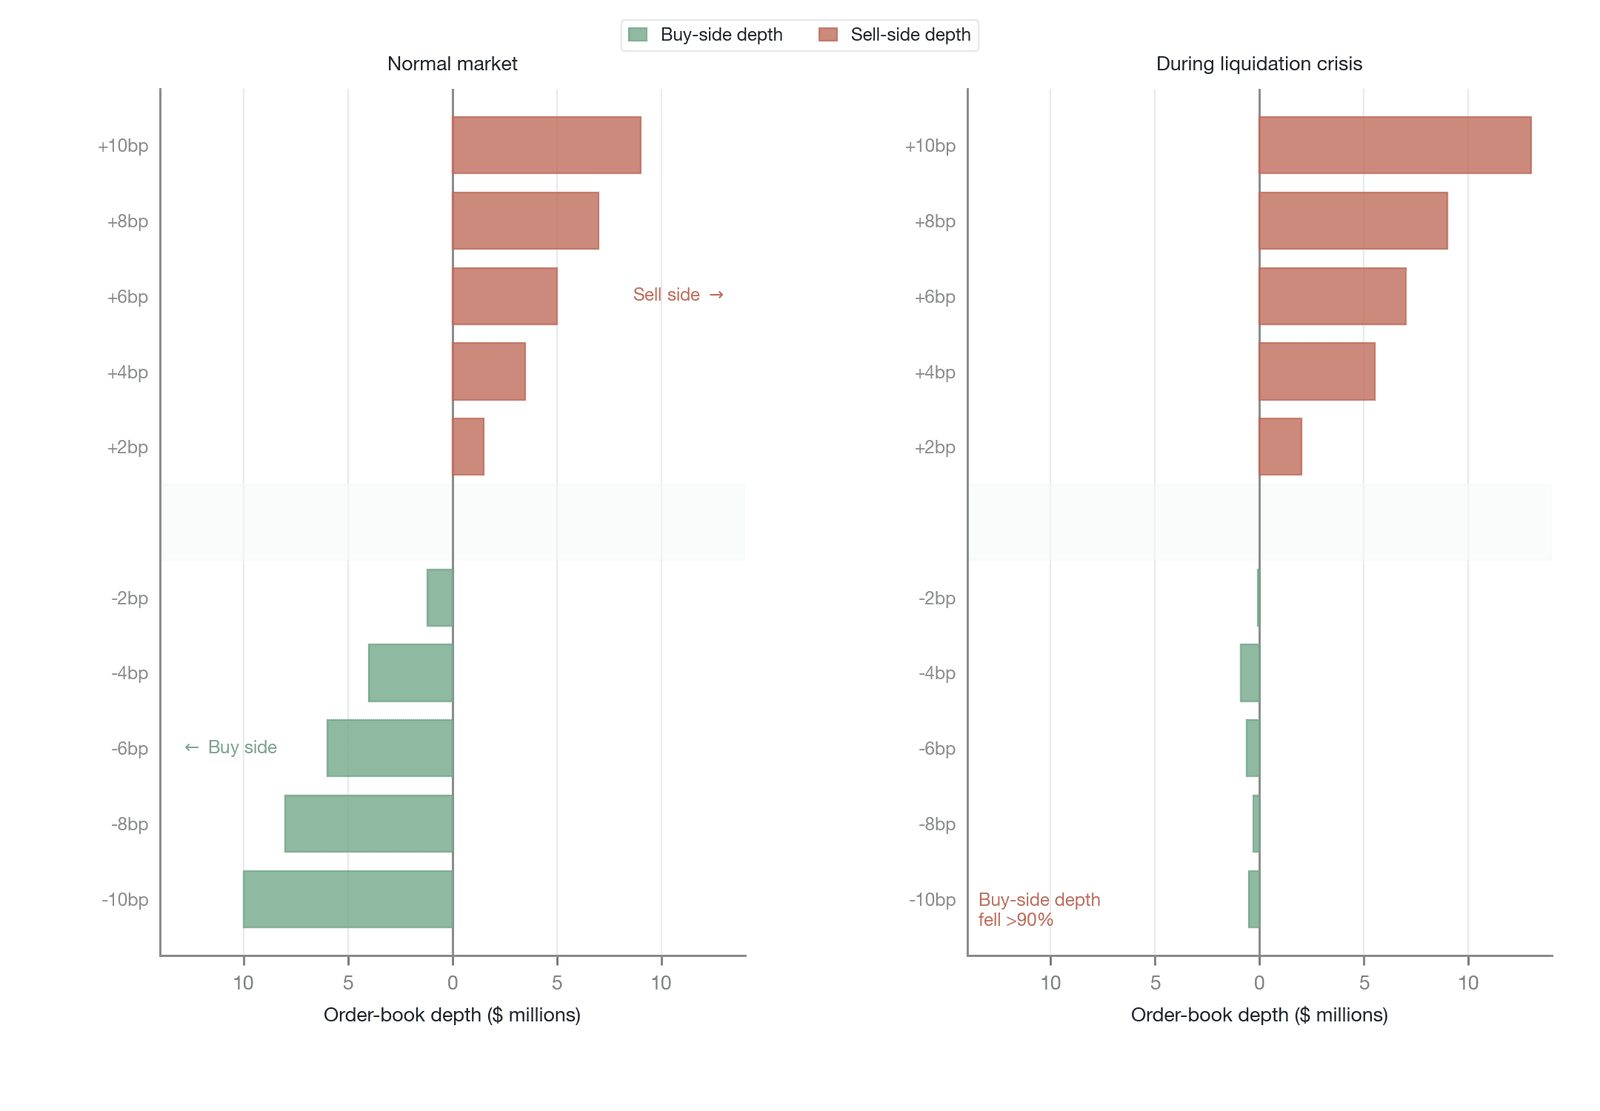
Figure 13-30. Order book structure comparison between normal markets and a liquidation crisis (Data source: [26]; level-by-level depth is a representative reconstruction of FTI's "top-of-book depth reduced by more than 90%" conclusion)
The comparison in Figure 13-30 reveals a shocking microstructural fact. In a normal market, the two sides of the order book exhibit an approximately symmetric depth distribution, with the bid and ask sides each maintaining tens of millions of dollars of orders near the mid-price. At the peak of a liquidation crisis, however, this symmetry is completely shattered: buy-side depth shrinks by more than 90%, leaving only a few tentative low-price orders scattered far from the mid-price, while the sell side piles up with large orders forcibly issued by the liquidation engine and small-to-medium orders from retail panic selling, forming an extremely asymmetric structure of "a mountain of sell orders and paper-thin buy orders." In this order book form, every new liquidation sell order causes an unusually large price impact, because it essentially faces a vacuum with almost no absorptive capacity.
In discussing liquidation cascades, one must also elevate the degradation of exchange infrastructure from an "incidental malfunction" to a systemic operational-risk factor deserving scrutiny. The exchange-interface freezes, API-latency spikes, and withdrawal suspensions that appeared during the October 10 event were not isolated technical accidents but the systemic result of exchanges' capacity planning long prioritizing average load over extreme load. An exchange's infrastructure-investment decision is essentially an economic trade-off: over-provisioning servers and bandwidth to handle extreme peaks means bearing high idle costs during the vast majority of normal trading hours, so exchanges generally tend to plan capacity at some multiple of average traffic rather than at extreme peaks. Yet a deep incentive misalignment exists in this decision: exchanges directly earn liquidation fees from the liquidation process (usually a certain proportion of the position's notional value), and when their infrastructure degrades during extreme volatility, users lose the ability to add margin or actively reduce positions at precisely the moment they most need to manage risk, and thus passively slide toward liquidation. In other words, a structural conflict of interest exists between the losses an exchange bears from infrastructure failure (reputational risk and user attrition) and the revenue it earns from users' unavoidable liquidations. This operational risk directly affects the setting of the "floor" in the ceiling-floor model of Section 13.6: infrastructure degradation itself becomes an independent force pushing price discovery efficiency toward the floor, and its destructive power is especially pronounced when superimposed on a liquidation cascade.
13.7.2 Wash trading and spoofing
If the liquidation cascade is a mechanism-level destruction of price discovery, then market manipulation is a direct pollution of the price discovery signal. In a microstructure where order flow serves as the primary information carrier (see Section 7.6 and Chapter 8), wash trading and spoofing seriously interfere with the judgments of market makers and informed traders, fundamentally weakening the signal-extraction capacity of the aggregation stage.
Wash trading refers to a single entity acting simultaneously as both buyer and seller, artificially manufacturing a false impression of trading volume and liquidity. This behavior not only misleads investors' assessment of an asset's activity level but also directly undermines the validity of microstructure metrics such as order flow imbalance: if a considerable proportion of trading volume is self-generated, then volume-based information signals are severely diluted. Regarding the proportion of wash trading in crypto markets, different research institutions have given vastly different estimates based on different methodologies:
Figure 13-31 summarizes the estimates of the wash trading proportion in crypto markets from different research institutions.
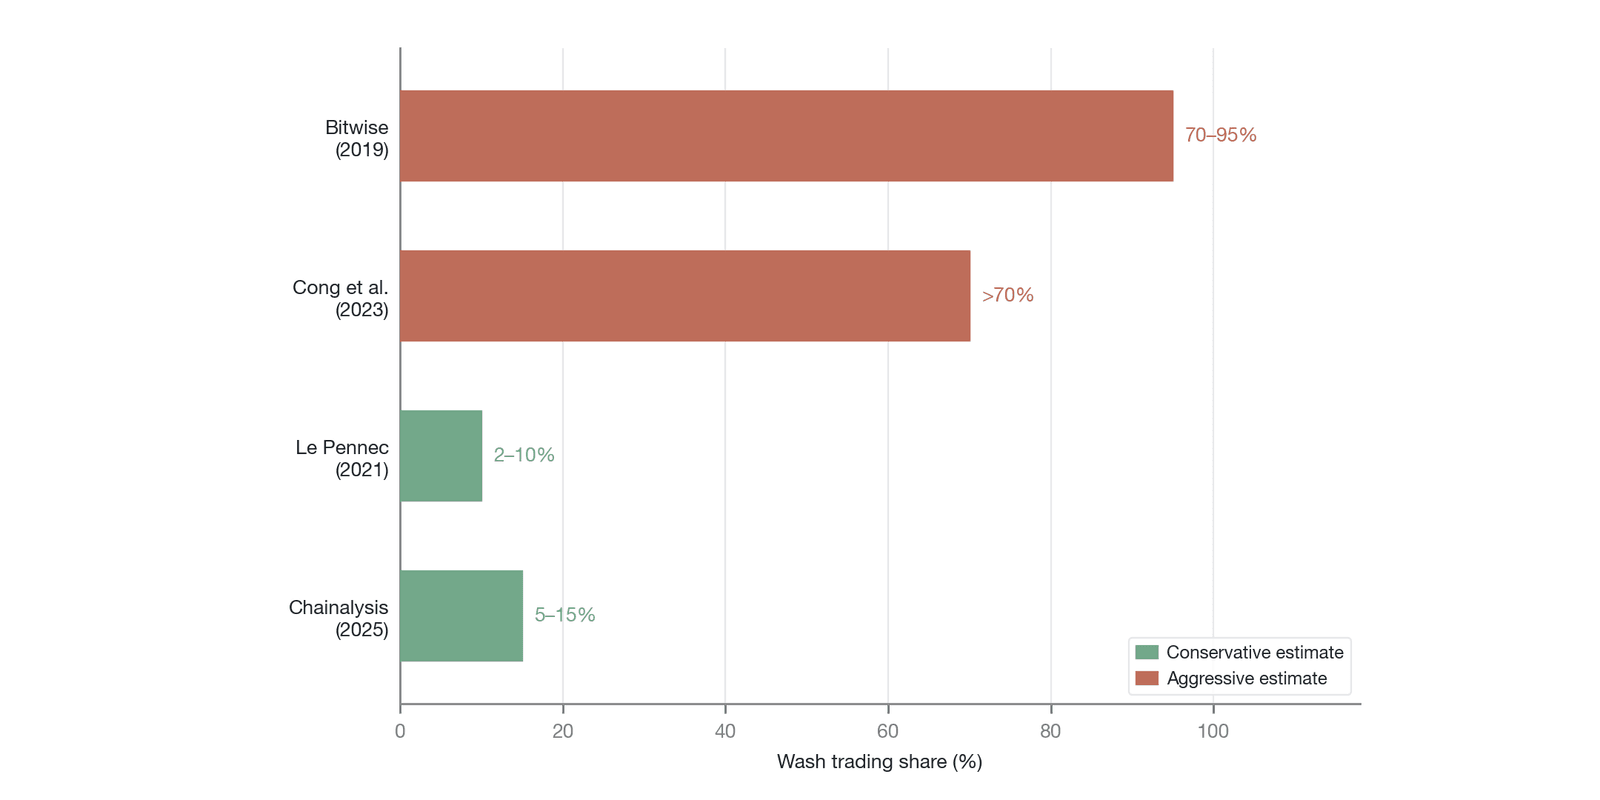
Figure 13-31. Estimates of the wash trading proportion in crypto markets across different studies (Data source: [28][29][30][31]; the conservative ranges of Chainalysis 5%–15% and Le Pennec 2.1%–10% are compiled by the author and pending verification)
Figure 13-31 shows that, owing to differences in detection methods and sampled exchanges, the estimates of the wash trading proportion given by various research institutions range from 2% to 95%, and this vast range itself illustrates the complexity of the problem. Even using the most conservative estimate of 2% to 10%, the pollution of the price discovery aggregation stage by wash trading cannot be ignored, because it systematically dilutes the signal strength of order flow information metrics such as OFI, biasing market makers' judgment of adverse-selection risk. As on-chain DEX trading becomes more transparent and regulatory technology advances, the detectability of wash trading keeps improving, but in the closed environment of CEXs this problem will persist for a long time.
In its 2019 report submitted to the SEC, Bitwise, based on trading-volume-pattern analysis, noted that as much as 95% of the Bitcoin trading volume on unregulated exchanges was fabricated [28]. Cong and colleagues (2023), in research published in Management Science, used statistical detection and Benford's law to estimate that the wash trading proportion at secondary exchanges exceeds 70% [29]. Le Pennec and colleagues (2021), through a refined on-chain detection method, gave a lower estimate of 2.1% to 10% [30]. Chainalysis and other institutions based on on-chain tracing gave a relatively conservative estimate of 5% to 15% [31]. The difference in estimates itself illustrates the complexity of the problem and the difficulty of measurement, but even using the most conservative data, the pollution of the price discovery aggregation stage by such false signals cannot be ignored.
Spoofing, by contrast, involves a manipulator posting large limit orders deep in the order book to manufacture false supply-and-demand pressure, inducing other algorithms or traders to trade in the direction the manipulator wants, and then rapidly canceling the orders before they fill. This strategy directly attacks the market maker's "learning mechanism": market makers infer adverse-selection risk from order book depth and order-flow patterns (see Chapter 8), and spoof orders cause this inference to deviate systematically from the true state, leading market makers to provide quotes that deviate from true value. In traditional financial markets, spoofing has been explicitly designated as illegal by the Dodd-Frank Act, but in crypto markets the monitoring and punishment mechanisms have long been relatively weak. This picture, however, is undergoing a substantive shift. The U.S. Commodity Futures Trading Commission (CFTC) has in recent years brought multiple enforcement actions against crypto market manipulation, covering a variety of violations including wash trading, spoofing, and market manipulation. A landmark but repeatedly reversed case is the Mango Markets manipulation case: Eisenberg, by manipulating the price of MNGO on the Mango Markets platform in October 2022, extracted over $110 million from the protocol and was convicted by a jury in April 2024; but in May 2025, the U.S. District Court for the Southern District of New York vacated all criminal convictions under Rule 29 of the Federal Rules of Criminal Procedure on grounds of improper venue and insufficient elements of wire fraud, the prosecution has filed an appeal, and its final legal characterization remains uncertain as of this writing. This reversal itself reveals precisely the legal uncertainty of criminally prosecuting on-chain manipulation on questions of venue and the elements of fraud. At the same time, the CFTC's assertion of jurisdiction over perpetual futures is moving from theory to practice, and in several enforcement actions it has treated perpetual futures as "swaps" within its regulatory purview. Even so, cross-jurisdictional enforcement coordination still faces major challenges, manipulation by offshore exchanges remains difficult to reach at the level of actual enforcement, and the interference of spoofing with price discovery will remain a persistent problem for a considerable period.
13.7.3 Behavioral biases and narrative-driven trading
Price discovery in crypto markets is subject not only to mechanism defects and deliberate manipulation but also deeply to investor behavioral biases. Owing to the lack of a traditional valuation anchor (such as discounted cash flow or a price-to-earnings ratio), the prices of crypto assets are highly susceptible to being driven by sentiment and narrative, which in the three-stage model of Section 13.2 acts mainly on the expression stage, where large amounts of non-informational, sentiment-driven orders pour into the market and swamp the signals of informed traders.
A 2024 survey by Kraken of 1,248 crypto asset holders revealed pronounced behavioral characteristics: as many as 84% of respondents admitted to having made investment decisions driven by "fear of missing out" (FOMO), and 81% had traded out of "fear, uncertainty, and doubt" (FUD) [32]. This highly emotional herd behavior injects a large amount of non-fundamental noise in the expression stage, making it harder for market makers to separate "signal" from "noise" in the order flow in the aggregation stage. This Kraken survey, however, has an obvious selection bias: the respondents were all existing crypto asset holders who voluntarily participated in the survey through an exchange platform, and their behavioral characteristics should not be directly generalized to the overall population of market participants.
Even so, the broader academic literature on crypto behavioral finance corroborates, along multiple dimensions, the pronounced amplification effect of behavioral biases in this market. As for the disposition effect, a number of empirical studies show that crypto-market investors exhibit an even stronger tendency to "sell winners and hold losers" than traditional stock-market investors, and this effect is further amplified in the 24/7 continuous-trading environment: investors can check their account P&L and make trading decisions at any moment, lacking the "cooling-off period" provided by the closing hours of traditional markets, which significantly raises the frequency of emotion-driven trading. As for social-media-driven attention trading, the information-dissemination ecosystem of crypto markets exhibits a distinctive structure: real-time P&L sharing (PnL screenshots) in Telegram groups and Discord servers creates strong social-comparison pressure, copy-trading platforms directly turn individual trading decisions into signal sources that can be replicated in bulk, and narrative dissemination by KOLs through Twitter/X (often called "Crypto Twitter" or "CT") constitutes an information-cascade channel from a few influencers to a mass retail audience. Together, these mechanisms constitute a herd-behavior amplifier unique to crypto markets: compared with traditional markets, where information spreads mainly indirectly through analyst reports and institutional-holdings disclosures, information dissemination in crypto markets is more immediate, more intuitive, and characterized by strong social reinforcement.
At the theoretical level, the Adaptive Markets Hypothesis (AMH) proposed by Lo (2004) provides a more apt framework for understanding these phenomena than the traditional efficient market hypothesis (EMH) [33]. AMH holds that market efficiency is not a constant state but a process that fluctuates dynamically with changes in participant composition, competitive intensity, and the institutional environment. In crypto markets, the composition of participants undergoes dramatic cyclical shifts: during bull markets, large numbers of inexperienced retail investors flood in, and their behavior is dominated by narrative-chasing and momentum trading; during bear markets, after retail investors exit, the market is dominated by more experienced participants, and information efficiency rises accordingly. This cyclical change in participant composition means that the price discovery efficiency of crypto markets is itself a time-varying quantity that may sit at different positions on the efficiency spectrum in different market phases. This theoretical insight resonates directly with the ceiling-floor model of Section 13.6: the efficiency range between the ceiling and the floor is not static but expands or contracts dynamically as the ecosystem of market participants evolves.
In addition, narrative-driven trading logic is especially pronounced in crypto markets. Whether "DeFi Summer," "the rise of NFTs," or "AI + Crypto," a powerful narrative can rapidly attract enormous inflows of capital, even if the relevant projects lack real applications or sustainable cash flows. In this mode, the driver of price discovery is alienated from "assessing fundamental information" into "guessing the breadth of narrative dissemination," which is similar to Keynes's "beauty contest" theory: investors are not assessing the true value of an asset but guessing what other investors will consider valuable.
Narrative-driven reflexivity is significantly amplified in crypto markets. A bullish narrative pushes the price up, and the price rise in turn "confirms" and reinforces the narrative, attracting more followers and pushing the price up further—a classic positive feedback loop. When the narrative collapses, however, the negative feedback loop is equally violent: the price decline "falsifies" the narrative, followers exit in panic, and the price plunges further. The lack of a traditional "anchoring value" (such as net asset value or stable cash flows) for crypto assets makes the amplitude of this reflexive loop far greater than in traditional asset markets, further intensifying price overshoot.
13.7.4 The superposition of four types of obstacles
The four types of obstacles above—liquidation cascades (mechanism), market manipulation (pollution), behavioral biases (sentiment), and information friction (infrastructure delay)—do not exist in isolation. Under extreme conditions, they often interweave and superimpose layer upon layer, leading to a systemic failure of the price discovery mechanism.
Figure 13-32 maps the four types of obstacles—liquidation cascades, market manipulation, behavioral biases, and information friction—onto the three stages of expression, aggregation, and transmission, marking the link each type of obstacle most directly damages and its cross-stage superimposed amplification.
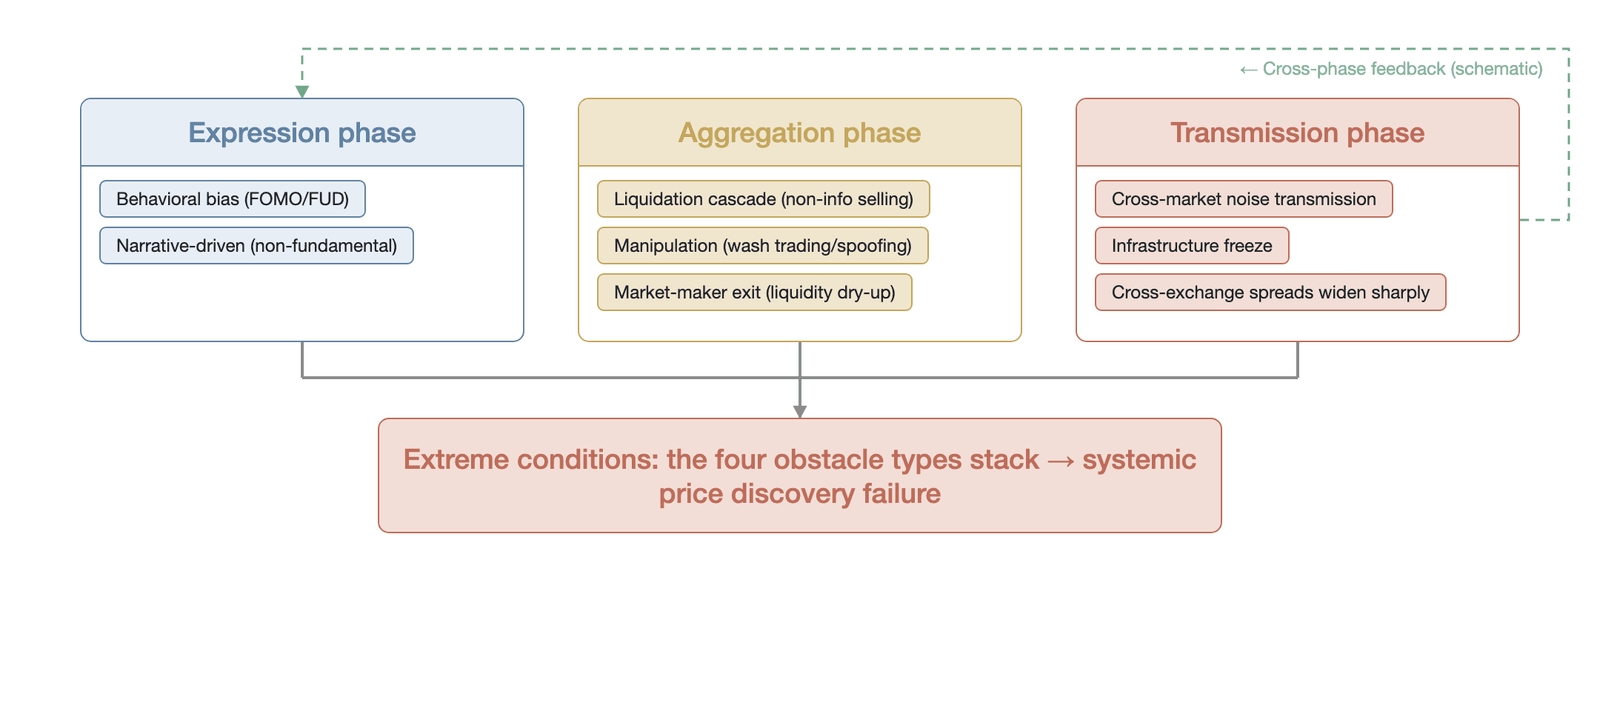
Figure 13-32. Mapping of the four types of price discovery obstacles onto the three-stage model
Figure 13-32 reveals that the four types of obstacles are not evenly distributed across the three-stage model: behavioral biases and narrative-driven trading act mainly on the expression stage, where large amounts of non-informational sentiment orders pour into the market and dilute the concentration of informed traders' signals; liquidation cascades and market manipulation (wash trading, spoofing) concentrate their damage on the aggregation stage—the former swamping market makers' signal-extraction capacity with mechanical selling pressure, the latter directly polluting market makers' Bayesian-inference process with false order flow; and information friction (network congestion, withdrawal freezes, infrastructure degradation) severs the arbitrage channels of the transmission stage, preventing the prices of different venues from converging. More importantly, the figure uses dashed lines to mark the cross-stage feedback links among the obstacles: for example, the price overshoot produced by a liquidation cascade in the aggregation stage spreads through social media and triggers more panic orders in the expression stage, forming a closed positive feedback loop.
Taking the October 10 event of 2025 as an example, one can clearly trace how the multiple obstacles reinforced one another at each stage. The crisis began with the enormous uncertainty in interpreting an external macro shock (a 100% tariff threat); market participants held serious disagreements about the meaning of this information, and in the crypto-market environment of 24/7 trading without circuit breakers, this uncertainty was instantly priced in as violent price volatility. The initial decline rapidly triggered the forced liquidation of highly leveraged positions, the double-erosion effect of unified margin accelerated the depletion of margin, and the liquidation engine's mechanical selling overwhelmed market makers' quoting capacity, so that liquidity evaporated sharply; at the same time, exchange interfaces froze due to the surge in traffic, traders could not add margin or manage risk, and infrastructure friction and the liquidation cascade formed a severe superposition.
Panic sentiment spread rapidly through social media, and retail panic selling and mechanical liquidation converged into large-scale concentrated selling. Under this extreme stress, the cross-market transmission mechanism broke down: arbitrageurs could not close price differences because of network congestion and capital constraints, causing USDe to trade at a discount of as much as 35% on Binance while remaining near $1 on other exchanges and in DeFi pools [26]. This extreme pricing deviation had nothing to do with fundamentals and was entirely a product of venue microstructure, yet it in turn triggered, through Binance's margin system, more liquidations that should not have occurred, forming a vicious loop in which noise was amplified rather than attenuated in transmission.
This extreme USDe discount event exposed a deeper systemic risk in the unified-margin system: the contagion effect of the credit risk of the margin asset. When USDe traded at a 35% discount on Binance, all positions using USDe as margin suddenly faced insufficient margin—even if the price movement of the underlying assets of those positions had not yet reached the liquidation line, the shrinkage of the margin asset's own value had already eroded the margin adequacy from another dimension. This mechanism is essentially isomorphic to the double-erosion effect discussed earlier, but its contagion range is broader: the double-erosion effect affects positions using the underlying asset itself as collateral, whereas margin-asset credit risk affects all heterogeneous position portfolios that use that asset as margin. Under the architecture of the unified-margin system, the "price stability" of the margin asset is an implicit core assumption: margin is usually valued at face value or at a fixed discount close to face value, rather than being marked to market in real time. Once this assumption is broken, the reliability of the entire margin-calculation system is fundamentally called into question. Even more severe, if multiple stablecoins simultaneously trade at significant discounts in an extreme event—for example, when systemic credit panic spreads across the entire stablecoin ecosystem—then positions using different stablecoins as margin may face insufficient margin at the same time, and the margin system will face the risk of cascading collapse. This analysis links directly to the discussion of insurance funds in Chapter 12: if an insurance fund's reserve assets themselves include stablecoins, then in a scenario of systemic stablecoin discounting, the insurance fund's actual usable value will shrink in tandem, losing its buffering capacity at precisely the moment it is most needed.
In this cascade process, where multiple obstacles reinforce one another, price discovery is no longer a matter of being "inefficient"; it has completely lost its function. The price of the perpetual futures market no longer reflects any information about the asset's future value but merely reflects the degree of liquidity exhaustion and mechanism fragility of that exchange at that moment. In the language of the ceiling-floor model, efficiency has at this point reached the floor, and may even briefly break through the floor, because the superposition effect of multiple obstacles exceeds the expected destructive power of any single mechanical-noise pathway. This is precisely the extreme manifestation of the "widest range" of perpetual futures in the model of Section 13.6: when the four types of obstacles are activated simultaneously, the fall of efficiency from ceiling to floor can be completed within minutes.
13.8 Price discovery on on-chain order book DEXs
High-performance on-chain central limit order book decentralized exchanges, represented by Hyperliquid and dYdX v4, are reshaping the price discovery environment of digital asset markets at a structural level. This evolution is not a simple migration of trading venues but a fundamental transformation of the information-processing mechanism. On-chain transparency brings dual effects—information symmetrization and the maximal extractable value (MEV) problem—while the three types of native information channels unique to crypto markets provide a wholly new dimension for price discovery that does not exist in traditional finance. The maturity of decentralized sequencers and MEV-protection mechanisms will ultimately determine whether the price discovery function can migrate to the on-chain environment on a larger scale.
13.8.1 The changing price discovery environment
For a long time, centralized exchanges dominated the price discovery process of crypto markets. Yet the CEX architecture has an inherent problem of opacity. In a CEX, the entire price discovery process is completed within centralized servers, and external observers can only passively receive the final price and order book snapshots pushed via API, unable to observe the complete life cycle from order submission and matching to execution. This black-box state requires users to bear the counterparty risk of asset custody and makes it impossible to verify cryptographically whether the exchange is using its information advantage to front-run or manipulate internally. The collapse of FTX (November 2022) fully exposed the fragility of this trust model: user assets were misappropriated, the internal trading desk enjoyed an asymmetric information advantage, and all of this was revealed only after the fact.
The rise of on-chain CLOB-DEXs is precisely a structural response to this problem of opacity. By placing order book matching and settlement logic entirely on a blockchain or a customized application chain, the life cycle of a trade becomes fully verifiable. From order submission, sequencing, and matching to final settlement, every operation is recorded on an immutable distributed ledger. Users' assets are always held in smart contracts under their own control (self-custody), fundamentally eliminating the risk of a centralized custodian misappropriating assets. Self-custody, however, while eliminating one class of risk, introduces another: the smart contract itself may harbor security hazards such as code vulnerabilities, maliciously exploited upgrade mechanisms, or governance attacks, and the resulting asset losses are often technically irreversible. Even more noteworthy, DEXs are not truly immune to CEX-like centralized intervention in extreme events. The Hyperliquid JELLY event of March 2025 provides a vivid case: a whale trader, by maliciously manipulating the perpetual futures position of the JELLY token, placed the protocol's HLP (Hyperliquid Liquidity Provider) vault at risk of enormous losses. Facing this emergency, the Hyperliquid team coordinated validators to shut down that specific market by emergency vote and forcibly settled all open positions at a designated price, with the HLP vault bearing the socialized losses. This response is essentially no different from the risk-control intervention of a centralized exchange. Similarly, dYdX has, in extreme market events, adjusted the risk parameters of specific markets through governance votes. These cases show that the "decentralization" and "censorship resistance" that DEXs tout may, when systemic risk threatens the protocol's survival, be overridden by centralized decisions at the governance layer. A more careful formulation is therefore: on-chain DEXs change the nature and distribution of risk rather than unilaterally eliminating it. This shift means that market participants move from relying on the self-discipline of centralized institutions to playing an open game with all participants under transparent but not risk-free rules.
Figure 13-33 compares the structural differences between CEXs and on-chain CLOB-DEXs across dimensions such as order processing, asset custody, and verifiability.
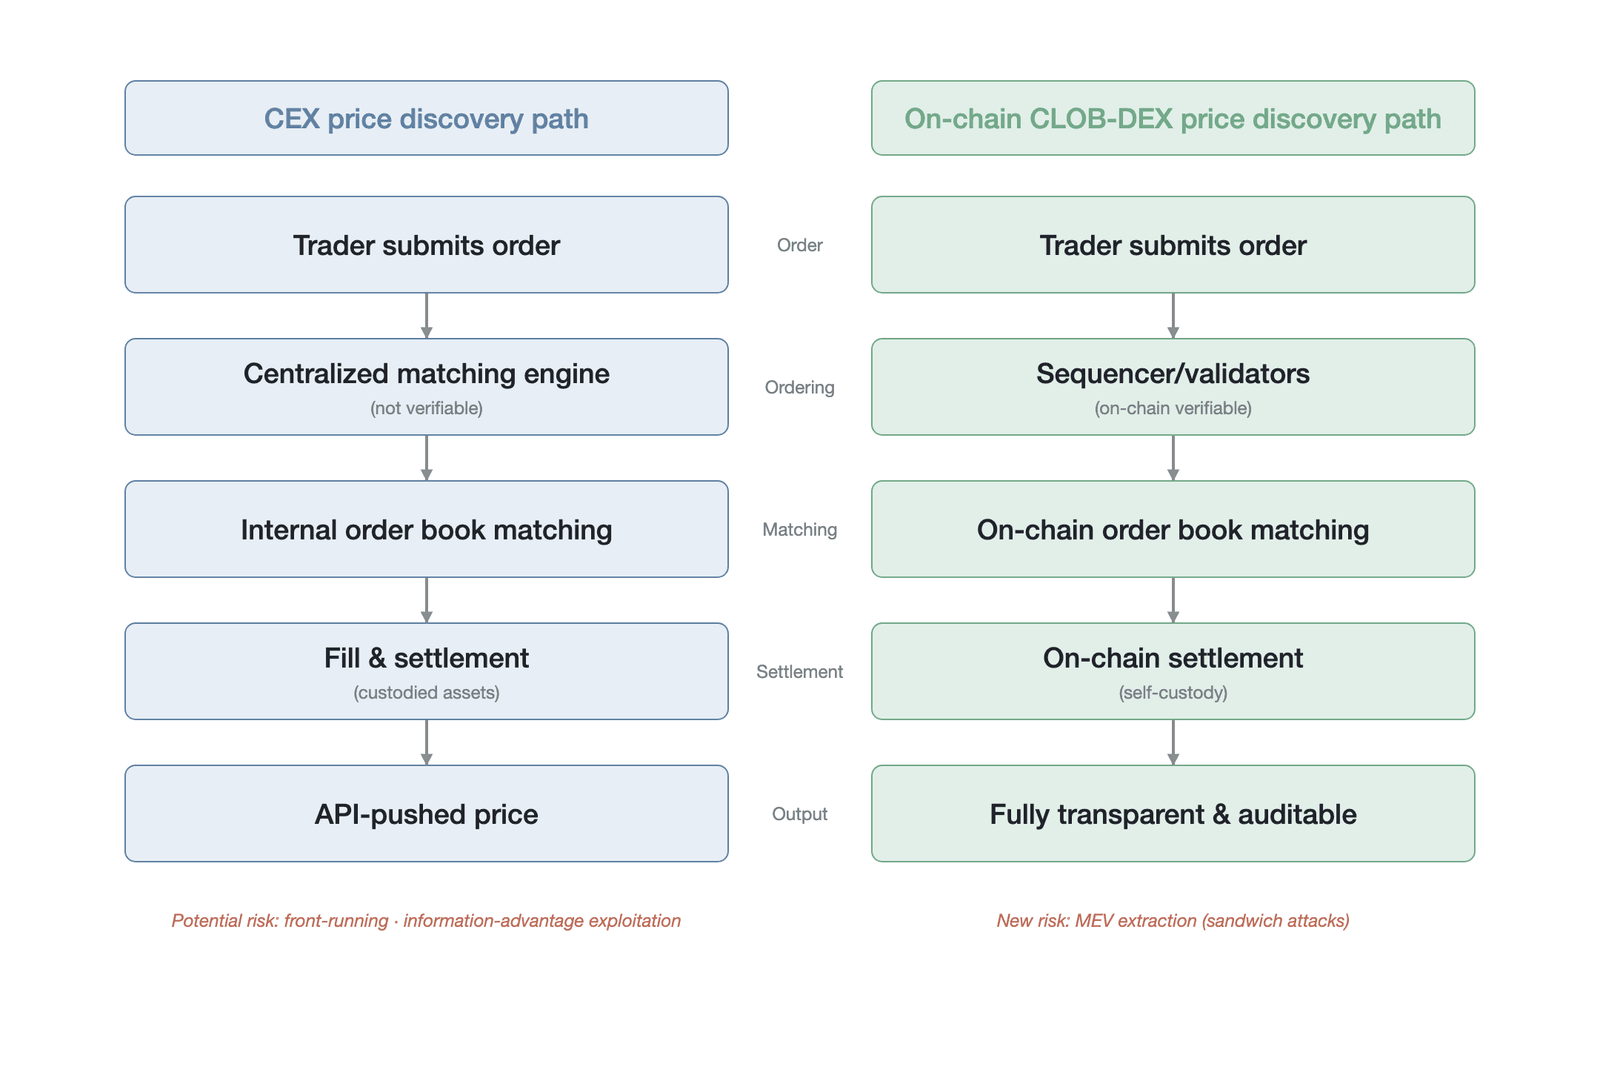
Figure 13-33. Comparison of price discovery mechanisms between CEXs and on-chain CLOB-DEXs
Figure 13-33 uses side-by-side structural diagrams to compare the process differences between CEXs and on-chain CLOB-DEXs across five links: order submission, sequencing, matching, settlement, and asset custody. In the CEX architecture, all links are completed in the black box of centralized servers, and external observers can see only the final output of the execution price and order book snapshots; whereas in the on-chain CLOB-DEX architecture, the execution record of every link is written to an immutable blockchain ledger, making the complete life cycle from order to execution cryptographically verifiable. The difference between the two architectures on the asset-custody dimension is especially striking: CEXs require users to transfer assets into addresses controlled by the exchange (the custodial model), whereas in a DEX users' assets are always held in smart contracts under their own control (the self-custodial model).
This paradigm shift is clearly borne out in trading data. According to a report released by CoinGecko, the trading volume of decentralized perpetual futures grew explosively in 2025. For the full year 2025, the top ten perpetual futures exchanges (including both CEXs and DEXs) cumulatively processed $92.9 trillion in trading volume, up 64.6% year over year. Of this, DEX perpetual futures trading volume surged 346%, reaching $6.7 trillion [34]. Even more striking, the ratio of DEX perpetual futures trading volume to CEX perpetual futures trading volume climbed all the way from 2.1% in January 2023, reaching a record high of 11.7% in November 2025, achieving 14 consecutive months of growth [34]. By the end of 2025, the DEX perpetual futures market had stably occupied over 10% of market share, marking that on-chain DEXs have evolved from a marginal "alternative choice" into a core price discovery venue that cannot be ignored.
Figure 13-34 uses a monthly line chart to track the trajectory of DEX perpetual futures trading volume as a share of CEX perpetual futures trading volume over the full year 2025, showing that this ratio accelerated upward in the second half of the year.
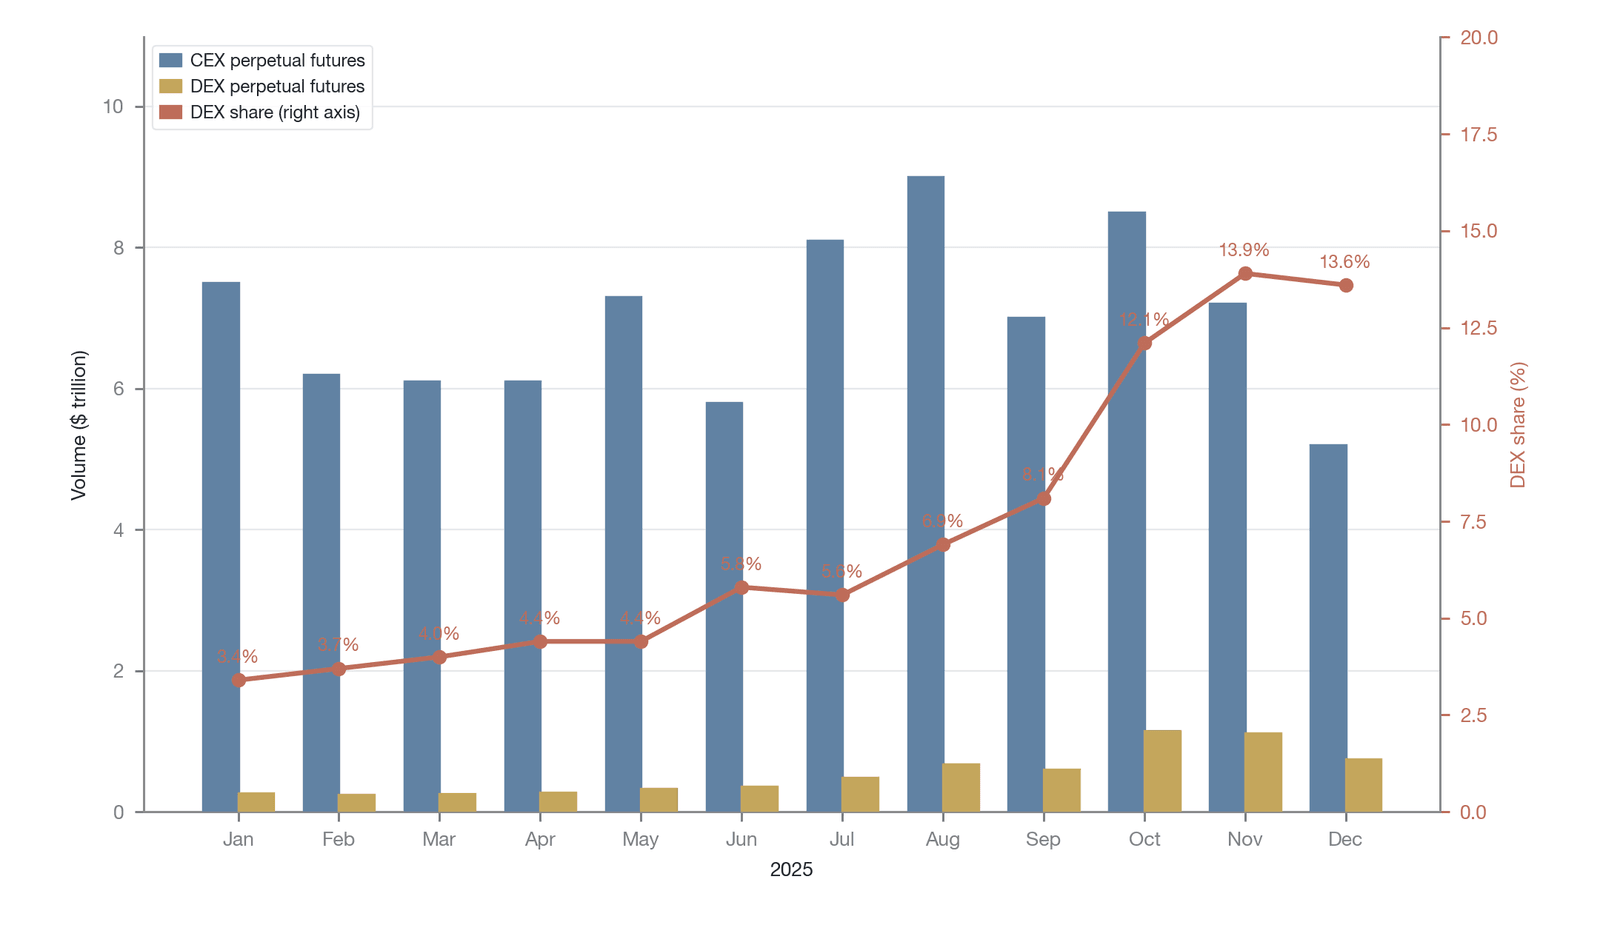
Figure 13-34. The evolution of on-chain DEX perpetual futures trading volume as a share of CEX volume (2025; the share is the ratio of monthly DEX-perpetual to CEX-perpetual trading volume, with a monthly peak of about 13.9% in November; the 11.7% cited in Section 13.8.3 is the value for the same month under a different convention, the difference arising from the monthly ratio versus a cumulative convention and whether the denominator includes DEX; monthly volume and share per CoinGecko [34], market landscape also see [35])
This growth was not evenly distributed. DEX perpetual futures trading volume in the second half of 2025 accounted for about 65% of the full-year total, exhibiting a clear acceleration, with single-month trading volume in the fourth quarter repeatedly surpassing $1 trillion. This trend indicates that, as the performance of on-chain infrastructure continues to improve and user experience continues to be optimized, informed traders are migrating their price discovery activity from CEXs to DEXs at an ever-faster pace. The deeper driver of this migration is not only the improvement in technical performance but also the structural shift in market preference toward self-custody and transparent settlement after the FTX incident.
13.8.2 The dual effects of transparency: information symmetrization and the MEV problem
The absolute transparency brought by on-chain order books has profound and complex dual effects on the price discovery process. On the one hand, transparency achieves unprecedented information symmetrization. In the on-chain environment, all operations are auditable, fundamentally eliminating the possibility of the exchange itself front-running or covertly manipulating. This transparency forces market makers to provide better quotes, because any quote that deviates significantly from fair value would be quickly captured and exploited by on-chain arbitrageurs. In addition, on-chain-observable large positions and liquidation thresholds change the game structure among market participants. For example, on platforms such as Hyperliquid, all users can calculate the liquidation price of a whale account from on-chain data—information strictly kept secret in a CEX becomes a public game variable in a DEX. This symmetrization of information, in theory, helps reduce adverse-selection costs, thereby narrowing the bid-ask spread and improving the overall liquidity quality of the market.
On the other hand, transparency also gives rise to a severe maximal extractable value problem. Because trade intent is publicly visible before being packed into a block, MEV searchers can identify large trades by monitoring the mempool or the sequencer queue and execute ahead of them by paying a higher priority fee or colluding with block builders. The most typical form is the sandwich attack: the searcher inserts their own buy order ahead of the target's large buy order to push up the price, and after the target order fills at the higher price, immediately sells for a profit. According to EigenPhi's data, although the amount extracted by sandwich attacks on Ethereum fell from about $10 million per month at the end of 2024 to about $2.5 million in October 2025, the attack frequency remained at a high level of 60,000 to 90,000 times per month [36]. This mechanism directly harms the interests of the original trader and increases the hidden friction cost of trading.
Yet from the pure efficiency perspective of price discovery, the impact of MEV is not entirely negative. The study by Capponi, Jia, and Yu (2025) reveals a counterintuitive conclusion: DEX trades that pay high priority fees actually contain more private information and contribute more to price discovery [37]. To ensure that their time-sensitive orders carrying information are executed quickly, informed traders often adopt a "jump-bidding" strategy, deterring competitors by setting an extremely high initial fee. In this sense, the MEV mechanism actually accelerates the incorporation of information into price, because it provides a market-based pricing mechanism for the time value of information. But this gain in efficiency comes at the cost of market fairness, externalizing execution costs onto ordinary users. The net effect of MEV on overall market quality therefore remains a contested frontier topic in current microstructure research.
13.8.3 The three native information channels of crypto markets
In traditional financial markets, price discovery relies mainly on public information such as macroeconomic data and corporate earnings, along with the private research of institutional investors. In crypto markets, however, the on-chain environment has bred three native information channels found nowhere else, which intervene in the three-stage price discovery model (expression, aggregation, and transmission) in different ways, providing a wholly new information dimension for asset pricing.
These three native information channels each have distinctive information attributes and temporal characteristics, and their intervention points in the three-stage model also differ. Figure 13-35 summarizes the information sources, typical signal types, and main stages of action for each of the three channels: on-chain data, mempool data, and derivatives data.
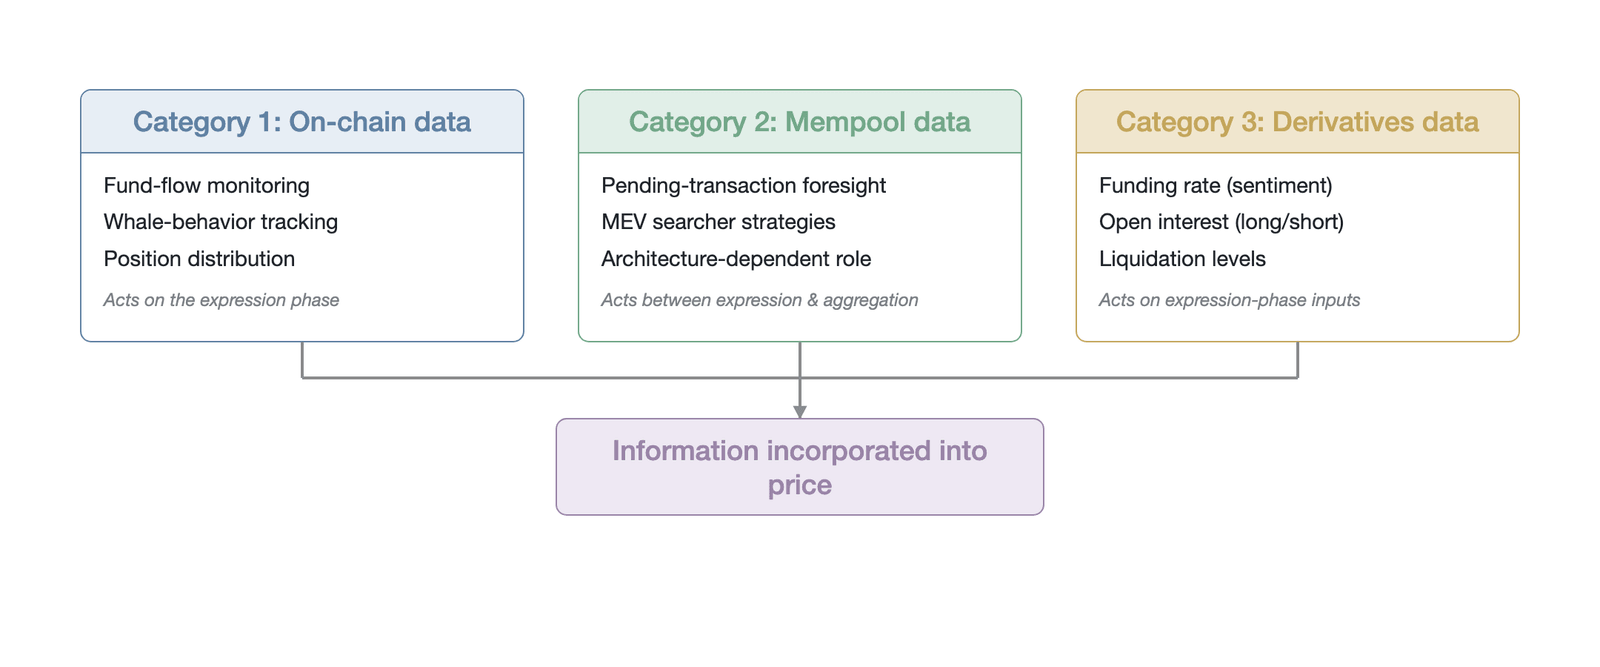
Figure 13-35. The three native information channels of crypto markets and their roles in price discovery (conceptual classification illustration, no quantitative data)
The first is the on-chain data channel, which acts directly on the "expression stage" of price discovery as a foundational information source. Such data include monitoring stablecoin flows between exchanges and on-chain wallets, the sudden activation of long-dormant whale wallets, and large asset transfers. For example, when hundreds of millions of dollars of USDT are transferred from an exchange hot wallet to cold storage, it often signals that a large holder is accumulating a spot position, a signal that releases directional information to traders with on-chain analytical capability before the actual buying takes place. In addition, analysis of a token's holding distribution and concentration can also provide deep insight into market structure. All these on-chain behaviors, before being converted into actual order flow, already constitute a "pre-expression" information signal.
The second is the mempool data channel, which acts mainly on the transitional zone between the "expression stage" and the "aggregation stage." Transactions awaiting confirmation in the mempool provide a brief foresight into future market states. Informed MEV searchers use this foresight to design front-running strategies. From an information-theoretic perspective, although this behavior is predatory, it objectively accelerates the transmission of the supply-and-demand information embedded in the mempool to the final execution price. The role of the mempool differs significantly across DEX architectures. Designs using a centralized sequencer (such as Hyperliquid) usually do not expose a public mempool, thereby reducing the risk of sandwich attacks, but this brings with it the problem of centralization of sequencing power. In a fully decentralized architecture (such as dYdX v4), by contrast, validators can observe pending transactions, which creates conditions for validator-level MEV extraction.
The third is the derivatives data channel, which serves as a key information input to the "expression stage," feeding back into and influencing traders' decisions. This includes the funding rate, changes in open interest, and the distribution of liquidation levels. As described in the preceding sections, the funding rate is not only the mechanism that keeps the perpetual futures price anchored to spot but is itself a second-order information indicator reflecting market sentiment and leverage crowding. In on-chain DEXs, the liquidation thresholds of large positions are fully transparent, which makes "liquidation sniping" a trading strategy based on deterministic information, whereas in a CEX such a strategy can rely only on vague probabilistic guesses. A sudden surge or plunge in open interest directly reveals that market participants are building or unwinding directional exposure.
The common feature of these three native information channels is that they are, in technical principle, open to all participants, greatly lowering the absolute threshold of information access. Yet owing to the complexity of information processing and the intensity of competition, the window of informational advantage is compressed extremely, shrinking from the days or weeks of traditional finance to seconds or even a few blocks in crypto markets. The focus of competition has shifted entirely from "who can obtain information" to "who can process and execute information faster and more accurately"—the concrete manifestation, in the domain of price discovery, of the "transparency paradox" explored in Chapter 1.
13.8.4 A comparison of two architectures
The on-chain derivatives track currently exhibits a coexistence of multiple technical architectures. Among them, Hyperliquid and dYdX v4 represent two entirely different design philosophies, and their differences in consensus mechanism, sequencer design, and verifiability directly shape the microstructure characteristics of price discovery in their respective markets. Table 13-9 systematically compares the key architectural parameters of the two.
| Dimension | Hyperliquid | dYdX v4 |
|---|---|---|
| Underlying architecture | Dedicated Layer 1 (HyperCore + HyperEVM) | Cosmos SDK application chain |
| Consensus mechanism | HyperBFT (custom-optimized) | CometBFT (evolved from Tendermint) |
| Transaction finality | Median ~0.2 seconds, P99 < 0.5 seconds | ~1–2 seconds |
| Throughput | ~200,000 TPS | ~10,000 TPS |
| Sequencer design | Centralized sequencer + on-chain verification | Decentralized validator-rotation sequencing |
| Gas fees | Zero gas fees | Gas fees required |
| MEV risk profile | Sequencer-level (concentrated but auditable) | Validator-level (dispersed but hard to coordinate defenses against) |
| Cross-chain interoperability | HyperEVM bridging | Native Inter-Blockchain Communication (IBC) interoperability |
| Verifiability | Matching results verifiable on-chain | Entire process verifiable on-chain |
Table 13-9. Comparison of Hyperliquid and dYdX v4 architectural features (Data source: compiled by the author from each platform's public documentation)
Hyperliquid has chosen a "performance-first" infrastructure route. It has built a dedicated Layer 1 blockchain and adopted a custom HyperBFT consensus algorithm optimized specifically for end-to-end latency. This architecture enables Hyperliquid to achieve transaction finality with a median of about 0.2 seconds and throughput of up to 200,000 transactions per second (TPS) [38]. In terms of sequencer design, Hyperliquid currently uses a centralized sequencer to ensure extremely low latency and a zero-gas-fee experience, but all matching and settlement results are fully verifiable on-chain. This hybrid model, however, requires a precise distinction regarding the boundary of "verifiability." What is verifiable on-chain is matching correctness—that is, whether, given a set of already-sequenced orders, the matching engine executes correctly according to price-priority and time-priority rules. But ordering fairness—that is, whether orders are queued fairly on a first-come-first-served basis after arriving at the sequencer—is not cryptographically verifiable under the current architecture. A centralized sequencer can entirely extract value by selectively delaying or prioritizing specific orders without violating any matching rule, and such behavior cannot be identified after the fact in the on-chain record. The aforementioned JELLY event (March 2025) exposed, from another dimension, the decision-power-concentration risk of the centralized-sequencer architecture: when a whale account's malicious manipulation threatened the protocol's systemic safety, Hyperliquid needed only a few validators (about 5 controlled by the foundation) to form a quorum to unilaterally shut down a specific market and forcibly settle all positions within minutes. This fact shows that although Hyperliquid's validator network in theory provides decentralized verification, its actual emergency decision power is highly concentrated in a few nodes. From a systemic-risk perspective, as of the end of 2025 about 43% of DEX perpetual futures trading volume flowed through this single protocol and its centralized sequencer, and this degree of concentration itself constitutes a non-negligible systemic-risk exposure.
Despite the structural concerns above, this hybrid model of "centralized sequencing + decentralized verification" has achieved notable results on liquidity metrics. In BTC perpetual futures, Hyperliquid can maintain a bid-ask spread of about $1, with cumulative sell-side depth of about 140 BTC on its order book, even surpassing the depth level of about 80 BTC at some top CEXs over the same period. Several important qualifications must be attached to this liquidity comparison, however. First, the HLP (Hyperliquid Liquidity Provider) vault is a market-making capital pool operated by the Hyperliquid platform itself rather than an independent third-party market maker, and the liquidity it provides is different in nature from that provided by the diversified, competitive network of market makers on a CEX. The share of the HLP vault's contribution to the aforementioned 140 BTC of depth is a key parameter for assessing the sustainability and stress resilience of this liquidity, but it currently lacks transparent public disclosure. Second, the comparison above is based on an order book snapshot at a single point in time and fails to reflect time-weighted average depth or to measure depth resilience during high-volatility periods—yet it is precisely at these critical moments that the true quality of liquidity matters most. Third, a significant difference may exist on a DEX between displayed depth and executable depth: in the on-chain environment, orders can be rapidly withdrawn within a single block, so the depth displayed at a given moment may not truly be executable. Finally, the incentive mechanism of the HYPE token attracts a large amount of incentivized liquidity through market-making rewards; the providers of such liquidity are driven mainly by token incentives and may withdraw rapidly when incentives are reduced or removed, so it should not be equated with sustainable, organic liquidity driven by endogenous market-making profits.
Figure 13-36 compares the order book liquidity depth of Hyperliquid and Binance in BTC perpetual futures.
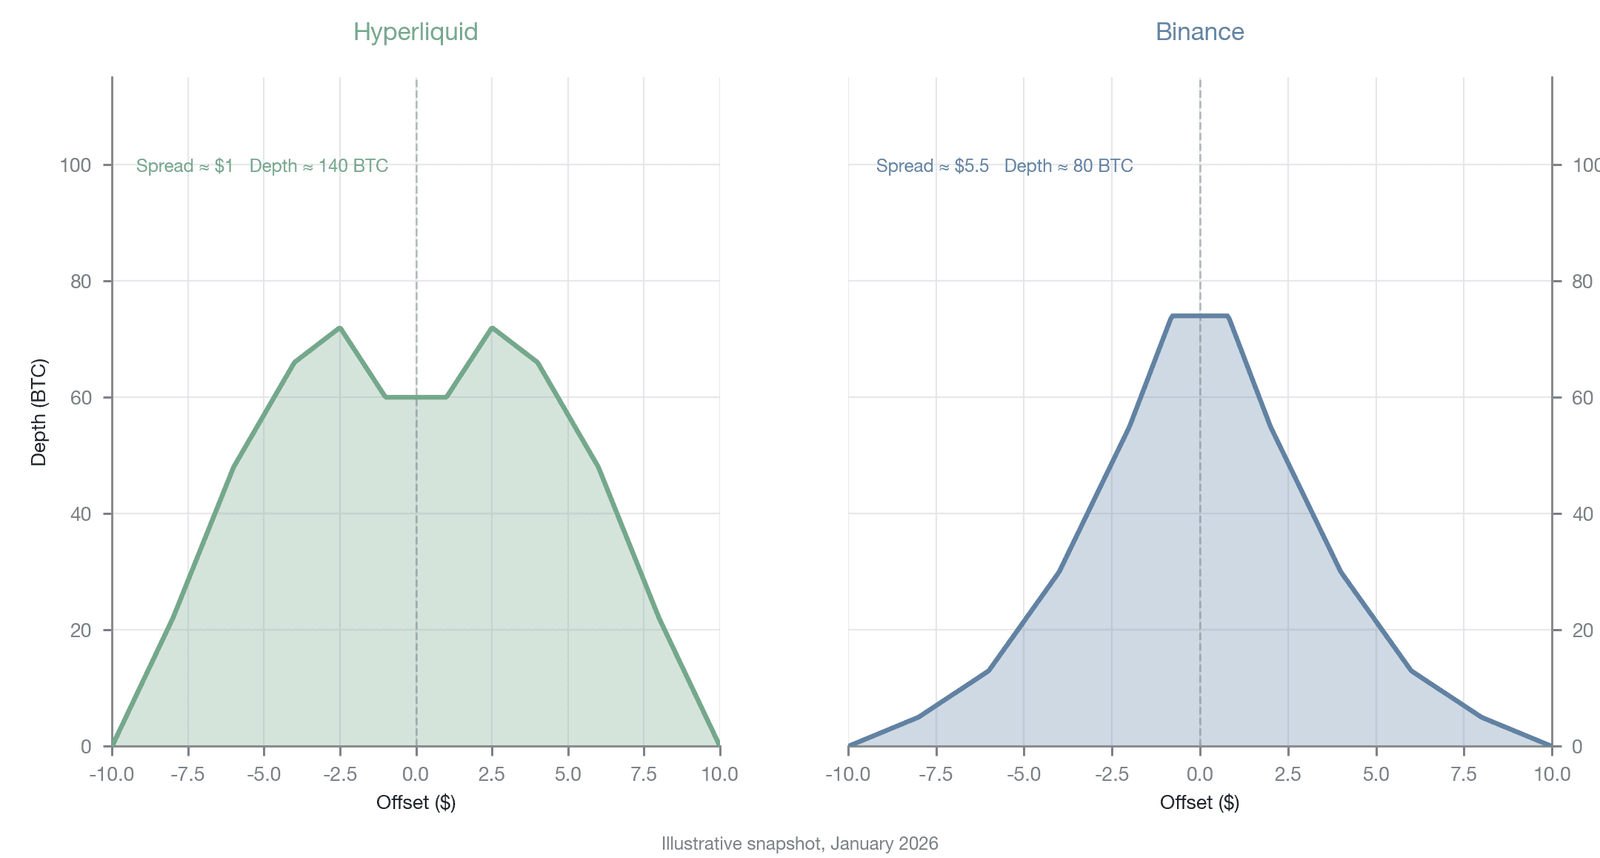
Figure 13-36. Illustrative comparison of Hyperliquid and Binance BTC perpetual futures liquidity depth (January 2026 snapshot; the HLP vault's market-making strategy causes displayed depth to diverge from executable depth; depth data not independently verified)
Figure 13-36 uses cumulative order book depth curves to compare the bid and ask distribution of Hyperliquid and Binance in BTC perpetual futures at the same point in time. The horizontal axis is the percentage deviation from the mid-price, and the vertical axis is the cumulative BTC order quantity. Within the very narrow ±0.1% spread range, Binance, by virtue of the fierce competition among multiple high-frequency market makers, maintains higher top-of-book liquidity; but in the wider range of ±0.5% to ±1%, Hyperliquid's cumulative sell-side depth (about 140 BTC) instead exceeds Binance's level over the same period (about 80 BTC). This seemingly counterintuitive phenomenon is related to the HLP vault's market-making strategy—its order-placement strategy tends to deploy greater depth at positions slightly farther from the mid-price to reduce adverse-selection risk.
By contrast, dYdX v4 has chosen a fully decentralized application-chain route based on Cosmos SDK and CometBFT consensus. Its core feature is that a decentralized validator network takes turns responsible for order sequencing and block production. This design maximally guarantees censorship resistance and decentralization attributes, eliminating the systemic risk that a single sequencer might bring. Decentralized consensus, however, inevitably brings a compromise in performance: its transaction finality is usually between 1 and 2 seconds, and its throughput is also relatively limited. In addition, validator-level MEV extraction becomes a problem requiring focused defense in the dYdX v4 architecture, because the validator producing the current block can observe pending transactions and reorder them.
From the microstructure perspective of price discovery, the differences between these two architectures produce entirely different market characteristics. Hyperliquid's ultra-low latency makes it closer to the operating environment of traditional high-frequency trading, where market makers can update quotes more frequently and thereby provide tighter bid-ask spreads and deeper liquidity. This environment is naturally favorable for informed traders to express information quickly, making prices respond faster to new information. The presence of a centralized sequencer, however, means that ordering fairness depends on the operator's reputation rather than a cryptographic guarantee, which in theory constitutes a trust premise. dYdX v4's decentralized sequencing, while sacrificing some latency, eliminates the single-point trust dependency through its fully decentralized architecture and holds an advantage in long-term institutional robustness.
The competition between these two architectures for market share vividly illustrates informed traders' dynamic choice of price discovery venue. In the first half of 2025, Hyperliquid, by virtue of its CEX-comparable performance experience and innovative HIP-3 permissionless-listing mechanism, at one point held as much as 75% to 80% market share in the Perp DEX space [39]. As competitors such as Lighter (using zero-knowledge-proof zkRollup technology, zero fees) and Aster (backed by Binance Labs) entered in the second half of the year, however, Hyperliquid's market share experienced violent fluctuations. In September 2025, its share fell at one point to about 38%, while Lighter and Aster held 16.8% and 14.9%, respectively [40]. By year-end, as the market landscape reconsolidated, Hyperliquid's share recovered to about 43%. This fierce venue competition indicates that liquidity in the on-chain DEX space is highly elastic, and the shift of price discovery leadership is faster and more dynamic than in the CEX space.
Figure 13-37 uses a dual-axis chart to show the monthly trading volume composition of the major Perp DEXs in 2025 (Hyperliquid, dYdX, Lighter, Aster, Jupiter, and others) (stacked bars on the left axis) and the trajectory of Hyperliquid's market share (line on the right axis), depicting the evolution from "one dominant player" to "a contest among many."
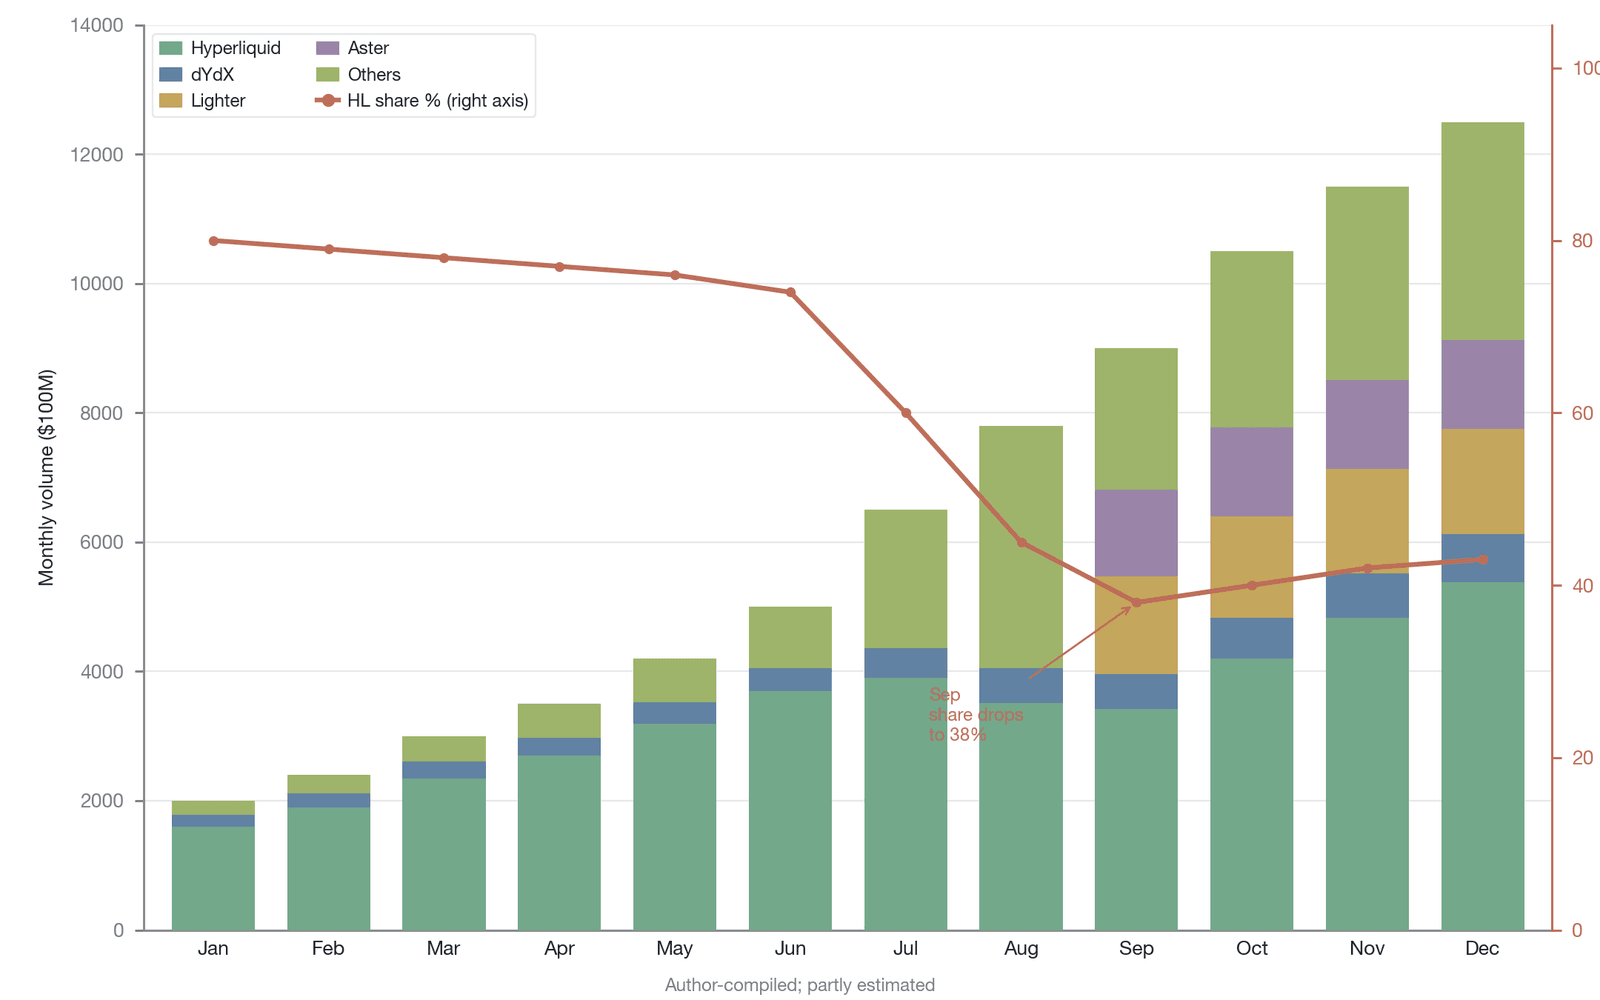
Figure 13-37. Monthly Perp DEX trading volume and the evolution of Hyperliquid's market share (2025; compiled by the author, partly estimated; the month-by-month composition is pending verification against data snapshots)
The data in Figure 13-37 exhibit two salient features. First, the total monthly trading volume of Perp DEXs grew from about $200 billion in January 2025 to over $1.2 trillion in December, a full-year increase of about fivefold, with the growth curve clearly steepening in the second half of the year. Second, Hyperliquid's market share experienced violent fluctuations, from a near-monopoly of about 75%–80% in the first half of the year, to a plunge to about 38% in September as Lighter and Aster entered, and back to a recovery to about 43% by year-end. This rapid redistribution of share is extremely rare in the CEX market—Binance's dominant position in CEX perpetual futures has remained highly stable over the past several years. The low friction of liquidity migration in the on-chain DEX space (no need for cross-exchange transfers, no withdrawal delays) enables informed traders to reallocate their trading activity across different platforms at extremely low switching cost; this feature endows the DEX ecosystem with stronger competitive vitality but also means that any single platform's price discovery leadership is more fragile.
13.8.5 Sequencers and MEV protection
For on-chain DEXs to take on the price discovery function of crypto markets at a larger scale, they must, while maintaining high performance, solve the two core pain points of sequencer centralization and malicious MEV extraction. Current technical evolution focuses mainly on three directions, and these innovations will profoundly change the microstructure mechanism by which information is incorporated into price.
The first direction is the proliferation of decentralized sequencers. Dispersing the power of transaction sequencing from a single entity to multiple participant nodes is a key path to eliminating single points of failure and internal front-running risk. The industry is currently exploring several technical routes. For example, the fair sequencing service proposed by Chainlink uses a decentralized oracle network to determine the fair order of transactions; its core idea is to reach consensus on transaction arrival times through multiple independent nodes, thereby preventing any single node from manipulating the ordering [41]. Threshold-encryption-based schemes, by contrast, require transactions to remain encrypted before being sequenced, and to be decrypted only through the cooperation of distributed key holders after being included in a block, thereby fundamentally depriving the sequencer of the ability to use transaction content to front-run. This "sequence first, decrypt later" paradigm provides a theoretically optimal solution for building cryptographic-level ordering fairness, but its actual deployment faces severe engineering challenges. Current threshold-encryption schemes require multiple key holders to perform cooperative computation in the decryption link, a process that usually adds several hundred milliseconds of end-to-end latency. For Hyperliquid, which pursues transaction finality of about 0.2 seconds, this additional latency would almost mean a doubling of the finality time, materially affecting the information-expression efficiency of high-frequency market-making strategies and informed traders. As of the end of 2025, no mainstream perpetual futures DEX had actually deployed a threshold-encryption scheme in a production environment. It is therefore necessary to distinguish clearly: threshold encryption remains a research direction with theoretical appeal rather than a production-ready solution, and a considerable distance still separates theoretical argument from large-scale engineering deployment.
The second direction is system-level MEV-protection mechanisms. To protect ordinary users without fully sacrificing the price-discovery-acceleration effect that MEV brings, various private transaction pools and MEV-protection networks have emerged. These mechanisms allow users' orders to bypass the public mempool and be sent directly to trusted block builders, thereby avoiding capture by sandwich attacks. Further exploration includes "MEV redistribution" mechanisms, which aim to return part of the MEV profit extracted by searchers to the affected traders or liquidity providers, seeking a new balance between efficiency and fairness. From the perspective of price discovery, the ideal effect of such mechanisms is to retain the part of MEV that benefits information transmission (i.e., accelerating the execution of informed orders) while eliminating its purely predatory part (i.e., the exploitation of uninformed traders by sandwich attacks).
The third direction is the application of zero-knowledge-proof constraints in matching engines. Architectures represented by Lighter.xyz move the complex order book matching and liquidation logic to off-chain execution and submit only the generated zero-knowledge proofs to the Ethereum mainnet for verification [42]. In this model, the behavior of the sequencer and matching engine is strictly constrained by cryptography, and any sequencing that deviates from the predetermined rules (such as price priority and time priority) cannot generate a valid proof, thereby guaranteeing the fairness of the matching process at the mathematical level. The profound significance of this scheme is that it places the most core "aggregation stage" of the price discovery process under cryptographic protection, enabling on-chain DEXs to simultaneously achieve high performance (off-chain execution) and strong trust (on-chain verification). Lighter, with $1.3 trillion in trading volume, ranked among the top ten global perpetual futures exchanges in 2025 [34], preliminarily validating the feasibility of this architecture in actual market competition.
Taken together, these three directions are not mutually exclusive but can act synergistically. An ideal future architecture might simultaneously adopt decentralized sequencers to disperse sequencing power, threshold encryption to protect transaction privacy, and zero-knowledge proofs to constrain matching behavior. When these technologies mature and are deployed at scale, on-chain DEXs will have the potential to surpass CEXs simultaneously along the three dimensions of transparency, fairness, and performance, thereby truly becoming the dominant venue for price discovery in crypto markets.
13.9 Chapter summary
Across the chapter as a whole, the perpetual futures market simultaneously plays a dual role in digital asset price discovery: accelerating information and injecting noise. This inherent tension constitutes the core thread for understanding the information efficiency of crypto markets.
Under normal market conditions, perpetual futures are an efficient price discovery instrument. Based on the venue gravity model (Section 13.3), their systematic advantages across the four dimensions of leverage, liquidity depth, anonymity, and transaction cost make them the venue of choice for informed traders to express private information, and they exhibit extremely high efficiency in the "expression stage" of the three-stage model. Empirical data repeatedly confirm (Section 13.4) that in the normal market state, perpetual futures dominate both the Hasbrouck information share and the Gonzalo-Granger component share. The funding rate mechanism (Sections 13.3.4 and 13.5.2) ensures the long-term anchoring of the perpetual price to spot through continuous arbitrage incentives, so that the price information discovered in perpetual futures is transmitted effectively to the market at large.
Yet the market mechanism of perpetual futures simultaneously produces significant interference with the price signal, injecting non-informational mechanical noise through three pathways (Section 13.5): the microstructural impact of forced liquidation by the liquidation engine (), the distortion of positions by funding rate extremes, and the delay caused by mark-price EMA smoothing. Under extreme conditions (Section 13.6), the three pathways are active simultaneously and superimpose on one another, producing enormous mechanical buying and selling pressure that causes prices to deviate systematically from fundamentals and rapidly contaminates spot and other derivatives markets through oracle price feeds and cross-market arbitrage. In the crisis state (Section 13.7), the direction of reconfiguration of the information flow topology depends on the information structure of the crisis (Sections 13.3.5 and 13.4.6): in a pure mechanical crisis (a liquidation cascade with no major new information), perpetual futures are swamped by mechanical noise, and the spot market may passively take over leadership; in an information-mechanical compound crisis (major news superimposed on a liquidation cascade), informed traders' need to express information keeps the leading derivatives market at the center of information. In either case, blindly trusting the perpetual price of a single market brings enormous risk-control risk.
Through the ceiling-floor model, we can comprehensively evaluate this dual nature. Compared with the spot market and the traditional futures market, the perpetual futures market exhibits the distinctive characteristic of "the highest ceiling, the highest floor, and the widest efficiency range." The ceiling of perpetual futures is the highest, meaning that they are the most efficient price discovery venue in normal times; but their floor is also the highest (that is, their efficiency loss in the worst case is the most severe), and the range between the ceiling and the floor is the widest, meaning that the volatility of their price discovery efficiency is far greater than that of the spot and traditional futures markets.
Figure 13-38 distills the core results of this chapter into a comprehensive comparison chart, with the three market types on the horizontal axis and price discovery efficiency on the vertical axis, marking each market's ceiling, floor, typical operating range, and the landmark events of efficiency plunge in historical crises.
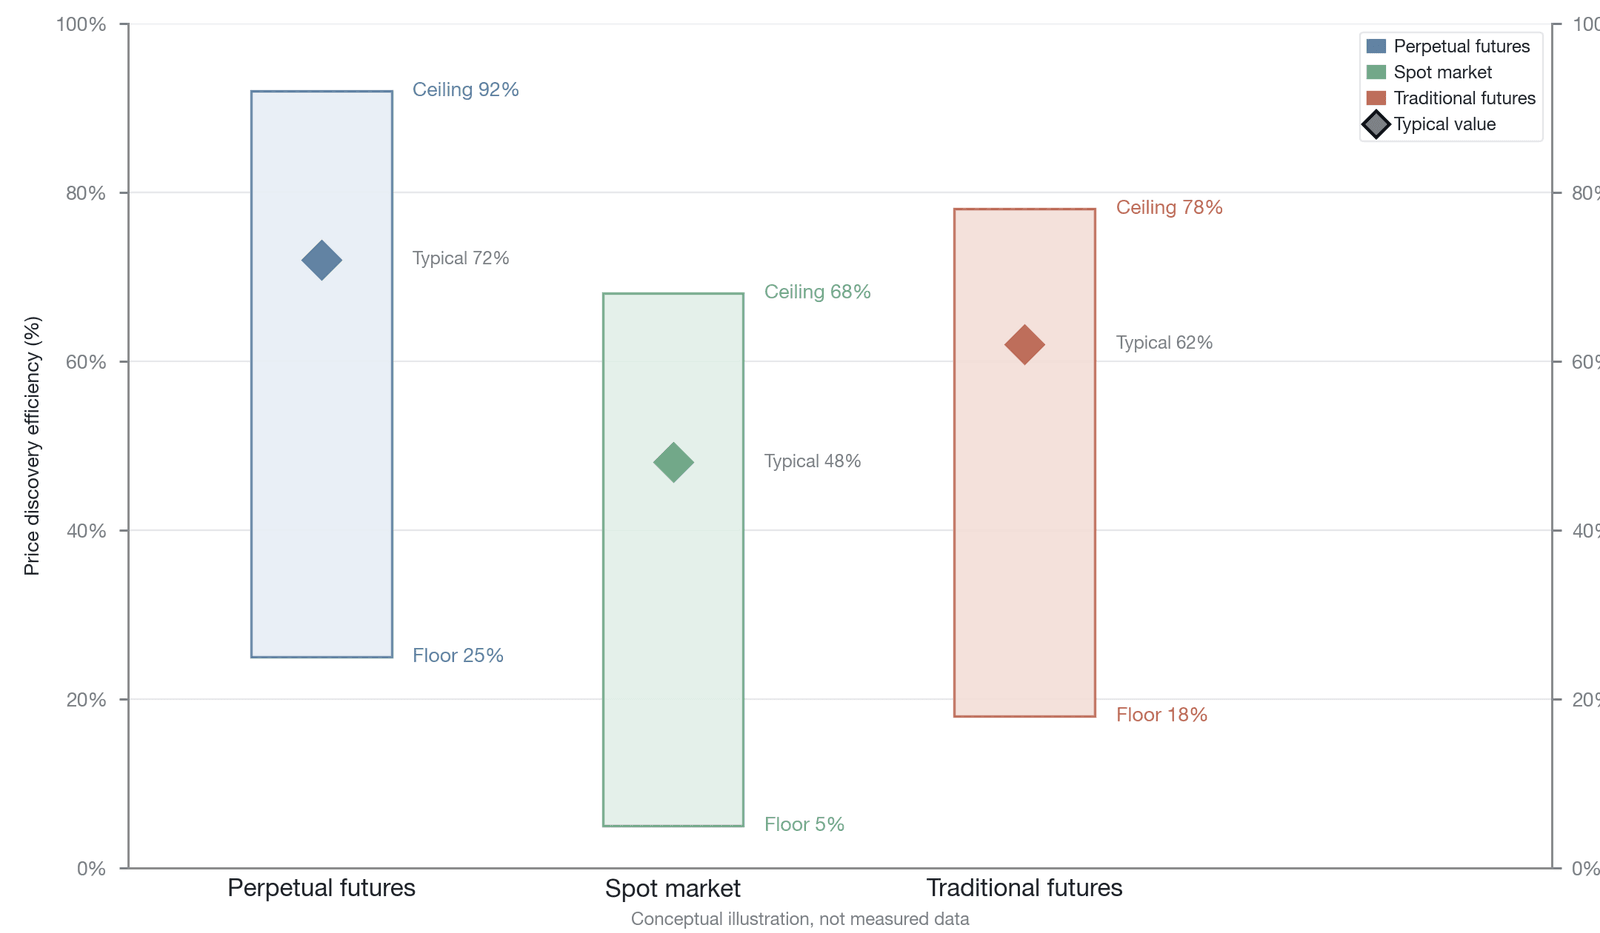
Figure 13-38. A comprehensive ceiling-floor assessment of price discovery efficiency across three market types (conceptual illustration, not empirical data; value conventions consistent with Figures 13-26 and 13-27)
Figure 13-38 condenses the core conclusions of the whole chapter into an intuitive visual language. Traditional futures exhibit a "narrow-band steady-state" efficiency profile—a medium ceiling and a low floor, with a range between them that is narrow and stable, like a river of modest amplitude. Crypto spot exhibits a "low ceiling, low floor" profile—information expression is limited by the lack of leverage, but for the same reason it is almost undisturbed by mechanical noise, like a calm but limited pool of water. Perpetual futures are entirely different: their efficiency range is like rapids in a canyon, with a highest water level (the ceiling) far exceeding that of the other two but a lowest water level (the floor) also higher than the floors of the other markets, and the amplitude of the rise and fall is astonishing. These three markedly different efficiency profiles together constitute a complete portrait of the current price discovery ecosystem of crypto markets.
The price discovery efficiency of perpetual futures is therefore not simply "superior" or "inferior" to that of other markets but a highly state-dependent dynamic characteristic. In assessing the price discovery contribution of perpetual futures, one must simultaneously consider the current market state (volatility level, leverage crowding, liquidity depth) and the specific time scale.
The advantages and disadvantages of perpetual futures stem from the same root—leverage. The high-leverage mechanism, while accelerating information expression, also sows the seeds of liquidation cascades. Leverage amplifies informed traders' capacity for information expression, enabling a small amount of capital to produce a significant price impact, which is the core reason perpetual futures have become the price discovery leader. But it is also leverage that, when the market direction reverses, triggers the chain reaction of forced liquidation, producing a mechanical price impact unrelated to fundamental information. In the same way, 24/7 continuous trading lets information be priced continuously, but it also removes the buffers and shock absorbers of traditional financial markets, such as circuit-breaker halts, so that noise propagates without temporal interruption. Market participants cannot enjoy the extremely high expression efficiency of perpetual futures while being fully exempt from the interference of their mechanical noise. This inseparability is the essential feature of the microstructure of perpetual futures markets.
Having clarified the inherent laws and defects of price discovery as a natural process, the next chapter (Chapter 14) turns the perspective to the level of institutional intervention. Since the price signal of perpetual futures inevitably mixes in mechanical noise, how can market architects filter this noise, guard against market manipulation, and provide a reliable price benchmark for the entire crypto derivatives ecosystem by constructing infrastructure such as the index price, the mark price, and oracles? This is precisely the logical progression from "price discovery" to "price benchmark": the former describes how information is spontaneously incorporated into price, while the latter explores how institutions actively purify and anchor price.
References
[1] Chainalysis. (2025). Bybit hack: Leveraging transparency for collaboration in the wake of record-breaking theft. https://www.chainalysis.com/blog/bybit-exchange-hack-february-2025-crypto-security-dprk/
[2] Liu, A. (2025, February 21). Bybit's \$1.4 billion ETH hack: Market impact and future implications. Forbes. https://www.forbes.com/sites/aliceliu/2025/02/21/bybits-14-billion-eth-hack-market-impact-and-future-implications/
[3] Kaiko Research. (2025). Bybit hack by the numbers. https://research.kaiko.com/insights/bybit-hack-by-the-numbers
[4] Hasbrouck, J. (1995). One security, many markets: Determining the contributions to price discovery. The Journal of Finance, 50(4), 1175–1199. https://doi.org/10.1111/j.1540-6261.1995.tb04054.x
[5] Kyle, A. S. (1985). Continuous auctions and insider trading. Econometrica, 53(6), 1315–1335. https://doi.org/10.2307/1913210
[6] Glosten, L. R., & Milgrom, P. R. (1985). Bid, ask and transaction prices in a specialist market with heterogeneously informed traders. Journal of Financial Economics, 14(1), 71–100. https://doi.org/10.1016/0304-405x(85)90044-3
[7] Silantyev, E. (2019). Order flow analysis of cryptocurrency markets. Digital Finance, 1, 191–218. https://doi.org/10.1007/s42521-019-00007-w
[8] Easley, D., López de Prado, M. M., & O'Hara, M. (2012). Flow toxicity and liquidity in a high-frequency world. The Review of Financial Studies, 25(5), 1457–1493. https://doi.org/10.1093/rfs/hhs053
[9] Alexander, C., Choi, J., Park, H., & Sohn, S. (2020). Price discovery in Bitcoin: The impact of unregulated markets. Journal of Financial Stability, 50, 100776. https://doi.org/10.1016/j.jfs.2020.100776
[10] Makarov, I., & Schoar, A. (2020). Trading and arbitrage in cryptocurrency markets. Journal of Financial Economics, 135(2), 293–319. https://doi.org/10.1016/j.jfineco.2019.07.001
[11] Shleifer, A., & Vishny, R. W. (1997). The limits of arbitrage. The Journal of Finance, 52(1), 35–55.
[12] CoinGlass. (2025). CoinGlass 2025 crypto derivatives market annual report. https://www.coinglass.com/learn/2025-annual-report-en
[13] Ruan, Q., & Streltsov, A. (2024). Perpetual futures contracts and cryptocurrency market quality. Cornell SC Johnson College of Business.
[14] CryptoQuant. (2026, March). Binance futures/spot ratio hits 1.5-year high. https://cryptoquant.com/insights/quicktake/69b158571d8c7d419887fc10-Binance-FuturesSpot-Ratio-Hits-15-Year-High
[15] Jung, J. H. (2024). Can funding rate predict price change? Presto Research. https://www.prestolabs.io/research/can-funding-rate-predict-price-change
[16] Gonzalo, J., & Granger, C. W. J. (1995). Estimation of common long-memory components in cointegrated systems. Journal of Business & Economic Statistics, 13(1), 27–35. https://doi.org/10.1080/07350015.1995.10524576
[17] Putniņš, T. J. (2013). What do price discovery metrics really measure? Journal of Empirical Finance, 23, 68–83.
[18] Cosenza, R., & Stalder, S. (2024). Where is the price of Bitcoin determined? Price discovery in a fragmented market (SSRN Working Paper). https://papers.ssrn.com/sol3/papers.cfm?abstract_id=5070964 https://doi.org/10.2139/ssrn.5070964
[19] Entrop, O., Frijns, B., & Seruset, M. (2020). The determinants of price discovery on Bitcoin markets. Journal of Futures Markets, 40(5), 816–837. https://doi.org/10.1002/fut.22101
[20] Dimpfl, T., & Peter, F. J. (2021). Nothing but noise? Price discovery across cryptocurrency exchanges. Journal of Financial Markets, 54, 100584. https://doi.org/10.1016/j.finmar.2020.100584
[21] Greco, A. (2025, October). October 10–11, 2025: Anatomy of the largest crypto flash crash. Medium. https://medium.com/@Alessandro_Greco/october-10-11-2025-anatomy-of-the-largest-crypto-flash-crash-and-what-it-teaches-engineers-risk-49ea96b6d1c2
[22] Brunnermeier, M. K., & Pedersen, L. H. (2009). Market liquidity and funding liquidity. The Review of Financial Studies, 22(6), 2201–2238. https://doi.org/10.1093/rfs/hhn098
[23] Gornall, W., Rinaldi, M., & Xiao, Y. (2024). Perpetual futures and basis risk: Evidence from cryptocurrency (AEA Conference Paper). https://www.aeaweb.org/conference/2026/program/paper/ByyFEfr4
[24] CryptoNews. (2026). Bitcoin funding rates just flashed one of the bleakest signals. https://cryptonews.net/news/bitcoin/32527016/
[25] Bybit Help Center. (2025). Mark price calculation. https://www.bybit.com/en/help-center/article/Mark-Price-Calculation-Perpetual-Contracts
[26] FTI Consulting. (2025). The crypto crash of October 2025: When leverage met liquidity. https://www.fticonsulting.com/insights/articles/crypto-crash-october-2025-leverage-met-liquidity
[27] Multicoin Capital. (2020, March 17). March 12: The day crypto market structure broke (Part 1). https://multicoin.capital/2020/03/17/march-12-the-day-crypto-market-structure-broke/
[28] Bitwise Asset Management. (2019). Presentation to the U.S. Securities and Exchange Commission: Analysis of Bitcoin spot trading volume.
[29] Cong, L. W., Li, X., Tang, K., & Yang, Y. (2023). Crypto wash trading. Management Science, 69(11), 6427–6454. https://doi.org/10.1287/mnsc.2021.02709
[30] Le Pennec, G., Fiedler, I., & Ante, L. (2021). Wash trading at cryptocurrency exchanges. Finance Research Letters, 43, 101982.
[31] Chainalysis. (2025). Market manipulation: Suspected wash trading in cryptocurrency markets.
[32] Kraken. (2024). Crypto FOMO survey: 84% of crypto investors report making decisions driven by fear of missing out.
[33] Lo, A. W. (2004). The adaptive markets hypothesis. The Journal of Portfolio Management, 30(5), 15–29. https://doi.org/10.3905/jpm.2004.442611
[34] CoinGecko. (2026). Is the future of crypto perpetual? The meteoric rise of perp DEXs. https://www.coingecko.com/learn/rise-of-perpetuals-and-perp-dexs
[35] PinkBrains [@PinkBrains_io]. (2025, December). The big picture of perp DEXs in 2025 [Post]. X. https://x.com/PinkBrains_io/status/2030880808257667244
[36] Cointelegraph. (2025, December 4). Exclusive data from EigenPhi reveals that sandwich attacks on Ethereum have waned. https://www.tradingview.com/news/cointelegraph:fa12ba092094b
[37] Capponi, A., Jia, W., & Yu, S. (2025). Price discovery on decentralized exchanges (SSRN Working Paper). https://papers.ssrn.com/sol3/papers.cfm?abstract_id=4236993 https://doi.org/10.2139/ssrn.4236993
[38] Dropstab. (2025). How does Hyperliquid's L1 redefine on-chain trading? https://dropstab.com/research/crypto/what-is-hyperliquid
[39] Binance Square. (2025, September 20). In-depth analysis of perp DEX. https://www.binance.com/en/square/post/29943921066041
[40] Bitget. (2025, September 28). Aster, Hyperliquid, Lighter, EdgeX, and Jupiter Perpetuals. https://www.bitget.com/news/detail/12560604991584
[41] Chainlink. (2024). Threshold encryption: Security and privacy for Web3. https://chain.link/article/threshold-encryption-security-privacy-web3
[42] Lighter. (2026). Order book matching and liquidations with transparent and verifiable zero-knowledge proofs [White paper]. https://assets.lighter.xyz/whitepaper.pdf