On January 10, 2024, when news broke that the SEC had approved the first spot Bitcoin exchange-traded funds (ETFs), the price of Bitcoin swung violently within a single minute, as traders and algorithms around the world digested this historic decision at unprecedented speed. Yet after the initial spike, the market did not embark on the sustained rally that many had expected. Instead, within less than three days the price fell rapidly from a high near $49,000 to below $42,000, a textbook "buy the rumor, sell the news" move. During the same window in which the spot price gyrated, the perpetual futures market revealed a richer informational picture: the basis on BTC perpetual futures flipped from positive to negative within minutes; the funding rate ran through a full cycle from an extreme positive value back toward its mean over the settlement periods that followed; and open interest fell markedly within 48 hours. These dimensions, unique to perpetual futures, offer a microstructure perspective on informational efficiency that the spot market cannot provide. The episode crystallizes the complexity of informational efficiency in digital asset markets and raises a series of core questions. Why did the market react so quickly to a clear piece of regulatory approval, only to be dominated by behavioral biases over the following days? When a DeFi protocol is hacked, the attack is recorded publicly on the blockchain, so why do most investors learn what happened only hours later? Under the extreme stress of the FTX collapse, why did a price discovery mechanism that normally looked highly efficient come close to paralysis? Under the same shock, which reacts faster—perpetual futures or spot? How do design choices (funding rates, mark prices, liquidation mechanisms) systematically shape these differences? And do the funding rate and the basis themselves contain predictable information, constituting a structural gap in weak-form efficiency? The answers to all of these questions point to the same central issue: to what extent is the market "efficient"?
This question is not new. It runs through half a century of research in finance. Ever since Fama (1970) proposed the efficient market hypothesis, scholars and practitioners have continued to debate it. In the context of digital assets, however, this classic question takes on new analytical dimensions. The previous two chapters established the key foundations for understanding how markets operate. Chapter 13 dissected the micro-level process of price discovery, showing how information is gradually incorporated into prices through the interaction of order flow, market makers, and arbitrageurs. Chapter 14 examined the governance of price benchmarks, showing how the index price and the mark price provide an anchoring reference for the market. Those two chapters answered the questions of "how prices form" and "how prices are measured." This chapter builds on them to ask a more fundamental question: to what extent do these price-formation and price-measurement mechanisms actually reflect information efficiently? In other words, we move from the microstructural "how it is done" to the macro-level "how well it is done."
This chapter takes perpetual futures as its primary data source and institutional sample, organizing the analysis around weak-form efficiency, semi-strong-form efficiency, institutional efficiency, and extreme-stress testing. The analysis begins from the classic efficient market hypothesis and its limitations in crypto markets, introduces the adaptive markets hypothesis, and constructs an "efficiency spectrum" framework built on five dimensions: time, asset, market tier, information type, and market state. On this foundation, the chapter uses statistical tools such as variance ratio tests and autocorrelation analysis to test weak-form efficiency; applies the event study method to compare how fast the market reacts to information with different processing costs; analyzes how the institutional design of perpetual futures creates predictable efficiency cycles; and, through the case of the FTX collapse, shows how market efficiency breaks down nonlinearly under extreme stress. Finally, the chapter takes a historical-evolutionary view of how crypto market efficiency has progressed from the frontier era to the regulated era, and summarizes the core findings and their practical implications.
15.1 The analytical toolkit
To judge whether a market is efficient, one first needs a precise set of conceptual tools and measurement standards. This section builds that analytical toolkit and lays the theoretical foundation for the empirical tests that follow. We begin from the efficient market hypothesis of Fama (1970), reviewing its classic three-part taxonomy and the structural limitations it exhibits in crypto markets; we then introduce the adaptive markets hypothesis of Lo (2004), which uses an evolutionary and behavioral lens to remedy the shortcomings of the static theory; and on that basis we propose this chapter's core analytical framework, the five-dimensional efficiency spectrum matrix, which turns efficiency from a binary label into a spectrum that can be measured continuously along five dimensions: time, asset, market tier, information type, and market state.
15.1.1 The efficient market hypothesis and crypto markets
Any serious discussion of market efficiency begins with the efficient market hypothesis (EMH), proposed by Fama (1970) in his landmark review [1]. The core proposition of the hypothesis is that in an informationally efficient market, asset prices fully and instantaneously reflect all available relevant information, so no market participant can consistently earn excess returns above the market average on the basis of existing information. EMH not only provided a theoretical cornerstone for asset pricing and portfolio theory but also shaped investment practice and financial regulation over the past half century. Fama (1970) divided market efficiency into three forms, from weak to strong, according to the breadth of the information set, and this classification remains the classic point of departure for testing market efficiency [1].
The first is weak-form efficiency, which assumes that current prices already fully reflect all historical trading data, including past price series, volumes, and other market-generated information. If a market is weak-form efficient, then any technical analysis based on historical price patterns—whether moving-average crossovers, the relative strength index, or candlestick patterns—will be unable to generate excess returns systematically. In that case, future price movements appear as an unpredictable "random walk," because the value of all historical information has already been fully exhausted in the current price. Tests of weak-form efficiency typically rely on statistical tools such as autocorrelation analysis and variance ratio tests, which are discussed in detail below.
The second is semi-strong-form efficiency, which goes further and assumes that prices reflect not only historical trading data but also all publicly available information. Here "public information" covers an extremely broad range, including corporate financial reports, macroeconomic data releases, changes in regulatory policy, news coverage, and even public discussion on social media. If this assumption holds, then even deep analysis of public information (that is, fundamental analysis) cannot consistently earn excess returns, because once information becomes public its value is instantly incorporated into the price. The classic test of semi-strong-form efficiency is the event study method, which assesses how fast and how completely the market reacts to new information by measuring the cumulative abnormal returns of an asset before and after a specific event. This method is applied systematically to crypto markets below.
The third and most stringent form is strong-form efficiency, which assumes that prices reflect all information, including inside information that has not yet been made public. In a strong-form efficient market, even insiders holding non-public information cannot gain an advantage. This assumption has long been regarded as too extreme even in traditional financial markets, because the very existence of insider-trading laws implies that inside information can indeed generate excess returns. In crypto markets, strong-form efficiency is likewise untenable: abnormal price movements before a token's listing and pre-emptive sell-offs by project teams both point to the significant role of inside information in price discovery.
In the early development of digital asset markets, the EMH framework, and especially its emphasis on informational transparency, seemed to align neatly with blockchain's "trustless" and "publicly verifiable" characteristics. As a public ledger, the blockchain in principle exposes the entire transaction history (the weak-form information set) and a great deal of protocol-state information (a kind of semi-strong-form information set) to all market participants. This unprecedented data transparency led many to expect that crypto markets could become an ideal testing ground for EMH, perhaps even reaching higher efficiency than traditional markets. As the market developed and academic research deepened, however, EMH's static, absolute assumptions proved to have clearly limited explanatory power for the many anomalies of crypto markets.
Empirical research has repeatedly shown that the efficiency of crypto markets is not a binary "yes" or "no" state but a continuous spectrum that varies with time, asset, and market conditions. Urquhart's (2016) early systematic tests of Bitcoin found significant evidence of weak-form inefficiency, but the inefficiency weakened in later subperiods, suggesting that efficiency was improving [2]; this marked the beginning of systematic research on crypto market efficiency (details in Section 15.2.2). A large body of subsequent research confirmed the time-varying nature of efficiency: Tran and Leirvik (2020) found that the efficiency of five major cryptocurrencies was generally low before 2017 and improved gradually thereafter [3], while the cross-sectional tests of Kang, Lee, and Park (2022) found that crypto markets remained predominantly inefficient, with only about 6% of the sample satisfying the weak-form efficiency hypothesis [4]. These seemingly contradictory conclusions precisely illustrate the limits of describing crypto market efficiency with a single static label.
A deeper challenge comes from recognizing the gulf between "information being public" and "information being incorporated into price." Blockchain transparency means that information is "publicly available," but this does not mean that the information has been "fully digested" by the market and reflected in prices. Azar, Olivas, and Sinha (2025), in a study at the Federal Reserve Bank of New York, used the hacks of DeFi protocols as a unique natural experiment to quantify this gulf precisely: roughly 36% of the total price decline occurred between the moment the attack was recorded on the blockchain (information became public) and the moment the news spread widely on social media (information became common knowledge) [5]. This structural efficiency gap, created by information processing costs, is deconstructed in greater depth in Section 15.3.3.
Table 15-1 summarizes the academic literature's main test results for the three forms of EMH in crypto markets, organized by information type and time scale.
| EMH form | Information set | Time scale | Asset class | Main test method | Representative findings | Representative literature |
|---|---|---|---|---|---|---|
| Weak-form | Historical prices and volume | Intraday (minute-level) | BTC/ETH | Variance ratio test, autocorrelation analysis | Major assets approximate a random walk at high frequency, with relatively high efficiency | Yi et al. (2023) [6] |
| Weak-form | Historical prices and volume | Daily | BTC | Variance ratio test, BDS test | Significantly inefficient early on; efficiency improved later but predictability persists | Urquhart (2016) [2]; Noda (2021) [7] |
| Weak-form | Historical prices and volume | Daily | Small- and mid-cap coins | Variance ratio test, calendar effect test | Pervasive significant weak-form inefficiency; calendar effects more pronounced | Tran & Leirvik (2020) [3] |
| Weak-form | Historical prices and volume | Weekly and above | BTC/ETH | Backtesting of momentum and reversal strategies | Medium-term momentum and long-term reversal effects present | Vidal-Tomás et al. (2019) [8] |
| Semi-strong-form | Macroeconomic and regulatory information | Event window (minutes to days) | BTC | Event study | Rapid reaction to standardized binary events; close to semi-strong-form efficient | ETF case in this chapter's introduction |
| Semi-strong-form | On-chain data and protocol events | Event window (hours to days) | DeFi tokens | Event study | Information processing costs cause significant lag; about 36% of the price move precedes the announcement | Azar et al. (2025) [5] |
| Strong-form | Including inside information | Event window | Various tokens | Detection of abnormal pre-listing returns | Widespread signs of insider trading; strong-form efficiency does not hold | Multiple industry reports |
Table 15-1. Summary of empirical tests of the three forms of EMH in crypto markets (Data source: compiled by the author based on [2][3][5][6][7][8])
As the table shows, the efficiency of crypto markets is highly heterogeneous. At the weak-form level, major assets are already close to efficient on high-frequency time scales, but significant predictability remains at lower frequencies and in small- and mid-cap assets. At the semi-strong-form level, the speed of reaction to different types of information varies enormously; standardized information is processed far faster than crypto-native on-chain information that requires complex interpretation. Strong-form efficiency scarcely holds in crypto markets at all: abnormal price movements before token listings and pre-emptive sell-offs by project teams both indicate the significant role of inside information in price discovery. Because testing strong-form efficiency already faces fundamental difficulties of data availability and legal definition even in traditional financial markets, and because crypto markets lack a standardized definition of insider trading and an enforcement framework, this chapter focuses on the systematic testing of weak-form and semi-strong-form efficiency, as these two levels both have more mature methodological tools and the most direct analytical value for understanding the institutional efficiency of perpetual futures. Strong-form efficiency is touched on indirectly in the analysis of the latent period in the FTX case (Section 15.5.1). This multilevel, multidimensional variation in efficiency is precisely what EMH's static framework struggles to capture in full, and it provides ample motivation for introducing a more explanatory theoretical framework.
15.1.2 The adaptive markets hypothesis
The challenge to EMH did not begin with crypto markets; it had been brewing within traditional finance for many years. The rise of behavioral finance, exemplified by the prospect theory of Kahneman and Tversky (1979), systematically revealed the cognitive biases pervasive in investor decision-making, such as loss aversion, overconfidence, and the anchoring effect. At the same time, a large body of empirical research uncovered anomalies in traditional markets that EMH struggled to explain, including the momentum effect, the value effect, calendar effects, and excess volatility. These findings created a seemingly irreconcilable gulf between EMH and behavioral finance: one side held that markets are rational, while the other held that markets are rife with irrational behavior.
The adaptive markets hypothesis (AMH) proposed by Lo (2004) was intended precisely to bridge this gulf [9]. AMH does not reject EMH wholesale; rather, it treats EMH as an extreme case that holds only under specific ideal conditions. Lo's (2004) core insight was to bring the evolutionary principles of biology—competition, adaptation, and natural selection—into the analysis of financial market behavior [9]. In the AMH framework, market participants are neither the perfectly rational economic agents assumed by EMH nor the systematically irrational individuals depicted by behavioral finance, but boundedly rational actors somewhere in between. They use heuristics to make decisions; these heuristics are effective in most situations but can produce systematic biases in specific environments. Crucially, these biases are not simply "errors" but adaptive strategies developed over the course of a long evolutionary process to cope with a complex environment.
The core propositions of AMH can be summarized as several interrelated claims. First, market efficiency is not a fixed attribute but a continuous variable that fluctuates with time and environment. A market may be highly efficient in some periods and deviate significantly from efficiency in others. Second, the level of market efficiency is jointly determined by the composition of participants, the intensity of competition, and the available profit opportunities. When a great deal of capital and intellectual resource pours in to chase a particular inefficiency, that inefficiency gradually disappears and the market moves toward efficiency along that dimension. Conversely, when the market encounters structural change or an external shock, the old equilibrium is broken and new inefficiencies emerge. Third, the influence of behavioral biases is not constant but depends on the market environment. In calm markets, rational arbitrage forces may be sufficient to offset the influence of behavioral biases; but under extreme stress, fear and greed may overwhelm rational analysis, causing market efficiency to fall sharply.
AMH provides a highly explanatory lens for understanding digital asset markets, and its applicability may even exceed that in traditional markets. Crypto markets are themselves a rapidly evolving ecosystem: their participant base has evolved from the original cypherpunks and tech enthusiasts, through the mass influx of retail speculators, to today's deep participation by professional market makers, quant funds, and large financial institutions. Their infrastructure has evolved from the unstable centralized exchanges of the early days to today's sophisticated derivatives platforms and decentralized trading protocols that support high-frequency trading. Their regulatory environment has evolved from a blank slate to a growing focus of global regulators. In an environment where participants, technology, and rules are all changing dramatically, treating efficiency as a fixed attribute is unrealistic.
Academic research provides strong empirical support for the applicability of AMH to crypto markets. Noda (2021) used a time-varying model based on generalized least squares to test directly the dynamic evolution of Bitcoin and Ethereum market efficiency [7]. The study found that the efficiency of both cryptocurrencies did change significantly over time, exhibiting a clear pattern of cyclical fluctuation, which aligns closely with AMH's core prediction about the time-varying nature of efficiency. Phases of rising efficiency were typically accompanied by increased institutional participation, improved trading infrastructure, and deepening liquidity, whereas phases of declining efficiency were often associated with market bubbles, extreme volatility, or major negative events. Tran and Leirvik (2020) further confirmed this finding, observing that crypto market efficiency was generally low before 2017 and improved gradually as the market matured, though this process was not monotonic but accompanied by cyclical setbacks [3]. Together, these findings indicate that crypto market efficiency, just as AMH predicts, is in a dynamic process of continual adaptation, competition, and evolution.
Figure 15-1 traces the theoretical evolution from EMH to AMH and then to this chapter's efficiency spectrum framework.
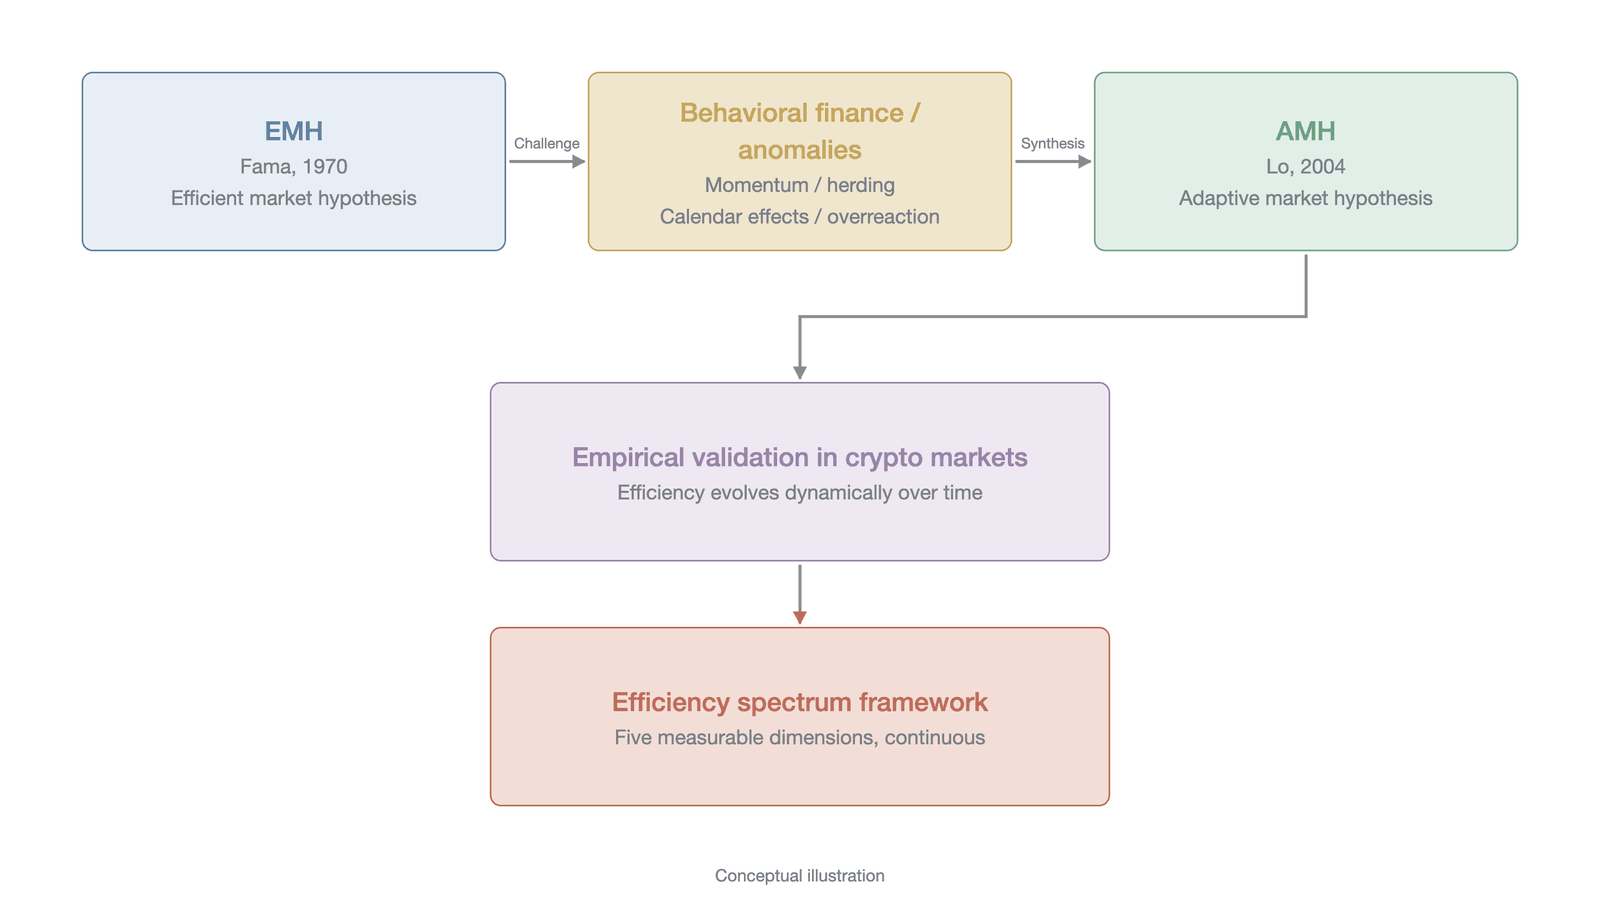
Figure 15-1. From EMH to AMH: the theoretical evolution
As the figure shows, EMH provided the classic classification framework for market efficiency; behavioral finance and market anomalies challenged it; Lo's (2004) AMH achieved a theoretical synthesis by introducing an evolutionary perspective; and empirical evidence from crypto markets further validated AMH's predictions. The efficiency spectrum framework proposed in this chapter operationalizes AMH's qualitative insights into a measurable, comparable, five-dimensional analytical tool.
15.1.3 The efficiency spectrum framework
Since EMH's static dualism is too rigid, and since AMH's dynamic evolutionary view offers the right way of thinking but leans toward macro narrative, we need a more operational analytical tool that turns AMH's deep insights into a measurable, comparable framework. To this end, this chapter proposes the efficiency spectrum as its core analytical framework. The central claim of the framework is that any statement about market efficiency is incomplete, or even misleading, if it is divorced from specific dimensional qualifications. We cannot assert in general terms that "the Bitcoin market is efficient" or that "crypto markets are inefficient"; we must specify precisely on which time scale, for which class of asset, for which type of information, and in which market state a given efficiency performance holds. The efficiency spectrum framework decomposes efficiency into five key dimensions—time, asset, market tier, information type, and market state—forming a multidimensional assessment matrix, as shown in Figure 15-2.
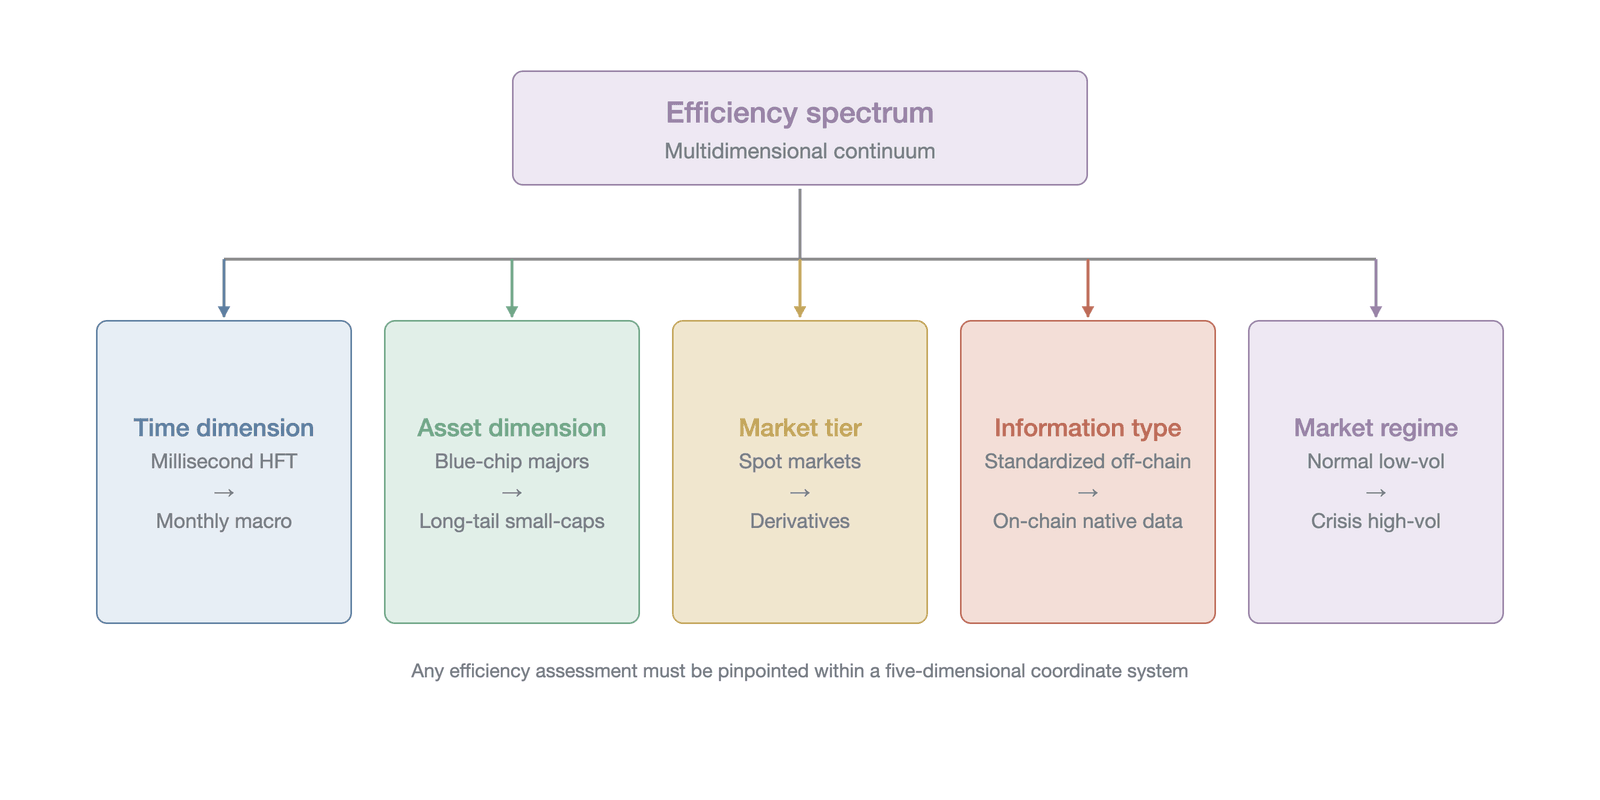
Figure 15-2. The five-dimensional efficiency spectrum matrix
As the figure shows, the five dimensions of the efficiency spectrum approach the assessment of efficiency from different angles and together constitute a complete analytical space. Any specific efficiency assessment can be located at a particular coordinate within this five-dimensional space. Each dimension is explained in turn below.
The time dimension: the efficiency gradient from milliseconds to months. Market efficiency can differ enormously across time frequencies, and this is the first key dimension of the efficiency spectrum. A market may approximate a random walk at the daily level, exhibiting relatively high weak-form efficiency, yet at the minute or even millisecond level, owing to microstructure factors—such as the limited depth of the order book, the friction created by trading fees, and delays in market makers' quote updates—it may contain fleeting predictable patterns that high-frequency strategies can capture. At the other end, on weekly and monthly time scales, medium- to long-term patterns such as momentum and mean reversion may also exist, although the persistence and economic significance of these patterns are themselves time-varying. In addition, crypto markets have their own institutional cycles, the most typical being the funding settlement cycle of perpetual futures, which creates predictable price behavior at specific points in time, as discussed in detail below. It is therefore essential to specify the time scale when discussing efficiency: intraday high frequency, daily, weekly, or a longer horizon.
The asset dimension: the efficiency gap from blue chips to the long tail. Different digital assets differ markedly in their level of efficiency, and this constitutes the second dimension of the efficiency spectrum. Bitcoin and Ethereum, as the two assets with the largest market capitalization, the deepest liquidity, the widest analyst coverage, and the deepest institutional participation, typically sit at the top of the crypto-asset efficiency spectrum. These two assets have the narrowest bid-ask spreads, the deepest order books, the most trading venues, and the most active arbitrage, all of which help improve price discovery. For mid-cap major coins, efficiency is typically lower than for Bitcoin and Ethereum because of relatively lower liquidity, insufficient information coverage, and fewer analytical tools. And for the vast universe of long-tail assets—including newly issued tokens, small-cap projects, and extremely illiquid trading pairs—markets often exhibit lower efficiency and more pronounced anomalies, such as wider spreads, slower reactions to information, and more frequent price manipulation. This efficiency gradient along the asset dimension follows a logic similar to the phenomenon in traditional equity markets whereby large-cap stocks are usually more efficient than small-cap stocks, but in crypto markets the gradient may be even steeper, given the far greater number of assets, more severe information asymmetry, and more uneven regulatory coverage.
The market-tier dimension: efficiency divergence from spot to derivatives. Even for the same underlying asset (such as Bitcoin), efficiency differs systematically across market tiers—spot, perpetual futures, dated futures, and options—and this constitutes the third dimension of the efficiency spectrum. The difference stems mainly from heterogeneity in participant composition, transaction costs, and leverage structure. Because the perpetual futures market offers very high leverage, the convenience of short-selling, and greater capital efficiency, it systematically attracts a large number of informed traders with information advantages and advanced analytical capabilities. This concentration of trader types means that perpetual futures exhibit faster information reflection and higher pricing efficiency than the spot market on many time scales. Yet the institutional designs unique to perpetual futures (such as the funding settlement mechanism, the mark-price smoothing mechanism, and the oracle update frequency) may also introduce additional friction and predictability at specific moments, forming a dimension of "institutional efficiency" that goes beyond the classic three-part EMH taxonomy—these are not about the speed of reaction to external information but about efficiency fluctuations endogenously created by the market's own rules. We treat the market tier as an independent dimension rather than a subordinate of the asset dimension because the efficiency difference for the same asset across tiers is often larger than the difference for different assets within the same tier, and the analytical logic is entirely different. This dimension recurs throughout the chapter: in Section 15.2 we compare the weak-form efficiency of spot and perpetual futures; in the event studies of Section 15.3 we construct a dual-market comparison to examine semi-strong-form efficiency; in Section 15.4 we dissect how the institutional design of perpetual futures creates predictable efficiency cycles; and in the FTX case of Section 15.5 we show how the efficiency advantage of a market tier can flip into systemic risk under extreme stress.
The information-type dimension: processing costs from standardized signals to complex on-chain data. This is the core dimension of the semi-strong-form efficiency test and one of the most distinctive analytical angles in crypto markets. The speed and degree of the price reaction to different types of public information differ systematically, and the root of these differences lies in differences in information processing costs. Information in crypto markets can be divided roughly into several tiers. The first tier is standardized macroeconomic data and clear regulatory decisions, such as a Federal Reserve rate decision or an SEC approval or rejection of an ETF. Such information is binary and easy to interpret, and the market usually reacts to it fastest, often completing the price adjustment within minutes or even seconds, as in the ETF case in the introduction. The second tier is crypto-native information that requires some expertise to interpret, such as a major protocol upgrade, the passage of a governance proposal, or a change to a token's economic model. Such information has a higher processing cost than the first tier, and the market's reaction is correspondingly slower. The third tier is complex on-chain data, such as the movement of funds by large addresses, anomalous interactions with smart contracts, or the exploitation of a vulnerability in a DeFi protocol. As Azar, Olivas, and Sinha (2025) reveal, although such information is publicly available on the blockchain, it requires highly specialized tools and knowledge to interpret; its processing cost is the highest, so the lag in the price reaction is also the most pronounced [5]. This dimension reveals a key insight: in crypto markets, "information being public" does not equal "information being incorporated into price," and information processing cost creates a structural hierarchy of information advantage, allowing participants with advanced analytical capabilities to capture information rents systematically.
The market-state dimension: the efficiency transition from normal conditions to crisis. The fifth dimension of the efficiency spectrum concerns the influence of the market's macro state on the level of efficiency. Market efficiency is not constant across all conditions but is highly dependent on the prevailing environment, exhibiting significant state dependence. Market states can be divided roughly into several typical modes. Under the "normal" state—ample liquidity and moderate volatility—competition is intense, arbitrage is active, and efficiency is typically at a high level. Under a "stressed" state induced by an external shock, such as the global market panic triggered by the COVID-19 pandemic in March 2020 (crypto's "Black Thursday"), liquidity contracts rapidly, market makers withdraw quotes, cross-exchange spreads widen sharply, and market efficiency declines significantly. More extreme still is the "decay" state induced by an internal collapse of trust: the collapse of the FTX exchange is a typical case, in which, once participants developed fundamental doubts about the solvency of their counterparties, liquidity did not merely contract but could evaporate entirely, the price discovery mechanism was nearly paralyzed, and market efficiency collapsed nonlinearly and sharply. This dimension is analyzed in depth in the FTX case study below. The process of recovery after a crisis deserves equal attention: the market usually does not return immediately to its pre-crisis efficiency level but passes through a "recovery" state of gradually rebuilding trust and liquidity, and the speed and completeness of this process are themselves important measures of market resilience.
In sum, the five dimensions of the efficiency spectrum—time, asset, market tier, information type, and market state—together constitute a complete toolkit for analyzing informational efficiency in digital asset markets. It discards the simple label of "efficient or inefficient" and treats efficiency as a continuous, multidimensional, dynamically changing spectrum. The value of this framework lies not only in its descriptive accuracy but also in its operational guidance: when we assess the feasibility of a trading strategy, we must specify the efficiency dimensions on which the strategy relies—on which time scale, for which class of asset, at which market tier, exploiting which type of information's inefficiency, and in which market state is it effective? Only by locating a strategy precisely within this five-dimensional coordinate system can we make meaningful judgments about its expected returns and risks. In the sections that follow, we use this framework to conduct systematic empirical tests of the weak-form and semi-strong-form efficiency of crypto markets, dissect the institutional efficiency of perpetual futures, and, through the FTX collapse, show the nonlinear behavior of efficiency under extreme conditions.
15.2 Testing weak-form efficiency
Within the efficiency spectrum framework established above, we begin with the most basic level of testing for digital asset markets: weak-form efficiency. The weak-form efficient market hypothesis defined by Fama (1970) holds that current asset prices already fully reflect all historical price and volume information [1]. If this hypothesis holds, then any technical analysis based on historical price patterns is futile, because the future path of prices appears as an unpredictable random walk. In other words, can past prices predict future prices? This question is the starting point of research on market efficiency and a basic yardstick for the maturity of a market.
The core argument of this section is that the weak-form efficiency of digital asset markets exhibits significant heterogeneity and dynamic evolution. For major assets such as Bitcoin and Ethereum, efficiency has strengthened significantly over time, approaching a random walk on high-frequency scales such as intraday; yet on longer time scales, momentum and reversal effects can still be detected, and for emerging long-tail assets, predictable price patterns are more prevalent. More importantly, these patterns are not fixed; their full life cycle—emergence, exploitation, and gradual weakening and even disappearance—provides direct empirical evidence for the adaptive markets hypothesis discussed in the previous section. The market is not statically stuck in a binary "efficient" or "inefficient" state but continually evolves in a dynamic process driven by participants' ongoing learning, competition, and adaptation. This section first introduces the core methodological tools for testing weak-form efficiency, then presents the empirical results for major assets, and, drawing on three concrete cases—perpetual-futures-native variables, calendar effects, and cross-exchange arbitrage—dissects the complex picture of weak-form efficiency in digital asset markets.
15.2.1 Testing methodology
The most direct way to test weak-form market efficiency is to analyze the statistical properties of the time series of asset returns. If the market is weak-form efficient, then the log-return series of an asset should exhibit no significant autocorrelation—that is, there should be no systematic linear relationship between returns at any lag and current returns. Positive autocorrelation implies a momentum effect: past rises foreshadow future rises, and past declines foreshadow future declines, which provides a theoretical basis for trend-following strategies. Negative autocorrelation implies a mean-reversion effect: past rises foreshadow future declines and vice versa, which creates opportunities for reversal strategies. Whether positive or negative, significant autocorrelation constitutes a departure from the random walk hypothesis and may offer traders systematic profit opportunities.
In practice, researchers typically compute the autocorrelation coefficients of a return series at multiple lags and use the Ljung-Box Q-statistic to jointly test whether these coefficients are collectively significantly different from zero. Simple autocorrelation analysis has limitations, however. The heteroskedasticity pervasive in financial time series—that is, volatility that itself varies over time—can bias the estimated standard errors of the autocorrelation coefficients and thereby undermine the reliability of the test. Moreover, the autocorrelation coefficient at a single lag captures only the linear dependence at a specific frequency and struggles to characterize the predictability of the return series across different time scales.
It was precisely to overcome these limitations that Lo and MacKinlay (1988) proposed the variance ratio test, which became the classic method for testing the random walk hypothesis [10]. The core idea of the variance ratio test rests on a concise yet profound mathematical property: if a time series is a pure random walk, then the variance of its -period return should be exactly times the variance of the one-period return. This is because, under the random walk assumption, price increments in each period are independent and identically distributed, and the variance of a multi-period return equals the sum of the variances of the individual periods. The variance ratio VR(q) is therefore defined as:
where is the variance of the -period return and is the variance of the one-period return. Under the null hypothesis of a random walk, the theoretical value of VR(q) should be 1. If VR(q) is significantly greater than 1, the return series exhibits positive autocorrelation—price changes are persistent, past trends tend to continue—which is the statistical fingerprint of a momentum effect. If VR(q) is significantly less than 1, there is negative autocorrelation—price changes are reversing, past extreme moves tend to be corrected—which is evidence of a mean-reversion effect.
The variance ratio test has several advantages over simple autocorrelation analysis. By comparing the variance relationships of returns across different time scales, it can capture predictable patterns at multiple frequencies simultaneously, rather than focusing only on a single lag. More importantly, Lo and MacKinlay (1988) provided test statistics under both homoskedasticity and heteroskedasticity assumptions, the latter (usually denoted ) being robust to the volatility clustering pervasive in financial time series [10]. In subsequent methodological developments, Chow and Denning (1993) proposed a joint variance ratio test that allows researchers to test the random walk hypothesis across multiple holding periods simultaneously, avoiding the multiple-testing problem [11]. Wright (2000) proposed nonparametric variance ratio tests based on ranks and signs, further enhancing robustness to non-normal distributions [12]. These methodological advances have made the variance ratio test a powerful and broadly applicable toolkit for testing weak-form efficiency.
Even these improved methods, however, face distinctive challenges when applied to digital asset markets. The return distributions of crypto assets such as Bitcoin generally exhibit pronounced leptokurtosis and fat tails. Yi, Yang, Jeong, Sohn, and Ahn (2023), in their study of Bitcoin market efficiency, reported that the excess kurtosis of Bitcoin daily returns was as high as 42.5, far exceeding the assumption of a normal distribution [6]. This extreme non-Gaussian character means that even heteroskedasticity-robust test statistics may see the accuracy of their asymptotic distribution approximations degraded, reducing the statistical power of the test or causing the probability of a Type I error to deviate from its nominal level.
A more fundamental challenge is that, just as the adaptive markets hypothesis predicts, market efficiency is itself time-varying. Using a single test statistic covering the entire sample period, however methodologically elegant, may mask the dynamic changes in efficiency across different phases of the market. A market that is "on average" close to a random walk over the full sample period may exhibit strong momentum during bull markets and mean reversion during bear markets. These two patterns may offset each other in a full-sample test, yielding a misleading conclusion of "market efficiency." Combining rolling-window analysis to examine the temporal evolution of metrics such as the variance ratio has therefore become a key methodological strategy for capturing the market's adaptive learning process. Noda (2021) made an important contribution in this direction, using a time-varying model based on generalized least squares (GLS) to measure the dynamic evolution of cryptocurrency market efficiency rather than delivering a static, black-and-white conclusion [7]. This methodological shift, from "is the market efficient?" to "when, and to what extent, is the market efficient?", is precisely the methodological reflection of the adaptive markets hypothesis in empirical research.
Table 15-2 summarizes the core features and applicable conditions of the methods commonly used in weak-form efficiency tests.
| Test method | Core principle | Advantages | Limitations | Representative literature |
|---|---|---|---|---|
| Autocorrelation test and Ljung-Box Q | Tests whether the autocorrelation coefficients of the return series at each lag are zero | Intuitive and easy to compute | Sensitive to heteroskedasticity; captures only linear dependence | Box & Pierce (1970) [13] |
| Lo-MacKinlay variance ratio test | Compares the ratio of multi-period to single-period return variance | Provides a heteroskedasticity-robust statistic; multi-frequency information | Single holding-period test; asymptotic theory requires large samples | Lo & MacKinlay (1988) [10] |
| Chow-Denning joint variance ratio test | Tests the random walk across multiple holding periods simultaneously | Controls for the multiple-testing problem | Still relies on the asymptotic distribution | Chow & Denning (1993) [11] |
| Wright rank- and sign-based variance ratio test | Replaces raw returns with ranks or signs | Highly robust to non-normal distributions | Statistical power may be lower than parametric methods | Wright (2000) [12] |
| BDS test | Tests whether the return series is independently and identically distributed | Can capture nonlinear dependence | Sensitive to series length; does not indicate the direction of departure | Brock, Dechert, Scheinkman & LeBaron (1996) [14] |
| Rolling-window variance ratio | Recomputes the variance ratio within a moving time window | Captures the time-varying nature of efficiency | Window-size choice is subjective | Noda (2021) [7] |
Table 15-2. Comparison of weak-form efficiency test methods (Data source: compiled by the author)
As the table shows, no single method can test weak-form efficiency perfectly. In practice, scholars typically use a combination of methods to strengthen the robustness of their conclusions. For digital asset markets, given the extreme non-normality of return distributions and the time-varying nature of efficiency, a strategy that combines nonparametric methods (such as the Wright test) with rolling-window analysis is especially important.
15.2.2 The efficiency evolution of major assets
Digital asset markets, and Bitcoin in particular, offer a unique "natural experiment" for observing how an emerging market evolves from inefficient to efficient. Unlike traditional financial markets, which evolved slowly over decades or even centuries, the Bitcoin market underwent a dramatic transition from extreme inefficiency to near-weak-form efficiency in little more than a decade, a process compressed into a time window that can be observed and recorded in full.
Early academic research was almost unanimous that the Bitcoin market was inefficient. Urquhart (2016) conducted the first systematic weak-form efficiency test of Bitcoin, using a set of statistical tools including the autocorrelation test, the variance ratio test, and the BDS test [2]. Based on daily data from 2010 to 2016, his study found that Bitcoin returns departed significantly from a random walk and contained exploitable patterns. This conclusion was highly consistent with the microstructure of the market at the time: participants were mainly tech enthusiasts and early speculators, with professional market makers and institutional investors almost entirely absent; exchange infrastructure was weak, API stability poor, and order-book depth limited; and the lack of liquidity meant that large trades caused enormous price impact, while arbitrage was doubly constrained by technology and capital. In such a market environment, it is unsurprising that prices contained a great many predictable patterns.
Nonetheless, Urquhart's (2016) study already contained a noteworthy finding: when he split the sample into two subperiods, he found that the degree of inefficiency weakened in the later subperiod [2]. This subtle but important observation hinted that the market might be undergoing a process of improving efficiency. A large body of subsequent research confirmed this trend. Tran and Leirvik (2020) studied the five largest cryptocurrencies by market capitalization and found their efficiency levels to be highly time-varying, with the market generally inefficient before 2017 and efficiency improving thereafter [3]. Apopo and Phiri (2021) further distinguished efficiency across time frequencies, finding that Bitcoin daily returns largely satisfied the random walk hypothesis while weekly returns still exhibited significant predictability [15]. This finding aligns closely with the analysis of the "time dimension" in the efficiency spectrum framework proposed earlier: efficiency is not distributed uniformly across all frequencies but exhibits a gradient that declines from high to low frequency.
At high frequency, Aslan and Sensoy (2020) conducted a systematic study of the intraday efficiency of major cryptocurrencies and found that intraday efficiency exhibits a non-monotonic, U-shaped relationship with sampling frequency: efficiency is highest at the intermediate frequencies of 5 to 10 minutes and relatively lower at both the 1-minute high-frequency end and the 1-hour low-frequency end [16]. This means that microstructure noise at overly high frequencies and insufficient information aggregation at overly low frequencies can both create predictable patterns. Zhang, Chan, Chu, and Sulieman (2020) found that during bull markets the hourly returns of Bitcoin, Ethereum, and Litecoin exhibited random-walk characteristics, but efficiency declined significantly during bear markets [17]. This state dependence of efficiency—the level of market efficiency changing with the market environment (bull or bear, high or low volatility)—is one of the core predictions of the adaptive markets hypothesis.
Figure 15-3 computes the rolling variance ratios VR(5) and VR(10) of Bitcoin daily returns from 2016 to 2025, using a rolling window of 252 trading days (about one year)—which both aligns with the traditional-market standard of "one trading year" and ensures the asymptotic properties of the variance ratio statistic. In interpreting departures of the variance ratio, we use the Lo-MacKinlay heteroskedasticity-robust statistic and judge, at the 5% significance level, whether deviates significantly from 1.0. The VR evolution trend in this chapter's figure is consistent in direction with the full-sample test conclusions in the literature (such as Urquhart (2016) [2] and Noda (2021) [7]), but rolling-window analysis has some sensitivity to window size, and the magnitude of VR fluctuations may differ under different settings.
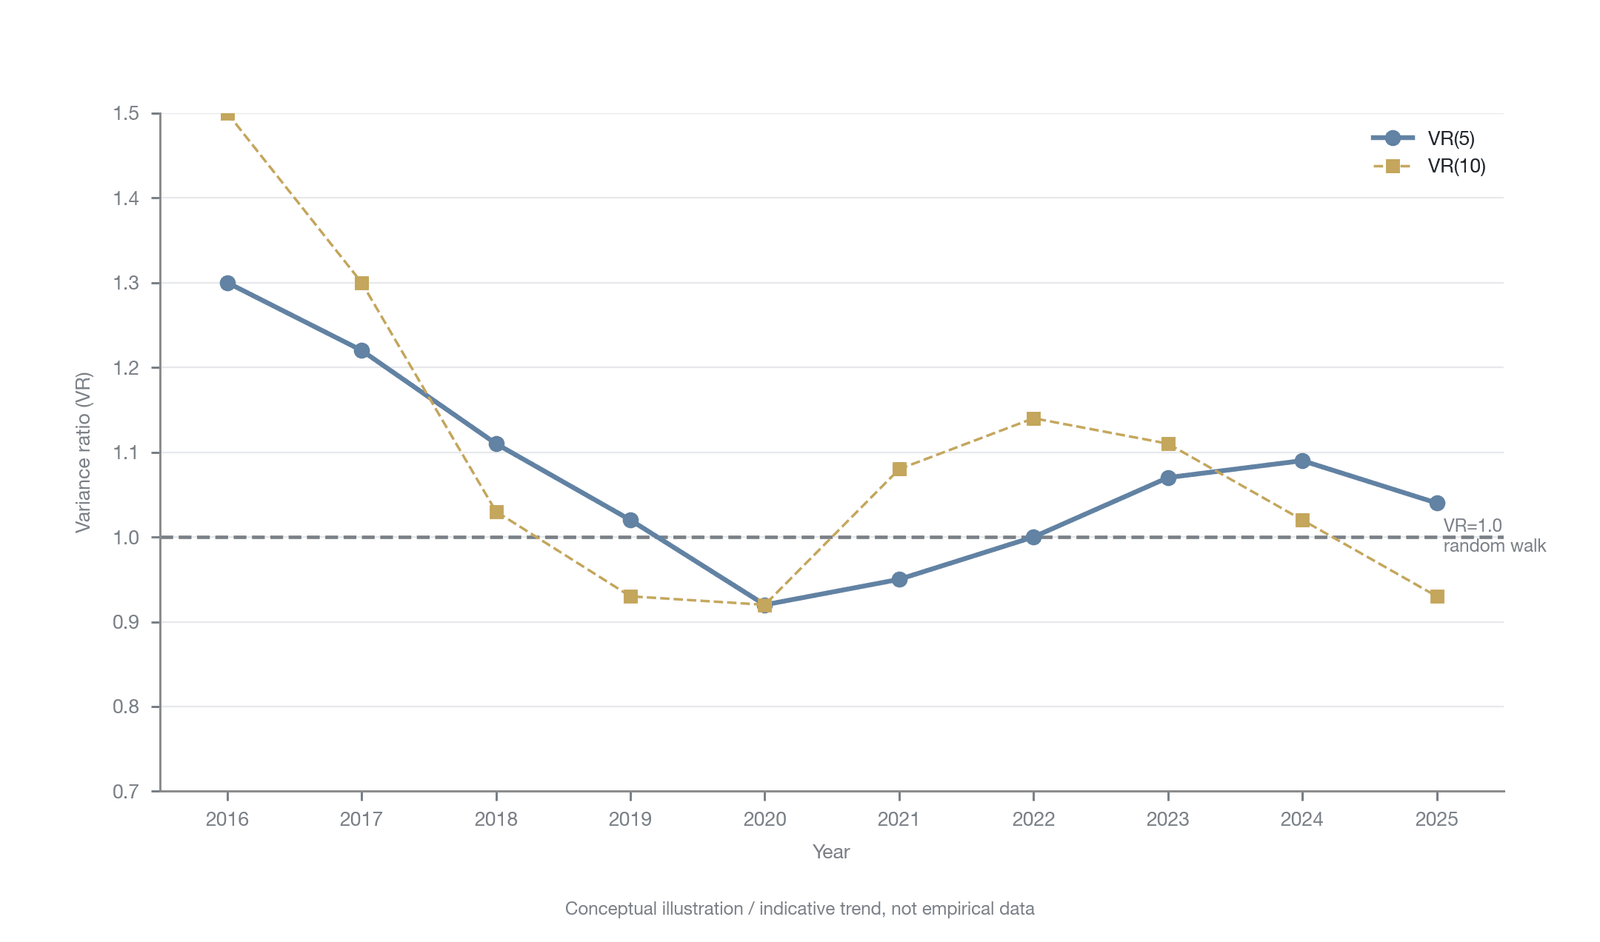
Figure 15-3. The temporal evolution of the BTC variance ratio
Figure 15-3, based on BTC/USD daily return data from major spot exchanges (Coinbase, Binance, and others), exhibits several key features. During the initial coin offering (ICO) bubble and bull market of 2017, VR values were persistently and significantly above 1, reflecting a strong momentum effect: "chasing the rally" dominated the market, and upward price trends had a self-reinforcing character. During this period, market participants were mainly retail speculators; information spread through social media and community word of mouth; and fear of missing out (FOMO) drove the continued climb in prices. The launch of CME Bitcoin futures in December 2017 was an important structural turning point: for the first time it gave institutional investors a standardized tool for shorting Bitcoin, allowing bearish views to be incorporated into prices more effectively and thereby dampening the one-sided momentum effect to some extent.
When the market suffered severe shocks, the behavior of the variance ratio also changed significantly. During the "Black Thursday" crash of March 2020, VR values briefly fell below 1, showing the mean-reversion characteristic of a short-term oversold condition—that is, after panic selling the market quickly saw "bottom-fishing," and the extreme price decline was partly corrected. Notably, however, this crisis-period mean-reversion effect has been shrinking in both duration and magnitude, indicating that the market's self-correction mechanism is becoming more efficient.
The most striking long-term trend is the gradual narrowing of the range of variance ratio fluctuations. During 2016–2018, the range of VR(5) was roughly 0.7 to 1.5; by 2022–2025, this range had narrowed to about 0.85 to 1.15. The variance ratio increasingly falls within the "near-weak-form-efficient band" close to 1.0, indicating that consistently earning excess returns through simple historical price patterns is becoming increasingly difficult. The approval of U.S. spot Bitcoin ETFs in January 2024 further accelerated this trend: ETFs gave traditional financial institutions a convenient tool for Bitcoin exposure, and the influx of a large amount of professional capital significantly improved market depth and arbitrage efficiency.
As spot market efficiency improved, the derivative unique to digital asset markets—perpetual futures—exhibited a more complex efficiency profile. If we conduct rolling variance ratio analysis on the returns of BTC and ETH perpetual futures and form a "dual-track comparison" with the spot market, we find two distinct but internally consistent phenomena. On the one hand, at high frequency (minute-level), the variance ratio of perpetual futures is closer to 1.0 than that of spot—that is, more consistent with the random walk hypothesis. This is mainly because the perpetual futures market carries the vast majority of liquidity and price discovery functions, and informed traders and professional market makers are highly concentrated there, allowing new information to be digested more quickly. On the other hand, when we compute the variance ratio over the 8-hour cycle (the typical funding settlement cycle on major exchanges), perpetual futures exhibit a systematic departure from a random walk, whereas the spot market shows no comparable departure at this frequency. This departure is highly correlated with the periodic settlement of funding, suggesting that the distinctive institutional design of perpetual futures may endogenously create a new predictable pattern.
Noda's (2021) study provides a more rigorous econometric argument for this observation [7]. Using a GLS time-varying model that does not depend on sample size, he directly estimated the dynamic path of Bitcoin and Ethereum market efficiency. The study's three core findings align closely with our analysis. First, the efficiency of both cryptocurrencies did change significantly over time, exhibiting a clear pattern of cyclical fluctuation. Second, Bitcoin's efficiency level was higher than Ethereum's in most periods, consistent with Bitcoin's higher liquidity, longer trading history, and broader institutional participation. Third, more liquid markets evolved in efficiency faster, which provides empirical support for the proposition that "liquidity is the infrastructure of efficiency."
Nonetheless, even today, when efficiency has improved significantly, the Bitcoin market still exhibits detectable predictable patterns across days and on longer time scales. Zaremba, Bilgin, Long, Mercik, and Szczygielski (2021), using daily data on more than 3,600 cryptocurrencies, found a significant short-term reversal effect: the cryptocurrencies with the lowest returns on the previous day significantly outperformed those with the highest returns on the previous day [18]. They further argued that this daily reversal effect stems mainly from the low liquidity of the vast majority of cryptocurrencies, since the reversal effect is most pronounced in the least liquid assets. This finding is entirely consistent with the analysis of the "asset dimension" in the efficiency spectrum framework: major assets are far more efficient than long-tail assets, and liquidity is the key variable explaining this difference. Caporale and Plastun (2020) focused on the momentum effect following abnormal single-day returns and found that in Bitcoin, Ethereum, and Litecoin, large single-day moves were followed by a significant next-day continuation effect, though the strength of this effect weakened over time [19]. Bianchi, Guidolin, and Pedio (2023) examined the dynamics of return predictability in cryptocurrencies from a more macro perspective and found that the time-series predictability of cryptocurrencies was generally lower than that of traditional asset classes but showed a time-varying yet significant sensitivity to investor-attention metrics [20].
These findings form a complex but internally consistent empirical picture: major assets are already close to a random walk at high frequency, but at low frequency and among long-tail assets, predictable patterns still exist. The gradual weakening of these patterns is precisely the process by which market participants continually "consume" inefficiency through arbitrage and learning, and it provides direct empirical support for AMH.
15.2.3 Perpetual-futures-native variables
In traditional asset pricing theory, weak-form efficiency focuses mainly on the ability of historical prices to predict future prices. The core derivative of digital asset markets, however—perpetual futures—introduces a set of entirely new native variables, the most central of which are the funding rate and the perpetual–spot basis. The existence of these variables provides a new dimension for testing weak-form efficiency: do the native signals of these derivatives markets contain predictability about future spot or contract returns?
The funding rate was designed to anchor the perpetual futures price to the spot index price. When the perpetual futures price is above spot, the funding rate is positive and longs pay shorts; when it is below, the rate is negative. He, Manela, Ross, and von Wachter (2024) conducted a systematic empirical study of the fundamentals of perpetual futures. They found that the magnitude of the perpetual futures price's deviation from the spot price is significant, with annualized mean absolute deviations as high as 60% to 90% across different crypto assets [21]. More importantly, this deviation not only exists but is highly predictable. They constructed a simple arbitrage strategy: open a position when the deviation exceeds a certain threshold and close it when the deviation reverts. The study showed that during their sample period (2020 to 2022), even after accounting for the high transaction costs faced by retail investors, this strategy for Bitcoin perpetual futures could still generate a Sharpe ratio as high as 1.8; for high-frequency, active market makers, the Sharpe ratio could even reach 3.5 [21]. As the study also notes, however, as arbitrage capital increased and market competition intensified, the average magnitude of these deviations has been shrinking at a rate of about 11% per year, so the Sharpe ratios above may already be significantly lower in the current (post-2024) market environment. Even so, the existence of this predictability, even as its magnitude decays, still constitutes a structural challenge to the weak-form efficient market hypothesis.
The time-series characteristics of the basis (the difference between the perpetual futures price and the spot price) likewise exhibit significant predictable patterns. The empirical analysis of He et al. (2024) shows that past returns can significantly predict the future size of the basis, with high past returns often foreshadowing a larger perpetual futures premium, reflecting strong positive-feedback or momentum trading in the market [21]. This deviation does not expand without limit, however. Over time, the funding rate and basis deviations exhibit mean reversion, and in the later part of their sample, as arbitrage capital increased and market competition intensified, the average magnitude of these deviations showed a declining trend of about 11% per year [21].
Within the efficiency spectrum framework, how should we position this predictability arising from perpetual-futures-native variables? On the one hand, such high Sharpe ratios and persistent arbitrage opportunities seem to be compelling evidence of "weak-form inefficiency." They indicate that the market contains information that has not been fully digested, or that the arbitrage mechanism is severely obstructed. On the other hand, we can also understand it as an "institutional-friction premium." Perpetual futures have no expiration date, so when conducting basis arbitrage the arbitrageur cannot know when the position can be closed profitably; this "random maturity" character introduces additional liquidity risk and capital-occupation cost. In addition, differences in margin requirements and liquidation mechanisms across exchanges, as well as the tail risks unique to crypto markets (such as exchange failures), all constitute limits to arbitrage. This predictability may therefore not be a pure "free lunch" but compensation for the arbitrageurs who bear these complex frictions and tail risks. As market infrastructure improves (such as the spread of unified accounts and the establishment of cross-exchange clearing mechanisms), this "friction premium" is being gradually compressed, which again confirms the view of dynamically evolving efficiency in the adaptive markets hypothesis.
These seemingly generous arbitrage profits nonetheless require a more prudent risk assessment. The Sharpe ratios reported by He et al. (2024) are computed from the standard deviation of returns, but as the chapter will show later, the distribution of funding rates exhibits significant negative skew and excess kurtosis, which means the Sharpe ratio systematically understates tail-risk exposure. In practice, funding-rate arbitrage requires a trader to hold a spot long on one exchange and a perpetual futures short on another; the resulting cross-exchange margin lock-up typically means that the actual capital committed is two to three times the notional position, and a Sharpe ratio computed on actual capital committed rather than notional position would be significantly lower than the figures above. Moreover, exchange counterparty risk constitutes the tail risk hardest to hedge in this strategy. The collapse of FTX left many arbitrageurs' funds trapped in a bankrupt exchange, a loss entirely invisible in the conventional Sharpe ratio calculation. Zhivkov's (2026) empirical analysis of cross-exchange funding-rate arbitrage further confirms the severity of these frictions: although 17% of the observed sample exhibited an economically significant arbitrage spread, in a simulated delta-neutral portfolio as many as 95% of the trading opportunities could not be fully executed because of margin requirements and forced liquidations [22]. The excess returns created by the predictability of the funding rate may therefore reflect compensation for bearing these complex frictions and tail risks rather than a costless exploitation of market inefficiency.
15.2.4 The discovery and disappearance of calendar effects
Calendar effects are one of the most classic illustrations of weak-form market inefficiency. They refer to the phenomenon whereby asset returns exhibit systematic regularities across specific time units (such as day of the week, month, or holiday). In traditional equity markets, researchers long documented anomalies such as the "Monday effect" (Monday returns significantly lower than other trading days) and the "January effect" (January returns significantly higher than other months). The existence of these effects directly violates the random walk hypothesis, because they offer simple trading strategies based on time information: if Monday returns are systematically lower than other days, an investor need only buy at Monday's close and sell on other days to earn excess returns.
For a digital asset market that trades continuously, seven days a week, 24 hours a day, year-round, the study of calendar effects has special significance. Some calendar effects in traditional markets stem from institutional factors (such as the accumulation of information over a weekend market closure and month-end fund-rebalancing needs), and the continuous-trading nature of crypto markets eliminates these institutional frictions. If calendar effects are still observed in such a market, their cause is more likely related to participants' behavioral patterns than to institutional arrangements. More importantly, the rapid evolution of crypto markets offers an ideal window for observing the full life cycle of a calendar effect (from discovery to disappearance), a process that in traditional markets might take decades to complete.
Early research on the Bitcoin market did find some significant calendar effects. The study by Caporale and Plastun (2019) was an important contribution to this area; using parametric and nonparametric methods to systematically test the day-of-the-week effect in Bitcoin, they found an abnormal positive return on Mondays [23]. This finding is striking because its direction is exactly opposite to the "Monday effect" (negative returns) observed in traditional equity markets. The researchers speculated that this might be related to the behavioral patterns of crypto market participants: retail investors tend to conduct research and make decisions over the weekend and execute their buys on Monday, thereby pushing up Monday prices. Aharon and Qadan (2019) found a significant "Monday effect" in Bitcoin in both returns and volatility [24].
According to the logic of the adaptive markets hypothesis, once such a predictable pattern is discovered by academic research and made public, the entry of arbitrageurs will gradually cause it to disappear. The logical chain of this prediction is clear and intuitive: after academic papers are published, traders and quant funds notice the pattern; they begin to buy on the expected low-return days and sell on the high-return days; these trades themselves flatten the return differences across days; and as more and more participants join the strategy, the profit space of the calendar effect is gradually compressed until it disappears entirely. This process is essentially a transmission chain in which information moves from "private knowledge" to "public knowledge" and then to "priced in," and it is also the micro-mechanism by which market efficiency improves through competition and learning.
Figure 15-4 analyzes the average daily returns of Bitcoin by day of the week across different periods, illustrating this adaptive learning process.
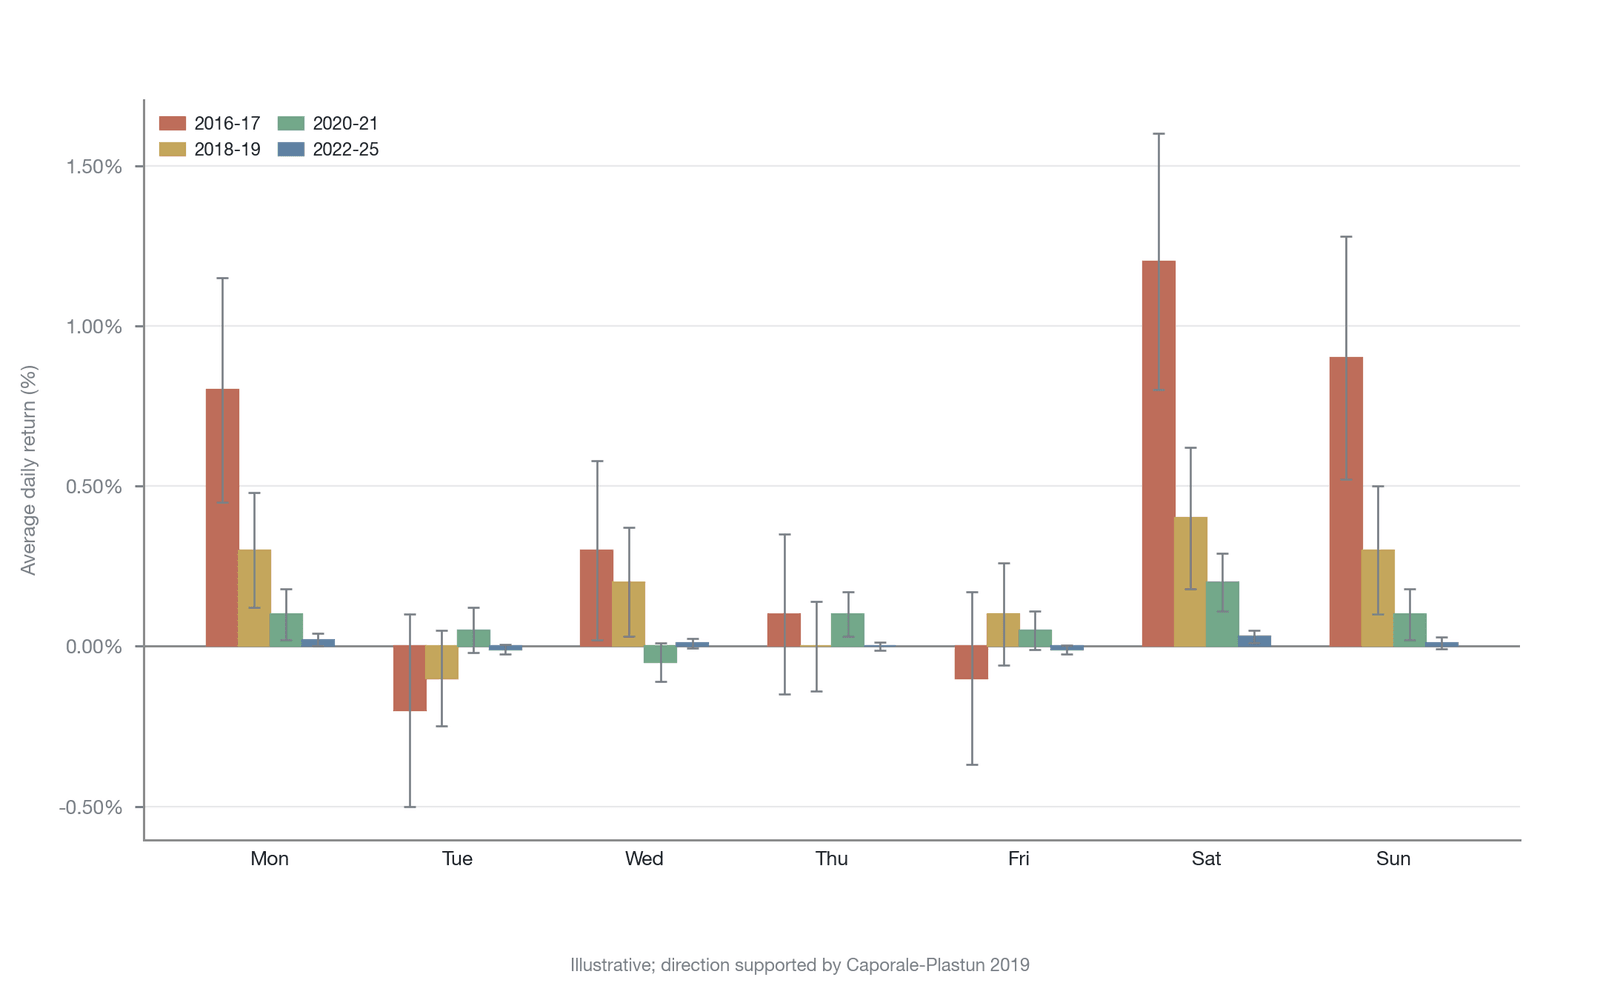
Figure 15-4. The discovery and disappearance of the BTC calendar effect (day-of-the-week effect)
Figure 15-4, based on BTC/USD daily return data from Coinbase and Binance, shows the average daily returns of Bitcoin by day of the week, along with their 95% confidence intervals (based on t-tests), across different periods. The figure reveals a clear pattern of temporal evolution. In the early stage of 2016–2017, there were significant differences in average returns across days of the week: weekend (Saturday and Sunday) average returns were clearly positive and sizable, while returns on some weekdays were relatively low or even negative. This difference constituted a potentially exploitable "weekend effect." Entering the bear-market cycle of 2018–2019, the return differences across days still existed but had clearly narrowed, and their statistical significance declined. By the bull-market cycle of 2020–2021, although overall market volatility increased, the systematic pattern of the day-of-the-week effect had become blurred. The most striking change appeared during 2022–2025: the average returns on all days were very close to zero, the differences across days were no longer statistically significant, and the 95% confidence intervals mostly covered zero. The day-of-the-week effect, once an exploitable "market anomaly," had essentially disappeared.
In crypto markets, however, beyond the day-of-the-week effect in the traditional sense, there is a distinctive "calendar effect" endogenous to the institutional design of perpetual futures: the "8-hour cycle effect" based on the funding settlement cycle. Major cryptocurrency exchanges (such as Binance, OKX, and others) typically settle funding once every 8 hours (for example, at 0:00, 8:00, and 16:00 Beijing time). Just before settlement, many traders choose to close positions briefly to avoid paying a high funding fee, causing prices to fluctuate in a regular way around settlement. This fluctuation pattern is not driven by fundamental information but is created purely by market microstructure and institutional design.
Unlike the day-of-the-week effect, which has been almost entirely arbitraged away, this "8-hour cycle effect"—a perpetual-futures-native calendar effect—has not yet been fully arbitraged out. The reason is that arbitraging this effect requires high-frequency opening and closing of positions around settlement, which faces very high slippage costs and trading-fee friction. In addition, the moment of settlement is often accompanied by violent microstructure fluctuations, which increases the execution risk of the arbitrage strategy. The persistence of this native calendar effect therefore again confirms the key role of institutional friction in preventing the market from becoming fully weak-form efficient.
The timeline of this evolutionary process aligns closely with the structural changes in crypto markets. The years 2017–2018 were precisely when academic research on calendar effects in crypto markets was published intensively, and these findings spread rapidly to the trader community through academic conferences, financial media, and social networks. At the same time, professional quantitative trading firms and market makers began to enter crypto markets on a large scale, with the technical capability and capital to identify and exploit such statistical anomalies systematically. The combined effect of these forces meant that the calendar effect was effectively "arbitraged away" within a few years of being discovered.
Notably, the disappearance of the calendar effect does not mean that the market has become fully efficient across all time dimensions. More precisely, it illustrates that simple trading patterns—based on public information and easily replicated by a large number of participants—struggle to persist in an increasingly competitive market. This is precisely the core insight of the adaptive markets hypothesis: market efficiency is not a static attribute but a dynamic equilibrium continually shaped by the collective behavior of participants. Once an inefficiency is widely recognized, competition eliminates it; but new inefficiencies may reappear under new market conditions. For example, under extreme market stress, behavioral biases may temporarily overwhelm rational arbitrage, causing the calendar effect to "revive" briefly. This cyclical fluctuation in efficiency is precisely the essential characteristic of crypto markets as a rapidly evolving ecosystem.
15.2.5 The convergence of cross-exchange spreads
Another important dimension for measuring weak-form market efficiency is the spatial unity of price discovery—that is, whether the law of one price holds. In a fully efficient market, the prices of the same asset at different trading venues should be identical after deducting reasonable transaction and transfer costs. Any significant spread represents a near-riskless arbitrage opportunity, and the activity of arbitrageurs quickly flattens these spreads. The size of cross-exchange spreads and the speed of their convergence can therefore serve as a comprehensive measure of the efficiency of the entire market infrastructure and the speed of information transmission. If we regard the time-series predictability discussed earlier as the "time dimension" of weak-form efficiency, then cross-exchange spreads represent the "spatial dimension" of weak-form efficiency, testing whether prices are consistent at the same moment across different locations.
In the early stage of digital asset markets, cross-exchange spreads were not only pervasive but also sizable. The root of this phenomenon lay in the superposition of multiple structural barriers. At the technical level, early exchanges had poor API performance and low system stability, while blockchain networks had long confirmation times (Bitcoin required about 10–60 minutes) and volatile fees, making cross-exchange asset transfers both slow and expensive. At the capital level, the absence of professional market makers and arbitrage funds meant there was no sufficient "price-correcting" force in the market. At the institutional level, regulatory differences and capital controls across jurisdictions further impeded cross-border arbitrage.
The compounded effect of these barriers was most fully embodied in the "Kimchi premium" phenomenon. The Kimchi premium refers to the fact that the price of Bitcoin on Korean exchanges (such as Upbit and Bithumb) was persistently and significantly higher than on other major global exchanges. At the bull-market peak from late 2017 to early 2018, this premium once approached 50% [25]. This meant that if a trader could buy one Bitcoin in the United States for $10,000 and then sell it in Korea for $15,000, they could earn a 50% "riskless" profit. Korea's strict capital controls (restricting foreign capital inflows into the Korean crypto market), however, together with the banking system's restrictions on crypto trading, made this seemingly simple arbitrage strategy face enormous execution barriers in practice. Beyond capital controls, the exchange-rate risk of denominating arbitrage profits in Korean won, the compliance hurdles of Korean exchanges requiring local bank accounts and real-name verification, and the multi-day bank processing time needed to repatriate funds all further limited the participation of external arbitrageurs. The existence of the Kimchi premium was essentially an inefficiency "protected" by institutional friction.
As the adaptive markets hypothesis predicts, however, high profits incentivize market participants to keep finding ways to circumvent the barriers. Arbitrageurs developed more sophisticated strategies, including cross-border fund transfers through over-the-counter channels, the use of stablecoins (such as USDT) as an intermediary medium to circumvent fiat-conversion restrictions, and the establishment of pre-positioned fund pools across multiple exchanges to reduce the time cost of asset transfers. At the same time, the industry's infrastructure iterated rapidly: exchange API performance and stability improved dramatically, supporting higher-frequency automated trading; blockchain scaling solutions (such as the Lightning Network and Layer 2 solutions) reduced the cost and time of transfers; and professional quantitative trading firms entered with advanced technology and ample capital, raising arbitrage efficiency to a new level.
Figure 15-5 depicts the evolution of two types of cross-exchange BTC spreads since 2014.
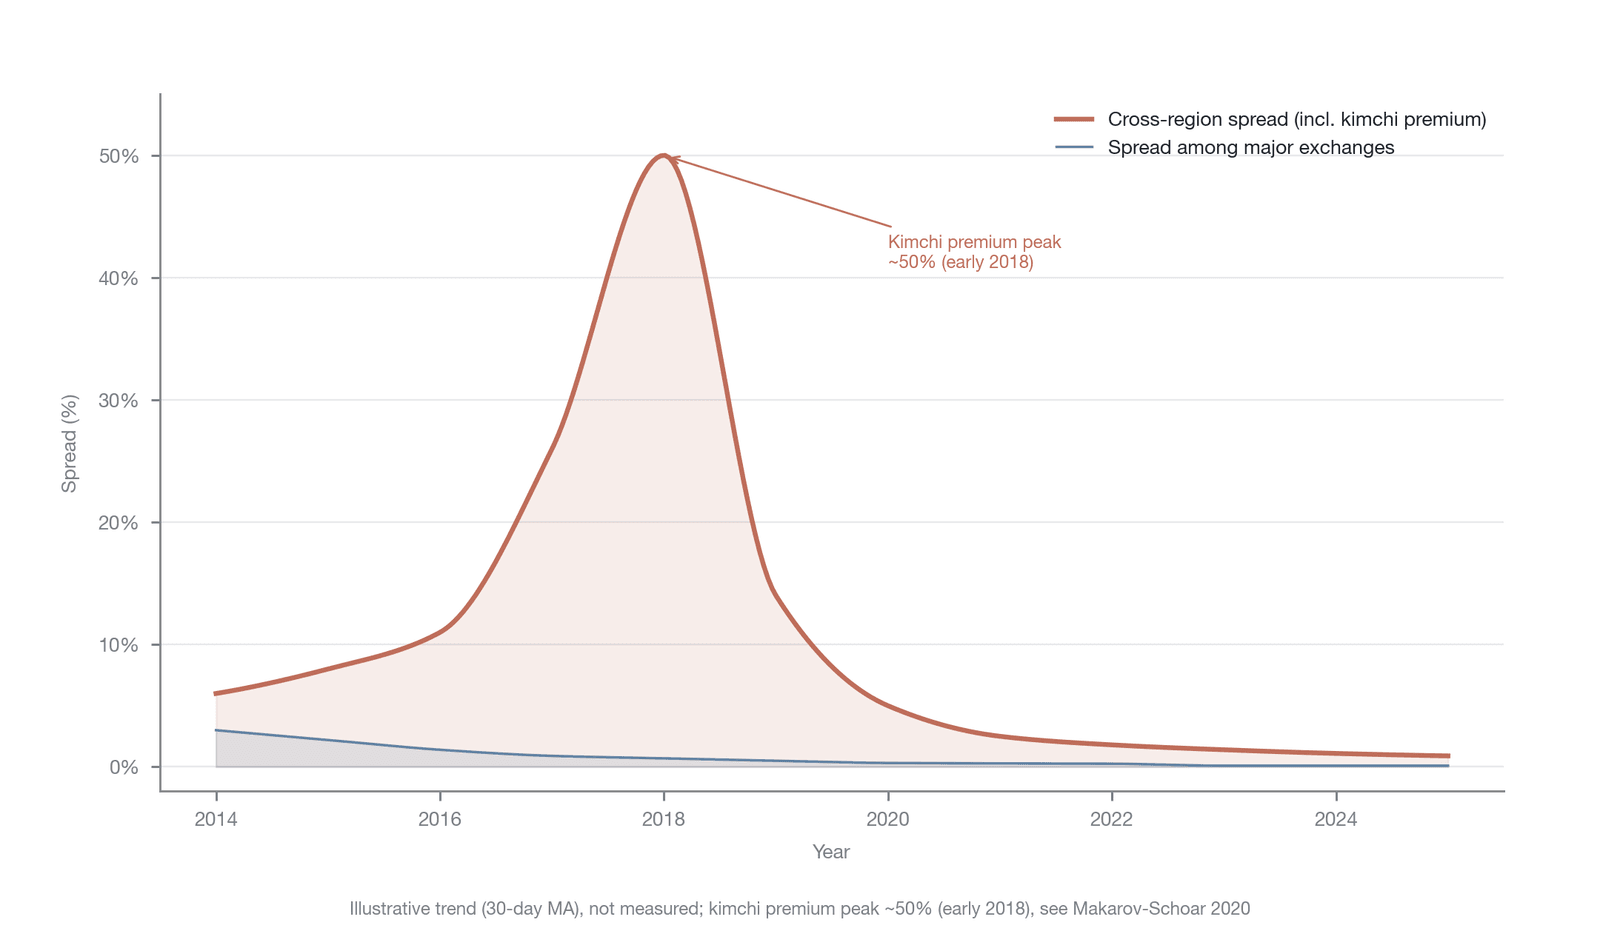
Figure 15-5. The convergence trend of cross-exchange BTC spreads
Figure 15-5 shows the long-run evolution of two types of cross-exchange BTC spreads, where the "spread between major exchanges" is defined as the absolute percentage of the daily average BTC/USD(T) spread between Coinbase and Binance, and the "cross-region spread" includes the premium between Korean exchanges (such as Upbit) and major global exchanges, with the data smoothed by a 30-day moving average. As the figure shows, both spreads exhibit a clear long-term downward trend, but the speed and path of convergence differ. The spread representing regional market segmentation (including factors such as the Kimchi premium), from a peak near 50% at the bull-market top of late 2017 to early 2018 (consistent with the Kimchi-premium measure above), underwent a relatively slow but sustained convergence and stabilized within 2% after 2022. The slowness of this convergence reflects the gradual nature of removing institutional barriers (such as capital controls), which technological progress alone cannot resolve, requiring also the evolution of the regulatory environment and the improvement of financial infrastructure.
By contrast, the spread between major global exchanges (such as between Coinbase and Binance) converged faster and more sharply. This type of spread converged rapidly from an early 2%–4% to below 0.5% after 2019, and even below 0.1% much of the time. This rapid convergence reflects the removal of purely technical and capital barriers: when exchange APIs are fast enough, network latency is low enough, and arbitrage capital is ample enough, the price differences of the same asset across major exchanges are eliminated almost instantaneously. Giudici and Pagnottoni (2019), analyzing high-frequency data from five major exchanges during the 2017 price surge and the 2018 correction, identified Bitfinex and Gemini as leaders in price discovery and found that inter-exchange connectivity was time-varying with the market state [26].
As spot-market spreads gradually converged, the spatial efficiency of derivatives markets also exhibited a distinctive structural feature. Are there significant funding-rate and basis differences between perpetual futures across different exchanges? Zhivkov (2026), analyzing 35.7 million high-frequency records from 26 cryptocurrency exchanges—11 centralized exchanges (CEXs) and 15 decentralized exchanges (DEXs)—revealed a significant "two-tiered structure" in the cryptocurrency funding-rate market [22]. The study found that CEXs occupy an absolutely dominant position in price discovery, with market integration 61% higher than that of DEXs, and all significant information flows exhibiting unidirectional transmission from CEXs to DEXs. Notably, the funding-rate differences observed between CEXs and DEXs are not driven entirely by information asymmetry; structural differences in the funding-rate formulas across platforms are also an important explanatory factor. Binance uses a composite formula based on an interest rate component and a premium component, whereas dYdX and Hyperliquid use calculations based on time-weighted average price deviations; this formula difference produces structural rate deviations even under identical market conditions, so one must first control for this mechanical effect when assessing information-driven rate differences.
More crucially, although perpetual futures account for the vast majority of crypto derivatives volume, cross-exchange funding-rate arbitrage still faces numerous barriers. Zhivkov (2026) notes that as much as 17% of the observed sample exhibited an economically significant arbitrage spread (above 20 basis points), but after accounting for transaction costs and spread-reversal risk, only 40% of the top arbitrage opportunities could generate a positive return, and as many as 95% of arbitrage opportunities ultimately faced forced liquidation [22]. This indicates that although significant basis and funding-rate differences exist across platforms, the high transaction costs, margin requirements, and spread-reversal risk constitute powerful "limits of arbitrage" that prevent arbitrageurs from eliminating these large-scale mispricings. This resolves an apparent paradox: in a highly fragmented crypto derivatives market, significant price fragmentation and improving market efficiency in fact coexist.
The convergence of cross-exchange spreads is not a monotonically declining process, however. During periods of extreme market volatility, spreads spike briefly as liquidity evaporates instantaneously and the market panics. The "Black Thursday" of March 2020 is a typical case: Bitcoin plunged more than 40% within 24 hours, causing liquidity on several exchanges to evaporate almost entirely; market makers withdrew quotes, and cross-exchange spreads spiked from under 0.1% to several percentage points within minutes. The collapse of the FTX exchange in November 2022 triggered even more complex spread dynamics, involving not only a contraction of liquidity but also a repricing of counterparty risk, as market participants needed to assess which exchanges might be affected by the knock-on effects of the FTX collapse. These crisis-moment spread spikes are precisely a direct manifestation of the "market-state dimension" in the efficiency spectrum framework: market efficiency is highly dependent on the prevailing environment and may collapse nonlinearly under extreme stress.
Equally important, however, is observing the speed of spread recovery after a crisis. In the March 2020 crash, spreads between major exchanges recovered to normal levels within hours; and after the 2022 FTX event, although the recovery process was more protracted (involving the rebuilding of trust), spreads ultimately returned to their pre-crisis lows. This "shock–deviation–recovery" pattern indicates that digital asset markets have established fairly robust self-repair mechanisms. The resilience of the arbitrage infrastructure, which can resume operation relatively quickly even under extreme stress, is itself important evidence of improving market efficiency.
15.2.6 Overall assessment
Combining the analysis above, we can offer a multidimensional assessment of the weak-form efficiency of digital asset markets. Across the five dimensions of the efficiency spectrum framework, weak-form efficiency exhibits a clear gradient distribution and dynamic evolution.
Along the time dimension, efficiency declines in a gradient from high to low frequency. Major assets are already close to a random walk intraday (from minute to hour level), predictability at the daily level is weakening continuously, but momentum and reversal effects at the weekly and monthly levels can still be detected, although their economic significance is also declining. Along the asset dimension, efficiency falls steeply from blue chips to the long tail. The weak-form efficiency of Bitcoin and Ethereum is far higher than that of small- and mid-cap tokens, and liquidity is the core variable explaining this difference. The study by Zaremba et al. (2021) clearly shows that the daily reversal effect is concentrated mainly in the least liquid long-tail assets [18]. Along the market-state dimension, efficiency is at a high level under normal market conditions but may fall sharply under extreme stress; whether it is enhanced time-series predictability (such as a momentum crash or intensified mean reversion during a crisis) or a spike in cross-exchange spreads, both are manifestations of efficiency degrading under stress.
Along the market-tier dimension, the spot market and the derivatives market (especially perpetual futures) exhibit a complex interaction. On the one hand, because of its high liquidity and the concentration of professional institutions, the perpetual futures market shows higher efficiency than spot in high-frequency price discovery; on the other hand, its distinctive institutional design (such as the funding settlement cycle) and cross-platform arbitrage friction endogenously create new predictable patterns, such as the "8-hour cycle effect" and cross-exchange basis deviations. This dual character of "more efficient at high frequency, affected by institutional friction at low frequency" makes the weak-form efficiency of the derivatives market more subtle and multifaceted than that of the spot market.
From the perspective of dynamic evolution, the weak-form efficiency of digital asset markets has improved significantly over the past decade. This improvement is not accidental but driven by a series of structural factors: the entry of professional market makers and quantitative trading firms has provided continuous liquidity and arbitrage pressure; the development of derivatives markets (especially CME futures in 2017 and spot ETFs in 2024) has provided more channels for information to be incorporated into prices; technological iteration in trading infrastructure has reduced the cost and latency of arbitrage; and the gradual clarification of the regulatory framework has reduced institutional uncertainty. Each factor pushes the market toward a more efficient state, and their combined effect has clearly accelerated this evolution in recent years.
Nonetheless, simply labeling digital asset markets "weak-form efficient" remains inaccurate. A more precise description is this: major digital assets are already close to weak-form efficient on high-frequency time scales and under normal market conditions, but significant predictable patterns still exist on low-frequency time scales, in long-tail assets, and under extreme market conditions. The continued weakening of these patterns is evidence of the market's adaptive learning, but their complete disappearance is neither inevitable nor imminent. This conclusion is entirely consistent with the core prediction of the adaptive markets hypothesis: efficiency is not an endpoint but a perpetually ongoing process, one driven by the competition, learning, and adaptation of participants.
Efficiency Spectrum Locator Card · Section 15.2
Dimension Positioning Quantitative proxy metric Time Efficient at high frequency; still predictable at low frequency Rolling variance ratio VR(q) Asset High efficiency for blue-chip assets, low for long-tail assets Autocorrelation coefficients across assets of different market caps Information type Historical price information (weak-form) Ljung-Box Q-statistic / returns to momentum and reversal strategies Market state Efficient in the normal state; efficiency degrades under extreme stress Magnitude of the variance-ratio shift during crises Market tier Derivatives discover prices at high frequency but are subject to institutional friction Sharpe ratio of funding-rate forecasts / cross-exchange basis-arbitrage room One-sentence takeaway: The weak-form efficiency of digital asset markets is not a static binary state but a dynamic process that exhibits a gradient across the dimensions of time, asset, state, and market tier, and that continuously evolves toward greater efficiency through participants' adaptive learning.
15.3 Testing semi-strong-form efficiency
Whereas weak-form efficiency tests focus on historical price information, semi-strong-form tests ask a broader question: can the market efficiently digest all newly public information? This is the core issue of the semi-strong-form efficiency test. In traditional financial markets, exploration of this question typically centers on standardized events such as corporate earnings reports and macroeconomic data releases. Digital asset markets, however, offer a distinctive environment with a more diverse range of information types and a more complex set of information sources. Here there are not only the macro and regulatory news common to traditional markets but also an entirely new category of information originating from the blockchain itself: on-chain events.
The core argument of this section is that the semi-strong-form efficiency of digital asset markets is not a constant but exhibits significant heterogeneity, whose key stratifying variable is information processing cost. Using the event study method, we systematically compare the speed of the market's reaction to three types of information: standardized macroeconomic information, complex regulatory-game information, and highly technical crypto-native information (such as hacks). The research will show that the market reacts extremely fast to the first two types of information, close to the high-efficiency level of traditional markets; but for crypto-native information, even when its data is fully public on the blockchain, the high processing cost still creates a vast gulf between "being publicly available" and "being incorporated into price." We provide an in-depth reading of an important study from the Federal Reserve Bank of New York, which cleverly uses DeFi hacks as a natural experiment and, for the first time, quantifies the efficiency loss caused by information processing cost. Finally, we connect theory to reality by reconstructing the largest exchange theft in crypto history, the Bybit hack, to show concretely how, in a real crisis event, information is gradually processed, digested, and finally reflected in prices by different tiers of market participants.
15.3.1 The event study method
To measure the speed of the market's reaction to new information, the event study method is a long-established gold standard in financial economics. The method was pioneered and systematized by Fama, Fisher, Jensen, and Roll (1969) in their study of stock splits; its core logic is to use statistical methods to isolate the independent effect of a specific "event" on asset prices, thereby assessing the efficiency with which information is incorporated into prices [27]. A typical event study comprises several steps: first, precisely define the event itself and the "event window," a period before and after the event occurs; second, build a "normal" return model to predict the expected return of the asset had the event not occurred; third, compare the actual return during the event window with the expected return, the difference being the abnormal return, which represents the price impact brought by the event; and finally, cumulate the abnormal returns over the event window to obtain the cumulative abnormal return (CAR), which measures the total price impact of the event and the full trajectory of the information reaction.
In traditional financial markets, event studies typically use daily data, and the definition of the event is relatively standardized, such as an earnings announcement, a merger announcement, or a regulatory change. Digital asset markets, however, bring new opportunities and challenges to the application of this classic methodology. The greatest opportunity lies in the granularity of the data. Because crypto markets trade around the clock and the availability of high-frequency data (minute-level or even second-level) is far higher than in traditional markets, researchers can observe price reactions on a finer time scale, examining the process of information incorporation at the level of minutes or even seconds rather than days. This allows us to capture faster price discovery dynamics that were previously smoothed away in daily data.
At the same time, crypto markets pose new challenges. First, the definition of an event is more complex. Beyond news in the traditional sense, "events" in crypto markets also include on-chain activity such as protocol upgrades, hard forks, governance votes, and even hacks. The time these events occur can be pinned to the block timestamp, but interpreting their informational content requires expertise. Second, given the high volatility of the market and the absence of a widely accepted asset-pricing model, building a reliable "normal" return model becomes difficult. Early research typically used a simple market model or directly took Bitcoin as the market benchmark. For example, Saggu, Ante, and Kopiec (2025), in studying the SEC's regulatory interventions in crypto assets, computed abnormal returns by comparing the target asset's return with Bitcoin's return, thereby effectively isolating the regulatory shock specific to that asset [28].
Recent research, however, has achieved a key methodological advance, the most prominent example being the approach adopted by Azar, Olivas, and Sinha (2025) in analyzing DeFi hacks [5]. They recognized that in crypto markets the informational diffusion of an event is not instantaneous but involves a process from "occurring on-chain" to "being publicly known." They therefore creatively defined two distinct event time points: , the time the first malicious transaction was confirmed on the blockchain, representing the moment information became "publicly available"; and , the time mainstream social media (such as the project's official X account or a well-known security firm) first disclosed the event, representing the moment information became "common knowledge." By constructing event windows around these two time points separately, they were able to isolate precisely the price discovery that occurred within the "information asymmetry window" in which information processing cost played the dominant role. This dual-event-window design is a major innovation of the event study method in the crypto-market context; it deepens the analytical focus from "is the market efficient with respect to public information" to "how does the market react in stages to public information at different cognitive levels."
In addition, the existence of perpetual futures in crypto markets provides an entirely new dimension for the event study method. In a traditional event study, the analysis focuses mainly on the spot market. In crypto markets, however, an event study can be conducted simultaneously in both the spot and perpetual futures markets, constructing a "dual-market event study" methodology. By comparing the abnormal-return and cumulative-abnormal-return curves of the same asset in the spot and perpetual futures markets, researchers can reveal differences in the transmission speed of information across market tiers. For example, when facing sudden negative information, does the CAR curve of perpetual futures show a significant negative deviation earlier than the spot CAR curve? Can the dynamics of the perpetual futures funding rate and basis during the event window provide additional clues about how information is digested by leveraged traders? This dual-track comparison design allows us to locate the source of the information advantage more precisely and to assess differences in the efficiency with which different market microstructures process information. The analysis that follows in this section draws extensively on and builds upon these methodological innovations.
15.3.2 The stratification of information processing costs
The event study method provides a standardized tool for measuring the speed of the information reaction, and the diverse types of information in digital asset markets provide three test objects with distinct characteristics for this measurement. The semi-strong-form efficiency of the market is not a single number but a spectrum that depends on the characteristics of the information itself. Its core determinant is precisely the information processing cost required to turn raw public data into a tradable signal. The lower the cost, the more standardized the information, the faster the market reacts, and the higher the efficiency; conversely, the higher the cost, the more complex the information, the slower the market reacts, and the deeper the efficiency gulf. This section examines, along this spectrum, the speed of the market's reaction to three typical types of events—macroeconomic information, regulatory and legal information, and crypto-native information—revealing how information processing cost systematically shapes the market's efficiency stratification.
The first type is standardized macroeconomic information. Such information—for example, a Federal Reserve rate decision or a release of the Consumer Price Index—is highly standardized, periodic, and predictable. The precise timing of the event is known in advance by market participants worldwide; the form in which the information is released is usually a clear number or a binary decision; and a broad consensus has already formed about the likely direction of its impact on asset prices. The processing cost of such information is therefore extremely low, and the main competition is over the speed of obtaining the information and executing trades. A series of reports published by LMAX Group in collaboration with Macro Hive, using millisecond-level trading data, offers an ideal window for observing this "speed race" [29]. According to the industry report, during major macro events such as a Federal Reserve meeting, the reaction speed of the Bitcoin market is already comparable to that of the most liquid foreign exchange market in the world, EUR/USD. On average, the first 2 seconds after an event absorbed about 12% of the price move over the following 10 minutes (BTC/USD, averaged across multiple macro events). This finding is of significant reference value: it indicates that for standardized, easy-to-interpret macro signals, the price discovery mechanism of crypto markets has already reached an efficiency level comparable to that of the most mature traditional financial markets. This owes to the deep participation of mature high-frequency trading infrastructure and algorithmic trading strategies, which can parse news feeds and execute trades at the fastest speed, compressing information processing cost to a minimum. In this process, the perpetual futures market often reacts more strongly than the spot market. For example, in the ETF approval event, the perpetual futures basis moved rapidly after the news broke, reflecting leveraged capital's rapid pricing of this standardized information. Comparable reaction speed does not imply comparable pricing quality, however. The "buy the rumor, sell the news" move described in this chapter's introduction—where the price fell rather than rose after the formal approval—suggests that the market's initial directional judgment may contain a systematic bias, and fast but inaccurate pricing itself constitutes a special form of efficiency defect. The intraday volatility triggered on January 9, 2024, when the SEC's social media account was hacked and a false approval message was posted, further exposed the fragility of crypto market participants in information verification—that is, a significant asymmetry between the market's ability to react instantly to unverified information and its ability to discern the authenticity of that information.
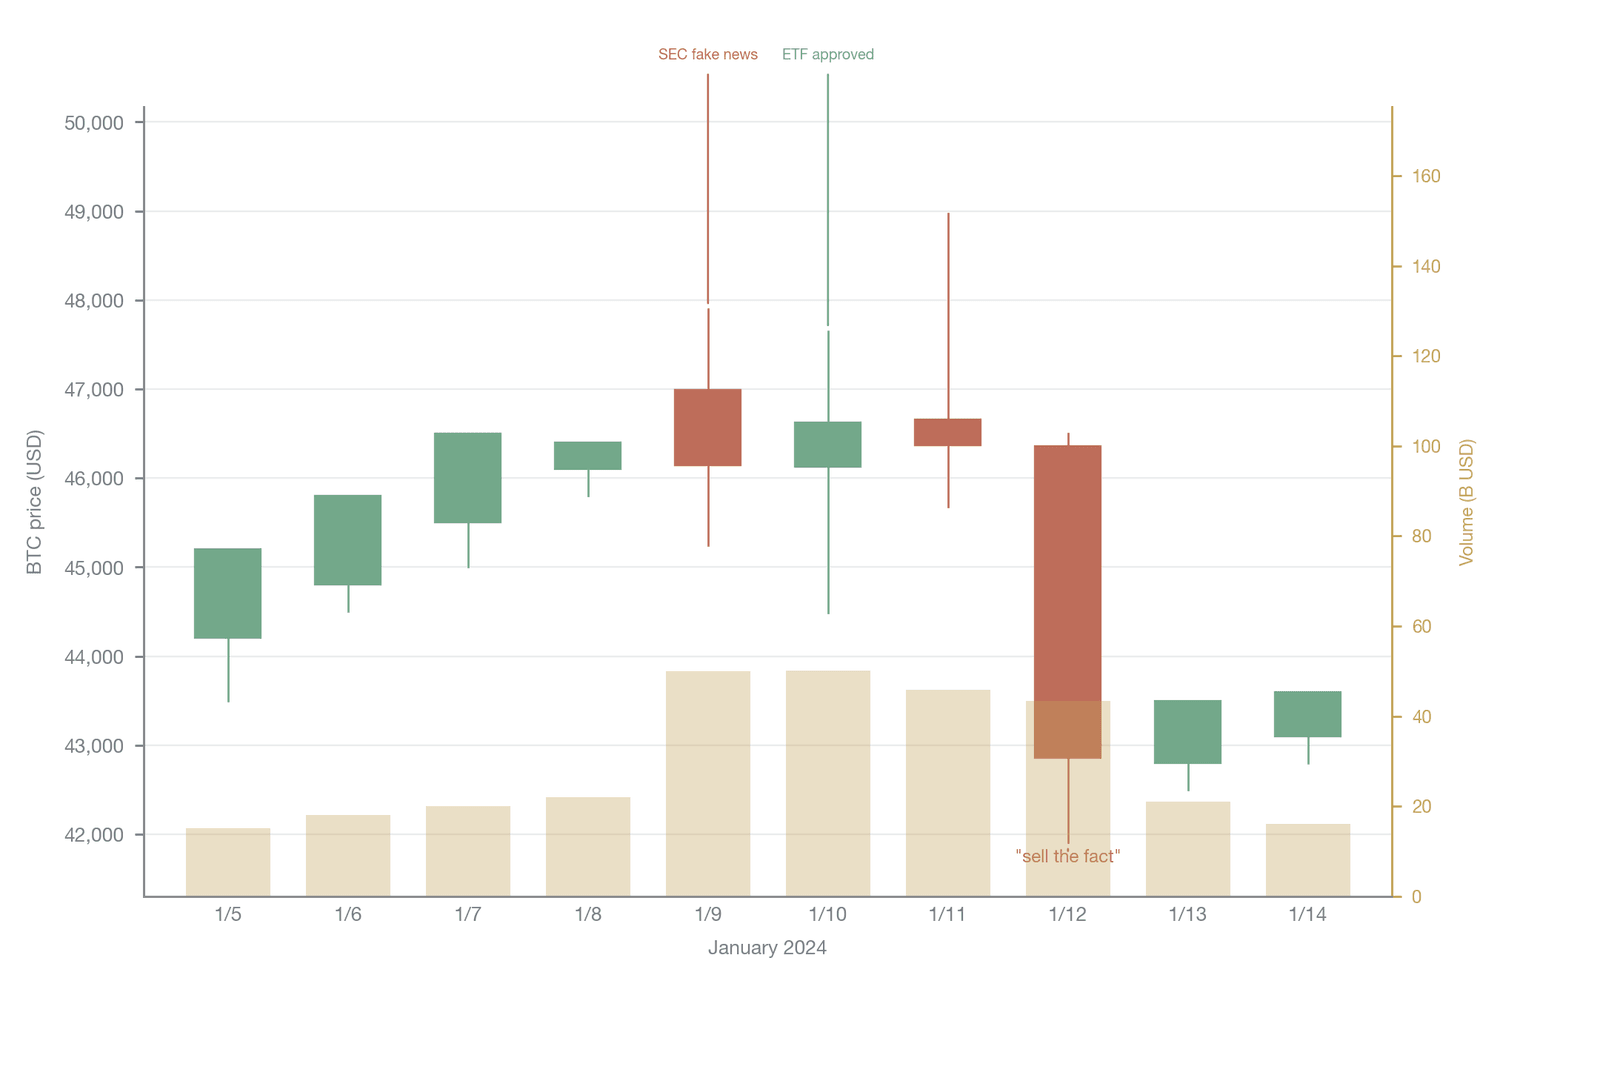
Figure 15-6. An event study of the Bitcoin ETF approval: BTC price movement and volume
Figure 15-6 shows the daily price movement and volume of BTC around the approval of the spot Bitcoin ETFs in January 2024. Two features are noteworthy: the false approval message posted after the SEC's social media account was hacked on January 9 triggered an intraday swing of about $1,500, highlighting the market's extremely fast reaction to unverified information; and after the ETFs' first trading day on January 11, when the price surged to about $49,000 and then fell back rapidly, breaking below $42,000 the next day, forming a textbook "buy the rumor, sell the news" move, while volume expanded within the window to a peak of about $50.1 billion. The daily open-high-low-close prices are given in Table 15-3 (Yahoo Finance, BTC-USD; verified); the candlesticks for January 5–8 and January 13–14 in the figure are illustrative extensions and are not part of the authoritative record in Table 15-3.
| Date (2024) | Event | Open (USD) | High (USD) | Low (USD) | Close (USD) | Volume (billion USD) |
|---|---|---|---|---|---|---|
| January 9 | SEC account hacked; false approval message posted | 46,988 | 47,894 | 45,245 | 46,140 | — |
| January 10 | SEC formally approves spot Bitcoin ETFs | 46,122 | 47,647 | 44,483 | 46,628 | 50.1 |
| January 11 | ETFs begin trading | 46,656 | 48,969 | 45,679 | 46,369 | 45.8 |
| January 12 | "Sell the news" move continues | 46,355 | 46,498 | 41,904 | 42,853 | 43.3 |
Table 15-3. Price snapshot on key dates around the Bitcoin ETF approval (Data source: Yahoo Finance, BTC-USD)
The second type is complex regulatory and legal information. Unlike standardized macro data, regulatory information has a significantly higher processing cost. When the SEC files a lawsuit against a particular crypto asset, or Congress proposes a new regulatory bill, such events are also public information, but their content is far more complex than a CPI figure. They involve interpreting legal texts, guessing regulators' intentions, and probabilistically assessing the outcome of a long legal battle ahead. The information is no longer a simple "bullish" or "bearish" but full of uncertainty and ambiguity. Saggu, Ante, and Kopiec (2025) conducted an event study of the SEC's enforcement actions unexpectedly classifying certain crypto assets as securities, and their results clearly show the lag effect brought by this high processing cost [28]. They found that after the SEC issued the relevant announcement, the prices of the affected assets did not adjust fully within seconds or minutes but began a slow decline lasting several weeks. On average, prices fell 5.2% in the first three days after the event and cumulatively fell 17.2% one month later. This slow, sustained decline reflects the time cost the market as a whole pays to digest and understand complex legal information. Traders need time to read the original announcement, wait for the analysis of legal experts, observe the response strategies of the projects, and continually reassess the asset's long-term risk. Here, although the information has been made public, its true meaning and impact require a process of gradually reaching consensus, and this process itself constitutes part of price discovery. For the perpetual futures market of the affected tokens, if it exists, the reaction of the funding rate and basis often leads the slow decline of the spot price, reflecting some informed traders expressing their pessimistic expectations about regulatory risk by shorting perpetual futures.
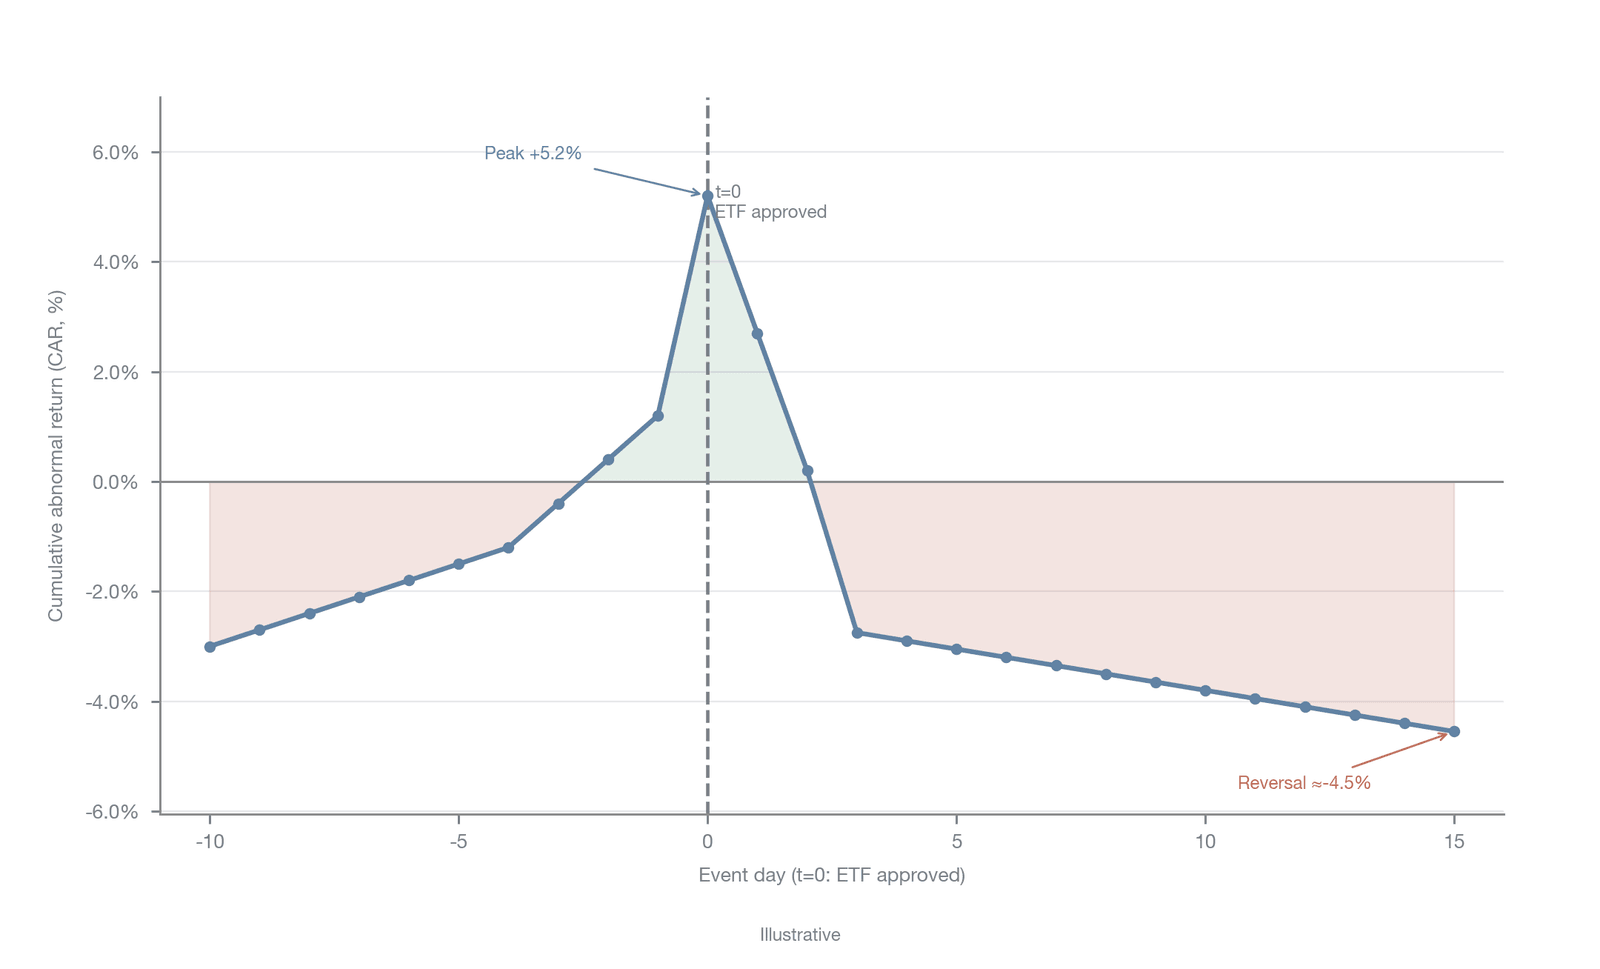
Figure 15-7. An event study of the Bitcoin ETF approval: the cumulative abnormal return curve
Figure 15-7 shows the cumulative abnormal return curve around the ETF approval event. The curve reveals the trajectory of the market's reaction to this standardized regulatory information: in the days before the event, the CAR had already begun to accumulate positively, reflecting the market's advance pricing based on probabilistic expectations; after peaking on the day of formal approval, the CAR quickly reversed and turned negative, indicating that "sell the news" behavior led to an excessive price correction. This pattern is highly consistent with the classic reaction to major policy events in traditional financial markets, indicating that crypto markets already possess an efficiency level comparable to that of mature markets when processing standardized binary information.
The third type is highly technical crypto-native information. This is the other end of the information-processing-cost spectrum and an efficiency challenge unique to digital asset markets. The typical representative of such information is a DeFi protocol being hacked. Technically, the moment the hacker's first malicious transaction is confirmed on the blockchain, the fact of the attack has already become "publicly available" information, recorded on an immutable global ledger. This "public" nature, however, is a highly misleading appearance. The raw on-chain transaction data is written in hexadecimal code, and understanding it requires deep smart-contract knowledge, a cryptographic background, and professional on-chain data analysis tools. For the vast majority of market participants, this data is technical data hard to interpret directly. Turning this raw data into a clear, tradable signal such as "protocol X was hacked for amount Y" requires a very high information processing cost. It is precisely this cost that creates an enormous time gap and cognitive gap between the information being "public on-chain" and "market consensus." Azar, Olivas, and Sinha (2025) precisely captured the price behavior within this time gap [5]. They found that between the on-chain time of a hack and the time the information was widely reported by the media, there is an "information asymmetry window" averaging several hours. Within this window, only a few informed traders with advanced on-chain analysis capabilities (such as professional on-chain sleuths, security firms, and top quant funds) can decode the attack first and begin selling the relevant tokens. The study quantified that as much as 36% of the total price decline was completed within this window—that is, before ordinary investors even knew what had happened, the price had already fallen significantly. This finding is among the strongest evidence that semi-strong-form efficiency fails in crypto markets, and it starkly reveals the reality that "information being public does not equal information being incorporated into price." Here information processing cost plays the role of a "filter," determining who can extract value first from public but raw data and thereby gain a structural information advantage in the market.
Having explored the processing costs of these three types of information, we must introduce a crucial dimension: the information-amplification effect of perpetual futures. As the most active derivative in crypto markets, perpetual futures, through their distinctive institutional design, systematically accelerate the incorporation of information into prices. Compared with the spot market, perpetual futures offer high leverage and the convenience of short-selling. When new information appears in the market, especially negative information (such as a hack or a regulatory crackdown), a trader with an information advantage need not borrow the actual asset; they need only deposit a small amount of margin to express their view rapidly by shorting perpetual futures. This mechanism greatly reduces the friction cost of informed trading.
A large body of academic evidence supports the leadership of perpetual futures in price discovery. By computing metrics such as the Hasbrouck information share, research shows that for most of the time the perpetual futures market leads the spot market in reflecting new information. When the information processing cost is high, the few traders who can quickly parse the information preferentially choose the perpetual futures market to operate in, causing the perpetual futures price, funding rate, and basis to move first. Subsequently, arbitrageurs transmit these price signals to the spot market through cross-market arbitrage. Perpetual futures are therefore not merely a trading tool but the most important amplifier and conduit for information in crypto markets.
Taken together, these three types of information and the corresponding speeds of the market's reaction clearly delineate an efficiency spectrum determined by information processing cost. From high efficiency for macro information, to moderate efficiency for regulatory information, to significant inefficiency for on-chain native information, the market's semi-strong-form efficiency decays systematically as information complexity increases. This not only provides a unified explanatory framework for understanding the anomalies of crypto markets but also points the way to identifying potential trading opportunities and sources of risk. In the next section, we further dissect the study by Azar, Olivas, and Sinha (2025), deconstructing the composition of information processing cost in more detail and quantifying its specific impact on market efficiency.
15.3.3 A quantitative analysis of information processing costs
On the information-processing-cost spectrum, the report The Price of Processing by Azar, Olivas, and Sinha (2025), published at the Federal Reserve Bank of New York, is without doubt the most precise dissection to date of crypto-native events, the end of the spectrum with the highest technical barrier [5]. The study's core contribution is that it uses the hacks that frequently occur in decentralized finance protocols as a series of ideal "natural experiments," thereby succeeding for the first time in quantifying the specific efficiency loss that information processing cost itself imposes on the market. This research provides decisive empirical evidence for the core argument that "information being public does not equal information being incorporated into price."
DeFi hacks make ideal natural experiments for several reasons. First, the attacks are exogenous—they are sudden events launched by external attackers, unrelated to other market activity, which effectively avoids the endogeneity problem. Second, the time an attack occurs can be recorded to the second by the blockchain ledger, providing unmatched precise timestamps for the event study. Finally, the outcome of an attack (the loss of funds) directly and unambiguously constitutes a negative shock to the value of the victim protocol's token. Using these properties, the research team constructed a detailed dataset of several hundred DeFi hacks and treated each attack as an independent event study.
The most central methodological innovation of the study lies in its fine-grained deconstruction of the concept of "the event occurring." Rather than adopting a single event time point, the researchers defined two key moments:
(on-chain time): the time the attacker's first malicious transaction is confirmed by the blockchain network and recorded on a block. At this moment, the fact of the attack has already become publicly verifiable data on-chain, and the information is technically "publicly available." (consensus time): the time mainstream information channels—such as the project's official social media account, a well-known blockchain security firm (such as PeckShield), or a mainstream crypto media outlet—first publicly disclose the attack. At this moment, the information is "translated" from raw on-chain data into human-readable language and becomes "common knowledge" for market participants.
By distinguishing these two time points, the researchers were able to divide the price discovery process into two stages: the "information asymmetry window" from to , and the "information diffusion window" after . The length of the former window, and the price movement that occurs within it, directly reflect the market-efficiency lag caused by information processing cost.
The study's quantitative results are striking. First, the average time gap from to was as long as several hours, which itself shows the high time cost required to turn raw on-chain data into common knowledge. More important is the price reaction: the study found that before information became common knowledge, the price of the victim protocol's token had, on average, already fallen by 36% of its total decline. This means that more than one-third of the price shock occurred while ordinary investors did not even know an attack had taken place, completed first by a small group of informed traders with advanced on-chain monitoring and analysis capabilities. These informed traders monitor on-chain anomalies in real time through specialized tools; while ordinary people are still reading the news, they have already completed the entire process of analysis, decision, and trade.
This finding can be conceptualized through a "funnel model of how information is incorporated into price," as shown in Figure 15-8.
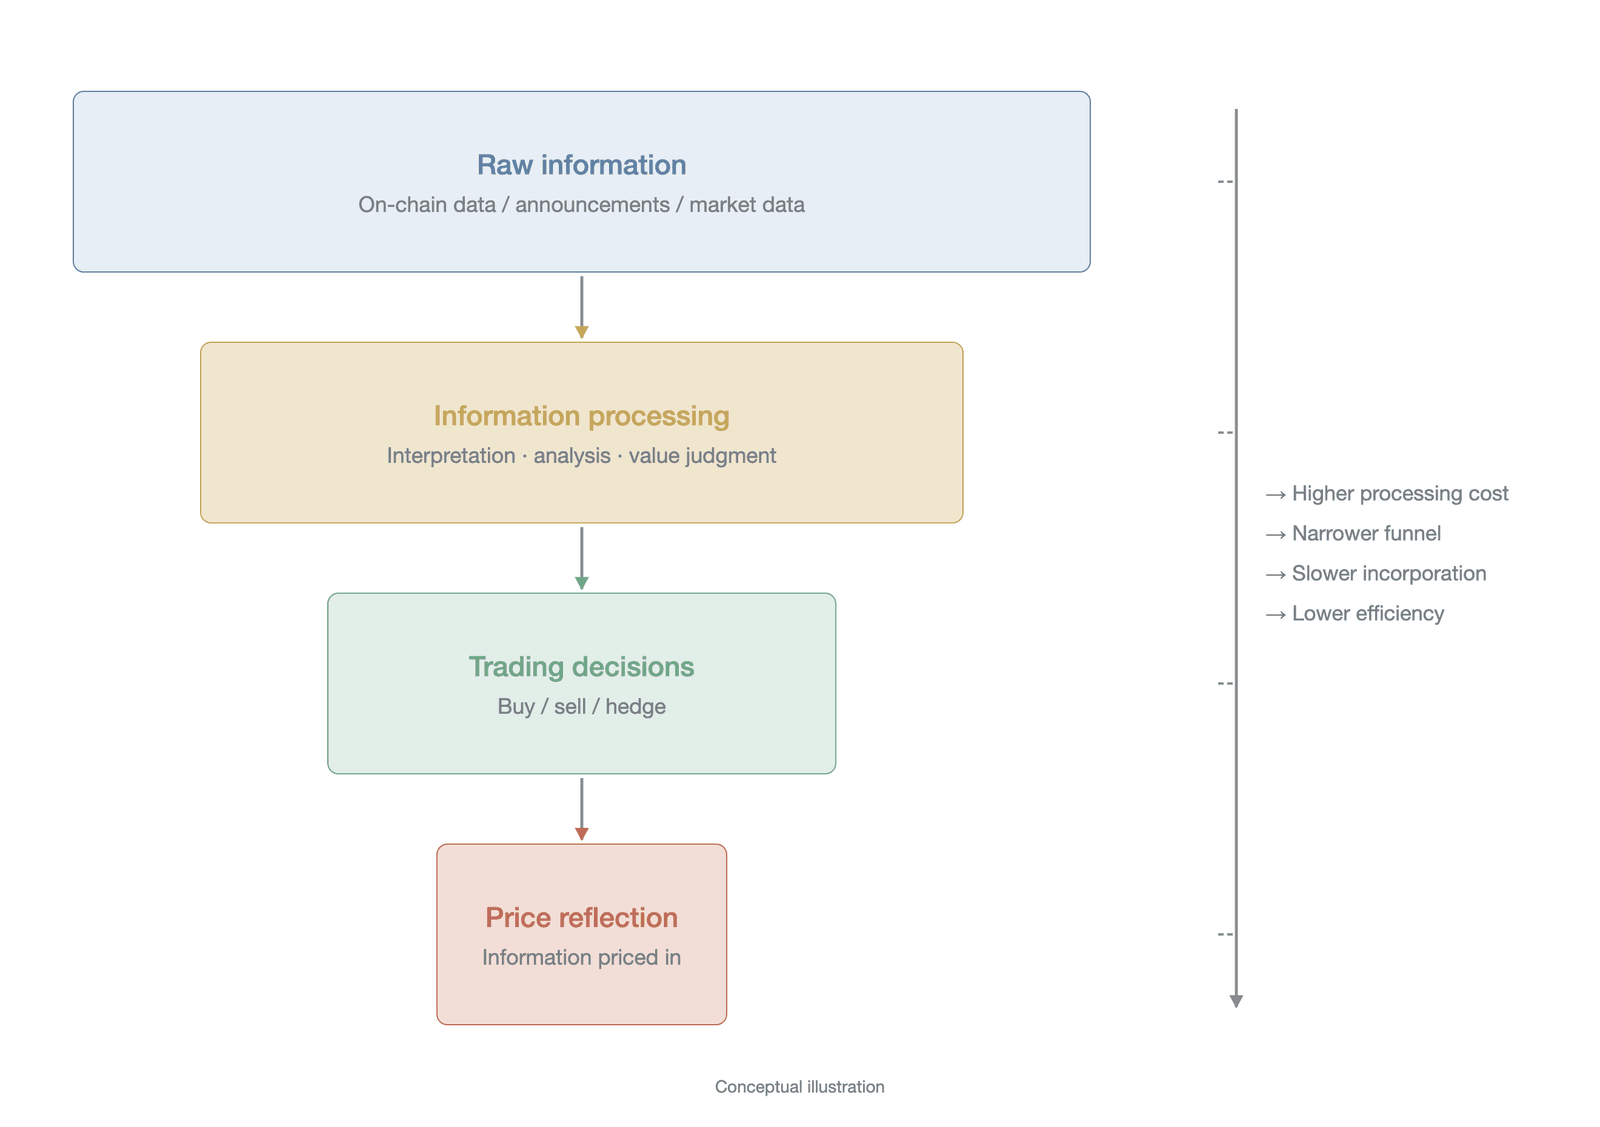
Figure 15-8. The funnel model of how information is incorporated into price
At the top of the funnel is raw, massive, noise-laden on-chain data, and information processing cost acts like each layer of a sieve: the first layer lets through only the very few top informed traders who can directly interpret raw transactions, forming the first wave of the price reaction; when security firms and the media "translate" and spread the event, the information penetrates the second layer and reaches a broader group of professional investors, triggering a second, sharper wave of decline; finally, through news and social media, it permeates the entire market. Information processing cost not only creates a time delay but also creates a hierarchy of profit—the earlier one penetrates the sieve, the higher the information rent one can capture.
For DeFi tokens listed simultaneously on a CEX, perpetual futures reflect attack information earlier because shorting requires no coin borrowing, and their price reaction often leads spot (for the mechanism, see Sections 15.3.2 and 15.4.4).
The study by Azar, Olivas, and Sinha (2025) therefore strongly demonstrates that blockchain transparency is a "raw transparency" that does not by itself guarantee market efficiency. On the contrary, in the absence of the corresponding interpretive tools and knowledge, this transparency may actually intensify information asymmetry. In digital asset markets, the true core competitive advantage is no longer whether one can obtain information (because information is open to everyone on-chain) but the speed and depth with which one processes and understands information. The study's conclusion has far-reaching implications for understanding the microstructure, risk management, and regulatory policy of crypto markets; it tells us that any assessment of crypto market efficiency must place information processing cost, the core variable, at the center of the analysis.
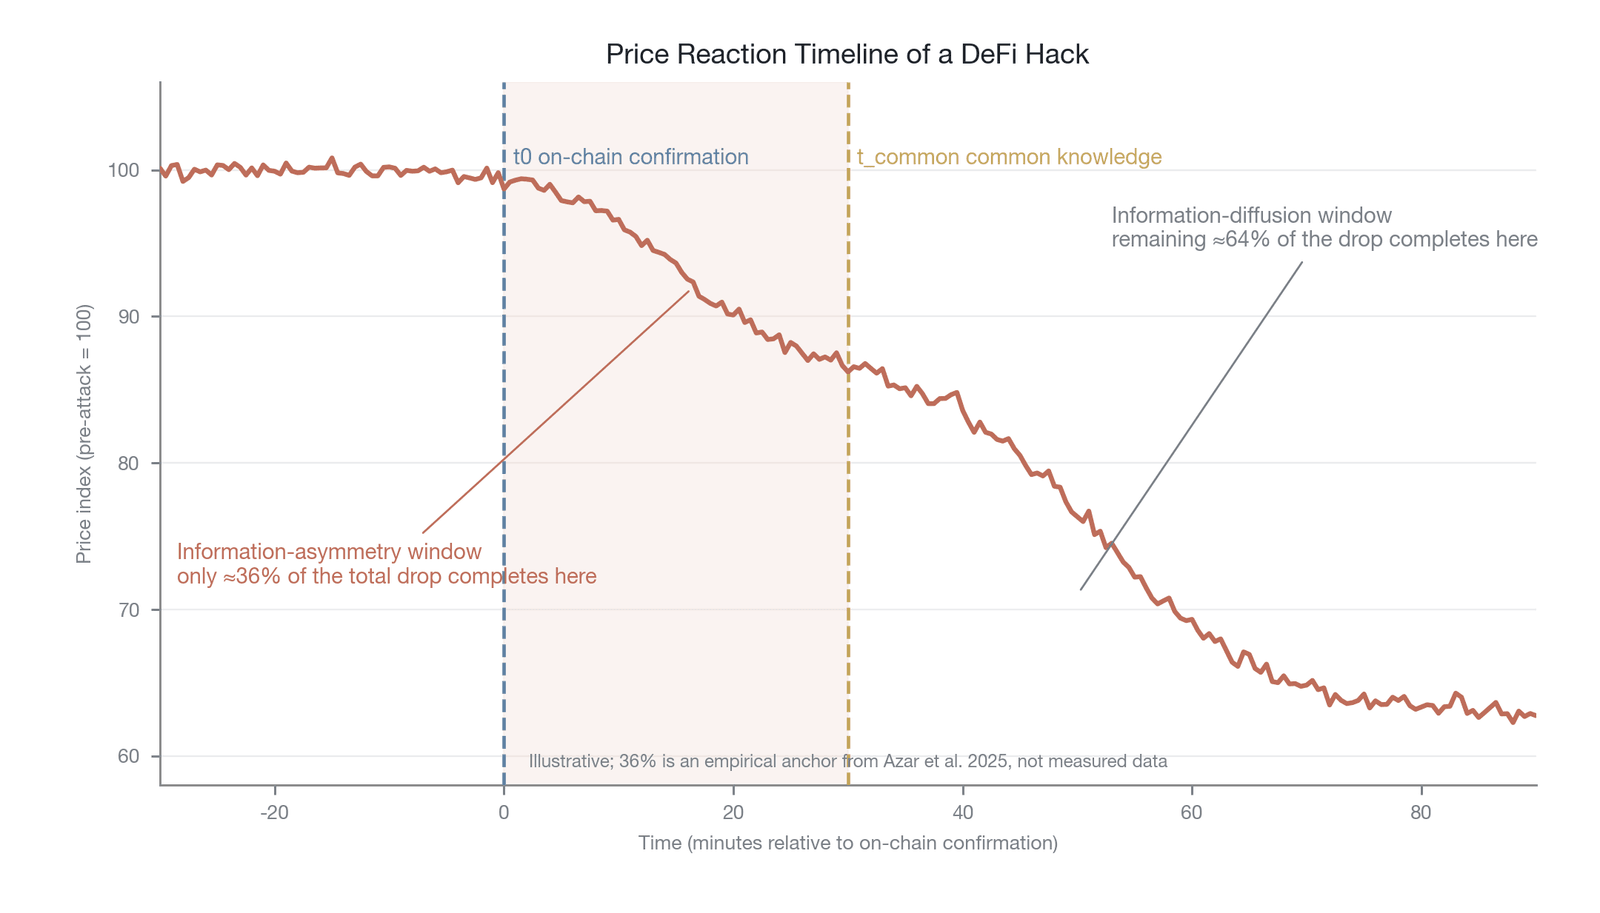
Figure 15-9. The timeline of the price reaction to a DeFi hack
Figure 15-9 uses a timeline to show the typical pattern of the price reaction to a DeFi hack: within the "information asymmetry window" between the attack occurring on-chain () and the information becoming common knowledge (), about 36% of the price adjustment is already complete, while most market participants are still unaware. This staircase pattern of price discovery is highly consistent with the theory of information-processing-cost stratification proposed in Section 15.3.2.
15.3.4 A retrospective on the Bybit attack
The value of theory ultimately lies in its power to explain the real world. To make concrete the earlier abstract discussion of information processing cost and efficiency stratification, this section reconstructs the theft at the Bybit exchange on February 21, 2025. This largest single-exchange theft in crypto history offers a typical case for observing how information spreads, is processed, and finally affects prices in a real crisis. It clearly shows the time lag and cognitive gradient that exist between the birth of an on-chain fact and the formation of market consensus.
The starting point of the event can be traced to 2:13 p.m. UTC on February 21, 2025 (). At that moment, through a carefully designed multi-stage attack, the attacker successfully breached the multi-signature security mechanism of one of Bybit's Ethereum cold wallets. The first step of the attack was a social engineering attack against the multi-signature authorizers, inducing them to sign a seemingly normal transaction request on a forged transaction interface; the second step exploited the proxy-contract architecture used by the Safe multi-signature wallet: using the obtained signature authorization, the attacker replaced the implementation contract behind the proxy contract with a contract containing malicious transfer logic, thereby bypassing the security assumptions of the multi-signature mechanism. This case shows that the weak link in multi-signature security often lies not at the cryptographic level but in the operational security of the signers and the upgradability of the smart-contract architecture. Over the following hour and more, the attacker transferred digital assets worth nearly $1.5 billion to addresses under their control without being detected. At this stage, the fact of the attack had already been permanently recorded on the Ethereum blockchain as a series of transactions. For entities with advanced on-chain monitoring capabilities, these unusually large, unplanned transfers already constituted a strong danger signal. This is precisely the moment the "information asymmetry window" defined by Azar, Olivas, and Sinha (2025) opened. Within this window, a few top on-chain data analysis firms and quant funds that may have been monitoring exchange wallets became the first potential informed parties. Their actions (whether selling assets for risk-avoidance purposes or conducting more complex arbitrage trades) constituted the first driving force of price discovery, although this force may initially have been masked by the market's normal fluctuations.
The first diffusion of information occurred at 3:44 p.m. UTC (), about 91 minutes after the on-chain attack began. Bybit's chief executive officer, Ben Zhou, posted a brief message on his personal social media account, publicly acknowledging for the first time that Bybit was "investigating a potential security incident." This moment can be regarded as the moment the information became "common knowledge." This message was itself vague and incomplete, however: it confirmed the existence of a problem but did not disclose the nature, scale, or specific loss of the attack. It therefore opened the second stage of the information's incorporation into prices. The market moved from "knowing nothing" to "knowing something had happened but not knowing how serious it was." Panic began to spread, but because of the lack of specific information, the price reaction remained limited and tentative. Traders faced classic Knightian uncertainty; not knowing the specific probability distribution of the risk, they could only trade on the basis of past experience and market sentiment. Within this 91-minute window, the proportion of the price move in both the spot and perpetual futures markets was significant, initially confirming the price discovery effect within the information asymmetry window.
As time passed, more information was gradually released and the funnel of information processing was penetrated further. In the hours after the CEO's first statement, through the tracking of on-chain analysts, follow-up media coverage, and Bybit's sporadic official updates, the estimated scale of the theft (initially estimated at several hundred million dollars, ultimately confirmed at nearly $1.5 billion) and the technical details of the attack gradually became clear. Each time a more specific, more definite piece of information was disclosed, it triggered a new round of price declines. Price movement was no longer an instantaneous reaction to a single event but a dynamic adjustment process driven by information flow and lasting several days. In the four days after the event, the price of Bitcoin fell from a level above $90,000 before the event to below the $90,000 mark. This process perfectly illustrates the true performance of the market's semi-strong-form efficiency when facing a complex, dynamic event: prices do not reflect all information in one step but converge toward a new equilibrium in an iterative, progressive manner as information processing cost gradually falls and consensus gradually coalesces.
In the Bybit event, the reaction of the perpetual futures market was especially striking and offers us a distinctive analytical dimension. Within the 91 minutes from the on-chain confirmation of the attack () to the CEO's public statement (), although the spot market reacted relatively slowly, the perpetual futures market had already begun to move anomalously. First, the funding rates of BTC and ETH perpetual futures rapidly flipped from positive to negative in the early stage of the event, indicating that short-side forces were quickly accumulating and that leveraged traders, anticipating a potential negative shock, were willing to pay a higher cost to maintain short positions. Second, the basis between perpetual futures and spot showed a significant negative deviation, with the perpetual futures price falling markedly faster than the spot price, further confirming the leadership of perpetual futures in digesting negative information. In addition, the open interest on major exchanges fluctuated violently after the attack was confirmed, and some long positions were forcibly liquidated as prices fell rapidly, this liquidation-cascade effect further amplifying the downward pressure on prices. These perpetual futures dimensions not only confirm informed traders' preference for leveraged tools but also show how the perpetual futures market accelerates the pricing of information through its distinctive microstructure during extreme events. The above description of anomalous moves in the perpetual futures market is based mainly on qualitative observation; limited by the availability of high-frequency data at the time of the event, this chapter cannot provide the precise basis-point figures of the funding-rate changes and basis deviations or a statistical significance test relative to the normal fluctuation range of the same period. Future research, after obtaining more complete high-frequency data, could conduct a more rigorous quantitative analysis of these anomalous moves.
Figure 15-10 uses a timeline to compare the relationship between key information nodes and the price reaction during the Bybit attack, showing the significant delay between the birth of an on-chain fact and its full reflection in prices.
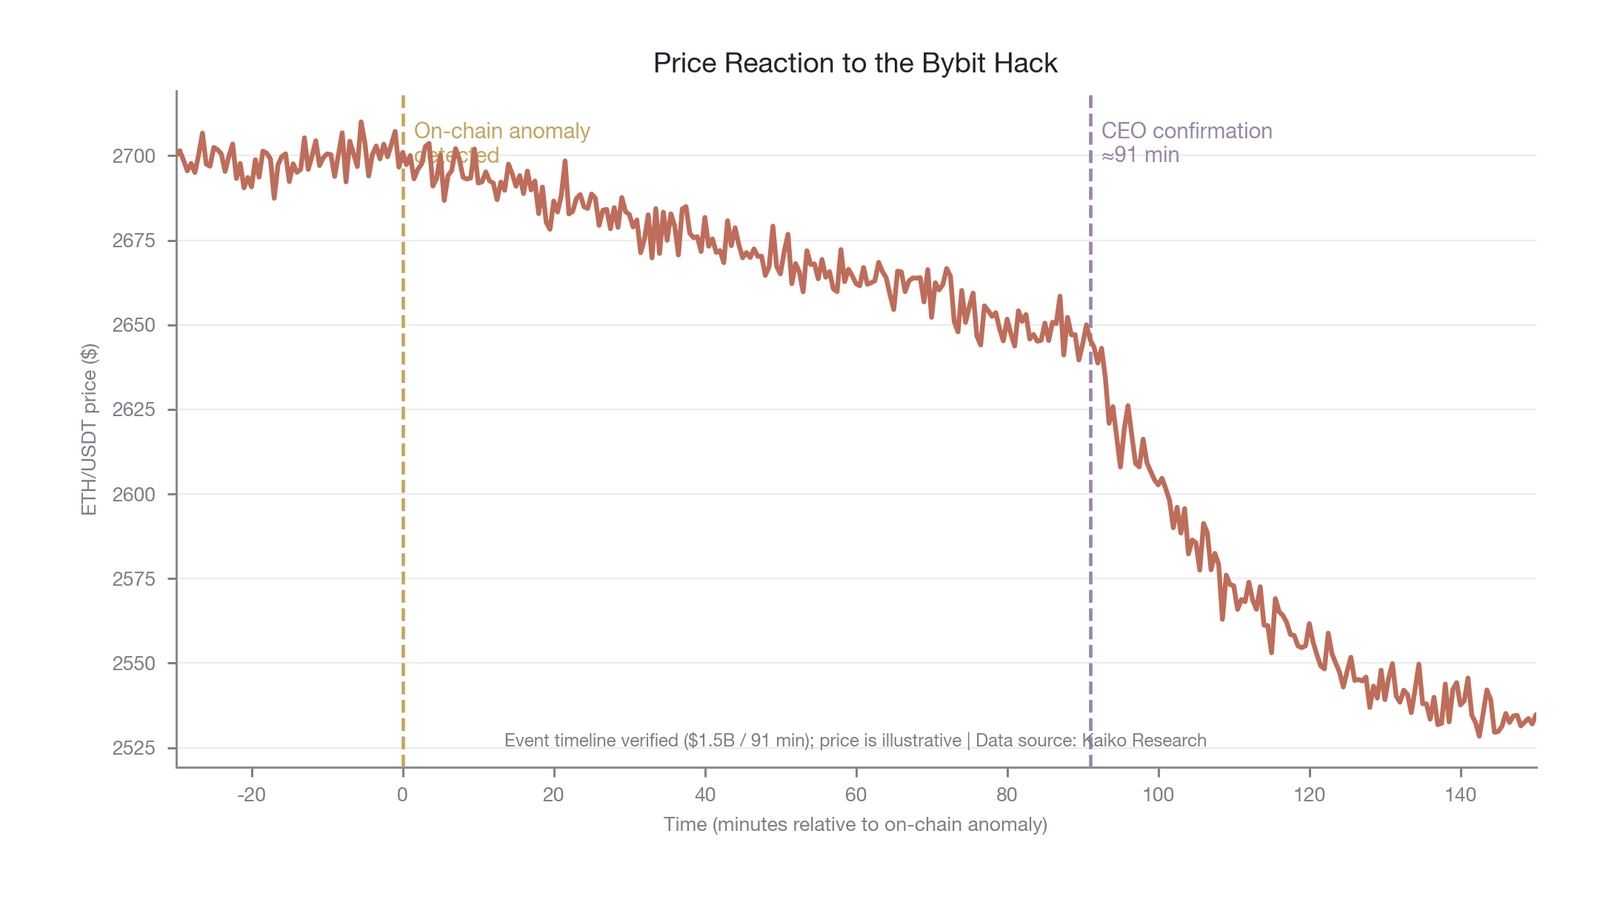
Figure 15-10. The price reaction to the Bybit hack
Figure 15-10 uses a timeline annotated with key nodes to show the price reaction of Bitcoin and Ethereum in the Bybit theft of February 21, 2025. Within the 91 minutes from the on-chain attack (14:13 UTC) to the CEO's first public statement (15:44 UTC), prices had already begun to move down, and over the following days, as the scale of the theft was gradually confirmed at nearly $1.5 billion, Bitcoin broke below the $90,000 mark; the funding rate and basis of perpetual futures deteriorated continuously throughout the window, corroborating the leadership of the derivatives market in digesting negative information. The event nodes in the figure (the theft scale of about $1.5 billion, and the roughly 91 minutes between the on-chain anomaly at t0 and the CEO's first public statement) have been verified; the minute-by-minute curve for Ethereum is an illustrative trajectory (data source: Kaiko Research; not independently verified point by point) and is used only to present the direction and timing of the price reaction.
The Bybit case ultimately tells us that in digital asset markets, semi-strong-form efficiency is far from a simple "yes" or "no" question. It is a complex game about "who, at what time, at what cost, knows what degree of information." On-chain transparency provides raw material for everyone, but the ability to turn raw data into a tradable signal is held only by a few participants with professional tools and knowledge. This structural information advantage shaped by information processing cost is the key to understanding price behavior and the sources of risk in crypto markets.
Efficiency Spectrum Locator Card · Section 15.3
Dimension Positioning Quantitative proxy metric Time Significant information asymmetry and price lag within the event window (minutes to several hours) Share of CAR within the -to- window (e.g., 36% in DeFi hack events) Asset Lower efficiency for tokens involved in a specific event (such as the token of a hacked protocol) Abnormal return of the target asset relative to the market benchmark Information type High efficiency for macro information, moderate for regulatory information, lowest for crypto-native information (on-chain data) Time to complete the event reaction for each information type (second-level vs. week-level vs. hour-level) Market state Under a sudden negative event, information asymmetry intensifies and market efficiency falls significantly Widening bid-ask spreads and liquidity-contraction metrics during crises Market tier Perpetual futures lead spot in reflecting new information, playing an information-amplifying role Magnitude of the negative deviation of the perpetual futures basis and the speed of funding-rate changes One-sentence takeaway: The semi-strong-form efficiency of digital asset markets depends heavily on information processing cost, and perpetual futures, by virtue of their leverage advantage, play a leading pricing role in digesting complex crypto-native information.
15.4 Institutional efficiency
Having tested the reaction of digital asset markets to historical prices (weak-form efficiency) and external public information (semi-strong-form efficiency), our analysis now enters a deeper and more crypto-native layer. The earlier discussion centered mainly on how the market processes exogenous information that arrives at random, but in the digital asset domain, and especially in the perpetual futures market, market efficiency is also deeply shaped by its own internal institutional design. Perpetual futures, the cornerstone of the crypto derivatives market (their volume is estimated to account for more than 93% of all crypto futures volume [22]), are built around a complex set of price-anchoring and risk-management mechanisms involving the funding rate, the mark price, and oracles. While anchoring the perpetual futures price to the spot price, these institutional designs also each create predictable price behavior patterns in their own way. Specifically, the mean-reverting nature of the funding rate mechanism creates structural arbitrage windows; the mark-price smoothing mechanism and the discrete updating of oracles cause systematic lags in information reflection; and high leverage combined with the liquidation mechanism triggers nonlinear price overshooting under extreme market conditions. These predictable efficiency fluctuations, actively shaped by institutional rules, constitute the core content of the "institutional efficiency" dimension of the efficiency spectrum.
This section dissects these institutional efficiency barriers through four progressive layers. We first examine the information content of the funding rate and its nature as a structural gap in weak-form efficiency; then analyze how the funding settlement cycle triggers a "U-shaped" fluctuation in efficiency at the microstructure level, and compare the impact of differences in settlement frequency across exchanges; next explore the information-reflection lag caused by the mark-price and oracle mechanisms; and finally, by analyzing the lead-lag relationship between spot and perpetual futures, reveal the state dependence of price discovery leadership.
15.4.1 Mean reversion in the funding rate
The most central institutional innovation of perpetual futures is the funding rate mechanism. Traditional futures contracts ensure that the futures price ultimately converges to the spot price by setting an expiration date and a delivery mechanism, but perpetual futures have no expiration date and therefore need an alternative means of anchoring the price. The funding rate was designed precisely for this: by periodically exchanging fees between holders of long and short positions, it continuously pulls the perpetual futures price toward the spot index price. When the perpetual futures price is above the spot index price, the funding rate is positive and longs pay shorts, which incentivizes traders to sell perpetual futures or buy spot, thereby narrowing the basis; conversely, when the perpetual futures price is below spot, the funding rate is negative and shorts pay longs, incentivizing the opposite arbitrage. On major exchanges, this settlement typically occurs once every 8 hours. Taking Binance as an example, the funding rate comprises two parts: an interest rate component reflecting the baseline borrowing cost, typically fixed at 0.01% per 8 hours; and a premium component computed as a time-weighted average of the deviation between the perpetual futures price and the mark price. The sum of the two is the funding rate for the period, subject to a cap and a floor; the cap is not a fixed percentage but is set according to the contract's maintenance margin rate (typically about ±2% per 8 hours for standard contracts, and dynamically set at 0.75 times the maintenance margin rate for high-leverage contracts). Exchanges differ in the details of the formula (the implementations of OKX and Bybit differ slightly from Binance's), but the core logic is the same: anchor the perpetual futures price to the spot index through economic incentives [21].
This design gives the funding rate a dual role. At the micro level, it is the direct financing cost of holding a leveraged long or short position, directly affecting traders' profit-and-loss calculations and position decisions. At the macro level, it is a sensitive indicator of overall market sentiment and leverage demand. A high positive funding rate usually means the market is broadly bullish, with strong demand for leveraged longs and traders willing to pay a premium to maintain long positions; a persistently negative funding rate reflects market pessimism or strong hedging demand. The study by He, Manela, Ross, and von Wachter (2024) provides an important empirical foundation for understanding the information content of the funding rate [21]. They found that the price deviation between perpetual futures and spot can be largely explained by past return momentum: the momentum factor of past returns can explain more than 50% of the variation in the futures–spot spread. This means the funding rate is not a random variable but an information carrier that encodes the market's reaction to and expectations about recent price trends.
As we noted when discussing calendar effects in Section 15.2.3, any predictable price pattern constitutes a challenge to weak-form efficiency. The mean-reverting nature of the funding rate is precisely such a typical "institutional weak-form efficiency gap." When the funding rate deviates too far from its long-run mean, the economic incentive mechanism creates powerful countervailing forces. Take the positive extreme: when the funding rate is abnormally high, the "spot-perpetual arbitrage" strategy of shorting perpetual futures while buying an equal amount of spot becomes highly attractive. Traders executing this strategy can not only profit from the future convergence of the basis but also steadily collect the high funding fee while holding the position. This low-risk arbitrage opportunity attracts a large amount of capital, increases the supply of short positions, and thereby drives the funding rate down toward its mean. The scale of this arbitrage quantified by He et al. (2024) (the mean absolute deviation, the Sharpe ratios achievable by retail investors and market makers, and their year-over-year decay) was given in detail in Section 15.2.3 [21] and is not repeated here.
It must be emphasized that this weak-form efficiency gap does not arise from participants' irrational behavior or cognitive biases but is an inevitable result of the funding rate's institutional design. To achieve the core goal of price anchoring, the system must offer sufficiently high economic compensation to attract arbitrageurs, and this compensation itself manifests as price predictability. These seemingly generous arbitrage profits are not a riskless "free lunch," however: as described in Section 15.2.3, Zhivkov (2026) found that a high proportion of economically significant arbitrage spreads ultimately could not be fully executed because of margin requirements and forced liquidations [22]. This reveals an important friction in the mean reversion of the funding rate—arbitrage forces exist and are powerful, but they are constrained by capital limits, the margin system, and liquidity risk, so their correction speed is far slower than theory predicts.
Figure 15-11 uses four panels to show these key statistical properties of the funding rate.
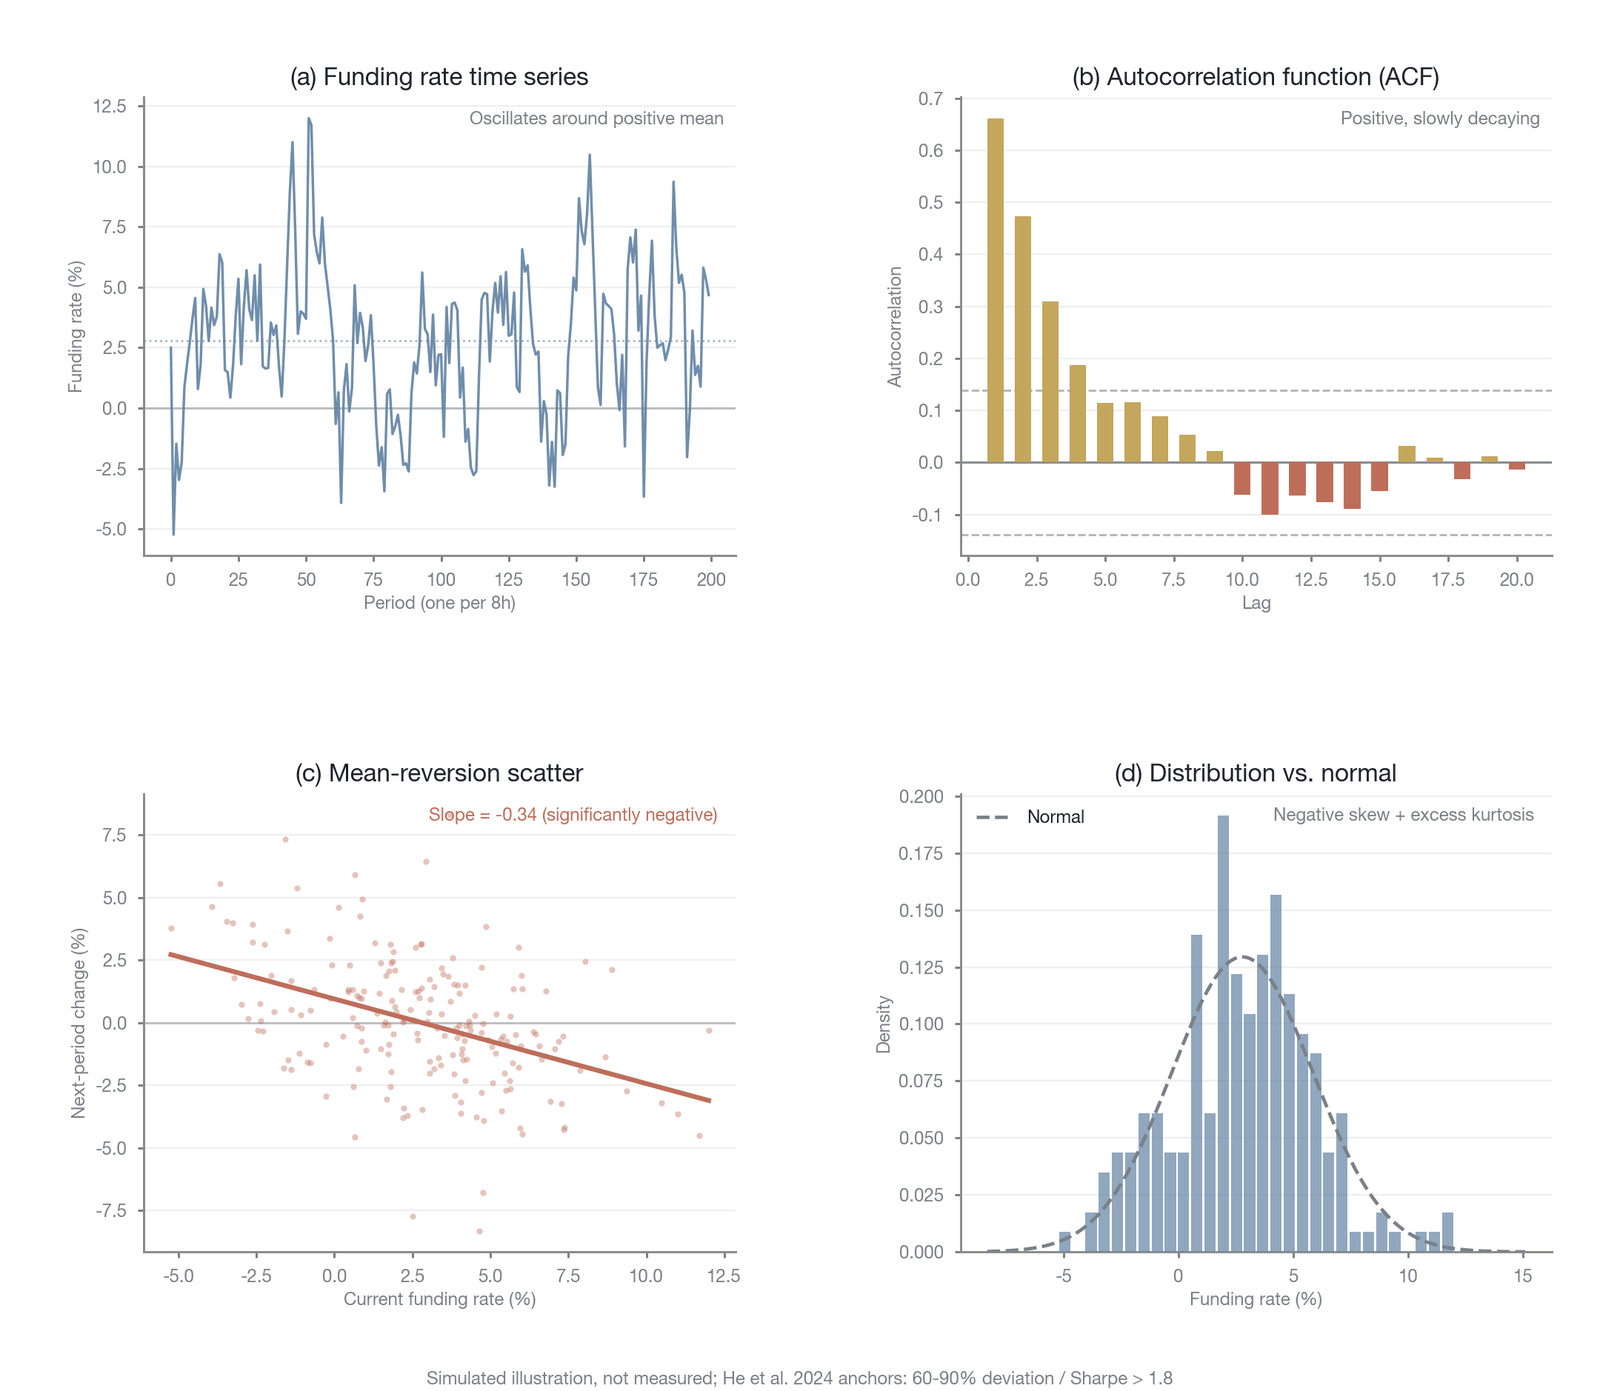
Figure 15-11. The information content and mean-reverting properties of the funding rate
The four panels of Figure 15-11 together characterize the key statistical features of the funding rate: the autocorrelation is significantly positive and decays slowly, indicating short-term persistence; the regression slope of the current rate on the next period's change is significantly negative, confirming mean reversion; and the probability distribution shows negative skew and excess kurtosis relative to the normal, revealing fat tails in which extreme negative-rate events (market panic) exceed what the normal distribution predicts. Within an Ornstein-Uhlenbeck process framework, this negative slope directly yields a half-life estimate: after the funding rate of BTC perpetual futures deviates from its mean, it typically reverts about half of the deviation within one to two settlement cycles. This half-life is not constant: in extreme bull markets, crowded longs slow the reversion of positive rates, and in panic selling the persistence of negative rates may also exceed the historical mean; this asymmetry has direct implications for the holding period and capital planning of an arbitrage strategy.
Taken together, the statistical properties of the funding rate (short-term persistence, long-run mean reversion, and a fat-tailed distribution) make it a predictable economic variable. This predictability directly violates the basic assumption of weak-form market efficiency and constitutes an intrinsic efficiency gap in the perpetual futures market, created by institutional design. This gap is not "free profit," however, but is protected by arbitrage friction, capital constraints, and execution risk. The tension between the absence of efficiency and the imperfection of arbitrage is precisely the key to understanding the institutional efficiency of the perpetual futures market.
15.4.2 Efficiency fluctuations within the settlement cycle
The mean-reverting nature of the funding rate describes the macro dynamics spanning multiple settlement cycles, but within each settlement cycle, the market microstructure likewise exhibits a finer pattern of efficiency fluctuation driven by institutional arrangements. Ruan and Streltsov (2022), in a study based on high-frequency order-book data from 2017 to 2023, found a striking phenomenon: within each 8-hour funding settlement cycle, the microstructure quality metrics of the spot market exhibit a significant "U-shaped" pattern [30]. This finding reveals an hourly efficiency cycle, which we call the pre-settlement effect.
Understanding the mechanism that generates this U-shaped pattern requires starting from traders' strategic behavior around funding settlement. At the moment of settlement, the exchange exchanges cash flows between all outstanding long and short positions according to the prevailing funding rate. If the expected funding rate is high (say 0.1%), then a trader holding a $1 million long position will pay a $1,000 fee at settlement. To avoid this cost, some long holders choose to close their positions before settlement and immediately reopen them afterward. At the same time, arbitrageurs may establish short positions before settlement to collect the funding fee and close them afterward. These strategic behaviors burst out around the moment of settlement, causing sharp changes in order flow and a temporary rise in the proportion of informed trading.
Market makers respond rationally to this foreseeable behavior pattern. Facing the rise in the proportion of informed trading and the intensified adverse selection risk around settlement, market makers strategically widen their bid-ask spreads and reduce quote depth to protect themselves from losses due to an information disadvantage. This behavior produces a clear cyclical pattern: within the window approaching settlement, bid-ask spreads widen, price impact increases, market liquidity deteriorates, transaction costs rise, and market efficiency declines accordingly. After settlement is complete, uncertainty is removed, strategic traders leave, market makers restore normal quotes, market liquidity improves, and efficiency recovers. As time proceeds to the midpoint of the next settlement cycle, the market is in its calmest state and efficiency reaches its peak. Thereafter, as the next settlement point approaches, the entire cycle plays out again.
Figure 15-12 shows the efficiency-fluctuation pattern of four key market-microstructure metrics within a typical 8-hour settlement cycle.
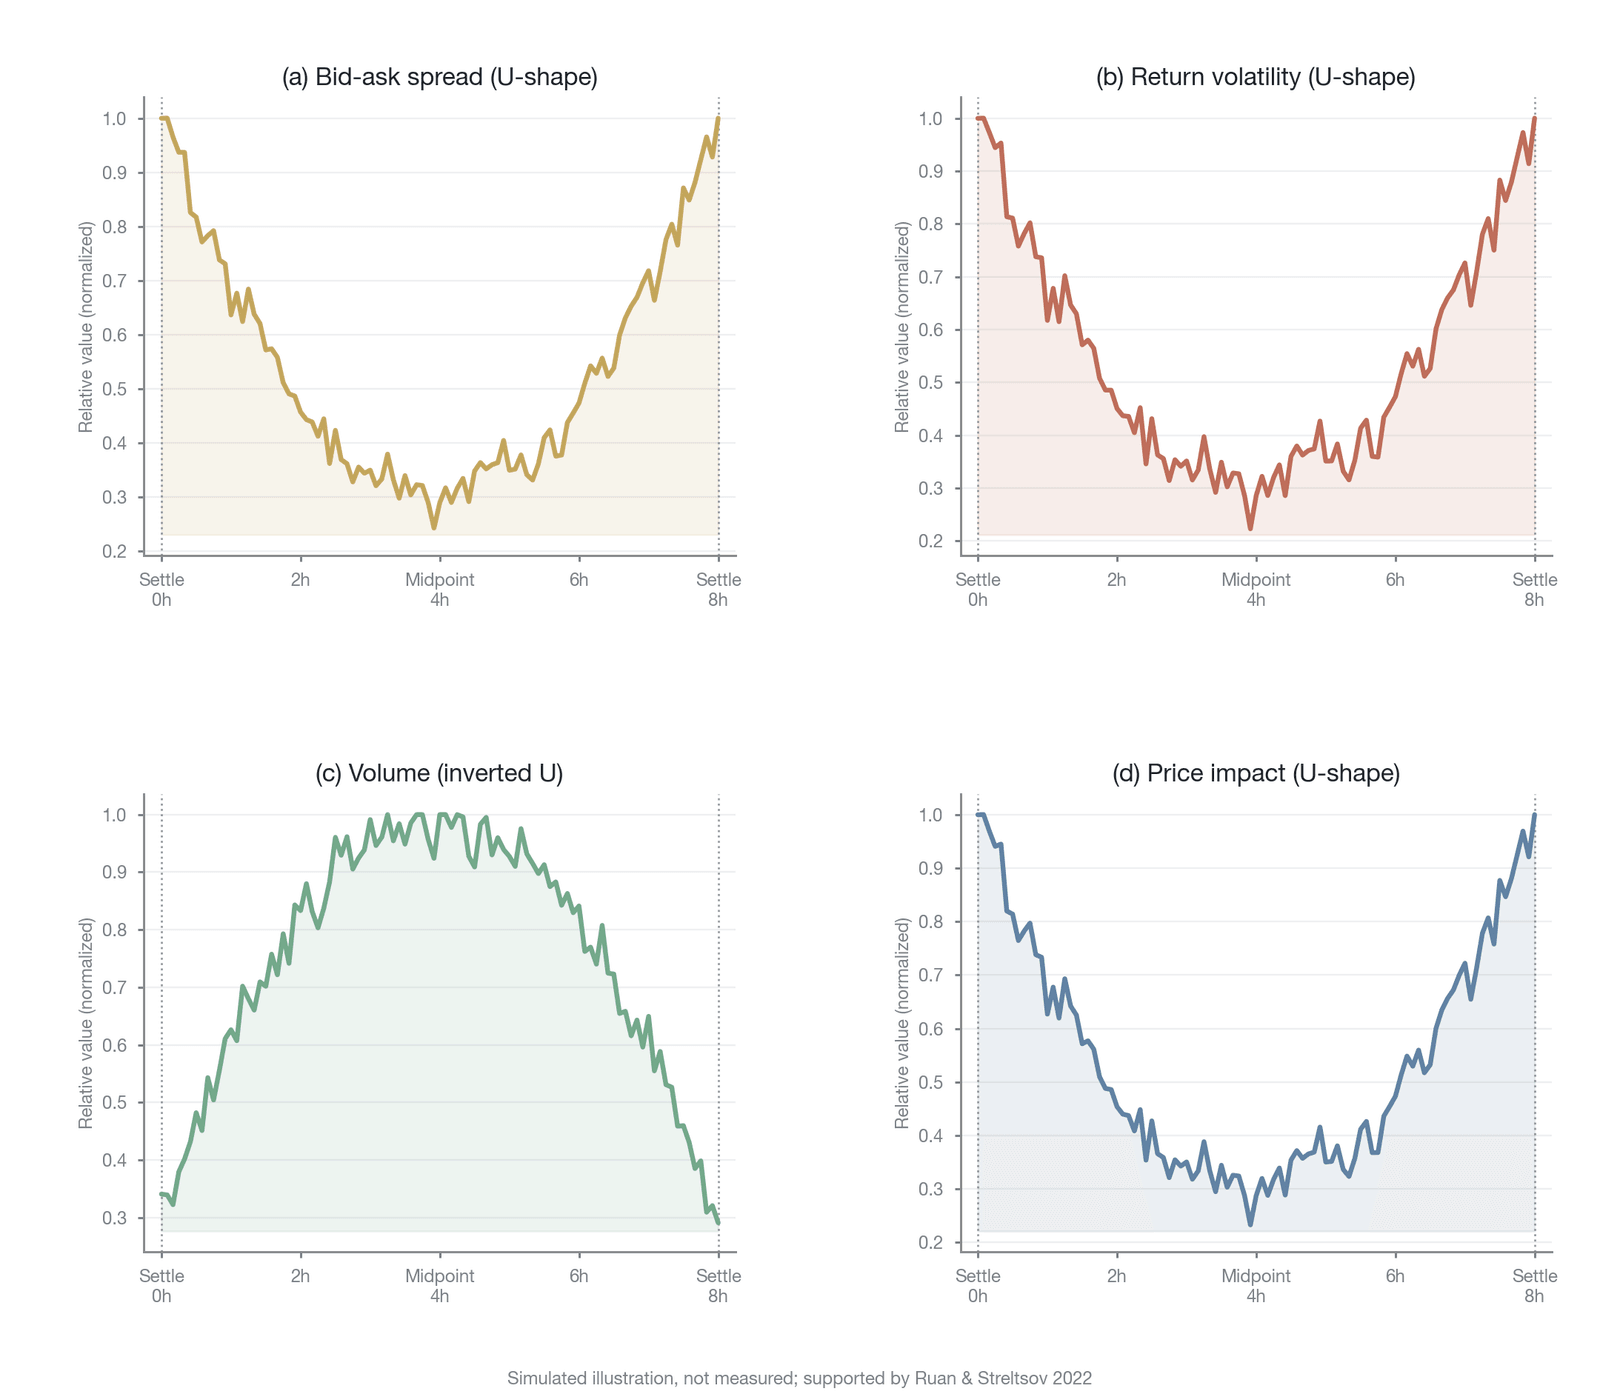
Figure 15-12. Market-efficiency fluctuations within the funding settlement cycle (the U-shaped pattern)
As the figure shows, the bid-ask spread, the price-impact coefficient, and return volatility all peak near the settlement points (0 and 8 hours) and fall to a trough at the midpoint of the cycle (around the 4-hour mark), forming a clear U-shape; trading volume, by contrast, exhibits a complementary inverted U-shape, most active in the middle of the cycle when the market is calmest and transaction costs are lowest. The quantitative analysis of Ruan and Streltsov (2022) shows that the higher the absolute value of the funding rate in a cycle, the more pronounced the increase in the bid-ask spread and price impact around settlement [30], indicating that the pre-settlement effect is not merely statistical but carries real economic costs that substantially affect the execution quality and strategy design of high-frequency traders.
The study by Ruan and Streltsov (2022) also revealed an important moderating factor: the larger the absolute value of the funding rate, the more pronounced this U-shaped pattern [30]. This finding is intuitively reasonable: a larger funding rate means a stronger incentive to close positions or arbitrage, leading to more intense trading around settlement and greater microstructure disturbance. The study also used the natural experiment of Huobi's termination of perpetual futures trading, and 95 staggered contract-listing events as an identification strategy, to further confirm the causal effect of perpetual futures on spot market quality: the introduction of perpetual futures increased spot trading volume but also widened quoted spreads, reflecting the increase in informed trading and market makers' compensation for adverse selection risk [30].
Notably, the magnitude of this microstructure-level efficiency fluctuation depends heavily on the settlement frequency set by the exchange. As Chapter 10 noted in discussing the evolution of the crypto derivatives market, major centralized exchanges (such as Binance and OKX) have long used discrete settlement once every 8 hours as the most common default setting, although in recent years some exchanges have begun to introduce more flexible settlement-cycle options for specific contracts. This relatively long settlement cycle means that the funding fee accumulated in a single settlement is relatively high, giving traders a strong incentive to avoid it and producing the significant U-shaped fluctuation described above. As market competition has intensified and technology has advanced, however, many emerging platforms (such as the DEXs dYdX and Hyperliquid) have begun to adopt 1-hour or even continuous settlement mechanisms.
Higher settlement frequency fundamentally changes the microdynamics of the pre-settlement effect. When the settlement cycle is shortened from 8 hours to 1 hour, the funding fee for a single settlement is greatly diluted, and the transaction cost (fees and slippage) of frequently closing and reopening positions to avoid a tiny single fee far exceeds the funding fee saved. Strategic position-closing behavior therefore decreases significantly, the adverse selection risk faced by market makers falls, and the cyclical widening of the bid-ask spread weakens sharply as a result. This shows that by optimizing institutional parameters (such as raising the settlement frequency), a market platform can effectively smooth this rule-driven efficiency pulse and improve overall market microstructure quality. That said, the above inference that high-frequency settlement smooths the pre-settlement effect is currently based mainly on theoretical reasoning and lacks a systematic empirical comparison of microstructure metrics across platforms with different settlement frequencies, which constitutes an important direction for future research.
15.4.3 Mark price and oracle latency
The third key institutional design of perpetual futures concerns their valuation and liquidation mechanisms. In centralized exchanges and decentralized exchanges, this mechanism is implemented in different ways, but both introduce a specific form of information-reflection lag. This constitutes another institutional efficiency barrier and directly echoes the price-benchmark governance issues discussed in Chapter 14.
In centralized exchanges, to prevent unnecessary forced liquidations caused by the manipulation of a single exchange's price or by a flash crash, the valuation and liquidation judgment of a contract do not directly use that exchange's latest traded price but rather a computed mark price. Taking Binance as an example, the mark price is computed as the index price multiplied by an adjustment factor of one plus the funding basis, where the funding basis is estimated from the linear decay, over the current settlement cycle, of the previous cycle's funding rate. OKX's implementation differs slightly: its mark price takes the median of two values—the exponential moving average of "the index price plus the basis" and "the mid-price of the current best bid and ask." Although the specific formulas differ across exchanges, their common design philosophy is to create a more robust, harder-to-manipulate fair-value benchmark through multi-source data aggregation and basis adjustment. In most exchanges' implementations, the exponential-moving-average smoothing is applied mainly to the computation of the premium component of the funding rate rather than directly to the mark price itself—a distinction that matters for understanding the mark price's response speed under extreme conditions.
This robustness comes at the cost of information immediacy, however. When the market price jumps sharply and rapidly (for example, when major news is released or a large liquidation cascade is triggered), the mark price, because of its inherent multi-source aggregation and smoothing mechanism, moves with a significant lag behind the spot price and the latest traded price. This lag may be only a few seconds under normal market conditions but can extend to tens of seconds or longer under extreme volatility. The consequences of the lag are double-edged: on the one hand, it protects traders from improper liquidation caused by instantaneous price manipulation; on the other hand, it means that when the market moves rapidly, the mark price fails to reflect true market conditions in time, potentially allowing high-risk positions that should have been liquidated to persist, or preventing arbitrageurs from exploiting the true price deviation in time.
In the perpetual futures protocols of decentralized exchanges, the problem of information latency is more acute. Because on-chain protocols cannot directly access real-time off-chain market data, they rely on oracle networks to obtain external price information. Oracle networks (such as Chainlink and Pyth) aggregate prices from multiple off-chain data sources and submit the updated prices to the blockchain. This process introduces multiple layers of latency. At the physical level, the whole process—oracle nodes obtaining prices from data sources, reaching consensus among nodes, broadcasting the transaction to the blockchain, and waiting for it to be packed and confirmed—has inherent network and consensus latency. At the economic level, to save on-chain transaction costs, oracle updates are not continuous but discrete, triggered only when the price change exceeds a preset deviation threshold (such as 0.5%) or a time interval is reached. This means that between two updates, the price used by the on-chain protocol is "stale," with a deviation from the true market price that accumulates over time. Zhivkov's (2026) study quantified the information gap between CEXs and DEXs: centralized exchanges have 61% higher integration in price discovery than decentralized exchanges, and all statistically significant information flows run from CEXs to DEXs, with no reverse causality [22].
Table 15-4 compares the key differences between the CEX mark-price mechanism and the DEX oracle mechanism in reflecting information.
| Dimension | CEX mark price | DEX oracle price |
|---|---|---|
| Data source | Weighted average across multiple spot exchanges | Off-chain data aggregated by an oracle network |
| Update frequency | Near real-time (millisecond-level) | Varies widely by architecture: push-based oracles (e.g., Chainlink) update at minute-level, pull-based oracles (e.g., Pyth) at sub-second level, and native order books (e.g., Hyperliquid) in near real-time |
| Smoothing mechanism | EMA smoothing, moving average of the basis | Median aggregation, deviation-threshold triggering |
| Typical latency | Normally <1 second; seconds to tens of seconds under extreme conditions | Normally 3–15 seconds; up to minute-level under extreme conditions |
| Manipulation resistance | High (multi-source aggregation, though it depends on the number of constituent exchanges, weight concentration, and outlier-detection mechanisms; see Chapter 14) | Medium to high (depends on oracle design, number of data sources, and consensus mechanism) |
| Information completeness | High (close to the real-time state of the market) | Medium (discrete snapshots that may miss rapid moves) |
| Cost structure | Computed internally by the exchange, at no additional cost | On-chain transaction costs limit update frequency |
Table 15-4. Comparison of the information-reflection mechanisms of the CEX mark price and the DEX oracle (Data source: compiled by the author)
Figure 15-13 offers an intuitive comparison of how these two mechanisms reflect information during a sharp price-jump event.
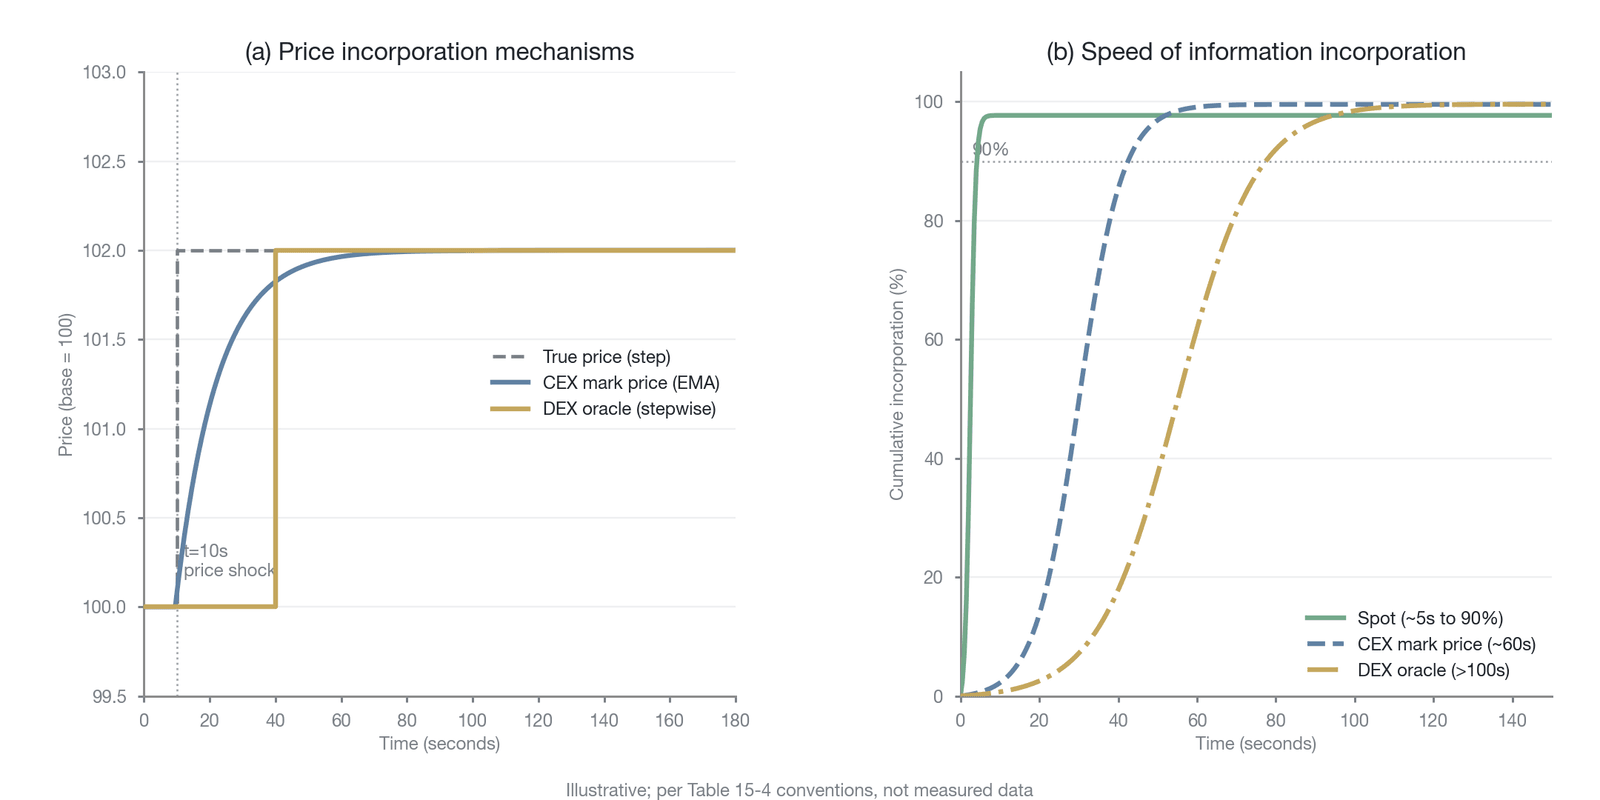
Figure 15-13. The effect of mark-price smoothing and discrete oracle updates on information-reflection speed
Panel (a) shows that when the spot price jumps instantaneously at the 10th second, the CEX mark price catches up slowly along a gentle S-curve because of EMA smoothing, forming a "mark-price lag," while the DEX oracle price updates in discrete steps, with several seconds of "information vacuum" between updates. Panel (b) quantifies this gap in terms of cumulative information incorporation: to reach 90% incorporation, spot needs only about 5 seconds, while under an extreme flash crash the CEX mark price needs about 60 seconds and the DEX oracle may need more than 100 seconds (in day-to-day volatility, the CEX mark price's typical tracking lag is on the order of 5 to 15 seconds). The time gap between the spot price and the oracle price is precisely the "efficiency gap" created by the market's institutions themselves.
The real-world impact of this institutional latency is far from an abstract theoretical discussion. During sharp market volatility, the lag of the mark price can cause the liquidation mechanism to fail: high-leverage positions that should have been liquidated in time survive because the mark price has not yet caught up, accumulate larger losses, and finally trigger a larger-scale cascade of liquidations when the mark price catches up. For DEXs, oracle latency also creates an arbitrage opportunity known as oracle extractable value (OEV), in which informed traders exploit the known deviation between the on-chain oracle price and the true market price to execute profitable trades on the DEX—essentially a systematic extraction of value from liquidity providers. The scale of OEV is not trivial; industry estimates suggest it can reach the order of hundreds of millions of dollars per year in on-chain perpetual futures, directly eroding the returns of liquidity providers and distorting market-making incentives. Several protocols are currently developing auction mechanisms to reclaim this value—for example, by handing the priority ordering of oracle-update rights to a competitive auction, so that the extracted value can flow partly back to the protocol or to liquidity providers. Moreover, unlike front-running in traditional finance, the source of OEV lies in the discreteness and predictability of on-chain price information, which means that as long as the oracle-update mechanism retains its discrete character, this structural value extraction is hard to eliminate entirely. Beyond update latency, oracle networks also face accuracy risks, including manipulating the oracle's input price through flash loan attacks on low-liquidity exchanges, common-mode failure risk when oracle nodes use the same infrastructure, and blockchain congestion that prevents update transactions from being confirmed in time. These risks can cause on-chain protocols to execute liquidations or settlements based on erroneous price signals, damaging market efficiency far more severely than mere latency. Together, these phenomena show that the price-benchmark design of perpetual futures, in pursuing robustness and manipulation resistance, inevitably introduces a loss of informational efficiency. How to strike the optimal balance between these two goals is precisely the core issue of price-benchmark governance discussed in Chapter 14.
15.4.4 Price discovery leadership
Having dissected the institutional efficiency barriers within perpetual futures, a naturally following question is: what role does this vast, active derivatives market play in the price discovery of the entire crypto ecosystem? Is it merely a passive follower of the spot market, or has it become the main force leading price movements? Analysis of this lead-lag relationship is the final step in assessing the informational efficiency of the perpetual futures market.
In financial econometrics, there is a mature methodological system for quantifying the contribution of different markets to price discovery. The information share model proposed by Hasbrouck (1995) is one of the most widely applied tools [31]. The model is based on a vector error correction model, and its core logic is this: if two markets trade the same underlying asset (or an economic equivalent), their prices should converge in the long run (that is, a cointegration relationship exists), but they may deviate in the short run. The information share measures the proportion of each market's contribution to the permanent movement of this common efficient price. If a market's information share is 70%, it means that market contributes 70% of the variance of the permanent movement of the efficient price—that is, it plays a dominant role in price discovery. The complementary Gonzalo-Granger component share model measures each market's contribution to the long-run equilibrium price from the perspective of error correction. The Hasbrouck information share is somewhat sensitive to the ordering of variables in the vector autoregression model, and what is usually reported is the average of the upper and lower bounds. In crypto markets, because the price-update frequency between perpetual futures and spot is often asymmetric, and because the data frequency used in different studies (ranging from tick-by-tick to minute-level) also affects the estimates, the information-share values reported in different studies should not be compared simply side by side.
A large body of academic research has applied these methods to the spot–futures price discovery analysis of crypto markets and reached a fairly consistent conclusion: the futures market, and especially the perpetual futures market, dominates price discovery for major assets such as Bitcoin and Ethereum. The early study by Kapar and Olmo (2019), using the Hasbrouck information share method, found that the Bitcoin futures market's information share was as high as 88.7%, while the spot market's was only 11.3% [32]. The dedicated study of BitMEX perpetual futures by Alexander, Choi, Park, and Sohn (2020) confirmed that BitMEX's derivative price movements led those of major spot exchanges, with a positive net spillover from derivatives to spot [33]. The most recent study by Robertson and Zhang (2025) further confirmed the leading role of the futures market in Bitcoin price formation and noted that trade size is the key factor determining the contribution to price discovery [34].
The dominance of perpetual futures in price discovery is not accidental but is determined by their institutional features. Compared with the spot market, the perpetual futures market offers lower transaction costs (no need to actually deliver the underlying asset), higher leverage (typically up to 20x to 125x), and a more convenient short-selling mechanism (no need to borrow the asset). These features allow informed traders to inject their views into the market at lower capital cost and higher speed. A trader wishing to go long Bitcoin on the basis of a piece of news need only deposit a small amount of margin to establish a large position in the perpetual futures market, whereas in the spot market they would need to mobilize the full amount of capital. This leverage effect makes perpetual futures the venue of choice for informed traders, giving them the first-mover advantage in price discovery.
This leading position is not fixed, however, but exhibits strong state dependence: as the adaptive markets hypothesis holds, the market's efficiency structure changes dynamically with the evolution of participants, technology, and the external environment. Figure 15-14, based on multiple studies, depicts the evolution of the information share of perpetual futures and the spot market in price discovery from 2019 to 2025.
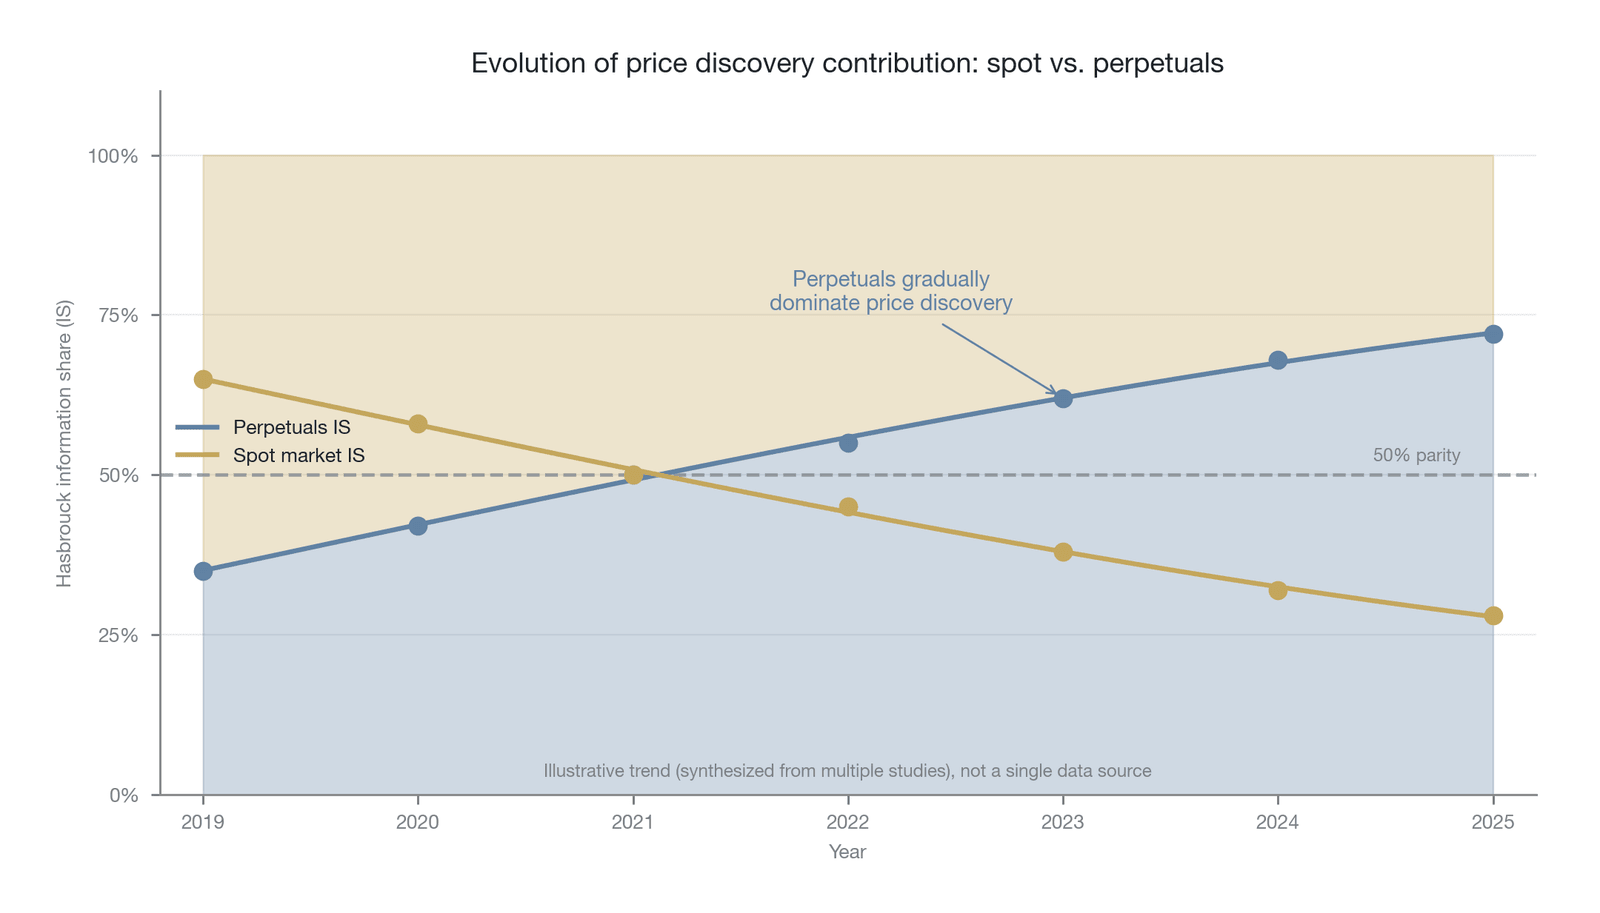
Figure 15-14. The price discovery contribution of spot and perpetual futures: the evolution of the Hasbrouck information share
Figure 15-14 synthesizes multiple studies (Kapar and Olmo (2019) [32], Alexander et al. (2020) [33], Robertson and Zhang (2025) [34]) to depict the evolution of the Hasbrouck information share of perpetual futures and the spot market from 2019 to 2025 (the moving average is an illustrative trend reflecting the direction reported in the literature rather than the precise calculation of a single continuous data source). The information share of perpetual futures is above the 50% parity line most of the time and has risen over time from about one-third early on to the majority share in the mature period (the specific values differ significantly by trading venue, estimation method, and sample period, and the literature is not unanimous), reflecting the deepening of liquidity and the increase in institutional participation; but during major market shocks, this dominance undergoes a brief and significant reversal.
Under extreme stress, the institutional advantage of perpetual futures often quickly turns into institutional risk. As Chapter 11 analyzed in detail in its discussion of liquidation mechanisms, when the market encounters a black-swan event that triggers a sharp decline, the high-leverage nature of perpetual futures triggers large-scale forced liquidations. These forced liquidations are essentially market sell orders executed at any cost, which push prices lower still, trigger more liquidations, and form a destructive liquidation cascade. In this extreme environment, the liquidity of the perpetual futures market can evaporate instantly, counterparty risk rises sharply, and the once-leading price discovery mechanism is nearly paralyzed. At such times, traders tend to return to the most basic spot market, which carries no liquidation risk or leverage-collapse risk. During a crisis, therefore, the spot market often temporarily recaptures the leadership of price discovery.
In the COVID crash of March 2020, the information share of perpetual futures fell sharply. The extreme market panic of this period caused large-scale cascading liquidations, and the spot market briefly dominated price discovery. A similar pattern played out again in the FTX collapse of November 2022. As one of the largest perpetual futures trading platforms at the time, FTX's collapse directly undermined the overall credibility and liquidity of the perpetual futures market. De Blasis and Webb (2022) likewise observed that during market dislocations, significant spillover effects and arbitrage opportunities emerge between different types of futures contracts [35]. The approval of spot Bitcoin ETFs in January 2024 represented a different type of shock: this event directly benefited the spot market, and a large amount of capital poured into the spot market through the ETF channel, temporarily raising the information contribution of spot trading.
Taken together, the perpetual futures market plays a central but not absolute role in the price discovery of digital assets. Although it contains predictable efficiency barriers triggered by institutional designs such as the funding settlement cycle, mark-price smoothing, and oracle latency, its efficient trading mechanism and enormous liquidity make it the main venue for information to be incorporated into prices under the vast majority of market conditions. This reveals a striking paradox of market efficiency: a market that contains multiple institutional "inefficiencies" at the micro level nonetheless becomes the main price discovery engine of the entire ecosystem at the macro level. Understanding this multilevel, seemingly contradictory efficiency structure is the key to grasping the operating logic of digital asset markets, and it lays the necessary analytical foundation for the next section's in-depth analysis of the FTX collapse, in which the institutional efficiency of the perpetual futures market underwent an extreme stress test.
Efficiency Spectrum Locator Card · Section 15.4
Dimension Positioning Quantitative proxy metric Time Predictable microstructure fluctuations around funding settlement U-shaped cycle in bid-ask spread and volatility Asset Major-asset (BTC/ETH) perpetual futures dominate price discovery Information share of perpetual futures (typically 70%–80%) Information type Institutional signals (such as extreme funding-rate values) have weak-form predictability Funding-rate autocorrelation, arbitrage Sharpe ratio Market state Under extreme stress, perpetual futures efficiency falls sharply and spot recaptures leadership Sharp drop in the perpetual futures information share during crises Market tier In the normal state, perpetual futures lead spot but are subject to mark-price latency Reflection-time gap between the oracle/mark price and the spot price One-sentence takeaway: The institutional design of perpetual futures (funding rate, mark price, liquidation mechanism) creates predictable weak-form efficiency gaps, and although perpetual futures dominate price discovery in the normal state, their institutional advantage quickly flips into liquidity risk under extreme market conditions.
15.5 The FTX collapse: a case study
The preceding sections provided theoretical tools and empirical tests for assessing the informational efficiency of digital asset markets, and the collapse of the FTX exchange in November 2022 provides an ideal ultimate stress test for these tools and theories. FTX's rapid collapse was not only one of the most significant bankruptcies in cryptocurrency history (its founder, Sam Bankman-Fried, was ultimately sentenced to 25 years in prison for fraud) but also a comprehensive test of the multidimensionality, complexity, and state dependence of market efficiency. It clearly revealed the market's starkly different efficiency performance in processing different types of information: in processing simple, observable on-chain information, the market exhibited extremely high semi-strong-form efficiency; in the face of complex, hidden structural fraud, the market exhibited long-lasting, significant inefficiency; and in the process of crisis transmission, the market exhibited a destructive "over-efficiency"—an irrational contagion effect.
This section dissects the event in depth by reconstructing the key timeline and analyzing it systematically along three core dimensions of the efficiency spectrum (the high efficiency of on-chain information, the low efficiency of complex information, and the over-efficiency of the contagion effect). The earlier sections established the five-dimensional analytical matrix of the efficiency spectrum and separately conducted empirical tests of weak-form efficiency, semi-strong-form efficiency, and the institutional efficiency of perpetual futures. The FTX event happens to span multiple quadrants of these dimensions, providing an ideal opportunity to apply all the analytical tools together. Just as the adaptive markets hypothesis predicts, market efficiency collapses nonlinearly and sharply under extreme stress, and the FTX event is the most representative validation of this prediction. Through an in-depth dissection of this case, we ultimately demonstrate that informational efficiency is not a black-and-white binary state but a continuous spectrum dependent on information type, market state, asset characteristics, and time scale. The FTX event occurred in 2022, after the crypto market had already experienced a series of major shocks such as the Terra/LUNA collapse and the bankruptcy of Three Arrows Capital, so the market should have learned from those earlier lessons and remained more vigilant against similar structural risks. Yet the collapse of FTX shows that the market's process of learning and adaptation is far slower and more uneven than theory predicts, and this observation is itself an important test of the concept of "adaptation" in AMH.
15.5.1 Reconstructing the event timeline
FTX's collapse did not happen in an instant but was a continuous process of information gradually fermenting, market sentiment shifting sharply, and finally liquidity drying up and trust collapsing. Understanding this timeline is essential for analyzing market efficiency, because it reveals how different types of information were digested (or ignored) by the market at each stage. We divide this process into four key stages: the latent period, the information diffusion period, the rapid collapse period, and the post-bankruptcy period. Figure 15-15 uses the changes in FTT's price and volume to present intuitively the rhythm and intensity of the market's reaction during this process.
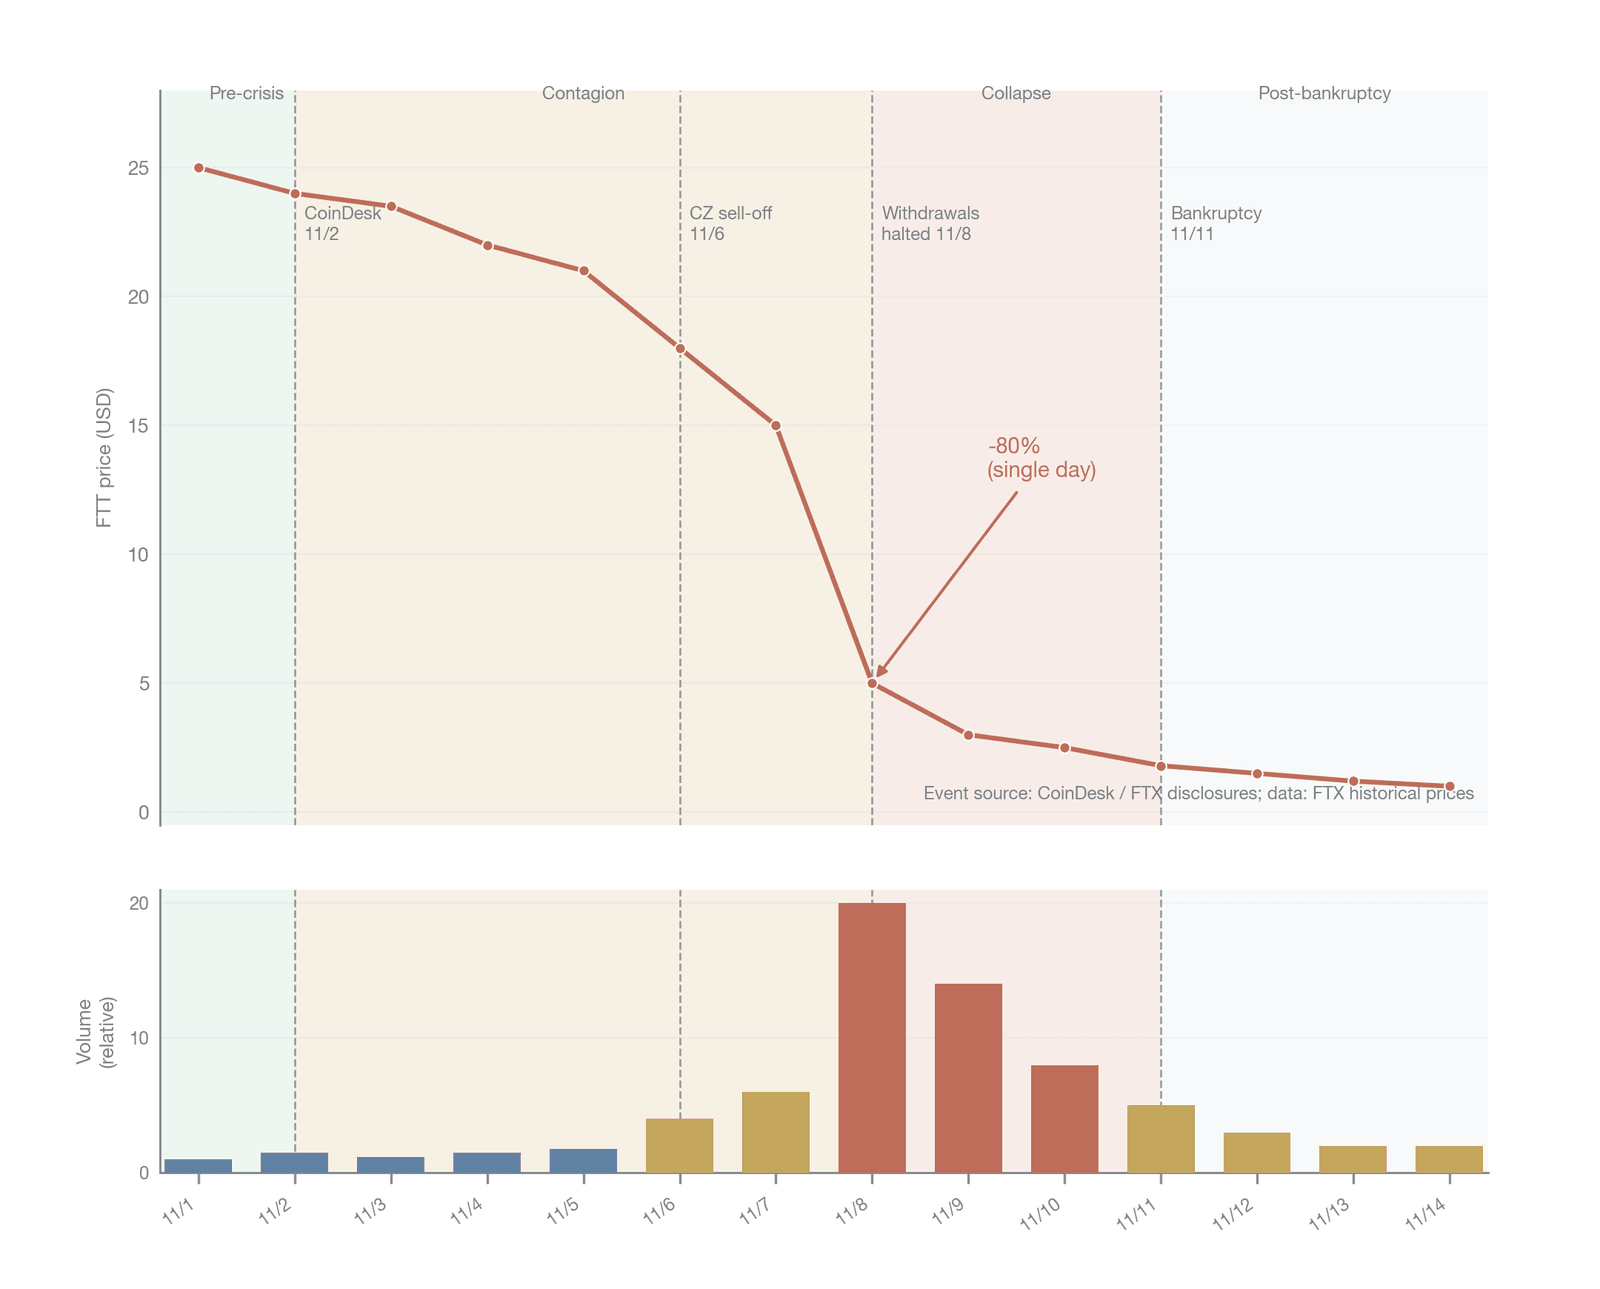
Figure 15-15. The FTX collapse timeline and the FTT price
Figure 15-15 shows the daily price (upper panel) and volume (lower panel) of FTT from November 1 to 14, 2022, with vertical dashed lines marking the four key events that triggered violent reactions, and background shading dividing the crisis into four stages: pre-crisis (green), the information diffusion period (yellow), the rapid collapse period (red), and post-bankruptcy (gray). Arrows in the price panel mark FTT's single-day decline of more than 80% on November 8, while the volume panel shows the abnormal amplification of trading activity at the height of the crisis.
The first stage, the latent period before the crisis (before November 2), the market appeared calm on the surface. FTT's price was stable around $25, average daily volume was at normal levels, and implied volatility showed no anomaly. Behind the surface data, however, the circular leverage and balance-sheet problems centered on FTT that had long existed between FTX and its affiliated trading firm, Alameda Research, had already planted the seeds of the collapse. From the perspective of the efficiency spectrum, the market's performance in this stage is precisely a typical manifestation of the low efficiency of complex information: structural risk already objectively existed, and warning signals were not lacking in the on-chain data, but the market failed to integrate these scattered signals into a coherent risk judgment. From the perspective of strong-form efficiency, the insiders of FTX and Alameda undoubtedly held private information about the true state of the balance sheet, and this information went unpriced by the external market for years, constituting an extreme case of the failure of strong-form efficiency. As the study by Vidal-Tomás et al. (2023) summarizes, FTX and Alameda used the vast quantity of FTT tokens they controlled as a leverage tool, creating a financial conglomerate that looked enormous but was extremely fragile, and this fragility was almost unpriced by the market before the collapse [36]. Notably, this prolonged collective oversight was not because the information was completely unavailable (the public nature of the blockchain ensured that fund flows were traceable) but because the cognitive cost and analytical capability required to turn this raw data into a risk judgment far exceeded the capacity of most market participants.
Within this latent period, if we introduce the perpetual futures perspective, we find that the derivatives market likewise failed to price this structural risk in advance. The funding rate of FTT perpetual futures stayed within a normal fluctuation range near the zero axis before November 2, showing no systematic short-side tilt; the basis between perpetual futures and spot also stayed within a reasonable arbitrage range, and open interest remained stable. This shows that even the perpetual futures market participants, usually thought to have an information advantage and to be more adept at price discovery, failed to see through FTT's "market-cap illusion."
The second stage, the information diffusion period (November 2 to November 6), began with a key media report. On November 2, 2022, the crypto media outlet CoinDesk published an investigative report disclosing details of Alameda Research's balance sheet, noting that of its $14.6 billion in assets, about $5.8 billion was in FTT tokens (of which about $3.66 billion was unlocked FTT and about $2.16 billion was FTT posted as collateral) [37]. This report exposed for the first time the blurred boundary between the two companies and their excessive reliance on their own issued token. From the perspective of informational efficiency, the CoinDesk report played a key role: it acted as an information intermediary, turning high-processing-cost raw on-chain data and financial documents into a simple, easily transmissible narrative signal. This is precisely a direct manifestation of the information-processing-cost theory discussed earlier in the semi-strong-form efficiency tests. Between information "being publicly available" and being "widely understood" by the market lies a gulf constituted by processing cost, and media reporting is precisely the bridge across that gulf.
The market's initial reaction to the CoinDesk report was relatively mild, with FTT's price falling only about 3% to near $24. This sluggish reaction is itself worth pondering: it shows that even after the information had been processed and disseminated by the media, the market still needed time to digest its meaning and assess its actual impact on FTX's solvency. During these few days of the information diffusion period, discussion on social media gradually heated up, and opinion leaders and analysts in the crypto community began to interpret Alameda's balance sheet more deeply. The market's overall reaction remained gradual rather than explosive, however, consistent with the reaction pattern to complex crypto-native information observed earlier in the semi-strong-form efficiency tests: information needs to go through multiple rounds of dissemination and interpretation before market consensus can gradually form.
The key turning point came on November 6. Changpeng Zhao, the chief executive officer of Binance—the world's largest cryptocurrency exchange—publicly announced on a social media platform that, out of risk-management considerations, Binance would liquidate all of its remaining FTT tokens on its books (about 23 million, worth about $530 million at the time) [38]. This public statement from a core market participant carried far more information than any media report, because it not only confirmed the existence of the risk but also directly foreshadowed the imminent arrival of a massive wave of selling. Zhao's statement turned an abstract discussion about balance-sheet structure into a concrete threat about immediate market supply and demand, greatly reducing the information processing cost so that even the least sophisticated market participants could understand its meaning. From the perspective of semi-strong-form efficiency, the effect of this statement was similar to the standardized binary signal discussed earlier (such as a regulatory approval or rejection); its information content was clear and its interpretation cost low, so the market reacted quickly and violently.
Accompanying Zhao's statement, the perpetual futures market was the first to issue a clear warning signal. On the evening of November 6, the FTT perpetual futures funding rate on major exchanges began to turn sharply negative, reflecting the rapid massing of short-side forces; at the same time, the perpetual futures price began to fall significantly below the spot price, and the basis went into a deep inversion. Over the following 48 hours, as panic spread, the open interest of FTT perpetual futures began to fall sharply, marking the panic-driven closing or forced liquidation of a large number of leveraged positions. These synchronous and even slightly leading violent reactions of the perpetual futures market provide a microstructure perspective on the crisis that the spot market cannot offer.
The third stage, the rapid collapse period (November 6 to November 11), the market's efficiency entered the "decay state" defined by the efficiency spectrum framework—a nonlinear efficiency collapse driven by a negative feedback loop. Zhao's statement triggered a wave of FTT selling, and its price began to fall significantly on November 7, from about $23 to about $21. The true disaster occurred on November 8, however. That day, the FTT price plunged from about $22 to less than $5 within 24 hours, a decline of more than 80%, and volume surged to dozens of times its normal level. The speed and magnitude of this price collapse far exceeded any reasonable adjustment range based on fundamental analysis; what it reflected was a liquidity-driven negative-feedback spiral: the price decline triggered margin calls on loans collateralized by FTT, forced liquidations pushed the price down further, and the further price decline triggered still more liquidations, a process that self-reinforced in the absence of an external liquidity injection until the price approached zero. This mechanism has dynamics similar to the forced-liquidation cascade in the perpetual futures market discussed earlier, except that in the FTT case the trigger was not insufficient margin but the collapse of collateral value.
At the same time, a large number of users rushed to the FTX exchange to withdraw funds, triggering a classic bank run. According to bankruptcy filings later disclosed, FTX faced about $6 billion in withdrawal requests between November 6 and 8, far exceeding its available liquid assets [39]. Unlike a traditional bank run, withdrawals from a crypto exchange face distinctive operational bottlenecks: congestion on the blockchain network and surging gas fees slow the on-chain confirmation of withdrawals, and the exchange's cold-wallet–hot-wallet architecture means that large-scale withdrawals require retrieving assets from cold storage, a process with inherent operational latency. More crucially, the withdrawal delays were themselves interpreted by market participants as a signal of insufficient solvency, further accelerating the flood of withdrawal requests and forming an operational-level positive feedback loop. Facing dried-up liquidity, FTX suspended user withdrawals on November 8. Although technically intended to protect the remaining assets, this decision released the most critical negative signal at the informational level: it confirmed to the market that FTX was already effectively insolvent. In traditional banking, suspending withdrawals is usually the harbinger of a bank failure; in the context of a crypto exchange, this signal has an equally serious effect. Notably, Binance had that day announced that it had signed a non-binding letter of intent to acquire FTX in order to resolve its liquidity crisis. This news briefly stabilized market sentiment, and the FTT price rebounded modestly after it broke. Just one day later (November 9), however, Binance announced it was abandoning the acquisition, citing that after preliminary due diligence it had found FTX's problems "beyond our control or ability to help" [40]. The disappearance of this acquisition possibility marked the loss of FTX's last avenue of external rescue and the market's transition from the "decay state" into a complete collapse of trust.
The fourth stage, the post-bankruptcy period (after November 11), the situation became largely clear. On November 11, 2022, FTX, Alameda Research, and about 130 affiliated companies formally filed for Chapter 11 bankruptcy protection in the United States. In his sworn declaration, the new chief executive officer, John J. Ray III, wrote that this was the "most serious corporate governance failure" he had seen in his career, its chaos exceeding even the Enron bankruptcy he had once handled [39]. The price of the FTT token soon fell to the $1-to-$2 range and long lingered there; its market capitalization (by circulating supply) shrank by more than 90%, from about $3 billion before the collapse to roughly $200 million. This unprecedented collapse in crypto history took less than 10 days from the disclosure of the key information to the final bankruptcy, and this speed is itself strong proof of how fast information is transmitted in digital asset markets under crisis conditions; it also reveals how severe the fragility of crypto markets is in the absence of the safety nets of the traditional financial system (such as the central bank's lender-of-last-resort function and deposit insurance).
Reviewing this complete timeline from the time dimension of the efficiency spectrum, a striking pattern emerges: the market's reaction to FTX risk exhibited an extreme nonlinearity. During the years-long latent period, although on-chain data continually issued warning signals, the market's reaction was nearly zero; during the mere few days of the information diffusion period, the market's reaction warmed gradually from mild; and during the final collapse period, the market's reaction was explosive and irreversible. This sharp leap from "zero reaction" to "overreaction" exhibits the characteristic features of a typical nonlinear transition: the system maintains surface stability under long-accumulated pressure and undergoes a sharp state transition once a critical threshold is breached. In financial markets, the trigger of such a nonlinear transition is often not a change in the information itself but the critical moment when information turns from "private knowledge" into "common knowledge." Zhao's tweet played precisely the role of triggering this consensus shift.
15.5.2 High efficiency in processing on-chain information
Reviewing the FTX event from the perspective of informational efficiency, the first conclusion to emerge is seemingly paradoxical but revealing: in processing simple, directly observable on-chain information, the market exhibited extremely high semi-strong-form efficiency. This "high efficiency" needs to be defined precisely. It does not mean that the market reacted to all on-chain signals immediately; rather, it means that once the on-chain evidence of fund flows between Alameda and FTX was turned by professional information intermediaries into an easily understood signal, the market could rapidly and violently price it in. This distinction matters because it corresponds precisely to the information-processing-cost framework established earlier: the bottleneck of efficiency lies not in the availability of information but in its interpretability.
Blockchain transparency meant that Alameda Research's fund movements were, to a large extent, an "open secret." Professional on-chain analysts and data platforms, such as Nansen and Arkham Intelligence, could monitor the fund flows between them in real time by labeling and tracking known Alameda and FTX wallet addresses. In fact, months or even years before the CoinDesk report, on-chain data had already clearly revealed several key facts. Nansen's post-event analysis documented these on-chain traces in detail [41]. Of FTT's total token supply of about 328 million, FTX and Alameda themselves controlled as much as roughly 80%, meaning that its true external free float was extremely low. More telling still, during the Terra/LUNA and Three Arrows Capital collapses of mid-2022, on-chain data showed large-scale fund flows between Alameda and FTX: Alameda transferred about $4 billion worth of FTT tokens to FTX, while FTX provided Alameda with loans sourced from user assets. These transactions were fully public on the blockchain, and any observer with basic on-chain analysis tools could trace them. In addition, in the weeks before the crisis erupted, on-chain data also showed an anomalous outflow pattern from Alameda's wallets, including the transfer of large amounts of stablecoins and ETH to multiple exchanges, behavior later interpreted as Alameda's attempt to move assets and hedge risk before the crisis fully broke.
Nonetheless, although this on-chain information was publicly available, it was raw and unprocessed, mixed into the massive daily data stream of millions of transactions on blockchains such as Ethereum and Solana. As discussed earlier with respect to semi-strong-form efficiency, the high information processing cost constitutes a structural information asymmetry among market participants. Only a few informed traders with professional tools and deep domain knowledge (including researchers at on-chain analysis firms, professional quant funds, and seasoned investors deeply involved in the crypto ecosystem) could turn this raw data into tradable insight. For the vast majority of market participants, interpreting this on-chain data required understanding Ethereum's address-labeling system, the semantics of token transfers, the logic of smart-contract interactions, and the details of FTT's token-economic model, and this knowledge constituted a very high information barrier. Therefore, before the CoinDesk report of November 2, although on-chain alarms were frequent, the market had not formed common knowledge in the economic sense—the state in which all participants know a piece of information and all participants know that other participants also know it. As a result, prices had not reacted fully to these scattered signals.
As described in Section 15.5.1, the CoinDesk report and Zhao's liquidation statement successively translated high-processing-cost on-chain information into low-cost common knowledge, a process essentially of socializing the information processing cost: the media and analysts bore the cost of turning raw data into an understandable signal, so that ordinary investors could obtain the key information without conducting on-chain analysis themselves. And Zhao's public liquidation as a market giant holding a vast FTT position, from a game-theoretic perspective, turned "private information" about FTX risk into "common knowledge"—every participant knew that others had also seen the message and would act on it.
From this angle, the FTX event strongly corroborates the finding of Azar et al. (2025) about the efficiency loss caused by information processing cost [5]. By analyzing cases of DeFi protocols being hacked, that study found that about 36% of the price decline occurred within the time window between the on-chain recording of the attack and its widespread dissemination on social media, meaning that informed traders who could directly interpret on-chain data acted first before the information became common knowledge. The FTX event presented a similar but more extreme pattern: anomalous on-chain signals existed for months, but only after the media reports turned them into a low-cost signal did the market react violently. Once information crossed the barrier of processing cost, the market's reaction speed was extremely fast: from Zhao's tweet on November 6 to the 80% collapse of the FTT price took less than 48 hours. This shows that along dimensions with high information symmetry, crypto markets can indeed conduct price discovery efficiently. The problem is not that the market lacks the capacity to react but that there is a structural bottleneck in the process of turning raw data into tradable signals.
This finding has important theoretical significance for understanding the semi-strong-form efficiency of crypto markets. The traditional EMH framework assumes that information is incorporated into prices immediately once it is "public," but the FTX event shows that in crypto markets "public" exists at multiple levels: the technical-level disclosure of on-chain data, the narrative-level disclosure of media reporting, and the consensus-level disclosure formed by public statements from core participants. The level of market efficiency depends largely on which "public" level the information is at. This insight not only enriches our understanding of semi-strong-form efficiency but also provides an important analytical perspective for the later discussion of efficiency evolution: as on-chain analysis tools spread and AI technology is applied, information processing cost is falling continuously—does this mean market efficiency will rise accordingly?
15.5.3 The market-cap illusion of FTT
The other side of the FTX event, however, reveals the market's extreme inefficiency in processing complex, systematic fraud information. If the market's reaction to on-chain fund flows was "efficient," then its long-term mispricing of the intrinsic value of the FTT token was a massive efficiency failure lasting years. The core of this inefficiency stems from a carefully constructed market-cap illusion.
The market-cap illusion refers to the vast difference between an asset's reported market capitalization (usually derived by multiplying the last traded price by the total supply or reported circulating supply) and its true, realizable liquid value. Similar problems exist in traditional financial markets (for example, large blocks of restricted shares held by controlling shareholders make the market cap calculated on total shares overstate the company's true tradable value), but traditional markets have largely mitigated this problem through mandatory position-disclosure requirements, independent audits, and float-certification mechanisms. In crypto markets, the absence of these institutional safeguards amplifies the market-cap illusion to the extreme. In the FTT case, this illusion reached an extreme degree. As shown in Figure 15-16, FTT's total supply was about 328 million tokens, but before the collapse the number of tokens directly or indirectly controlled by FTX and Alameda accounted for nearly 80% of the total, with about another 10% locked or in a vesting period. This meant that the tokens truly available for external investors to trade freely may have accounted for only 10% of the total, or even less.
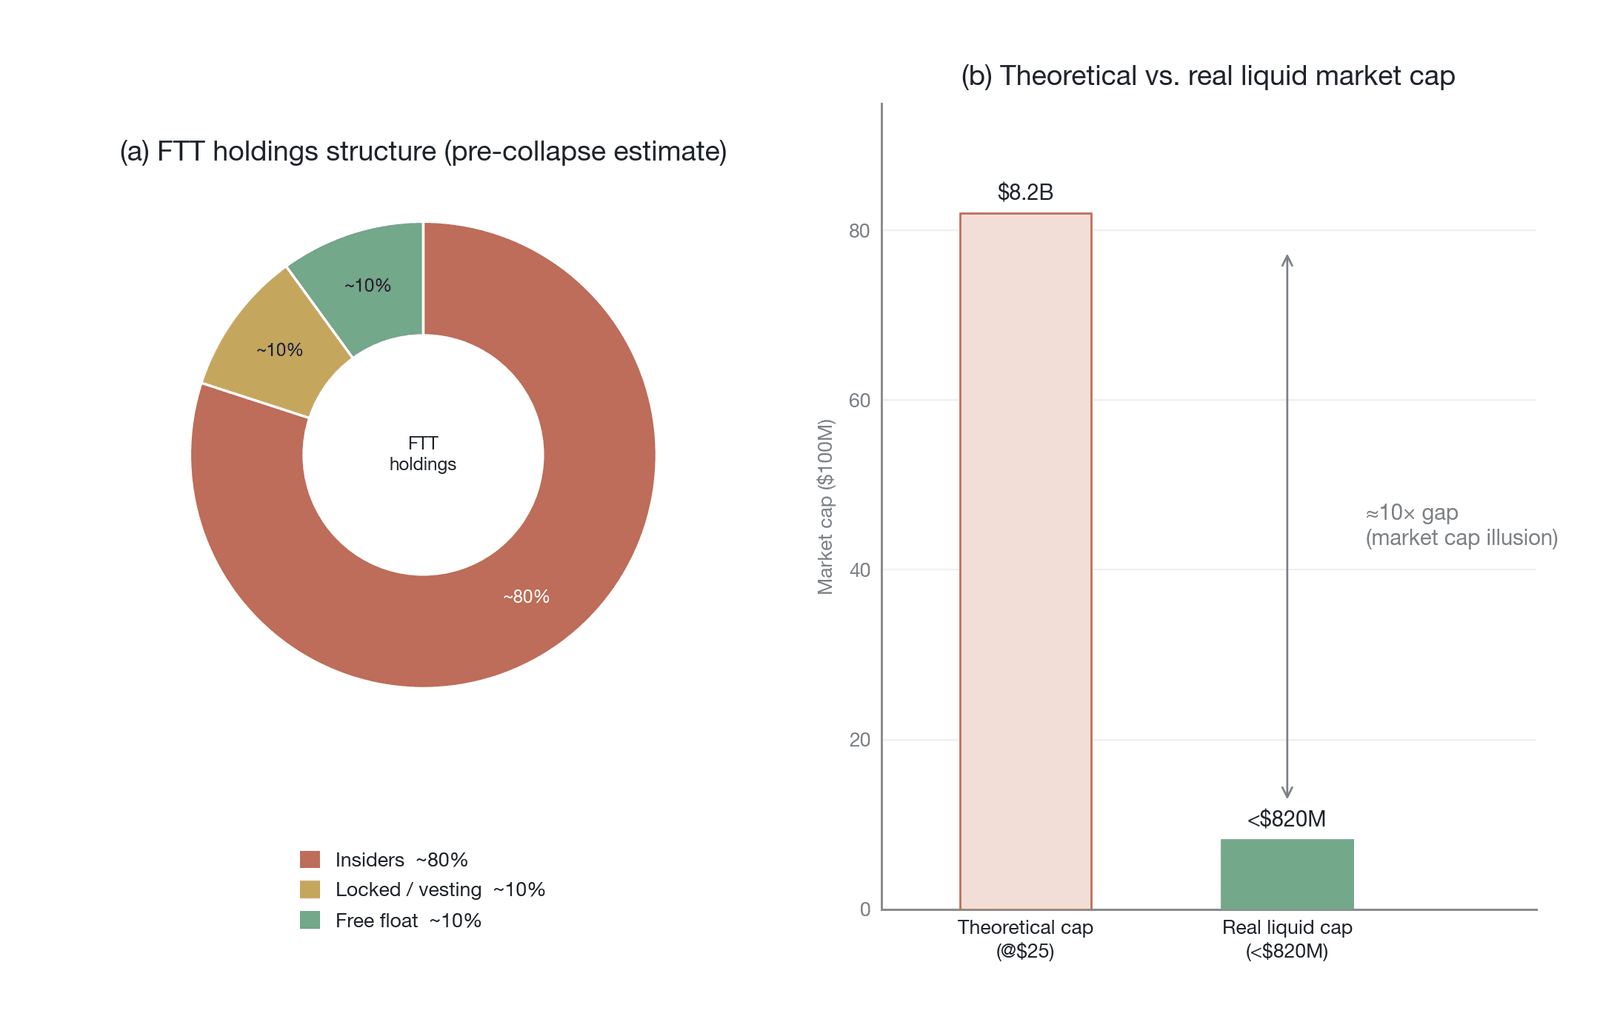
Figure 15-16. The "market-cap illusion" of FTT: the structural imbalance between free float and locked supply
Figure 15-16 uses two panels to reveal FTT's market-cap illusion: the left donut chart shows that before the collapse FTX and Alameda together controlled about 80% of the supply, about 10% was locked or in a vesting period, and the external free float was only about 10%; the right bar chart quantifies the resulting market-cap difference—at an FTT price of $25, the theoretical market cap based on total supply was about $8.2 billion, while the "true liquid market cap" based on the true free float was less than $820 million, a nearly tenfold difference.
Under this highly centralized supply structure, FTT's price discovery mechanism was severely distorted. Because the vast majority of tokens were locked up by insiders, the liquidity of the external trading market was extremely low and the depth of the order book extremely shallow. This meant that FTX and Alameda could maintain or even push up the FTT price with relatively little capital, thereby creating an inflated "market cap." Before the collapse, FTT's reported market cap was as high as several billion dollars, but this was not a fair value determined by a fully competitive market; it was a number easily manipulated by insiders in a low-liquidity market. This manipulation could persist partly because FTX's reputation as a major exchange provided a kind of implicit credit endorsement for FTT, and investors tended to believe that a token issued by an "industry leader" would not be a hollow shell. FTX's founder was widely regarded before the collapse as a benchmark figure of the crypto industry, appearing frequently at congressional hearings and in mainstream media, and this public image further reinforced investor trust and made them turn a blind eye to potential risk signals.
More important still, this greatly inflated asset was used as the core collateral for circular leverage. FTX and Alameda used the FTT they held as collateral to obtain billions of dollars in loans of real assets—mainly US dollar stablecoins and other major cryptocurrencies—from other lenders (including institutions such as Genesis and BlockFi, and even including FTX's own user funds). This was a classic piece of financial engineering: exchanging a token created at almost zero cost, whose value was highly manipulated, for assets with real value. This circular-collateralization structure can be summarized as a self-referential value loop: the FTT price supported Alameda's balance sheet, Alameda's "solvency" supported the market's confidence in FTX, and FTX's reputation in turn supported the FTT price. As long as any link in this loop was broken, the entire system would trigger a chain reaction and collapse rapidly. Vidal-Tomás et al. (2023) summarized this as a fragile vicious cycle dependent on external shocks [36]. The post-collapse bankruptcy investigation revealed that FTX had misappropriated at least $8 billion in customer funds, most of which was transferred to Alameda for high-risk investments and to repay loans [39].
Why did the market turn a blind eye to such an enormous structural risk for so long? This precisely reflects its inefficiency in processing complex information, whose roots can be analyzed on several levels.
At the level of information processing cost, unlike tracking a single on-chain transfer, understanding the market-cap illusion requires deeper, comprehensive analytical capability. Investors would not only need to analyze position concentration and token distribution but also understand the token's vesting schedule, the depth of the exchange's order book, and the potential coordinated behavior among insiders. More difficult still, they would need to integrate these scattered data points into a coherent judgment that "FTT's true liquid value is far below its reported market cap." The cognitive cost of this comprehensive analysis is extremely high and often involves the details of legal and financial structures, far beyond the reach of ordinary investors.
At the level of cognitive biases, investors were affected by multiple behavioral biases, which were further amplified in the special environment of crypto markets. Authority bias made them place excessive trust in the public image and industry status of FTX's founder, equating his personal reputation with the company's financial health. Confirmation bias made them tend to focus on positive information supporting their bullish expectations (such as FTX's user growth and expanding market share) while ignoring negative signals contradicting their expectations (such as anomalous fund flows shown by on-chain data). The anchoring effect made them use FTT's historical high price (which had once reached about $80 during the 2021 bull market) as a value reference while ignoring the fragility of its fundamentals. Narrative bias made them attracted by the appealing narrative of "a leader of the crypto industry" without calmly examining the financial reality behind that narrative. The compounded effect of these biases caused the market's pricing of FTT to deviate from its true value for a long time, forming an efficiency failure lasting years.
These cognitive biases did not operate in isolation from one another but formed a self-reinforcing information loop through the social media ecosystem. Through sponsoring sports arenas, making political donations, and appearing frequently in mainstream media, FTX built a "social proof" network far exceeding that of an ordinary enterprise's reputation, so that voices skeptical of FTX were at a structural disadvantage in dissemination. A "spiral of silence" effect existed in the crypto community: when the majority consensus within the community tended to trust a certain narrative, dissenting individuals tended to stay silent, because publicly questioning a widely revered industry leader could invite ostracism from the community. This social-transmission mechanism systematically amplified individual-level cognitive biases into a market-level collective oversight.
At the level of market structure, crypto markets lack the multiple institutional safeguards of traditional financial markets. There was no mandatory independent audit system to verify the exchange's balance sheet; no unified definition and certification standard for float to prevent market-cap manipulation; no strict related-party-transaction disclosure requirement to reveal the conflict of interest between FTX and Alameda; and no effective short-selling mechanism to allow skeptics to express their views through market action and correct the price deviation. In traditional equity markets, short-sellers and sell-side analysts play an important "price-correcting" role, using deep fundamental research to discover overvalued stocks and profiting by shorting them. But in the FTT market, the cost of shorting was extremely high (high coin-borrowing rates, insufficient liquidity), and it faced the risk of being forcibly liquidated as insiders manipulated the price, which made it difficult for potential short-sellers to participate.
At a more fundamental institutional level, the unobservability of counterparty risk in crypto markets constitutes an independent dimension of efficiency assessment. When a trader cannot be sure whether their counterparty (whether an exchange or an affiliated trading party) faces solvency risk, this uncertainty itself structurally damages the quality of price discovery. In the FTX case, the fact that customer funds were misappropriated would, in traditional financial markets, trigger strict fund-segregation and independent-audit mechanisms, but crypto markets had almost no such institutional safeguards before the FTX event. In addition, the legal boundary of "insider trading" in crypto markets is itself blurred, and the legal nature of most tokens remains disputed in the major jurisdictions, which means traditional anti-insider-trading regulations may not apply, and the absence of legal deterrence further exacerbates the persistence of information asymmetry.
From the information-type dimension of the efficiency spectrum, the FTT case clearly displays an efficiency gradient: the market reacted quickly (high efficiency) to simple, observable on-chain facts such as "FTX transferred $X hundred million to Alameda," but reacted extremely slowly (low efficiency) to conclusions such as "FTT's true liquid value is far below its reported market cap," which require comprehensive analysis to reach. The former has a low information processing cost and the latter a high one, and it is precisely this cost difference that determines the level of market efficiency.
This collective oversight is a deeper market-efficiency failure than any single price crash; it reveals the enormous gaps that still exist in crypto markets in institutional building and information infrastructure. Notably, the market-cap illusion is not unique to FTT. In the broader crypto market, the reported market caps of many tokens differ significantly from their true realizable liquid value, especially for projects in which large token blocks are held by the project team, venture capital firms, or foundations. The extreme case of FTT merely pushed this common problem to its logical extreme. It raises a question of major significance for the entire crypto market: when we talk about a token's "market cap," what are we actually talking about? If the core metric of market cap can itself be easily manipulated, then all value judgments and risk assessments built on market cap lose their reliability. This lesson has profound implications for the building of crypto markets' information infrastructure (including stricter float-definition standards, more transparent position-disclosure requirements, and more reliable price discovery mechanisms).
15.5.4 Contagion and overreaction
When the crisis erupted, market efficiency exhibited its third face: what this chapter calls "over-efficiency"—the market's reaction to negative signals in speed and magnitude exceeding what fundamentals can reasonably explain, which in finance manifests as the contagion effect. The contagion effect refers to the crisis of one institution or asset spreading, through direct financial ties, a common investor base, or purely psychological panic, to other institutions or assets with seemingly no direct connection or limited connection, causing the latter to also suffer price crashes or liquidity crises. In traditional finance, the contagion effect is one of the core topics in systemic-risk research, and the FTX event provides a typical case for observing this phenomenon in crypto markets.
In the FTX event, the experience of Solana is the clearest case of the contagion effect. FTX and Alameda had been early investors in and important supporters of the Solana ecosystem, and Alameda held large amounts of SOL tokens and Solana-based DeFi project tokens on its balance sheet. When FTX collapsed, the market formed a strong expectation: the bankruptcy liquidators would have to dump these SOL tokens on the market to repay debts. This selling expectation alone was enough to push down the price, but the more far-reaching impact came from the panic triggered by tainted association. Market participants began to equate "associated with FTX" with "carrying similar risk," and this simplistic heuristic led to a wholesale sell-off of the Solana ecosystem, not merely of the tokens that might be liquidated. The total value locked (TVL) in DeFi protocols on Solana fell by more than 70% within two weeks of the FTX collapse, as users and developers fled, forming a self-reinforcing negative loop.
As shown in Figure 15-17, from the start of the crisis on November 2 to the end of November, the price reactions of different assets diverged significantly. Bitcoin and Ethereum, as the benchmark assets of the crypto market, were also affected by the FTX collapse, but their declines were relatively contained, at about 22% and 29% respectively from the November 2 baseline to the late-November low. This decline partly reflected the market's declining confidence in the overall crypto industry and its reduced risk appetite, but as Section 15.5.5 discusses in detail below, it also contained a component of cross-asset mechanical liquidation triggered by the unified margin system; the two sources are hard to decouple precisely in the total declines of BTC and ETH, so characterizing them entirely as "a reasonable repricing of systemic risk" may be an oversimplification. SOL's price, however, plunged from about $32 to near $13, a decline of nearly 60%, far exceeding the adjustment of the market benchmark.
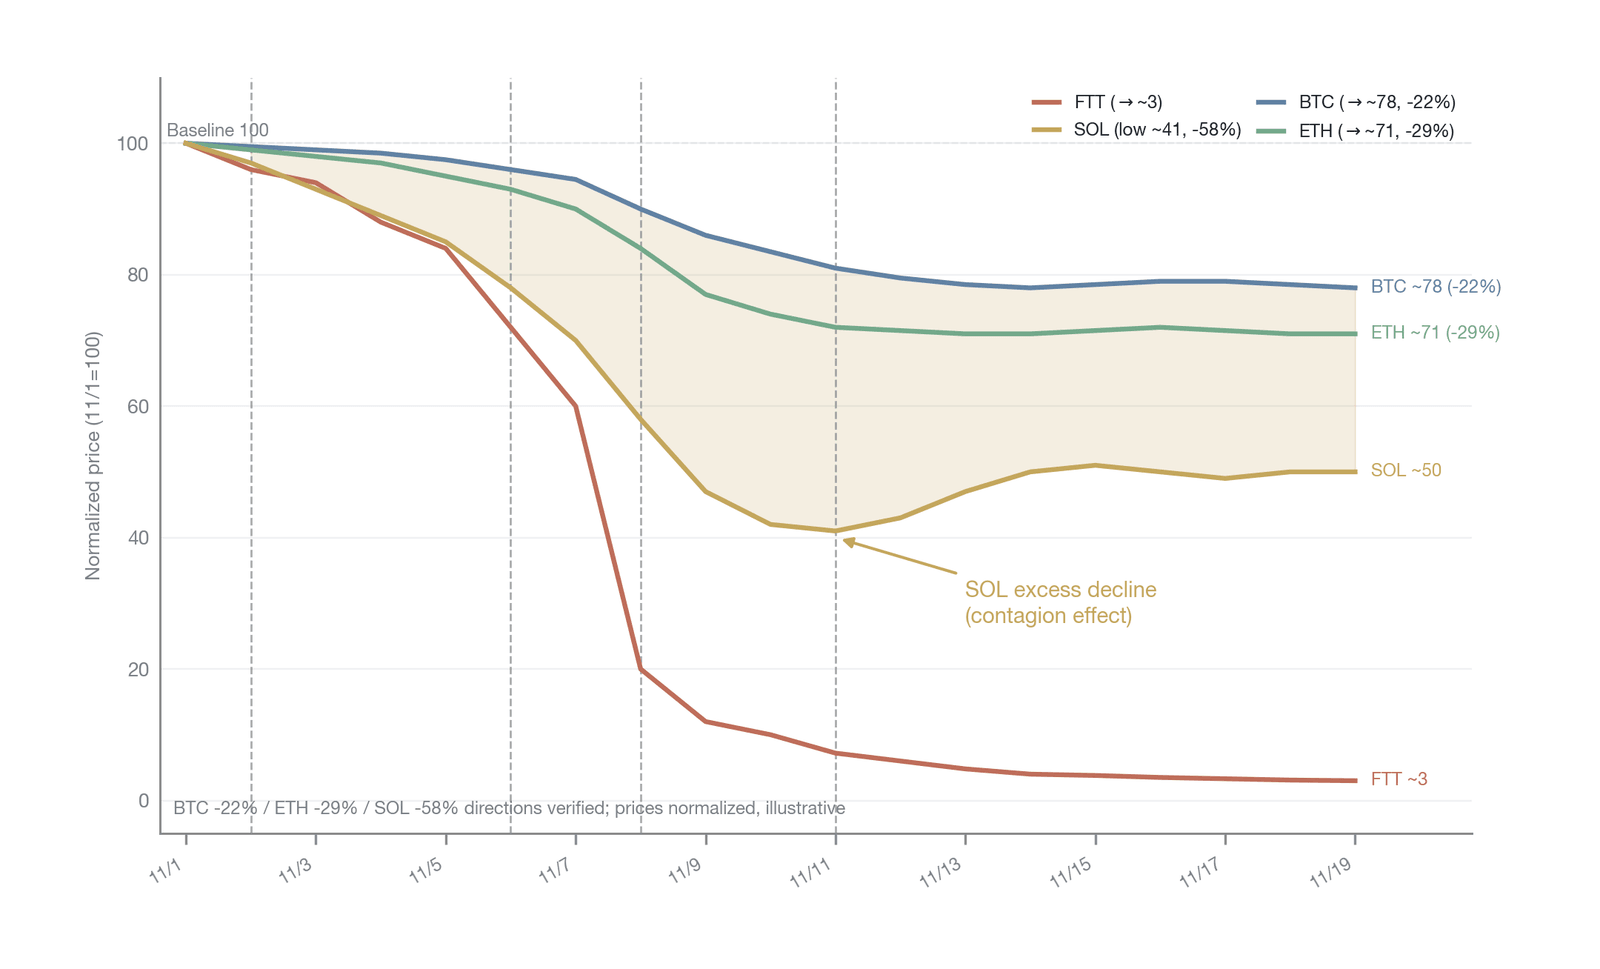
Figure 15-17. The contagion effect: the relative price reactions of SOL, BTC, and ETH during the FTX event
Figure 15-17 normalizes the prices of the four assets FTT, SOL, BTC, and ETH (with November 1, 2022 set to 100) to compare their relative performance during the FTX crisis: compared with the mild declines of BTC and ETH, SOL suffered a sharp decline similar to FTT's, far exceeding the market benchmark, and the "excess decline" region of SOL relative to BTC specially marked in the figure intuitively reflects the market's excessive punishment of the "associated party."
SOL's excess decline relative to BTC and ETH (about 36 percentage points, roughly 2.6 times BTC's decline) clearly illustrates the "over-efficiency" of the contagion effect. This so-called "over-efficiency" refers to the price discovery mechanism, under extreme panic, shifting from rational analysis based on fundamentals to a "one-size-fits-all" sell-off based on simple heuristics. Traders did not carefully assess how much actual impact FTX's bankruptcy would have on the long-term fundamentals of the Solana network (such as the independence of its technical architecture, the activity of its developer community, the growth potential of its decentralized applications, and its consensus mechanism and network security); they simply equated "associated with FTX" with "high risk" and sold off excessively as a result. This behavior seemed "efficient" in the short run, because it rapidly priced in the negative information (association risk), but in the long run it led to severe price overshooting and value destruction.
From the perspective of AMH, this overreaction is not simple "irrationality" but a form of adaptive behavior under extreme uncertainty. When market participants face an environment of severely incomplete information and sharply rising counterparty risk, prioritizing position reduction to limit the maximum loss is a reasonable survival strategy. As Lo (2004) noted, in times of crisis, fear and the survival instinct overwhelm rational analysis, causing market efficiency to fall sharply [9]. During the FTX collapse, no one could know precisely how wide a chain reaction FTX's bankruptcy would trigger, which institutions would be the next to fall, or whether the Solana ecosystem would fall into permanent decline after losing its largest supporter. Under this deep uncertainty, overreaction is a reasonable risk-avoidance strategy at the individual level. When all market participants adopt this strategy simultaneously, however, it produces a collectively irrational outcome at the market level—prices deviating severely from fundamental value.
More noteworthy is the information revealed by the subsequent market performance. After the heavy blow of the FTX collapse, SOL's price did not correct quickly but lingered in the low range of $13 to $25 for more than a year. Not until the second half of 2023, as the Solana community carried out a series of technical upgrades (including the development of the Firedancer validator client and a marked improvement in network stability) and new ecosystem narratives emerged (including the return of users brought by the rise of meme-coin culture), did SOL's price begin to recover gradually; it briefly broke above $260 in November 2024, modestly exceeding its 2021 high, and rose further to an all-time high of about $290 in early 2025. Using this subsequent recovery to argue that the pricing of November 2022 was an "overreaction" requires caution, however. On the one hand, SOL's recovery was largely driven by new factors entirely unforeseeable at the time of the collapse, and inferring an original mispricing from a price recovery under a different causal chain faces the methodological risk of hindsight bias. On the other hand, under the information set of November 2022, market participants could not know for certain whether the large quantity of SOL held by Alameda would be liquidated in an orderly manner or dumped in a panic, nor whether the Solana network would fall into permanent decline after losing its largest supporter. A more prudent conclusion is therefore that SOL's excess decline may have contained both a reasonable risk discount (pricing the expected liquidation shock) and a panic-driven excess discount (selling beyond the reasonable range of fundamentals), but precisely distinguishing the boundary between the two would require a more rigorous quantitative estimate of Alameda's position size and the expected liquidation shock, which is beyond the scope of this chapter.
The contagion effect was not limited to SOL. FTX's collapse also directly pushed several institutions with lending or investment relationships with it into distress, forming a chain reaction that spread across the entire industry. The crypto lending platform BlockFi filed for bankruptcy in late November because of its large exposure to FTX; the lending arm of the crypto broker Genesis suspended withdrawals and ultimately went into bankruptcy reorganization; and the digital-asset management firm Galois Capital had about half of its assets (about $40 million) trapped in FTX and was forced to shut down its flagship fund in early 2023. These chain reactions further intensified market panic and formed a self-reinforcing negative feedback loop: the failure of one institution triggered worries about its counterparties, leading to more withdrawals and sell-offs, which in turn threatened the solvency of more institutions. This process is highly similar to the transmission mechanism of systemic risk in traditional financial crises (the global financial crisis triggered by the Lehman Brothers bankruptcy of 2008 followed a similar contagion path), but in crypto markets, because of the absence of a central bank's lender-of-last-resort function, deposit insurance, and an orderly liquidation mechanism, the destructive power of the contagion effect is further amplified and its transmission speed is also faster.
From the market-state dimension of the efficiency spectrum, the appearance of the contagion effect marks the market's rapid leap from the "normal" state to the "decay" state. In the normal state, the market's arbitrage mechanism can effectively correct price deviations, keeping the prices of different assets roughly consistent with their fundamentals. But in the decay state, the arbitrage mechanism itself is paralyzed: market makers withdraw quotes to avoid risk, cross-exchange arbitrage cannot be executed because of withdrawal restrictions, and leveraged traders are forcibly liquidated for insufficient margin. The market loses its ability to self-correct; price deviations are not only not corrected but keep expanding, driven by panic. This nonlinear collapse of efficiency is precisely the extreme case predicted by the efficiency spectrum framework and a strong validation of AMH's core prediction that market efficiency falls sharply in times of crisis.
15.5.5 The liquidation cascade
The preceding analysis examined the macro timeline, on-chain information efficiency, and contagion effect of the FTX collapse, and this section focuses on a market tier that played a key but often overlooked role in the crisis: the perpetual futures market. As the core research object of this book, perpetual futures dominate price discovery in the normal state through their high liquidity and leverage advantage (see Section 15.4); but under the extreme stress test of the FTX collapse, the institutional design of perpetual futures (especially their margin mechanism and forced-liquidation logic) exposed enormous fragility and became an amplifying mechanism accelerating the market's collapse. Through the dedicated panel of perpetual futures, we can observe the nonlinear flip from institutional advantage to institutional risk during the crisis.
Consider first the price discovery leadership and basis inversion of FTT perpetual futures. During the information diffusion period of the crisis (November 2 to November 6), although the spot market reacted slowly, the perpetual futures market had already begun to show its acuity in integrating information. In theory, traders holding inside information or possessing advanced on-chain analysis capabilities are more inclined to use perpetual futures to establish short positions, because this does not require actually borrowing FTT spot and can achieve leveraged gains. Before Zhao announced the liquidation of FTT on November 6, the price of FTT perpetual futures had already begun to deviate subtly from the spot price, and the basis (the perpetual price minus the spot price) turned from slightly positive in the normal state to negative. This basis inversion was in fact an early signal that the perpetual futures market was pricing in the imminent selling pressure.
When the sell-off truly began on November 6, the price discovery leadership of perpetual futures was fully displayed. As liquidity in the spot market dried up rapidly and market makers widened spreads or even withdrew quotes, a large number of panic sell orders and speculative short orders poured into the perpetual futures market. This caused the FTT perpetual futures price to lead the spot price throughout the crash, with the basis inversion reaching several hundred basis points at the most panicked moment on November 8. This deep basis inversion indicates that under extreme crisis, perpetual futures are not only the leader in price discovery but also the concentrated channel reflecting market panic.
The liquidation cascade produced a powerful amplifying effect that drained liquidity. As the FTT price fell sharply, another core mechanism of the perpetual futures market—forced liquidation—was triggered on a large scale. The liquidation data during the FTX collapse show an extremely severe situation: a large number of leveraged accounts collateralized with FTT or holding FTT long positions were liquidated as their margin ratios fell below the maintenance margin requirement. Within the 48 hours from November 7 to 8, the long liquidation volume of FTT perpetual futures on major exchanges (including Binance, OKX, and Bybit) surged exponentially.
This liquidation was not an isolated event but formed a typical liquidation cascade. When a long position is forcibly liquidated, the liquidation engine sends market sell orders to the market, which push the mark price down further; the lower mark price then triggers the liquidation conditions of the next batch of leveraged accounts, generating new sell orders. In the absence of sufficient long liquidity to absorb them, this mechanical selling continues to push the price down. More seriously, the EMA smoothing mechanism used by the CEX mark price (for the mechanism, see Section 15.4.3) lags behind the latest traded price under extreme conditions, allowing positions that should have been liquidated early to persist and accumulate larger losses, which finally erupt in concentration when the mark price catches up, further amplifying the FTT liquidation cascade. The open interest of FTT perpetual futures on major exchanges fell sharply within days, which is precisely direct evidence of liquidity evaporation and leverage clearing. Unfortunately, the precise liquidation data for FTT perpetual futures during the FTX event (including the ratio of forced liquidations to voluntary closures, the depletion of each exchange's insurance fund, and the frequency with which the auto-deleveraging mechanism was triggered) are incompletely recorded in public data sources, which limits precise quantitative analysis of the severity of the liquidation cascade. That said, the major exchanges did not merely respond passively during this period: platforms such as Binance and OKX typically activate dynamic margin-rate adjustments, reduce the maximum available leverage, and, when the liquidation engine is under excessive pressure, trigger the auto-deleveraging mechanism to replace conventional market liquidation under extreme conditions. These emergency measures mitigated the worst consequences of the liquidation cascade to some extent, but the opacity of their trigger conditions and execution details itself constitutes an institutional risk, as traders cannot accurately anticipate in advance how the rules will be executed under extreme conditions.
The collapse of perpetual futures was not confined to the single asset FTT. Modern derivatives exchanges such as FTX generally adopt a unified margin system, allowing users to use multiple assets (such as BTC, ETH, and SOL) as shared collateral to support all contract positions. This institutional innovation, which improves capital efficiency in the normal state, became a perfect conductor of cross-market contagion in the crisis.
When the FTT price crash caused the overall equity of a user's unified margin account to shrink, even if their BTC or ETH perpetual futures positions themselves had not lost money, they could be forcibly liquidated because of insufficient overall account margin. This mechanism led to "indiscriminate selling": to save an account on the verge of liquidation, traders were forced to close the most liquid assets (usually BTC and ETH longs); and when forced liquidation actually occurred, the liquidation engine likewise sold all assets in the account indiscriminately. This explains why, during the FTX collapse, although the spot fundamentals of BTC and ETH had not changed fundamentally, their perpetual futures markets still suffered enormous selling pressure and a wave of liquidations. The unified margin system transmitted the crisis of a specific token to the entire crypto derivatives market through account-level linkage.
The funding rate mechanism itself suffered extreme distortion and ultimately failed. Under this series of shocks, the mechanism designed to anchor the perpetual price to the spot price underwent a historic extreme deviation. From November 7 to 9, the funding rate of FTT perpetual futures on major exchanges hit the funding-rate floor set by the exchange (its absolute value set according to the contract's maintenance margin rate, about -2% per 8 hours for standard contracts). This extreme negative funding rate meant that shorts had to pay a high fee to longs, which in theory should have attracted arbitrageurs to buy perpetual futures and sell spot, thereby narrowing the basis.
Under the "decay state" of the FTX crisis, however, this arbitrage mechanism failed entirely. On the one hand, because the FTT spot lending market was frozen, arbitrageurs could not borrow spot to hedge their shorts; on the other hand, facing an extreme one-sided decline and counterparty risk (especially worries about the FTX platform itself), no rational arbitrageur was willing to bear the risk of building a position in a sharply falling price merely to earn the funding rate. The mean-reverting nature of the funding rate failed at this moment; it was no longer a regulator promoting market efficiency but became a mechanism continually draining the remaining long positions. This mechanism-level paralysis marked the perpetual futures market losing its ability to self-correct under extreme stress, its institutional advantage completely flipping into systemic risk. From a risk-management perspective, the duration of this mechanism failure is equally worthy of attention. After the FTX event, the funding rate of major assets took about one to two weeks to recover from its extreme negative value to a normal level, with catalysts for recovery including the gradual entry of new market makers and the rebuilding of market liquidity. The classic "limits of arbitrage" theory of Shleifer and Vishny (1997) [42] applies strongly here: precisely at the moment when arbitrageurs are most needed to correct price deviations, they are least equipped with capital and most exposed to runs. In the FTX event, the fact that a large number of arbitrageurs' funds were trapped in the bankrupt exchange made the paralysis of the arbitrage mechanism far more persistent than pure market panic.
15.5.6 Summary of the FTX event
The collapse of FTX provides a rich, clearly layered, comprehensive case for the efficiency spectrum analytical framework established in this chapter. It strongly demonstrates that any attempt to describe digital asset markets with a single label ("efficient" or "inefficient") is bound to be incomplete. Only within a multidimensional efficiency spectrum can we accurately locate and understand the market's complex behavior. Figure 15-18 systematically deconstructs the FTX event within the efficiency spectrum analytical framework.
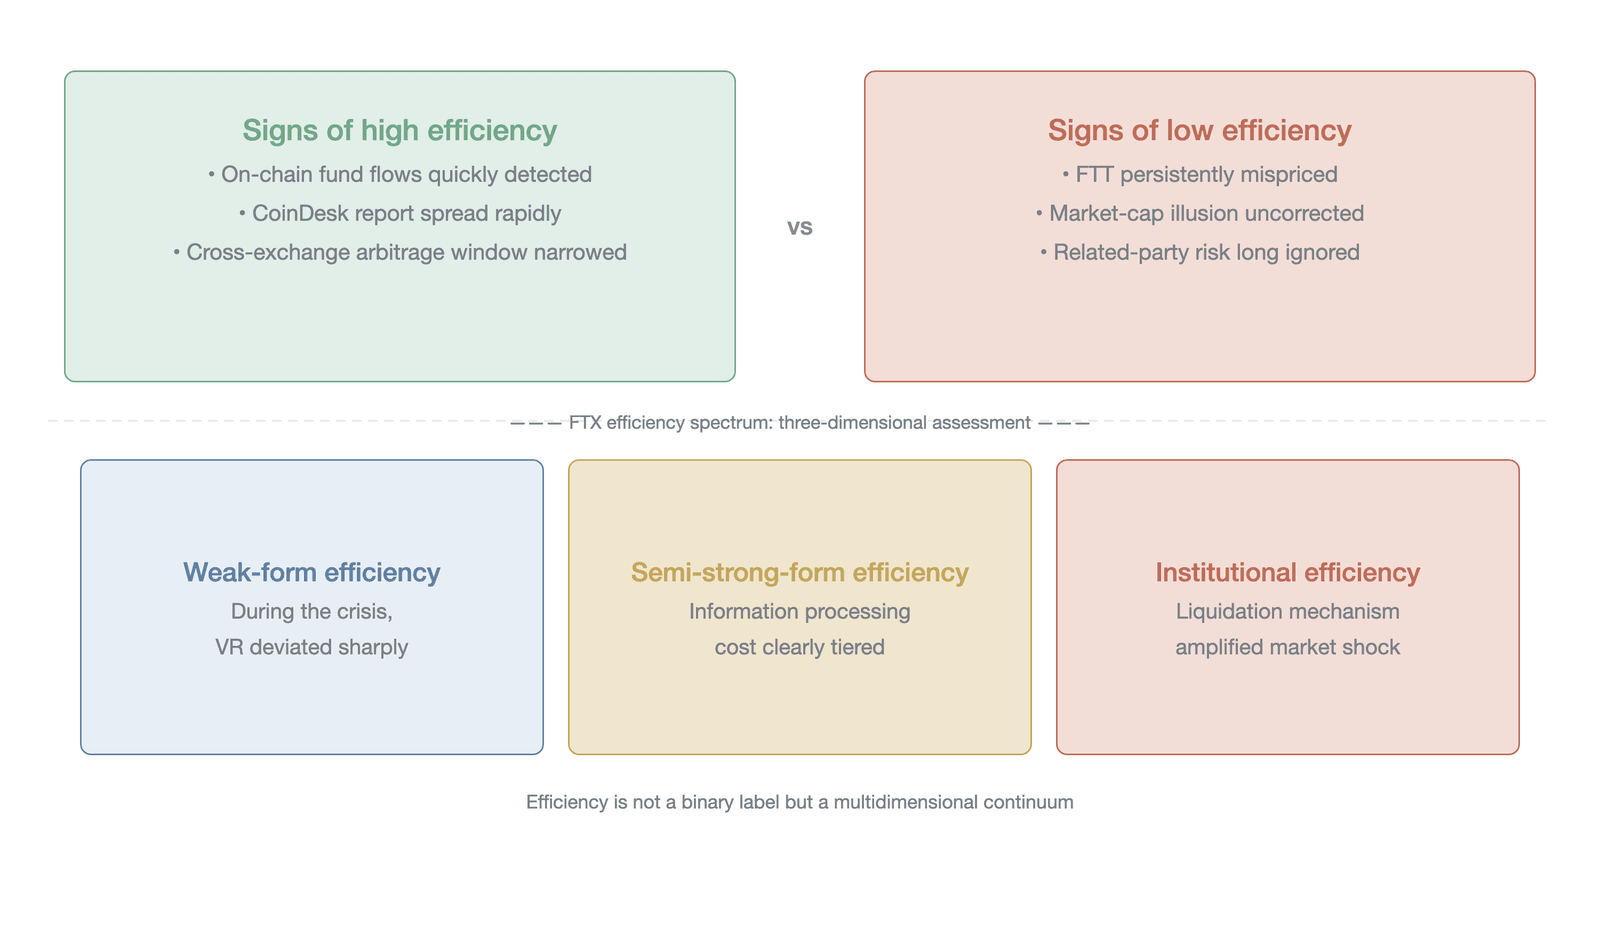
Figure 15-18. The efficiency spectrum analytical framework applied to the FTX event
Figure 15-18 systematically deconstructs the starkly different efficiency features of the FTX event along three layers—weak-form efficiency, semi-strong-form efficiency, and institutional efficiency—supplemented by a contrast of high versus low efficiency: from the high efficiency for simple on-chain data to the extremely low efficiency for complex structural information, from the nonlinear leap from the normal state to the decay state, and the role reversal of perpetual futures from price discovery leader to collapse accelerator. Table 15-5 further summarizes these manifestations systematically along the five dimensions of the efficiency spectrum.
| Efficiency spectrum dimension | Specific manifestation | Efficiency assessment | Key evidence |
|---|---|---|---|
| Information type: simple on-chain data | Once the media translated the signal, the market completed 80% of the price adjustment within 48 hours | High efficiency | FTT price plunged 80% within 48 hours of CZ's tweet |
| Information type: complex structural information | The market-cap illusion and circular collateralization went unpriced for years | Extremely low efficiency | About 80% of FTT supply was controlled by insiders; market cap overstated by nearly tenfold |
| Market state: from normal to decay | Liquidity evaporated within hours and the price discovery mechanism seized up | Nonlinear collapse | FTX faced $6 billion in withdrawal requests and was forced to halt withdrawals |
| Asset dimension: contagion | SOL's decline (about 58%) far exceeded BTC's (about 22%), and part of it was later shown to be an overreaction | Over-efficiency | SOL modestly exceeded its 2021 high in November 2024 and rose further to about $290 in early 2025 |
| Market tier: perpetual futures | The institutional advantage that dominates price discovery in normal times flipped into institutional risk—"cascading liquidations plus liquidity evaporation"—during the crisis | Nonlinear reversal | Open interest fell off a cliff, funding rates went to extremes, the basis inverted deeply, and unified margin triggered cross-asset liquidations |
Table 15-5. Summary of the multidimensional manifestations of the efficiency spectrum during the FTX event (Data source: compiled by the author from public data on the FTX event)
The table shows clearly that the FTX event exhibited starkly different efficiency features along the different dimensions of the efficiency spectrum, and these features together constitute a complete characterization of the multidimensional nature of market efficiency.
Along the information-type dimension, the market reacted quickly to simple on-chain data (fund flows, token transfers) but lagged for years on complex structural fraud (the market-cap illusion, circular collateralization), pushing the information-processing-cost stratification revealed in Section 15.3 to the extreme—the simplest information was priced at the hourly level, while the most complex information was "discovered" in the form of a collapse rather than a gradual adjustment. Along the market-state dimension, the liquidity evaporation and negative-feedback spiral triggered by the collapse of trust paralyzed the arbitrage and price discovery mechanisms within hours, corroborating the nonlinear collapse predicted by the efficiency spectrum and validating AMH's core prediction that efficiency falls sharply in a crisis; and this collapse was not uniform—BTC and ETH, with deeper liquidity and more diverse participants, retained relative resilience, while FTT and SOL suffered more severe failures, again highlighting the importance of the asset dimension. Along the time dimension, the market's long-term sluggishness toward FTT's structural risk, its medium-term moderate reaction to the CoinDesk report and Zhao's tweet, and its short-term overreaction during the collapse constitute an efficiency gradient that echoes the weak-form efficiency findings of Section 15.2 but is amplified by extreme conditions.
Along the asset dimension, the divergent reactions of FTT, SOL, and BTC/ETH correspond precisely to the full spectrum from low efficiency (the belated correction of fraud information), through over-efficiency (the contagion punishment of an associated party), to reasonable repricing (the benchmark assets). Distinguishing "fundamental contagion" (a reasonable risk repricing transmitted through quantifiable financial ties and position exposure) from "pure contagion" (panic spillover beyond the range explainable by fundamentals) is the core analytical framework for assessing the nature of the contagion effect, and SOL's excess decline in the FTX event may have contained both components, though the literature has not yet provided a quantitative decomposition. Along the market-tier dimension, perpetual futures reflected the selling pressure earlier than spot during the information diffusion period, displaying price discovery leadership, and then, when the crisis fully erupted, became the core mechanism amplifying the downside and accelerating the price adjustment because of their leverage nature, liquidation mechanism, and unified margin system—this flip from institutional advantage to institutional risk reveals the fragile boundary of derivatives-market efficiency.
Ultimately, the FTX case is not only a warning to market participants but also important research material for students of market efficiency. In an extreme way, it forces us to abandon a simplistic, idealized understanding of the market and embrace a more realistic, dynamic, multidimensional analytical paradigm. Informational efficiency is not a fixed attribute but a continuous spectrum that changes continually with information type, market state, asset characteristics, and time scale. Understanding this not only helps us explain past market behavior more accurately but also provides a more robust analytical foundation for future risk management and investment decisions. Just as AMH predicts, the market will learn and adapt from the FTX crisis: stricter exchange-audit requirements, more transparent proof-of-reserves mechanisms, and more prudent counterparty-risk management practices are all concrete manifestations of this adaptive process. After the FTX event, major exchanges rolled out proof-of-reserves systems based on Merkle trees. Proof-of-reserves systems in their current form have significant limitations, however: they can usually prove only the existence of assets at a specific point in time and cannot verify the completeness of the liabilities side, and an exchange may have off-chain borrowing and liabilities not included in the scope of the proof. Moreover, most proof-of-reserves systems take the form of monthly or quarterly snapshots, and this low-frequency auditing leaves ample windows for manipulation between snapshots. These limitations mean that proof of reserves may to some extent give market participants a false sense of security rather than truly bridging the gulf of information asymmetry. At the same time, regulators have accelerated the legislative process for the crypto industry, and these institutional-level changes are fundamentally reshaping the information environment and efficiency features of crypto markets. From AMH's population-environment framework, these ex post institutional changes can be understood as a typical "population adaptation after an environmental change": the collapse of FTX, as a strong environmental shock, eliminated the fragile strategies relying on centralized trust assumptions and gave rise to a new generation of market participants and infrastructure characterized by higher transparency and stricter risk control. And the long-term trend of this adaptive evolution is precisely the subject we will discuss systematically below.
Efficiency Spectrum Locator Card · Section 15.5
Dimension Positioning Quantitative proxy metric Time A nonlinear leap from long-term sluggishness to a short-term instantaneous eruption FTT completed 80% of the adjustment within 48 hours of the key information release Asset The collapse of the direct underlying (FTT) and the contagion overshoot of the associated party (SOL) SOL's excess decline of about 36 percentage points; the subsequent rebound partly proved the overreaction Information type High efficiency for simple on-chain data, extremely low efficiency for complex structural information Rapid reaction after the media translated the signal, but the "market-cap illusion" lay latent and unpriced for years Market state A rapid leap from the normal state to a "decay state" of arbitrage paralysis FTX faced $6 billion in withdrawals; liquidity evaporation triggered a negative-feedback spiral Market tier Perpetual futures flipped from price discovery leader to collapse-accelerating mechanism Open interest fell sharply, funding rates went to extremes, a cross-asset liquidation cascade erupted One-sentence takeaway: Under extreme stress, digital asset market efficiency exhibits a nonlinear collapse, and the institutional design of perpetual futures transforms from an efficiency accelerator in the normal state into a risk amplifier in the crisis.
15.6 The evolution of efficiency
After the preceding sections' in-depth dissection of the informational efficiency of digital asset markets along different dimensions, we have clearly seen that efficiency is not a static, unchanging attribute but a dynamic, multilevel complex system. From the time-varying nature of weak-form efficiency, through the differentiated reaction of semi-strong-form efficiency to different information types, to the distinctive institutional efficiency cycles of perpetual futures, all the evidence points to Lo's (2004) adaptive markets hypothesis as the appropriate lens for understanding this emerging market [9]. This section aims to integrate this fragmented evidence into a unified historical-evolutionary framework, systematically expounding the evolution of crypto market informational efficiency from its birth to the present by constructing a three-stage model. This trajectory is not only a history of the evolution of technology and capital but also a history of the ongoing game, adaptation, and co-evolution among three parties: market participants, infrastructure, and the regulatory environment.
Our core argument is that the informational efficiency of digital asset markets has passed through three distinct but interlocking stages: the frontier era (2009–2017), the institutionalization era (2018–2023), and the regulated era (2024–). Figure 15-19 presents a panorama of this evolution and marks within it the institutionalization process of perpetual futures.
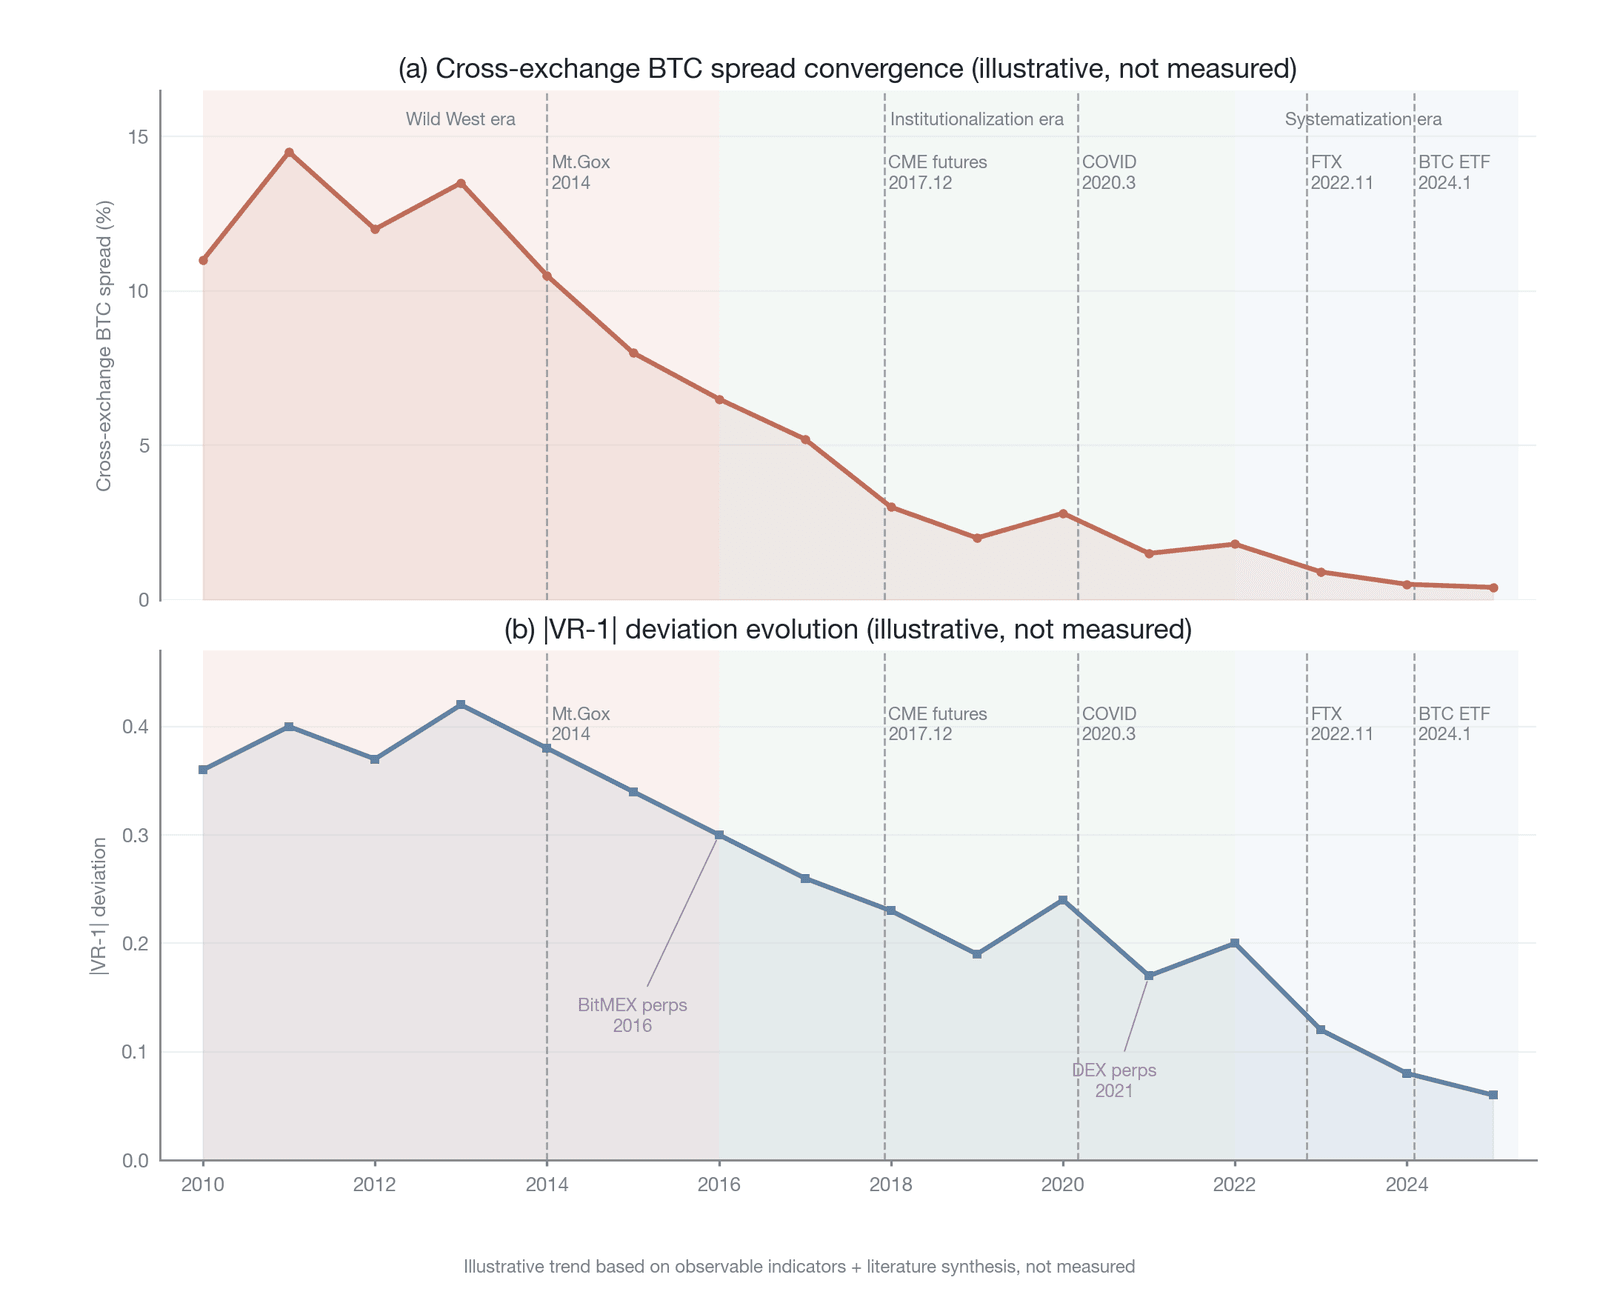
Figure 15-19. The three-stage evolution of crypto market efficiency
Figure 15-19 uses two panels to present the illustrative trend of efficiency evolution (the direction and magnitude are based on a synthesis of the literature rather than the point-by-point measurement of a single continuous data source): panel (a) shows the convergence of cross-exchange BTC spreads from 2010 to 2025, with lower spreads representing higher arbitrage efficiency; panel (b) shows the decline of the variance-ratio deviation , with lower deviation representing prices closer to a random walk. The timeline is colored by the three stages—frontier, institutionalization, and regulated—and marks key events such as the Mt. Gox collapse, the CME futures launch, COVID-19, the FTX collapse, and the BTC ETF approval, along with perpetual futures milestones (such as the first perpetual futures on BitMEX in 2016 and the scaling of DEX perpetuals in 2021), intuitively displaying the brief rebounds of both metrics during crises and their long-run convergence.
As the figure shows, each stage is defined by its distinctive participant composition, infrastructure level, and regulatory environment, and these factors together shape the efficiency features of that stage. Overall, market efficiency exhibits a long-term trend of spiral improvement, but this process is not linear; it is accompanied by cyclical crises and resets triggered by technical defects, speculative mania, and fraud. These crises are both stress tests of the market structure of the time and often the key catalysts that give rise to the next stage of evolution. Table 15-6 summarizes the core differences among the three stages along key dimensions.
| Dimension | Frontier era (2009–2017) | Institutionalization era (2018–2023) | Regulated era (2024–) |
|---|---|---|---|
| Main participants | Cypherpunks, early retail investors, tech enthusiasts | Professional market makers, quant funds, crypto-native institutions | Traditional finance giants, ETF issuers, sovereign wealth funds |
| Infrastructure | Primitive exchanges, no derivatives | Regulated futures, professional APIs, institutional custody | Spot ETFs, global compliant custody, high-speed Layer 2 |
| Perpetual futures | Not yet born / very early (BitMEX monopoly) | Became the highest-volume derivative; institutional design iterated rapidly | CEX perpetuals highly mature; DEX perpetuals catching up fast; regulatory frameworks intervening |
| Regulatory environment | Almost a vacuum | Frameworks first established; enforcement actions increasing | Comprehensively regulated |
| Cross-exchange BTC spread | 5%–30% (normal) | 1%–5% (normal); spikes during crises | <0.5% (major exchanges) |
| Weak-form efficiency level | Significant departure from a random walk | Intraday approaches a random walk; patterns persist across days | Close to a random walk across multiple time scales |
| Signature crisis | Mt. Gox collapse (2014) | Black Thursday (March 12), FTX collapse | To be observed |
| Catalyst for the phase transition | — | CME futures launch (December 2017) | Spot BTC ETF approval (January 2024) |
Table 15-6. Comparison of the core features of the three-stage evolution of crypto market efficiency (Data source: compiled by the author)
This section examines in turn the efficiency features, driving factors, and key turning points of these three stages, uses quantitative evidence to show the concrete trajectory of efficiency evolution, and finally offers a prospect for the emerging forces shaping the next stage's efficiency paradigm. This historical perspective is both a comprehensive summary of all the findings in this chapter and a key clue for understanding the future development path of digital asset markets.
15.6.1 The frontier era (2009–2017)
The first decade of digital asset markets belonged to a highly uncertain early stage. From the birth of the Bitcoin genesis block to the eve of the CME Bitcoin futures launch in late 2017, the market efficiency of this stage was defined by extremely high informational and transactional friction, which offered enormous arbitrage room to the few early participants with specific skills. Market participants at this time were mainly cypherpunks, software developers, early tech enthusiasts, and a few retail speculators attuned to market opportunities. Their motives were diverse, ranging from technological faith in the decentralization ideal to a speculative desire for high returns. This homogeneity of the participant base meant that the market lacked the sustained price discovery process driven by heterogeneous beliefs and diversified strategies found in mature financial markets.
The infrastructure of this period was extremely primitive and fragile. Trading was concentrated mainly on a few centralized exchanges, the largest by volume being Tokyo-based Mt. Gox. At its peak from 2013 to early 2014, Mt. Gox handled roughly 70% of global Bitcoin trading volume, forming a de facto price monopoly. These early exchanges generally lacked sound internal controls, security measures, and customer-asset protection mechanisms, however. Trading engines crashed frequently, withdrawal delays were the norm, and the catastrophic hack that ultimately forced Mt. Gox to file for bankruptcy in February 2014 fully exposed the fragility of this period's infrastructure. In such an environment, even simple cross-exchange arbitrage faced multiple barriers, because traders had to pre-position funds on multiple exchanges, bear extremely high counterparty and operational risk, and endure the execution delay imposed by Bitcoin network confirmation times.
The near-total absence of regulation was another core feature of the frontier era. Governments and financial regulators around the world were still exploring the legal nature, accounting standards, and regulatory framework of Bitcoin and its derivatives, and the market expanded in disorder in a near-anarchic state. This regulatory vacuum provided fertile soil for innovation on the one hand but, on the other, condoned the proliferation of market manipulation, fraud, and money laundering. The large-scale expansion of ICOs in 2017 was a concentrated embodiment of the consequences of this regulatory absence.
Together, these factors produced the extremely low overall market efficiency of the frontier era. As detailed in Section 15.2.5, cross-exchange spreads long stayed above 5%, and regional spreads such as the "Kimchi premium" reached double digits [25]; weak-form efficiency tests also showed significant predictability (see Section 15.2.2), with return series departing significantly from a random walk [2].
The final years of the frontier era saw the emergence of an innovation that would reshape the efficiency of crypto markets. In 2016, BitMEX launched the first Bitcoin perpetual futures (XBTUSD). As a derivative with no expiration date that anchors to the spot price through a funding rate mechanism, it was initially intended only to solve the problems of fragmented liquidity and difficult fiat on- and off-ramps in the early crypto market. In its early days, however, the efficiency of the perpetual futures market was extremely low. Because of the absence of mature market makers and arbitrageurs, the funding rate fluctuated enormously, frequently reaching extreme positive or negative values, and the magnitude of the basis's deviation from the spot price was also substantial. Funding-rate arbitrage in this period was very limited, conducted mainly by a few technical geeks and early quant teams. This early low-efficiency state offered exactly the rich profit space for the arbitrage capital that would follow and foreshadowed that perpetual futures would become the core force driving the evolution of market efficiency.
15.6.2 The institutionalization era (2018–2023)
In December 2017, the Chicago Mercantile Exchange and the Chicago Board Options Exchange almost simultaneously launched cash-settled Bitcoin futures contracts. This event is widely regarded as a key watershed in the evolution of digital asset markets, marking the opening of the institutionalization era. In this stage, the market's core driving force shifted from the early tech enthusiasts and retail investors to professional financial institutions, quant funds, and market makers. Their entry dramatically changed the market's participant composition, infrastructure level, and efficiency paradigm.
The influx of professional participants brought capital, technology, and experience. The deep participation of top market makers such as Jump Trading, Wintermute, and GSR significantly improved the liquidity depth and order-book quality of major exchanges and greatly compressed cross-exchange spreads; as shown in Section 15.2.5, spreads between major exchanges converged rapidly to below 1% after 2018. The emergence of regulated derivatives provided professional institutions with effective hedging tools and price benchmarks, significantly promoting the price discovery efficiency of the spot market [43].
Infrastructure also underwent a fundamental upgrade in this period. A new generation of exchanges represented by Binance, Coinbase Pro, and FTX offered more powerful, more responsive trading APIs, facilitating programmatic trading. The emergence of compliant custody solutions addressed institutional investors' core concern about asset security. At the same time, the wide adoption of stablecoins (especially USDT and USDC) provided an efficient on-chain channel for cross-exchange fund transfers, greatly reducing the capital friction of arbitrage. Figure 15-20 shows the core driving factors of this stage—professional participants, upgraded infrastructure, and an initially established regulatory framework working together to drive efficiency improvement.
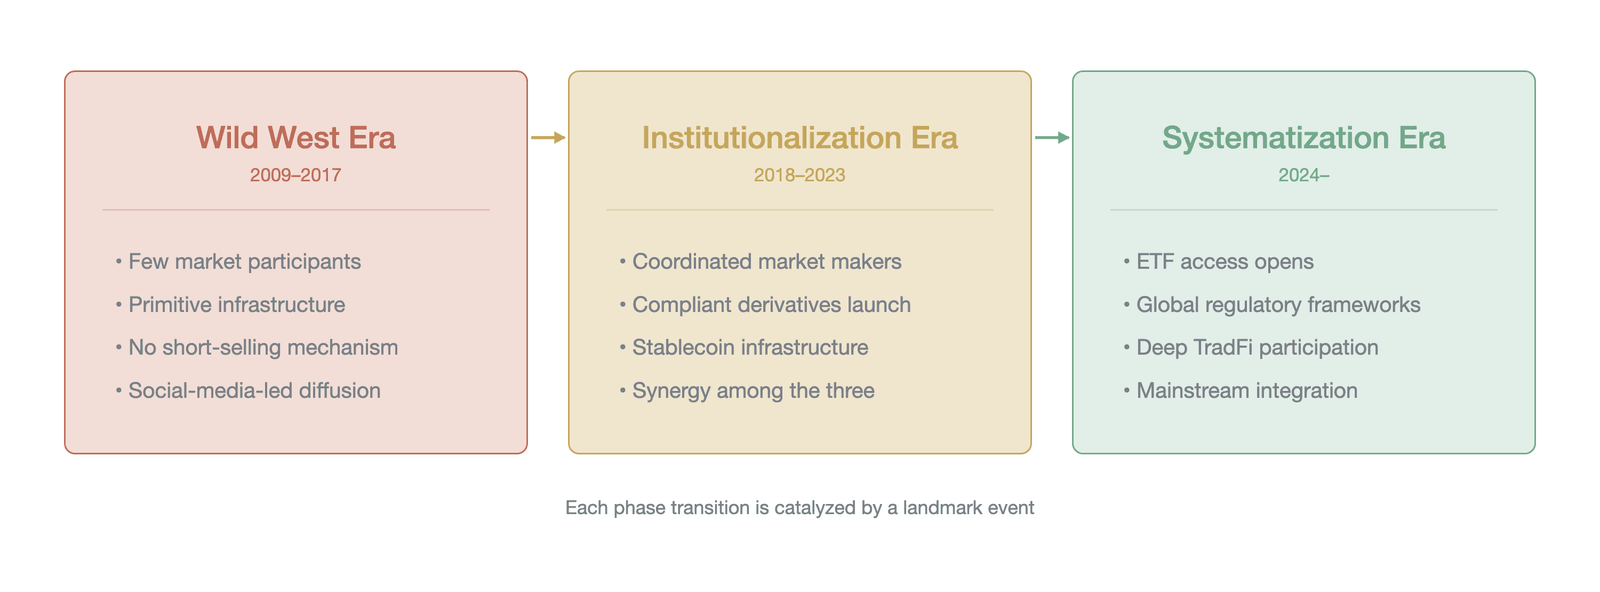
Figure 15-20. The driving factors and efficiency features of the three-stage evolution
Figure 15-20 uses a structured view to show the core factors driving efficiency evolution in the three stages: the bottleneck of the frontier era lay in low participation and primitive infrastructure; the institutionalization era saw efficiency leap forward driven jointly by professional market makers, regulated derivatives, and stablecoin infrastructure; and the regulated era pushed efficiency to new highs through ETF channels, global regulatory frameworks, and the entry of traditional finance giants, with each phase transition catalyzed by a signature event.
The institutionalization era witnessed the explosive growth of perpetual futures and a comprehensive improvement in their efficiency. Between 2019 and 2020, major exchanges such as Binance, OKX, and Bybit fully introduced perpetual futures, whose volume rapidly overtook that of traditional dated futures to become the most central liquidity pool in crypto markets. With the deep participation of professional market makers and quant funds, the efficiency of the perpetual futures market improved significantly. Cross-exchange perpetual-futures basis arbitrage became extremely active, causing price differences across platforms to be flattened rapidly. The fluctuation of the funding rate also gradually converged, the frequency of extreme rates fell sharply, and the speed of mean reversion clearly accelerated [21]. During this period, perpetual futures gradually captured the price discovery leadership of crypto markets and became the tool of choice for informed traders to express their views. This efficiency improvement was not without cost, however. The collapse of FTX in 2022 exposed the systemic fragility of the centralized perpetual futures market: when the collapse of trust caused liquidity to evaporate instantly, high leverage and complex liquidation mechanisms triggered a cascade effect, causing a severe efficiency regression in the perpetual futures market under extreme stress. This event also prompted the market to reflect on the risks of the centralized architecture and laid the groundwork for the rise of decentralized perpetual futures.
The improvement in efficiency was not without cost, however. Although the deep participation of professional market makers significantly improved liquidity and price discovery quality in the normal state, their homogeneous strategies and risk models could also constitute a new source of fragility under extreme conditions. When most market makers use similar volatility models and inventory-management algorithms, market stress can trigger synchronized liquidity withdrawal, causing the seemingly ample order-book depth of the normal state to evaporate within minutes; the "Black Thursday" of March 2020 is a typical case of this "phantom depth" risk. This tension between efficiency improvement and the accumulation of fragility is a key dimension for understanding the evolution of crypto markets.
At the weak-form efficiency level, as shown by the variance ratio analysis in Section 15.2.2, the market efficiency of Bitcoin and Ethereum exhibited a significant and sustained improvement trend after 2018 [7], with the daily variance ratio converging toward 1.0 and the intraday scale already highly close to a random walk [6]. This improvement was stratified, however: the efficiency of the core market improved far faster than that of the peripheral market [44].
15.6.3 The regulated era (2024–)
On January 10, 2024, the U.S. Securities and Exchange Commission formally approved the first spot Bitcoin ETFs, and this milestone event announced that digital asset markets had entered a new regulated era. If the protagonists of the institutionalization era were crypto-native professional funds and market makers, then the protagonists of the regulated era are the traditional finance giants of Wall Street, such as BlackRock, Fidelity, and Invesco, the world's largest asset managers. Their entry brought not only an unprecedented scale of capital but, more importantly, integrated digital assets into the compliance framework and infrastructure of traditional finance, fundamentally changing the operating logic of the market.
The launch of spot ETFs provided a low-barrier, compliant channel for vast amounts of regulated capital to invest in Bitcoin. The ETFs' authorized participants (APs) (usually large trading firms such as Jane Street and Virtu Financial) took on the role of arbitraging between the ETF-share market and the Bitcoin spot market. This mechanism ensured that the ETF's market price closely tracks its net asset value and also coupled Bitcoin's price discovery mechanism with traditional financial markets more tightly than ever before. The ETF's authorized participants can be said to serve as an "efficiency bridge" between the traditional financial world and the crypto-native world. In assessing the attribution of the regulated era's efficiency improvement, however, one must also consider the potential contribution of the contemporaneous global macro-liquidity environment. The improvement in efficiency metrics in 2024 coincided with rising market expectations of Federal Reserve rate cuts and a rebound in global risk appetite, and these macro factors may have had a positive impact on crypto market efficiency independent of the ETF channel; future research needs to control for the macro-liquidity cycle to isolate more precisely the independent contribution of the regulatory factor.
At the same time, regulatory frameworks around the world matured. The European Union's Markets in Crypto-Assets Regulation (MiCA) began phased implementation in 2024, and similarly clear regulatory guidance was successively issued in Hong Kong, Singapore, Dubai, and elsewhere. This regulatory certainty greatly reduced the compliance risk and legal uncertainty faced by institutional investors and laid the foundation for larger-scale adoption.
In the regulated era, the market's efficiency paradigm exhibits features starkly different from the previous two stages. Riskless arbitrage opportunities in core assets have been almost entirely eliminated. Spreads between major compliant exchanges have been compressed to within a few basis points. At the weak-form efficiency level, the market has reached a very high level across all time scales. As shown in Figure 15-21(b), the daily and weekly variance ratios of Bitcoin are already very close to 1.0, indicating that exploitable price patterns have become extremely scarce.
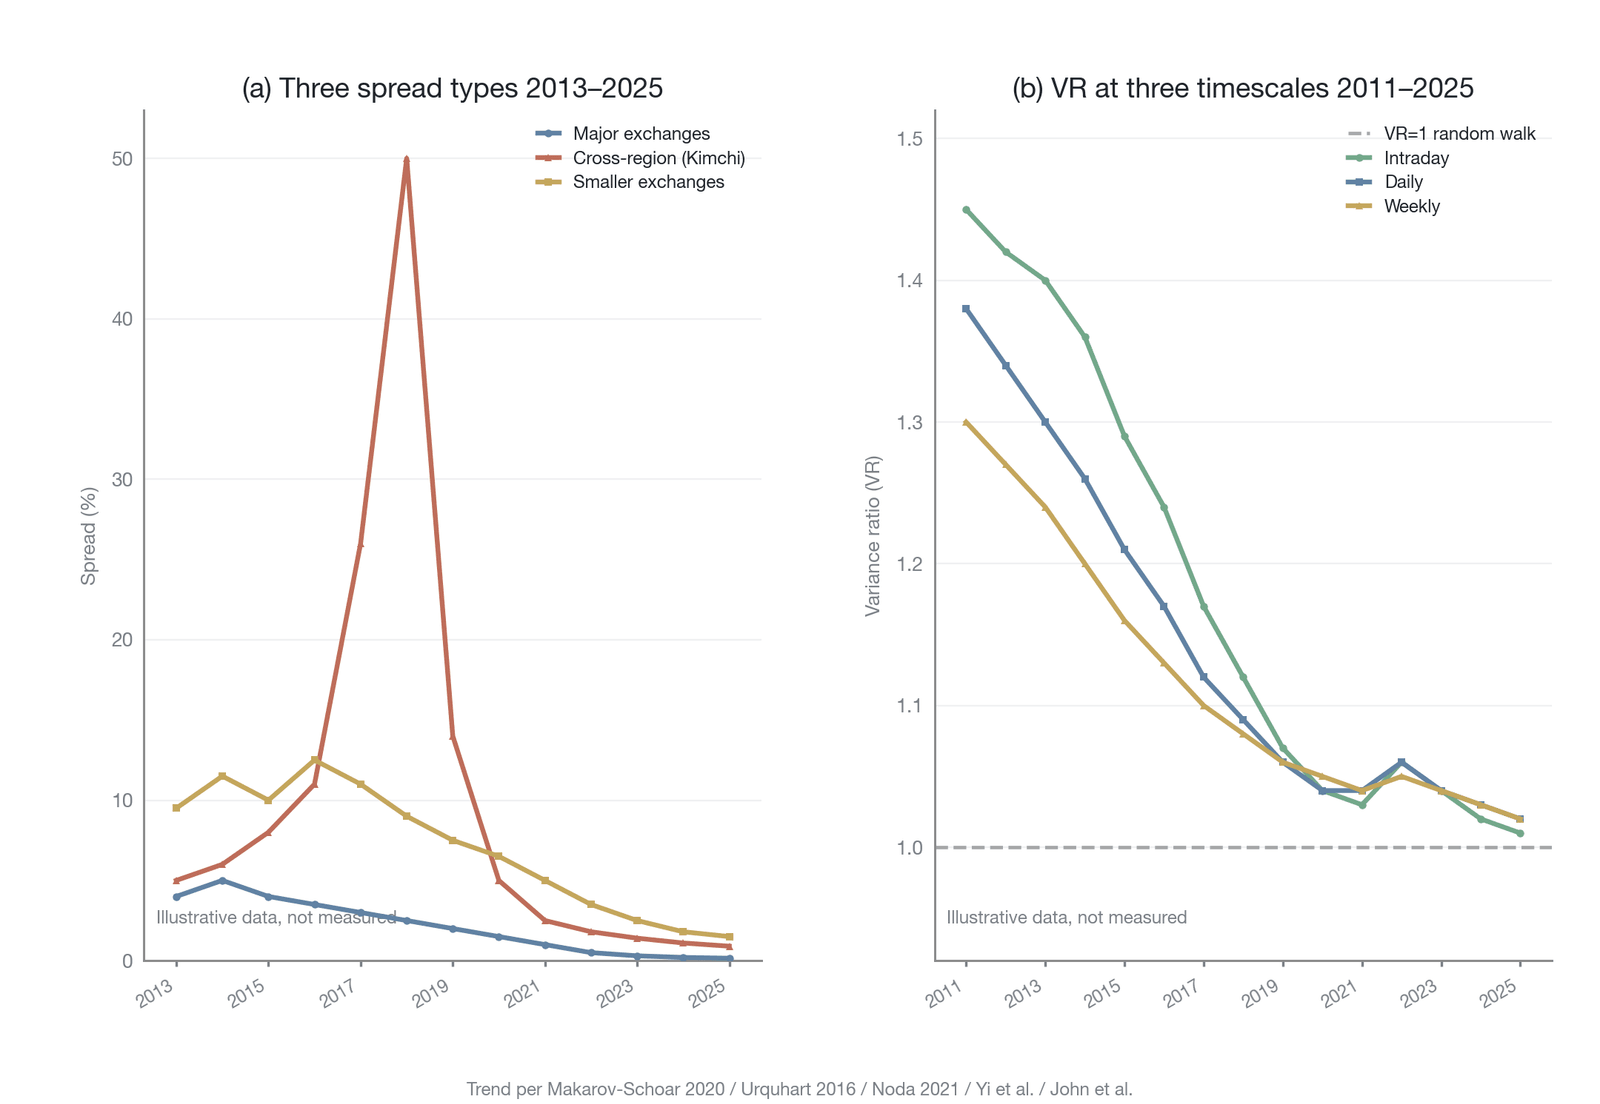
Figure 15-21. Quantitative evidence of efficiency evolution (illustrative)
Figure 15-21 uses illustrative data to show the qualitative trend of efficiency evolution, with the direction and magnitude synthesized from the relevant literature: the spread convergence references Makarov and Schoar (2020) [25] and John et al. (2024) [44], and the variance-ratio evolution references Urquhart (2016) [2], Noda (2021) [7], and Yi et al. (2023) [6]. Panel (a) shows that the three types of cross-exchange Bitcoin spreads (between major exchanges, cross-region such as the Kimchi premium, and between small and mid-sized exchanges) have declined continuously since 2013 and accelerated their convergence after the two nodes of 2018 and 2024; panel (b) shows that the intraday, daily, and weekly variance ratios have all converged toward 1.0 (the random-walk benchmark) since 2011, indicating that price predictability has gradually declined and weak-form efficiency has strengthened continuously.
On entering the regulated era, the perpetual futures market faces new challenges and reshaping. First, with the approval of spot ETFs, the arbitrage activity of traditional financial capital (such as the cross-market arbitrage of ETF authorized participants) has had a profound impact on the funding-rate structure of perpetual futures, making the dynamics of the basis and funding rate more complex. Second, global regulators' restrictions on high-leverage derivatives are increasingly strict, and some jurisdictions even prohibit offering perpetual futures trading to retail investors. This regulatory pressure forces liquidity to be reallocated across platforms. A more striking change is the rapid rise of DEX perpetual futures. High-performance decentralized exchanges represented by dYdX v4 and Hyperliquid have significantly narrowed the gap with centralized exchanges in the latency and execution cost of day-to-day trading, attracting a large amount of institutional capital seeking to avoid counterparty risk. These platforms still face tests in execution quality and manipulation resistance under extreme conditions, however: in the whale manipulation incident on Hyperliquid in March 2025, validators voted to forcibly liquidate an anomalous position and rolled back the associated price; this intervention protected the system from larger losses but also exposed the centralized nature of its governance. In fact, the sequencers of most on-chain perpetual futures platforms are still operated by a limited validator set controlled by the project team, and this architecture of "technical decentralization but centralized governance" means that risks such as transaction censorship and priority ordering still exist. Nonetheless, on-chain perpetual futures still differ from off-chain ones in oracle update frequency and liquidation efficiency, and this structural difference between CEXs and DEXs creates new arbitrage room and constitutes a frontier topic in the study of perpetual futures market efficiency in the regulated era [22]. The empirical conclusion that CEXs dominate price discovery (such as the study by Zhivkov (2026) [22]) is based mainly on the period when DEX perpetual futures had not yet scaled, and with the explosive growth of on-chain perpetual futures volume since the second half of 2024, the direction of information flow between CEXs and DEXs may be changing.
This does not mean the market is already fully efficient, however. As discussed earlier with respect to semi-strong-form efficiency, information processing cost remains the key to earning excess returns. In the regulated era, the focus of competition has shifted from eliminating simple price differences to the deep analysis of and rapid reaction to complex information. This includes microstructure analysis of on-chain data, interpretation of the information implied in derivatives markets, and quantitative modeling of how macroeconomic and geopolitical factors affect crypto assets. The market's "information advantage" has shifted from discovering simple signals that are public but unpriced to gaining a competitive edge through better models, faster execution, and lower operating costs.
15.6.4 Future drivers
Looking ahead, the evolution of digital asset market efficiency is far from over. New technology, market structures, and regulatory paradigms will continue to reshape its face, and several key drivers deserve especially close attention.
Artificial intelligence, and especially autonomous trading agents driven by large language models, is likely to become an important force in the field of information processing. AI agents have the potential to greatly reduce information processing cost, raising the market's reaction speed to public information from the minute level to the second or even millisecond level. This may also bring new risks, however: "algorithmic resonance" among AI agents may amplify market volatility under specific conditions, forming a new source of systemic risk. A deeper risk is that when a large number of AI agents use similar large-language-model architectures, similar training data, and similar decision frameworks, they may produce an "algorithmic herding" that goes beyond traditional herd behavior, with a transmission speed and strategy consistency far higher than those of human traders, potentially producing a collective directional bias when fundamentals are ambiguous.
The continued iteration of the underlying infrastructure will likewise strongly affect the market's execution efficiency. Faster blockchains, more efficient cross-chain communication protocols, and more advanced exchange matching engines will further reduce trading latency and execution cost.
The global coordination and deepening of regulation will be another key variable shaping the future of market efficiency. As major economies complete the regulatory characterization and framework-building for crypto assets, the room for cross-border regulatory arbitrage will be compressed. The impact of regulation is not a one-way efficiency improvement, however. Strict compliance requirements may raise the friction cost of arbitrage—for example, MiCA's capital requirements for stablecoin issuers may affect the availability of cross-exchange arbitrage media such as USDT; differentiated regulation across jurisdictions may drive liquidity to migrate from compliant platforms to loosely regulated offshore platforms, creating new market fragmentation; and restrictions on perpetual futures leverage may lead to a reallocation of informed traders across platforms. In addition, even for spot ETFs already approved, the SEC retains ongoing regulatory authority and the possibility of suspending or revoking approval upon finding evidence of market manipulation, and this policy uncertainty itself constitutes a risk factor in efficiency evolution.
The perpetual futures market will continue to play a key role in the efficiency evolution to come. As the underlying infrastructure upgrades, we can expect perpetual futures to evolve toward higher-frequency settlement cycles and more transparent liquidation mechanisms. The maturation of on-chain perpetual futures will further narrow their efficiency gap with centralized exchanges and may even, through innovative decentralized oracles and fully on-chain order-book designs, surpass them along certain dimensions. In addition, as the correlations among different crypto assets change, cross-asset funding-rate arbitrage and complex statistical-arbitrage strategies will become more prevalent. Perpetual futures will not only continue to serve as the engine of crypto market price discovery, but the evolution of their own institutional design will also become a core driving force pushing the entire market toward a more efficient form.
In sum, the evolution of crypto market efficiency is an ongoing adaptive process. From the chaos and disorder of the frontier era, through the professional competition of the institutionalization era, to the compliant integration of the regulated era, the rules of the market's game keep changing, and efficiency improvement is always accompanied by the emergence of new forms of fragility. The future market will be an ecosystem shaped jointly by AI agents, high-speed infrastructure, and global regulatory frameworks—more efficient but possibly also more complex. For all market participants, understanding and adapting to this evolutionary trend (just as the adaptive markets hypothesis reveals) will be the key to continued survival and development. This is precisely the core insight that this chapter—from theoretical toolkit to empirical testing, and then to case analysis and the historical-evolutionary framework—has sought to offer the reader.
15.7 Chapter summary
This chapter, centering on the informational efficiency of digital asset markets, constructed the multidimensional "efficiency spectrum" analytical framework and applied it systematically to the empirical testing of weak-form efficiency, semi-strong-form efficiency, institutional efficiency, and extreme-stress scenarios. The core claim of this framework is that any statement about market efficiency divorced from specific dimensional qualifications may be misleading. A market can exhibit random-walk characteristics at the millisecond scale of high-frequency trading yet reveal predictable momentum or reversal patterns at the daily or weekly level; the efficiency of the Bitcoin market differs significantly from that of small-cap tokens; and the performance of efficiency differs enormously between normal markets and crisis states of dried-up liquidity. The efficiency spectrum framework decomposes efficiency into five dimensions—time, asset, information type, market state, and market tier—providing an operational tool for precisely locating the efficiency features of any market phenomenon.
Within this framework, the efficiency features of perpetual futures ran through the analysis at every level of this chapter. In the weak-form efficiency tests, the perpetual futures of major assets are closer to a random walk than spot on the high-frequency intraday scale, but the mean-reverting nature of the funding rate and the basis constitutes an institutional weak-form efficiency gap [21]. In the semi-strong-form efficiency tests, perpetual futures exhibit an information-amplification effect because of their leverage and short-selling convenience, reacting to sudden events faster than spot. At the institutional efficiency level, the funding settlement once every 8 hours endogenously creates a predictable efficiency cycle (the U-shaped pattern), and the mark-price smoothing mechanism and discrete oracle updates introduce a systematic lag in information reflection. In the extreme stress test of the FTX collapse, the normal-state efficiency advantage of perpetual futures rapidly reversed into a source of systemic risk, as high leverage and the liquidation mechanism triggered a cascade effect that caused liquidity to evaporate. Complementing the institutional analysis of perpetual futures, information processing cost was shown to be the key variable determining semi-strong-form efficiency. Blockchain transparency makes vast amounts of data publicly available, but a huge processing gulf exists between raw on-chain transaction records and tradable signals: the market's reaction to standardized macro information is nearly instantaneous, while its reaction to complex on-chain information lags significantly, and this structural advantage created by differences in processing cost is one of the core sources of excess returns in the current market.
From the perspective of dynamic evolution, drawing on Lo's (2004) adaptive markets hypothesis [9], crypto market efficiency adjusts continually with changes in participant composition, infrastructure, and the regulatory environment: from early chaos and disorder, through the professional competition of the institutionalization era, to the compliant integration of the regulated era. The gradual weakening of anomalies in the weak-form efficiency tests and the long-run convergence trend of cross-exchange spreads provide ample empirical support for this evolutionary process. These findings have direct practical implications: the success or failure of a trading strategy depends on whether the inefficiency it relies on truly exists, whether it is sustainable, and whether it is robust across different market states. Table 15-7 turns the efficiency spectrum framework into a decision checklist for traders and risk managers.
| Efficiency dimension | Key assessment question | Application for traders | Application for risk managers | Warning signs |
|---|---|---|---|---|
| Time dimension | What time scale does the strategy rely on? What is the efficiency level at that scale? | High-frequency strategies must verify whether predictable patterns still exist at the minute level; daily strategies must test the current strength of momentum or reversal effects. | Assess whether the time frequency used in the risk model matches the actual trading frequency; avoid inferring high-frequency risk from daily data. | The backtest performs excellently at one time scale but fails at others; strategy returns fluctuate sharply as the time scale changes. |
| Asset dimension | How liquid is the target asset, what is its market cap, and how much analyst coverage does it have? | Strategies on small-cap coins require higher risk-premium compensation; do not apply the efficiency assumptions of major coins to long-tail assets. | Set stricter position limits and stop-losses for long-tail-asset exposure; liquidity stress tests should account for differences across asset tiers. | The strategy works on BTC/ETH but fails on small-cap coins; or, conversely, the "excess return" on long-tail assets may be a liquidity premium rather than alpha. |
| Information-type dimension | How high is the processing cost of the information the strategy relies on? How fast does the market react to that type of information? | Strategies exploiting complex on-chain signals require investment in analytical tools and expertise; the arbitrage window for standardized information is extremely short and demands high-frequency infrastructure. | Assess whether the team has the capacity to interpret the key information types; exposure to high-processing-cost information requires a longer risk window. | The information advantage the strategy relies on is being eroded by the spread of tools; or the strategy overestimates its own speed advantage in interpreting complex information. |
| Market-state dimension | How does the strategy perform across different market states? Which state are we currently in? | A strategy that works in the normal state may fail or even reverse in a crisis; build dynamic position-adjustment mechanisms for state transitions. | Stress tests must simulate efficiency-collapse scenarios, not merely price volatility; liquidity risk amplifies nonlinearly in a crisis. | The strategy is robust in backtests but suffers abnormal, massive losses during March 2020 or the FTX event; risk indicators gave no warning on the eve of the crisis. |
| Institutional efficiency | Are there predictable institutional efficiency cycles (such as funding settlement)? | Perpetual-futures strategies must account for price behavior around funding settlement; mark-price lag may affect stop-loss execution. | Assess the cost of derivatives exposure under extreme funding rates; a divergence between the mark price and the index price may trigger unexpected liquidations. | Strategy returns are highly concentrated in specific windows around funding settlement; an annualized funding rate above 30% in absolute value is a significant tail-risk signal; a cross-exchange spread persistently above 20 basis points warrants caution about the limits of arbitrage. |
| Cross-dimensional synthesis | Is the strategy simultaneously exposed to risk across multiple dimensions of the efficiency spectrum? | Avoid using high-frequency strategies on low-efficiency assets (a time × asset mismatch); avoid relying on a complex-information advantage during a crisis (a state × information mismatch). | Identify the possibility of multidimensional risk resonance: small-cap coin + crisis state + complex information = extremely high risk; build a multidimensional risk matrix. | The strategy looks robust along a single dimension but collapses when pressures stack across dimensions; risk exposure overlaps across several low-efficiency quadrants of the efficiency spectrum. |
Table 15-7. A practical guide: a decision checklist based on the efficiency spectrum (Data source: compiled by the author)
Note: This checklist is intended to turn the chapter's efficiency spectrum framework into an actionable decision tool. In use, evaluate and record answers item by item according to the specific strategy and market environment, in order to identify potential risks in efficiency assumptions.
Efficiency Spectrum Locator Card · Chapter 15 Summary
Dimension Core finding Key evidence Time Major assets approach weak-form efficiency intraday, with predictability across days; funding settlement creates periodic efficiency fluctuations High-frequency variance ratio approaches 1.0; U-shaped volatility pattern around the 8-hour settlement Asset Core assets (BTC/ETH) are far more efficient than long-tail assets; the stratification of liquidity determines the stratification of efficiency Spreads between major exchanges <0.5%; significant momentum/reversal effects in small-cap tokens Information type The market reacts instantly to standardized information but slowly to complex on-chain information; information processing cost is the core friction ETF approval priced within minutes; about 36% of the price move after a DeFi hack precedes the announcement Market state Efficiency improves steadily in the normal state but collapses nonlinearly under extreme stress; efficiency is highly state-dependent Long-run convergence of cross-exchange spreads; liquidity evaporation and basis dislocation during the FTX collapse Market tier Perpetual futures dominate price discovery in the normal state but may amplify systemic risk in a crisis; the funding rate has endogenous predictability Perpetual futures hold the majority of the information share; liquidation cascades cause price overshooting during crises One-sentence takeaway for the chapter: The informational efficiency of digital asset markets is a multidimensional, dynamic, and state-dependent complex system; perpetual futures, as its core hub, improve market efficiency in the normal state by aggregating informed traders, but leave predictable periodic gaps in their institutional design and face the risk of nonlinear collapse under extreme stress.
This chapter's exploration of the time-varying nature of informational efficiency also naturally draws our attention to the core themes of the chapters to come. The dynamic evolution of market efficiency, and especially its sharp collapse under extreme stress, is the key to understanding the microstructure and price-benchmark governance of digital asset markets. When information processing cost is high and market participants struggle to reach consensus on an asset's fundamental value, price volatility intensifies; when liquidity dries up and the price discovery mechanism fails, even a small order can trigger enormous price impact. In the chapters that follow, we further explore themes such as leverage, liquidation mechanisms, and price-benchmark governance, and the efficiency analytical framework established in this chapter will provide a solid theoretical foundation for understanding these mechanisms.
References
[1] Fama, E. F. (1970). Efficient capital markets: A review of theory and empirical work. The Journal of Finance, 25(2), 383–417. https://doi.org/10.2307/2325486
[2] Urquhart, A. (2016). The inefficiency of Bitcoin. Economics Letters, 148, 80–82. https://doi.org/10.1016/j.econlet.2016.09.019
[3] Tran, V. L., & Leirvik, T. (2020). Efficiency in the markets of crypto-currencies. Finance Research Letters, 35, Article 101382. https://doi.org/10.1016/j.frl.2019.101382
[4] Kang, H. J., Lee, S. G., & Park, S. Y. (2022). Information efficiency in the cryptocurrency market: The efficient-market hypothesis. Journal of Computer Information Systems, 62(3), 622–631. https://doi.org/10.1080/08874417.2021.1872046
[5] Azar, P. D., Olivas, S., & Sinha, N. D. (2025). The price of processing: Information frictions and market efficiency in DeFi (Staff Report No. 1153). Federal Reserve Bank of New York. https://doi.org/10.59576/sr.1153
[6] Yi, E., Yang, B., Jeong, M., Sohn, S., & Ahn, K. (2023). Market efficiency of cryptocurrency: Evidence from the bitcoin market. Scientific Reports, 13, Article 4789. https://doi.org/10.1038/s41598-023-31618-4
[7] Noda, A. (2021). On the evolution of cryptocurrency market efficiency. Applied Economics Letters, 28(6), 433–439. https://doi.org/10.1080/13504851.2020.1758617
[8] Vidal-Tomás, D., Ibáñez, A. M., & Farinós, J. E. (2019). Weak efficiency of the cryptocurrency market: A market portfolio approach. Applied Economics Letters, 26(19), 1627–1633. https://doi.org/10.1080/13504851.2019.1591583
[9] Lo, A. W. (2004). The adaptive markets hypothesis: Market efficiency from an evolutionary perspective. The Journal of Portfolio Management, 30(5), 15–29. https://doi.org/10.3905/jpm.2004.442611
[10] Lo, A. W., & MacKinlay, A. C. (1988). Stock market prices do not follow random walks: Evidence from a simple specification test. The Review of Financial Studies, 1(1), 41–66. https://doi.org/10.1093/rfs/1.1.41
[11] Chow, K. V., & Denning, K. C. (1993). A simple multiple variance ratio test. Journal of Econometrics, 58(3), 385–401. https://doi.org/10.1016/0304-4076(93)90051-6
[12] Wright, J. H. (2000). Alternative variance-ratio tests using ranks and signs. Journal of Business & Economic Statistics, 18(1), 1–9. https://doi.org/10.1080/07350015.2000.10524842
[13] Box, G. E. P., & Pierce, D. A. (1970). Distribution of residual autocorrelations in autoregressive-integrated moving average time series models. Journal of the American Statistical Association, 65(332), 1509–1526. https://doi.org/10.1080/01621459.1970.10481180
[14] Brock, W. A., Dechert, W. D., Scheinkman, J. A., & LeBaron, B. (1996). A test for independence based on the correlation dimension. Econometric Reviews, 15(3), 197–235. https://doi.org/10.1080/07474939608800353
[15] Apopo, N., & Phiri, A. (2021). On the (in)efficiency of cryptocurrencies: Have they taken daily or weekly random walks? Heliyon, 7(4), Article e06685. https://doi.org/10.1016/j.heliyon.2021.e06685
[16] Aslan, A., & Sensoy, A. (2020). Intraday efficiency-frequency nexus in the cryptocurrency markets. Finance Research Letters, 35, Article 101298. https://doi.org/10.1016/j.frl.2019.09.013
[17] Zhang, Y., Chan, S., Chu, J., & Sulieman, H. (2020). On the market efficiency and liquidity of high-frequency cryptocurrencies in a bull and bear market. Journal of Risk and Financial Management, 13(1), Article 8. https://doi.org/10.3390/jrfm13010008
[18] Zaremba, A., Bilgin, M. H., Long, H., Mercik, J., & Szczygielski, J. J. (2021). Up or down? Short-term reversal, momentum, and liquidity effects in cryptocurrency markets. International Review of Financial Analysis, 78, Article 101908. https://doi.org/10.1016/j.irfa.2021.101908
[19] Caporale, G. M., & Plastun, A. (2020). Momentum effects in the cryptocurrency market after one-day abnormal returns. Financial Markets and Portfolio Management, 34, 251–266. https://doi.org/10.1007/s11408-020-00357-1
[20] Bianchi, D., Guidolin, M., & Pedio, M. (2023). The dynamics of returns predictability in cryptocurrency markets. The European Journal of Finance, 29(6), 583–611. https://doi.org/10.1080/1351847X.2022.2084343
[21] He, S., Manela, A., Ross, O., & von Wachter, V. (2024). Fundamentals of perpetual futures (Working Paper). https://doi.org/10.48550/arXiv.2212.06888
[22] Zhivkov, P. (2026). The two-tiered structure of cryptocurrency funding rate markets. Mathematics, 14(2), Article 346. https://doi.org/10.3390/math14020346
[23] Caporale, G. M., & Plastun, A. (2019). The day of the week effect in the cryptocurrency market. Finance Research Letters, 31, 258–269. https://doi.org/10.1016/j.frl.2018.11.012
[24] Aharon, D. Y., & Qadan, M. (2019). Bitcoin and the day-of-the-week effect. Finance Research Letters, 31, 415–424. https://doi.org/10.1016/j.frl.2018.12.004
[25] Makarov, I., & Schoar, A. (2020). Trading and arbitrage in cryptocurrency markets. Journal of Financial Economics, 135(2), 293–319. https://doi.org/10.1016/j.jfineco.2019.07.001
[26] Giudici, P., & Pagnottoni, P. (2019). High frequency price change spillovers in bitcoin markets. Risks, 7(4), Article 111. https://doi.org/10.3390/risks7040111
[27] Fama, E. F., Fisher, L., Jensen, M. C., & Roll, R. (1969). The adjustment of stock prices to new information. International Economic Review, 10(1), 1–21. https://doi.org/10.2307/2525569
[28] Saggu, A., Ante, L., & Kopiec, K. (2025). Uncertain regulations, definite impacts: The U.S. SEC's regulatory interventions and their effects on crypto assets. Finance Research Letters, 72, Article 106413. https://doi.org/10.1016/j.frl.2024.106413
[29] LMAX Group & Macro Hive. (2025, April). Millisecond reactions to market shocks: From order flow to cross-asset opportunity. https://www.lmax.com/documents/LMAXGroup-Macro-Hive-report-2nd-Edition.pdf
[30] Ruan, Q., & Streltsov, A. (2022). Perpetual futures contracts and cryptocurrency market quality (Working Paper). https://doi.org/10.2139/ssrn.4218907
[31] Hasbrouck, J. (1995). One security, many markets: Determining the contributions to price discovery. The Journal of Finance, 50(4), 1175–1199. https://doi.org/10.1111/j.1540-6261.1995.tb04054.x
[32] Kapar, B., & Olmo, J. (2019). An analysis of price discovery between bitcoin futures and spot markets. Economics Letters, 174, 62–64. https://doi.org/10.1016/j.econlet.2018.10.031
[33] Alexander, C., Choi, J., Park, H., & Sohn, S. (2020). BitMEX bitcoin derivatives: Price discovery, informational efficiency, and hedging effectiveness. Journal of Futures Markets, 40(1), 23–43. https://doi.org/10.1002/fut.22050
[34] Robertson, K., & Zhang, R. (2025). Price discovery in bitcoin spot and futures markets. Journal of International Money and Finance, 159, Article 103415. https://doi.org/10.1016/j.jimonfin.2025.103415
[35] De Blasis, R., & Webb, A. (2022). Arbitrage, contract design, and market structure in bitcoin futures markets. Journal of Futures Markets, 42(3), 492–524. https://doi.org/10.1002/fut.22305
[36] Vidal-Tomás, D., Briola, A., & Aste, T. (2023). FTX's downfall and Binance's consolidation: The fragility of centralized digital finance. Physica A: Statistical Mechanics and Its Applications, 625, Article 129044. https://doi.org/10.1016/j.physa.2023.129044
[37] Allison, I. (2022, November 2). Divisions in Sam Bankman-Fried's crypto empire blur on his trading titan Alameda's balance sheet. CoinDesk. https://www.coindesk.com/business/2022/11/02/divisions-in-sam-bankman-frieds-crypto-empire-blur-on-his-trading-titan-alamedas-balance-sheet/
[38] Bloomberg. (2022, November 6). Binance to liquidate its FTX token (FTT) holdings amid Alameda balance-sheet revelations. Bloomberg News.
[39] Ray, J. J., III. (2022, November 17). Declaration of John J. Ray III in support of Chapter 11 petitions and first day pleadings. United States Bankruptcy Court for the District of Delaware.
[40] Yang, Y., & Ghosh, S. (2022, November 9). Binance backs out of FTX rescue, citing finances, investigations. Bloomberg. https://www.bloomberg.com/news/articles/2022-11-09/binance-is-said-to-be-very-unlikely-to-go-ahead-with-ftx-deal
[41] Khoo, Y. L., Leow, S., Polk, N., & Chia, D. (2022, November 17). Blockchain analysis: The collapse of Alameda and FTX. Nansen. https://www.nansen.ai/research/blockchain-analysis-the-collapse-of-alameda-and-ftx
[42] Shleifer, A., & Vishny, R. W. (1997). The limits of arbitrage. The Journal of Finance, 52(1), 35–55. https://doi.org/10.1111/j.1540-6261.1997.tb03807.x
[43] Augustin, P., Rubtsov, A., & Shin, D. (2023). The impact of derivatives on spot markets: Evidence from the introduction of bitcoin futures contracts. Management Science, 69(11), 6752–6776. https://doi.org/10.1287/mnsc.2023.4900
[44] John, K., Li, J., & Liu, R. (2024). Pricing and arbitrage across 80 cryptocurrency exchanges (Working Paper). New York University. https://doi.org/10.2139/ssrn.4816710