By early 2025, cryptocurrency derivatives trading had been fundamentally reshaped: perpetual futures accounted for 93% of all cryptocurrency derivatives volume [1]. That dominance is the endpoint of a long climb. Since BitMEX launched the first Bitcoin perpetual futures in 2016, an instrument with no expiry date, anchored to the spot price through the funding rate, has grown from a fringe experiment into core infrastructure for pricing crypto assets worldwide. As volumes have grown exponentially and the participant base has become more complex, however, volume alone can no longer answer a more basic question: does the market's overall quality match its scale? High leverage and around-the-clock trading may impose hidden structural costs that headline volume conceals. This tension frames the central question of the chapter: how can we construct a unified, multidimensional framework for evaluating market quality—one that diagnoses the true health of the perpetual futures market and confronts the systematic trade-offs among its quality dimensions?
Evaluating a trading market's quality means asking how well it satisfies the most fundamental demands of its participants. From the perspective of a perpetual futures trader, these expectations can be summarized as standards across five dimensions: low transaction costs (encompassing not only explicit fees but also the implicit taxes formed by the bid-ask spread, market impact, and funding rate), accurate price discovery (market prices that reflect supply-and-demand information rapidly and without bias), strong resilience (the maintenance of liquidity supply amid extreme volatility), fair trading rules (ordinary participants are not placed at a systematic disadvantage for lacking market-maker privileges), and open market accessibility (the ability to participate in global pricing regardless of geographic location, capital scale, or technical sophistication). Together, these five dimensions constitute the core framework of market quality. The microstructure analyses in Chapters 13 through 24—covering price discovery, arbitrage mechanisms, liquidity supply, and the sources of volatility—all ultimately serve a single macro-level question: how does the perpetual futures market perform overall across these five dimensions? The task of this chapter is to integrate the fragmented conclusions of the preceding chapters into a structured diagnostic report on market quality, a framework that measures both the absolute level of each dimension and the intrinsic conflicts among them. The high-leverage mechanisms introduced to lower transaction costs, for example, often come at the expense of the market's resilience under extreme conditions, while the strict admission screening implemented in pursuit of absolute fairness inevitably undermines the market's accessibility.
This chapter first measures the five dimensions of transaction costs, price discovery, resilience, fairness, and accessibility (Sections 25.2 through 25.6), and then incorporates three market states—normal, stressed, and crisis—to analyze the time-varying characteristics and state dependence of market quality. On this basis, the chapter constructs an evaluation model that unifies the five dimensions, delivers a structured quality assessment of perpetual futures platforms or specific assets, and explains the systematic compromises that different mechanism designs make among multidimensional quality objectives, thereby laying a diagnostic foundation for the subsequent discussion of regulatory intervention and institutional redesign.
25.1 Theoretical foundations of market quality
25.1.1 The economic meaning of market quality
At its most fundamental level, evaluating market quality examines how well a market's institutions allocate resources efficiently and distribute welfare among participants. A high-quality market should maximize social welfare, an objective that, at the microstructure level, manifests as the unity of investor welfare, market stability, and allocative efficiency. Investor welfare depends on the level of transaction costs, the accuracy of pricing, and the fairness of participation rules. Market stability requires that a trading venue be able to withstand external shocks and the risks of internal positive-feedback loops. Allocative efficiency, in turn, depends on how accurately price signals reflect fundamental information, thereby directing capital toward its highest-value uses.
From the standpoint of social welfare, improvements in market quality translate directly into gains in economic efficiency: lower transaction costs improve the efficiency of capital allocation, greater price-discovery efficiency improves the quality of investment decisions, and stronger market resilience reduces systemic risk. These seemingly microscopic changes in metrics manifest at the macro level as improved allocative efficiency, reduced financial risk, and greater overall economic welfare. Market quality is therefore not only a concern for traders but also a strategic issue that regulators and policymakers must address.
The economic study of market quality can be traced back to the perfect-market benchmark proposed by Stigler (1961) [2]. In this theoretical abstraction, a perfect market is characterized by instantaneous trading, zero transaction costs, and homogeneous participants, with information transmitted through the market without friction. Real financial markets cannot attain this ideal state; the existence of information costs necessarily produces price dispersion and friction. The degree of departure from the perfect-market benchmark constitutes the central yardstick for measuring the loss of market quality. Within this framework, every evolution of market institutions—from manual matching to electronic order books, from centralized clearing to on-chain automated market makers (AMMs)—can be viewed as an attempt to narrow the gap between real and perfect markets.
Stigler's framework provides a systematic method of analysis. By taking the perfect market as a benchmark, we can decompose the defects of any real market into specific sources of cost: transaction costs, information asymmetry, participant heterogeneity, and so on. This decomposition allows us to diagnose exactly where a market's quality problems lie. If a market's bid-ask spread is wide, for example, we can ask further: is it because market makers face high adverse-selection risk (a problem of information asymmetry), because liquidity providers face high funding costs (insufficient market depth), or because the exchange's technical infrastructure is outdated (slow trading)? Different root causes call for different solutions.
Evaluating market quality requires a conceptual expansion from a single efficiency metric to a multidimensional evaluation system. Informational efficiency is an important dimension of market quality, measuring the speed and accuracy with which prices absorb new information. Yet informational efficiency is not the whole of market quality. A market that is highly informationally efficient but has extremely high transaction costs, or that is prone to systemic collapse under extreme conditions, cannot be called high-quality. Evaluating market quality requires jointly considering the efficiency of price discovery, the cost of liquidity provision, and the market's performance under stress. The need for this multidimensional perspective is especially pronounced in perpetual futures markets, because their distinctive mechanism designs—such as high leverage, automatic liquidation, and funding rates—do not exist in traditional financial markets.
The core insight of a multidimensional evaluation framework is to acknowledge the many-sided nature of market quality. A market may excel on some dimensions while exhibiting clear deficiencies on others. Some highly specialized perpetual futures platforms, for example, may be very competitive on transaction costs yet see their liquidity dry up under extreme conditions; conversely, some platforms with abundant liquidity may carry high effective transaction costs because of complex fee structures. This heterogeneity across dimensions means that a simple ranking approach is inappropriate. What we need is a framework capable of structured diagnosis across multiple dimensions, not a system that compresses all dimensions into a single score.
25.1.2 Traditional theories of market quality
Modern market microstructure theory provides rigorous analytical tools for quantifying market quality. O'Hara (1995) shifted the research focus from macroeconomic equilibrium to pricing mechanisms at the transaction level; centering on the bid-ask spread and information asymmetry, she revealed how market makers provide liquidity under the constraints of adverse-selection risk and inventory costs [3]. From this perspective, the bid-ask spread is not merely a trader's execution cost but also a structural indicator of the market's degree of information asymmetry and the efficiency of its liquidity supply. The more severe the information asymmetry that market makers face, the higher the spread compensation they demand, which lowers overall market quality.
The insight that information asymmetry is a fundamental source of market friction points directly to one key avenue for improving market quality: reducing the information asymmetry among participants.
As electronic trading became widespread, Harris (2003) proposed a more systematic multidimensional evaluation framework that decomposes market quality into four core dimensions: liquidity, transaction costs, price discovery, and market integrity [4]. This framework clarified the interactions among these dimensions: liquidity determines the implicit component of transaction costs (market impact), while the efficiency of price discovery is constrained by market integrity and transparency. Building on these theoretical foundations, regulators such as the U.S. Securities and Exchange Commission and the European Securities and Markets Authority (ESMA) established a system of regulatory metrics centered on best execution, order-handling rules, and market-data transparency, translating the academic concept of market quality into operational compliance standards.
Harris's four-dimensional framework provides a direct theoretical anchor for the five-dimensional model of this chapter. While retaining its core dimensions, the chapter makes three key adjustments: it splits market integrity into two independent dimensions, fairness and accessibility, to reflect the sharply distinct constraints on institutional fairness and participation barriers in crypto markets; and it adds a resilience dimension to capture the market's capacity to absorb shocks, which the traditional framework did not model explicitly.
The academic literature has developed a variety of single-dimension tools for measuring market quality. The illiquidity ratio proposed by Amihud (2002) captures a market's sensitivity to price impact through the ratio of price change to trading volume and has become one of the most widely used liquidity proxies in empirical research [5]. Such single-dimension metrics, however, cannot capture the multilayered quality characteristics specific to perpetual futures markets. A market with a very low Amihud ratio (that is, superficially abundant liquidity), for example, may prove extremely fragile during a liquidation cascade. The incremental contribution of the five-dimensional model lies in providing a structured diagnostic framework that can identify efficiency advantages and institutional deficiencies at the same time.
The important contribution of the Harris framework lies in making explicit the multidimensionality of market quality and the mutual constraints among its dimensions. A market with abundant liquidity can execute large trades with smaller market impact, thereby lowering transaction costs; but excessive liquidity supply may erode market makers' risk-bearing capacity, so that liquidity dries up rapidly in periods of stress. The efficiency of price discovery depends on participants' ability to acquire and process information, but this also implies the presence of informed traders, whose participation raises the transaction costs of uninformed traders. This trade-off among dimensions is a central difficulty in market design.
The traditional market-quality framework, however, reveals clear limitations when confronted with perpetual futures markets. These classical theories and regulatory metrics embed several structural assumptions that do not hold in crypto-asset markets. The traditional framework presumes that the market has a central clearing counterparty, is regulated within a single jurisdiction, and trades products with standardized expiry dates and delivery mechanisms. The fragmented liquidity of perpetual futures markets, their margin systems without a central clearing house, and their diverse liquidation mechanisms all fall outside the explanatory range of the traditional framework. Traditional models also fail to adequately account for the systemic risk introduced by high-leverage automatic liquidation, and they do not consider the distinctive features of around-the-clock trading, the funding-rate mechanism, and decentralized architectures.
The failure of these assumptions means that we cannot simply transplant the quality metrics of traditional markets onto perpetual futures markets. The traditional standard of best execution, for example, is typically based on the spread and execution speed; but in perpetual futures markets, funding-rate payments can far exceed spread costs and become the primary source of trading cost. Likewise, market integrity in traditional markets usually refers to the prevention of manipulation and fraud; but in perpetual futures markets, because of exchanges' proprietary market making and information asymmetry, fairness becomes a far more complex and critical problem. It is precisely this inapplicability of the traditional framework that motivates the new five-dimensional model proposed in this section.
25.1.3 The distinctive challenges of perpetual futures
The mechanism innovations of perpetual futures and the distinctive structure of crypto-asset markets pose five new questions for market-quality evaluation that the traditional framework cannot answer.
The first challenge is how to measure market resilience. Traditional financial markets rely on circuit breakers and central clearing counterparties as buffers against systemic risk, but in perpetual futures markets these external protections are typically absent. The market's capacity to repair itself under extreme conditions, the speed at which order-book depth recovers, and the ability to withstand chained liquidations must be measured explicitly as an independent dimension. In the absence of circuit breakers, resilience becomes the key indicator of whether a market can continue to function normally under stress.
The second challenge concerns how to handle institutional noise. Mechanism designs specific to perpetual futures—such as the periodic settlement of the funding rate and the tiered forced liquidation performed by the automatic liquidation engine—introduce non-informational volatility into the price-discovery process. Ruan and Streltsov (2022) show that the funding-rate cycle of perpetual futures produces a systematic intraday pattern in spot-market quality: market makers face higher adverse-selection risk around funding settlement and therefore widen the bid-ask spread [6]. This quality loss, induced by the contract mechanism itself, has no corresponding measurement dimension in traditional evaluation frameworks.
The third challenge is how to evaluate market fairness. Traditional markets are bound by unified regulatory standards, whereas in crypto-asset markets the agreements between exchanges and market makers often lack transparency, and some platforms even face conflicts of interest from proprietary market making. The asymmetric distribution of information privileges and execution latency means that fairness can no longer be assumed as a default premise but must be assessed explicitly through concrete indicators. In perpetual futures markets, certain market makers may obtain special data or priority liquidation rights from the exchange, and these hidden privileges directly affect market fairness.
The fourth challenge is how to compare centralized exchanges (CEXs) and decentralized exchanges (DEXs) within a unified framework. Barbon and Ranaldo (2024) find that CEXs have a cost advantage in small trades, whereas DEXs offer a more competitive execution environment for large trades [7]. Capponi and Jia (2025) further note that the infrastructure of DEXs confronts liquidity providers with a distinctive collective-action dilemma, giving them little incentive to withdraw from the liquidity pool [8]. These two architectures differ fundamentally in their trust assumptions, settlement efficiency, and modes of organizing liquidity, which requires the evaluation framework to be sufficiently inclusive. CEXs rely on the credit of a central counterparty, whereas DEXs rely on the transparent execution of smart contracts; the quality characteristics of the two are entirely different.
The fifth challenge is how to evaluate accessibility. The global nature of perpetual futures and the permissionless property of decentralized protocols transform the participation barrier from an exogenous regulatory setting, as in traditional markets, into an endogenous quality variable that directly determines the diversity of participants and the depth of liquidity pools (elaborated in Section 25.6).
25.1.4 The architecture of the five-dimensional model
To address these challenges, this section proposes the five-dimensional model of perpetual futures market quality (5D-MQ). The model decomposes the market quality of perpetual futures into five interrelated dimensions: transaction costs, price discovery, resilience, fairness, and accessibility. Together, these five dimensions constitute a complete evaluation framework capable of a structured diagnosis of how different platforms and different assets perform across various market states.
The five-dimensional model rests on a core recognition: the quality characteristics of perpetual futures markets differ fundamentally from those of traditional markets and require an evaluation framework designed specifically for them. This framework must be able to accommodate the mechanisms specific to perpetual futures (funding rates, automatic liquidation, and the like) while also comparing markets with different architectures (CEX versus DEX). More importantly, it must be able to identify the multiple dimensions of market quality and make explicit the trade-offs among them, thereby offering market participants and regulators a clear diagnosis and a direction for improvement.
Figure 25-1 presents the hierarchical architecture of the five-dimensional model: market quality sits at the center, from which the five first-level dimensions—transaction costs, price discovery, resilience, fairness, and accessibility—radiate outward, and each in turn resolves into several operational second-level indicators. The structure thus offers macro-level generality while grounding itself in concrete measurement indicators at the micro-operational level.
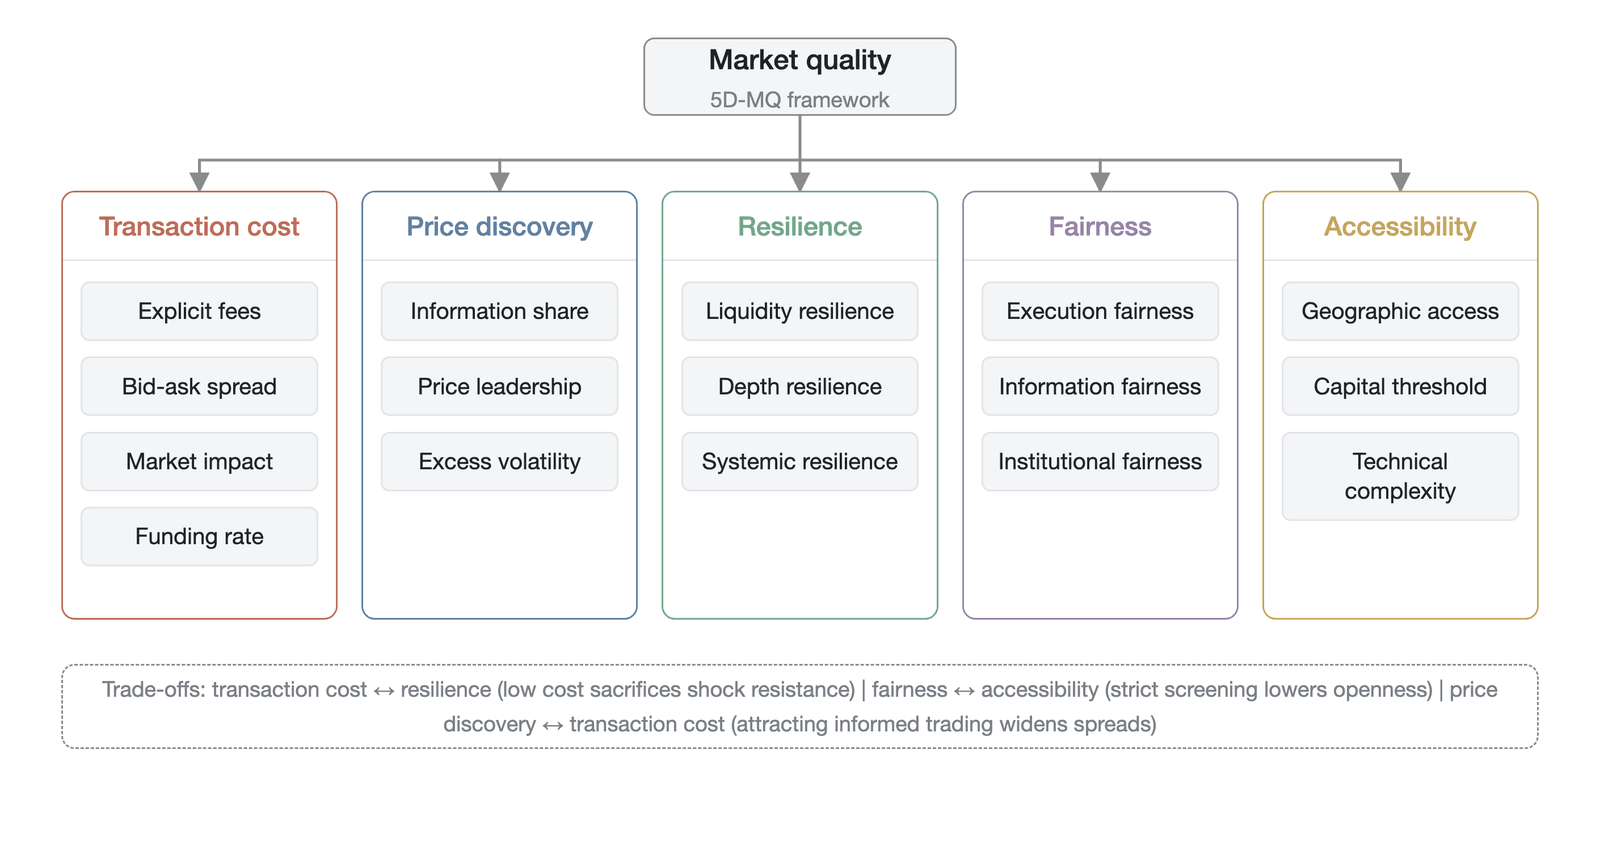
Figure 25-1. Architecture of the five-dimensional model of perpetual futures market quality (5D-MQ) (Data source: author's construction)
The design of the five-dimensional model follows four core principles. The first is mutual exclusivity: each dimension covers an independent facet of market quality. Transaction costs measure the execution friction of entering and exiting the market; price discovery assesses the efficiency with which price signals absorb information; resilience gauges the market's capacity to recover after a shock; fairness examines how equitably the rules treat different participants; and accessibility defines the breadth of the market's openness. This partition avoids overlap and ambiguity among dimensions. Mutual exclusivity matters because it ensures that each dimension has a clear definition and an independent measurement method, avoiding the double-counting or logical confusion that dimensional overlap would cause.
The second is completeness: these five dimensions form a comprehensive mapping of market microstructure and macro-level performance, and omitting any one of them would lead to a biased judgment of market quality. A market with very low transaction costs that is prone to collapse under stress, for example, has a true quality far below what its low-cost metric would imply. Likewise, a market with efficient price discovery that is entirely unfriendly to small traders has a deficiency in the accessibility dimension that offsets its price-discovery advantage.
The third is measurability: each dimension is decomposed into concrete operational indicators. Transaction costs, for example, include not only explicit fees and the bid-ask spread but also market impact and the funding rate, the implicit cost unique to perpetual futures; price discovery is quantified through information share and excess volatility; and resilience is measured through the spread-recovery half-life and the depth-recovery rate. Alexander et al. (2020), analyzing the Ethereum market, demonstrate that perpetual futures dominate price discovery—a leadership metric that is itself an important component of the price-discovery dimension [9].
The fourth is the presence of trade-offs: the five-dimensional model reveals systematic intrinsic conflicts among the dimensions of market quality. Lower transaction costs often come at the expense of market resilience (high leverage, for example, lowers the cost of capital tied up in margin but intensifies liquidation fragility); greater institutional fairness may require stricter identity verification, thereby reducing accessibility; and greater price-discovery efficiency may attract more informed traders, raising market makers' adverse-selection costs and ultimately pushing transaction costs up. The five-dimensional model shows that no market is perfect on all dimensions; the design of market institutions is essentially a matter of weighing trade-offs along the efficient frontier formed by these five dimensions. Recognizing these trade-offs helps make sense of the complexity of market design, because it explains why different markets make different choices and why the optimal market design depends on the specific use case and the needs of participants.
The five-dimensional model lays the theoretical foundation for the sections that follow. Sections 25.2 through 25.6 examine, one by one, each dimension's measurement methods, cross-platform comparisons, and evolutionary trends; Section 25.7 analyzes the trade-offs among the dimensions; and Sections 25.8 through 25.10 further explore the state dependence of market quality, cross-platform comparison, and long-term evolution, providing an empirical foundation for the discussion of regulatory economics in Chapter 26 and the thought experiments in Chapter 27.
The five-dimensional model is a diagnostic framework rather than a scoring system (its non-scoring stance is detailed in Section 25.1.1). Its diagnostic power lies in its ability to answer concrete questions such as "Why does a given exchange have very low transaction costs yet see its liquidity dry up in periods of stress?" or "Why does a given DEX offer greater fairness but relatively lower accessibility?" Such questions are valuable not only for academic research but also as practical guidance for participants' decisions and regulators' policymaking.
Finally, one intrinsic limitation of the five-dimensional model should be openly acknowledged: the framework embeds an assumption of rational participants—that market participants can correctly assess risk and make decisions in their own interest. In crypto perpetual futures markets, however, the combination of high leverage, around-the-clock trading, and extreme volatility may systematically exploit traders' behavioral biases, including overconfidence, loss aversion, and a propensity to gamble. The five-dimensional model evaluates the operating quality of market institutions, not the behavioral health of participants. This means that a market performing excellently on the five-dimensional metrics may still produce large-scale individual welfare losses because of participants' behavioral irrationality. The absence of this dimension is not a design oversight but reflects a fundamental distinction between assessing institutional quality and assessing participant welfare, the latter of which requires the independent analytical tools of behavioral finance.
25.2 Transaction costs
Transaction costs are the most traditional and most measurable dimension of market quality. In perpetual futures markets, the composition of transaction costs is more complex than in traditional financial markets. Beyond explicit fees and the implicit bid-ask spread, the funding rate constitutes a distinctive holding-period transaction cost. In a one-sided trending market, the cumulative burden of the funding rate can far exceed the sum of fees and spread, becoming the largest cost a trader faces. This section deconstructs the total transaction cost of perpetual futures across three layers: explicit fees, implicit friction, and the funding-rate burden.
25.2.1 Explicit costs
Fees are the explicit costs a trader must pay to enter and exit the market. Cryptocurrency exchanges generally adopt a two-tier maker-taker fee structure—based on whether an order provides or removes liquidity—combined with a tiered fee schedule keyed to trading volume and asset holdings. The core aim of this design is to incentivize market makers to supply liquidity while charging a premium to traders who actively consume it.
Among the leading centralized exchanges, fee schedules display a high degree of convergence alongside subtle differences. Take Binance's Ethereum perpetual futures: for ordinary users the maker fee is 0.02% and the taker fee is 0.05% [10]. By comparison, OKX charges ordinary users a 0.1% maker fee and a 0.2% taker fee for spot trading, which indicates that explicit transaction costs in the derivatives market are markedly lower than in the spot market [11]. A decentralized exchange such as Hyperliquid establishes a competitive advantage in explicit costs by waiving maker fees entirely and compressing the taker fee to 0.02%. Bybit, a newer centralized derivatives exchange, has a base fee structure close to Binance's but attracts high-frequency traders through a more aggressive rebate program.
There is a marked difference between nominal and effective fee rates. Through tiered fee schedules and market-maker rebate programs, exchanges compress the actual execution rate on the vast majority of trading volume to a small fraction of the nominal rate. Once a trader's monthly volume reaches a certain threshold, the maker fee can fall not merely to zero but into negative territory, becoming a rebate subsidy. When a Binance VIP 3 user reaches $100 million in monthly volume, the maker fee on perpetual futures can fall to 0.012%, roughly three-fifths (about 60%) of the ordinary-user rate [10]. An OKX VIP 9 user can obtain a 0% maker fee, achieving entirely free market making [11]. This structure means that retail traders are, in effect, subsidizing the liquidity-provision costs of high-frequency market makers. Assessing a market's explicit transaction costs through the official fee schedule alone is therefore incomplete; one must compute a weighted-average effective rate that reflects the structural distribution of market participants.
25.2.2 The bid-ask spread and market impact
Explicit fees make up only part of transaction costs; the bid-ask spread and market impact constitute a far larger implicit friction. The bid-ask spread is not a fixed value set by the exchange but compensation that market makers demand for bearing inventory risk, adverse-selection risk, and order-processing costs. The spread directly reflects the market's liquidity depth and degree of information asymmetry.
The quoted spread and the effective spread are two distinct dimensions for measuring this implicit cost. The quoted spread is the difference between the best bid and the best ask on the order book and represents the immediate execution cost of a small market order. The effective spread accounts for how an order actually fills across multiple price levels and thus more truthfully reflects the real cost borne by large traders [12]. In markets dominated by traditional market makers, the effective spread is typically about half the quoted spread, reflecting limit-order price improvement and participants' adjustments in anticipation of price movements [12]. In the electronic limit order books of crypto perpetual futures, however, the ratio between the effective and quoted spreads varies with the market state, owing to the high proportion of aggressive market orders and market makers' rapid quote withdrawals during volatile periods; under stress, the effective spread may approach or even exceed the quoted spread [7]. In the highly liquid Bitcoin and Ethereum perpetual futures markets, the quoted spread is typically held within an extremely narrow range of 0.5 to 2 basis points [7][13]. For less liquid altcoin contracts, however, the spread can widen to more than 50 basis points, forming a significant implicit barrier to trading.
The market impact generated by large trades is another important component of implicit costs. When the size of a market order exceeds the depth at the best bid and ask, the order eats through successively worse price levels along the order book, so that the actual average execution price departs from the initial quote. This price impact can be decomposed into a permanent information cost that cannot be eliminated and a temporary liquidity cost that can be reduced by improving liquidity. In calm markets, a $1 million Bitcoin market order may generate only about 5 basis points of impact cost [7]; but during periods of extreme volatility or liquidity exhaustion, an order of the same size may trigger more than 100 basis points of impact, giving implicit transaction costs a nonlinear amplification (the specific basis-point figures above are illustrative estimates based on the methodology of [7]). This nonlinearity carries important implications for risk management, because it means that during market stress the real cost a trader faces can be more than 10 times the normal level.
25.2.3 The holding cost of the funding rate
The funding rate is a transaction-cost dimension unique to perpetual futures markets and constitutes the holding cost of a position. In traditional futures markets, the cost of holding a position is chiefly a deterministic interest charge; in perpetual futures, by contrast, longs and shorts must periodically exchange the funding rate in order to keep the contract price anchored to the spot price. This rate is a random variable that fluctuates in real time with market supply and demand, and it can spike to extreme levels under extreme conditions.
In economic terms, the funding rate is the mechanism by which the market prices leverage imbalance. When market sentiment is extremely optimistic and long leverage demand far outstrips short demand, the perpetual futures price develops a positive premium, driving the funding rate positive. Longs must then pay shorts. At the peak of the 2021 bull market, the annualized funding rate on Bitcoin perpetual futures held at a high of 30% to 80% for several weeks at a stretch. This means that even if the underlying asset's price merely churns sideways, long holders suffer significant capital erosion from the heavy funding burden—and the funding rate has been confirmed by empirical research as a risk factor independent of price direction [14].
The way the funding rate is calculated varies across exchanges and continues to evolve. BitMEX first established the model of a fixed base rate plus a premium index, with settlement every 8 hours as the early industry standard. Leading exchanges such as Binance and OKX built on this with more flexible floating-rate models that adjust dynamically to the real-time deviation between the contract price and the spot price. As of early 2025, these platforms had introduced 4-hour or even higher-frequency settlement cycles for some major contracts, while a new generation of platforms such as Hyperliquid was exploring hourly settlement. Higher-frequency settlement reduces the absolute magnitude of any single funding payment but also increases microstructure noise around the settlement points, requiring market makers to rehedge their funding-rate exposure before and after each settlement window.
In bull-market cycles, the funding rate exhibits a marked positive skew, with longs systematically paying this holding tax. Yet this positive skew is not an inherent property of perpetual futures: during the deep bear market of 2022–2023, the funding rate was persistently negative, and shorts instead became the net payers. Over data spanning a full bull-bear cycle, the net positive skew of the funding rate is far smaller than the value observed during a pure bull market, but it remains positive, reflecting the structural feature that long leverage demand dominates over the long run in crypto markets. This is an additional implicit cost of taking a long exposure through perpetual futures rather than spot. For high-frequency traders, the effect of the funding rate is small; but for swing traders or hedging institutions holding for more than a few days, the cumulative funding outlay can far exceed the combined fees and spread of entering and exiting. A trader holding a $1 million Bitcoin long position for 30 days, in an environment where the funding rate is annualized at 30%, would pay about $25,000 in funding costs, equivalent to a 2.5% erosion of capital. This cost level is enough to meaningfully eat into a trading strategy's return. Annualizing the expected funding rate and weighting it by the holding period is therefore a necessary step in accurately assessing the true transaction cost of perpetual futures.
25.2.4 Measuring total transaction cost
A comprehensive assessment of market quality requires integrating explicit fees, implicit friction, and the funding-rate burden into a single total-transaction-cost metric. Total transaction cost equals the sum of fees, half the effective spread, the market-impact cost, and the expected funding-rate holding cost. This composite measure reveals the true cost constraints faced by different trading strategies.
A concrete worked example helps clarify this framework. Suppose a trader opens a $1 million Bitcoin long position on Binance as a taker, holds it for 7 days, and executes both the opening and closing trades with market orders. The total transaction cost should include all the friction of the round trip: the entry taker fee, 0.05% × $1 million = $500; the entry effective-spread cost, assumed at 5 basis points, or $500; the entry market-impact cost, assumed at 10 basis points in a calm market, or $1,000; the 7-day funding cost, assumed at an annualized 20%, or 20% × 7/365 × $1 million ≈ $3,800; the exit taker fee, likewise $500; the exit effective-spread cost, $500; and the exit market-impact cost, $1,000. The total cost of a full round trip is therefore about $7,800, equivalent to a capital cost of 0.78%. This cost level may be acceptable for strategies with short holding periods but constitutes a significant drag on returns for long-term holders. If the trader closes with a limit order rather than a market order, the spread and impact costs on the exit side can be avoided, lowering the total cost to about $6,300 (0.63%)—though at the expense of immediacy in closing the position.
Investors with different trading frequencies and holding periods have sharply different sensitivities to total transaction cost. For high-frequency market makers, fees and the spread are the core consideration, while the funding rate is nearly negligible because holding times are so short. For lower-frequency trend followers, the funding rate is the largest cost item, especially since building a position with the trend often requires paying a steep funding premium. Total transaction cost is also strongly state-dependent. In calm markets, abundant liquidity and low-volatility funding keep total cost at a low level; during market stress, the spread widens sharply, market impact amplifies nonlinearly, and the funding rate produces extreme pulses, so total transaction cost can spike dozens of times over within a short span. More important still, the total-cost formula above treats each cost item as an independent variable to be summed, whereas in real markets these items interact significantly. When the funding rate spikes, market makers widen the bid-ask spread because they bear greater inventory risk and funding-rate exposure; that is, an extreme funding rate indirectly pushes up the other implicit cost items. This interaction means that the true total transaction cost during stress can be higher than the simple sum of the individual costs.
Comparing total transaction cost across assets further confirms the stratification of market quality. Major assets such as Bitcoin and Ethereum enjoy the narrowest spreads, the deepest liquidity, and relatively stable funding rates, and their total transaction cost is the lowest. As market capitalization and liquidity decline, the total transaction cost of altcoin perpetual futures rises along a steep gradient. This cost differential reflects not only how market makers price the risk of different assets differently but also a friction barrier that impedes the efficient allocation of capital across long-tail assets.
25.2.5 Cross-platform comparison and evolution
Applying the total-transaction-cost framework to individual platforms, Figure 25-2 decomposes the total transaction cost of Bitcoin perpetual futures across exchanges under typical market conditions.
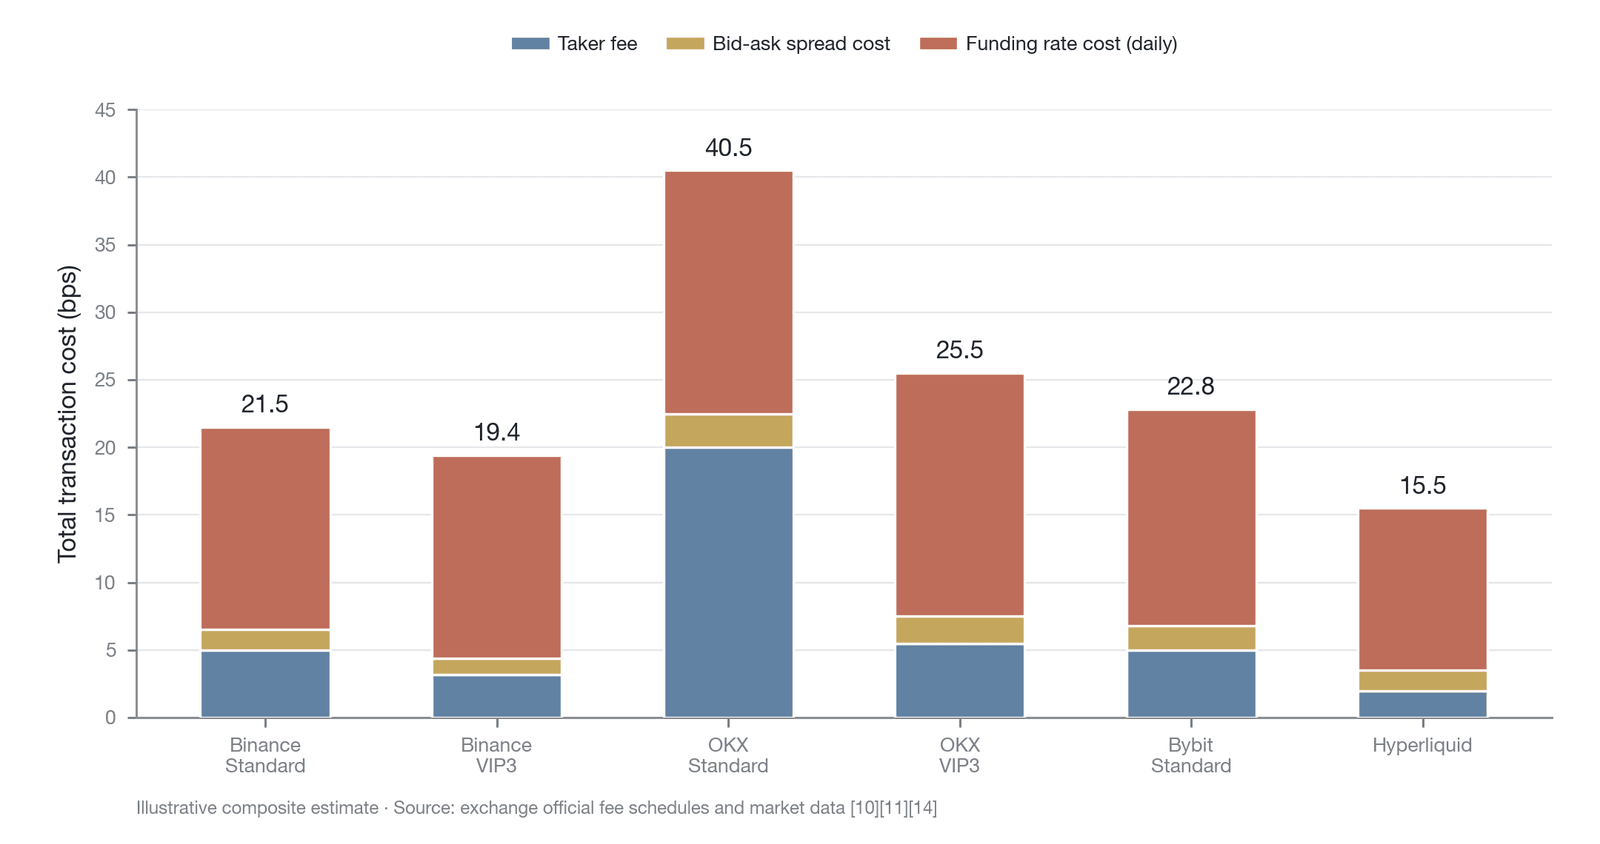
Figure 25-2. Comparison of total transaction cost for Bitcoin perpetual futures across leading exchanges (illustrative composite estimate, not direct measurement; the OKX VIP 3 and Bybit ordinary tiers are representative extensions not discussed in the main text, while the remaining tiers appear in the text; data source: exchanges' official fee schedules and market data [10][11][14])
In cross-platform comparison, ordinary users of centralized exchanges face the highest explicit fee burden, but the exchanges' deep order books effectively lower market-impact costs. The total transaction cost for a Binance ordinary user is about 21.5 basis points, of which the taker fee accounts for 5 basis points, the bid-ask spread cost for 1.5 basis points, and the annualized funding cost for 15 basis points. As the fee tier rises, total transaction cost falls markedly: a Binance VIP 3 user's total cost drops to 19.4 basis points, reflecting the platform's tilt toward high-frequency, large-capital users. Because its spot fees are higher, an OKX ordinary user's total transaction cost reaches 40.5 basis points, roughly twice that of a Binance ordinary user. Through a zero-fee strategy and an innovative liquidity-pool mechanism, the decentralized derivatives platform Hyperliquid compresses total transaction cost to 15.5 basis points, exerting significant competitive pressure on total cost and forcing traditional centralized platforms to reexamine their fee models.
Over the past 10 years, the transaction cost of perpetual futures markets has fallen structurally. From the tens-of-basis-points wide spreads when BitMEX launched the first Bitcoin perpetual futures in 2016, to today's extremely narrow spreads on major assets that approach those of traditional financial markets, this progress is attributable chiefly to three drivers. The first is the full-scale entry of high-frequency market makers and the spread of algorithmic trading, which sharply compressed implicit friction and reduced spreads on major assets from more than 10 basis points to less than 1. The second is fierce competition among exchanges over liquidity and market share, which drove explicit fees steadily downward, from an early 0.1% to today's 0.02%. The third is the maturation of liquidation engines and risk-management mechanisms, which lowered the system's tail-risk premium and markedly reduced funding-rate volatility. Yet the funding rate, as the core mechanism for balancing longs and shorts, still imposes a holding cost that remains a distinctive property setting perpetual futures apart from other financial instruments—and a computational hurdle that traders must clear when assessing the cost of long-term positions. The existence of this cost dimension gives the total-transaction-cost structure of perpetual futures markets a fundamental difference from that of traditional futures markets and is central to understanding perpetual futures market quality.
25.3 Price discovery
Price-discovery quality measures the efficiency of the market as an information processor—that is, how quickly and accurately prices reflect new information once it arrives. This section treats informational efficiency as a key dimension of market quality, examines how it interacts with the other dimensions, and constructs a multilayered framework for evaluating price-discovery quality. Perpetual futures have become the dominant venue for crypto-asset price discovery, but this leadership is conditional and varies significantly with the type of information shock, the market state, and the asset class.
25.3.1 Measurement methods
When the same asset trades across multiple markets, determining which market leads the price-discovery process is a central question in assessing market quality. The academic literature generally uses two classic econometric methods to quantify the price-discovery contribution of different markets. The first, proposed by Hasbrouck (1995), centers on the concept of the information share. This method assumes an implicit, unobservable common efficient price and defines a given market's information share as its proportional contribution to innovations in that common efficient price [15]. Within this framework, a market that absorbs and reflects new information more quickly has a higher information share, indicating that it dominates price discovery.
The second method derives from Gonzalo and Granger (1995), who proposed a technique for decomposing a price series into permanent and transitory components. This permanent-transitory decomposition is widely used to estimate the price-discovery contributions of multiple cointegrated markets, particularly in analyzing price leadership between futures and spot markets [16]. Unlike the information share, which focuses on the contribution to variance, the Gonzalo-Granger method focuses on measuring the speed at which each market's price adjusts to the common long-term trend. When two markets depart from equilibrium, the market that adjusts more slowly is regarded as the price leader, while the market that adjusts more quickly is the follower.
Applying these traditional methods directly to perpetual futures markets, however, poses particular challenges. The fundamental difference between perpetual futures and traditional futures is their lack of an expiry date, which requires the funding-rate mechanism to anchor them to the spot price [17]. The periodic payment or receipt of the funding rate introduces a distinctive mechanical friction that makes the cointegration relationship between the perpetual futures price and the spot price more complex than in traditional markets. Moreover, the around-the-clock trading and very high microstructure noise of crypto markets require the use of high-frequency data and finer adjustments to model specification when applying these econometric models, so as to accurately separate genuine information shocks from short-term liquidity disturbances. Notably, the Hasbrouck information share and the Gonzalo-Granger component share can, in practice, produce contradictory rankings of market leadership. This contradiction stems from the two methods' different treatments of microstructure noise: the information share's variance decomposition of price innovations depends on the ordering of the variables, whereas the component share is highly sensitive to the estimation of short-term noise components. Because microstructure noise in perpetual futures markets is far higher than in traditional markets, the choice of method has an especially pronounced effect on the conclusions. The empirical discussion in the remainder of this chapter therefore draws on the results of both methods to strengthen the robustness of its conclusions.
25.3.2 The leadership relationship between perpetual futures and spot
A large body of empirical evidence shows that perpetual futures lead price discovery in the spot market during most periods. Alexander et al. (2020), in their study of the Ethereum market, find that the Ethereum perpetual futures on BitMEX are absolutely dominant across all price-discovery metrics, with an information share far higher than that of the spot exchanges. The study further notes that the introduction of perpetual futures actually improved the pricing efficiency of the spot exchanges [9]. Robertson (2025), analyzing the latest high-frequency data for the Bitcoin market, reaches a similar conclusion, confirming that the futures market holds a systematic lead over the spot market in absorbing information [18]. This leadership stems from the built-in leverage, lower transaction costs, and deeper liquidity that perpetual futures offer—features that make them the preferred venue for informed traders to express their views. The full picture of price discovery, however, should not be confined to a binary comparison between offshore perpetual futures and the spot market. Since the approval of Bitcoin exchange-traded funds (ETFs) in 2024, the open interest of CME Bitcoin futures has grown significantly, and institutional participants increasingly express their pricing views through the CME during U.S. trading hours. In certain periods, the price-discovery contribution of the regulated futures market may exceed that of offshore perpetual futures, forming a tripartite pricing structure of offshore perpetuals, spot, and regulated futures.
Although perpetual futures hold the overall lead, this leadership is markedly conditional. The relative roles of the markets shift depending on the type of information shock. For macroeconomic data releases or market-wide liquidity shocks, perpetual futures typically react fastest, thanks to their high liquidity and leverage. For information specific to a single asset, however—such as a protocol upgrade, a security vulnerability, or a large spot transfer—the spot market sometimes briefly reclaims the lead in price discovery. This division of labor in information processing reflects differences in the composition of participants and their trading motives across markets.
Sharp shifts in the market state likewise reshape the price-discovery hierarchy. During the prolonged 2021 bull market, the leadership of perpetual futures reached its peak: persistently positive funding rates and intense speculative sentiment made the derivatives market the absolute pricing engine. After the series of systemic crises and the deep bear market of 2022, however, the information share of perpetual futures declined somewhat as extensive leverage was liquidated and market-maker capital withdrew. During phases of extreme panic selling, the actual selling pressure of the spot market often becomes the decisive force driving prices, and the leadership of perpetual futures appears more fragile in these stress tests. This state dependence shows that the price leadership of perpetual futures is not a static constant but a variable that evolves dynamically with the market environment.
25.3.3 Cross-asset differences
The price-discovery efficiency of crypto-asset markets varies enormously across assets. Major assets and altcoins exhibit sharply different information-processing capacities. As the assets with the deepest liquidity and the largest market capitalizations, Bitcoin and Ethereum have perpetual futures markets that display high microstructure efficiency. In these two markets, prices integrate new information rapidly, the information share is stable at a high level, and the bid-ask spread is extremely narrow. This efficient price discovery benefits from a mature market-maker ecosystem, broad institutional participation, and highly developed cross-market arbitrage mechanisms.
By contrast, the perpetual futures markets of most altcoins are markedly less efficient. Liquidity in these assets is typically thin, and order-book depth is insufficient to absorb medium-sized trades without generating significant price impact. In such an environment, the price-discovery process is often accompanied by violent volatility and abundant noise. For lack of sufficient arbitrage capital to maintain cross-market price consistency, the prices of altcoin perpetual futures frequently deviate from their spot underlyings for extended periods, resulting in low informational efficiency. This positive-feedback loop between liquidity and price-discovery efficiency allows highly liquid assets to keep improving in efficiency while low-liquidity assets struggle to escape their inefficient state.
The distribution of price-discovery shares across exchanges further reveals the complexity of market structure. The fragmentation of liquidity across platforms disperses pricing power. Leading centralized exchanges, with their vast user bases and deep market-maker resources, typically hold the largest information shares. As decentralized derivatives exchanges have grown, however, this pattern is shifting subtly. Through innovative liquidity-supply mechanisms and permissionless access, decentralized platforms have begun to capture a sizable share of price discovery for particular assets or during particular periods. This multi-centered price-discovery process increases arbitrage opportunities but also introduces cross-platform transmission latency and friction, posing new challenges to the pricing efficiency of the market as a whole.
25.3.4 Excess volatility
In assessing price-discovery quality, relying on the information share and similar metrics alone is often insufficient to capture the full complexity of market microstructure. Excess volatility offers a composite inverse indicator of considerable analytical value. Excess volatility is defined as the difference between a market's actual total volatility and the volatility it ought to exhibit if driven by fundamental information. Operationally, this warranted volatility can be estimated in several ways: one is to use the Hasbrouck information share to decompose realized volatility into information-driven and noise components; another is to use the degree of departure from a random walk, measured by a variance ratio test over a rolling window, as a proxy [15][18]. High excess volatility means that price movements contain a great deal of non-informational noise, which directly reflects a decline in price-discovery quality. Such noise can mask genuine supply-and-demand signals, raising traders' execution costs and adverse-selection risk.
Several distinctive sources of excess volatility exist in perpetual futures markets. The first is volatility amplification triggered by the liquidation mechanism. When rapid price movements trigger large-scale forced liquidation, the market orders that the system automatically dumps cause a severe chain of price impacts on an already thin order book, producing violent movements that far exceed fundamental value. The second is institutional noise from funding-rate pulses. In a one-sided market, an extreme funding rate forces arbitrageurs to adjust positions frequently, and this non-informational order flow likewise injects additional volatility. In addition, the defensive quote adjustments that market makers make when facing inventory risk increase the random-walk component of prices at the micro level.
Figure 25-3 shows the relationship between excess volatility and the price-discovery efficiency index for different crypto assets across multiple periods.
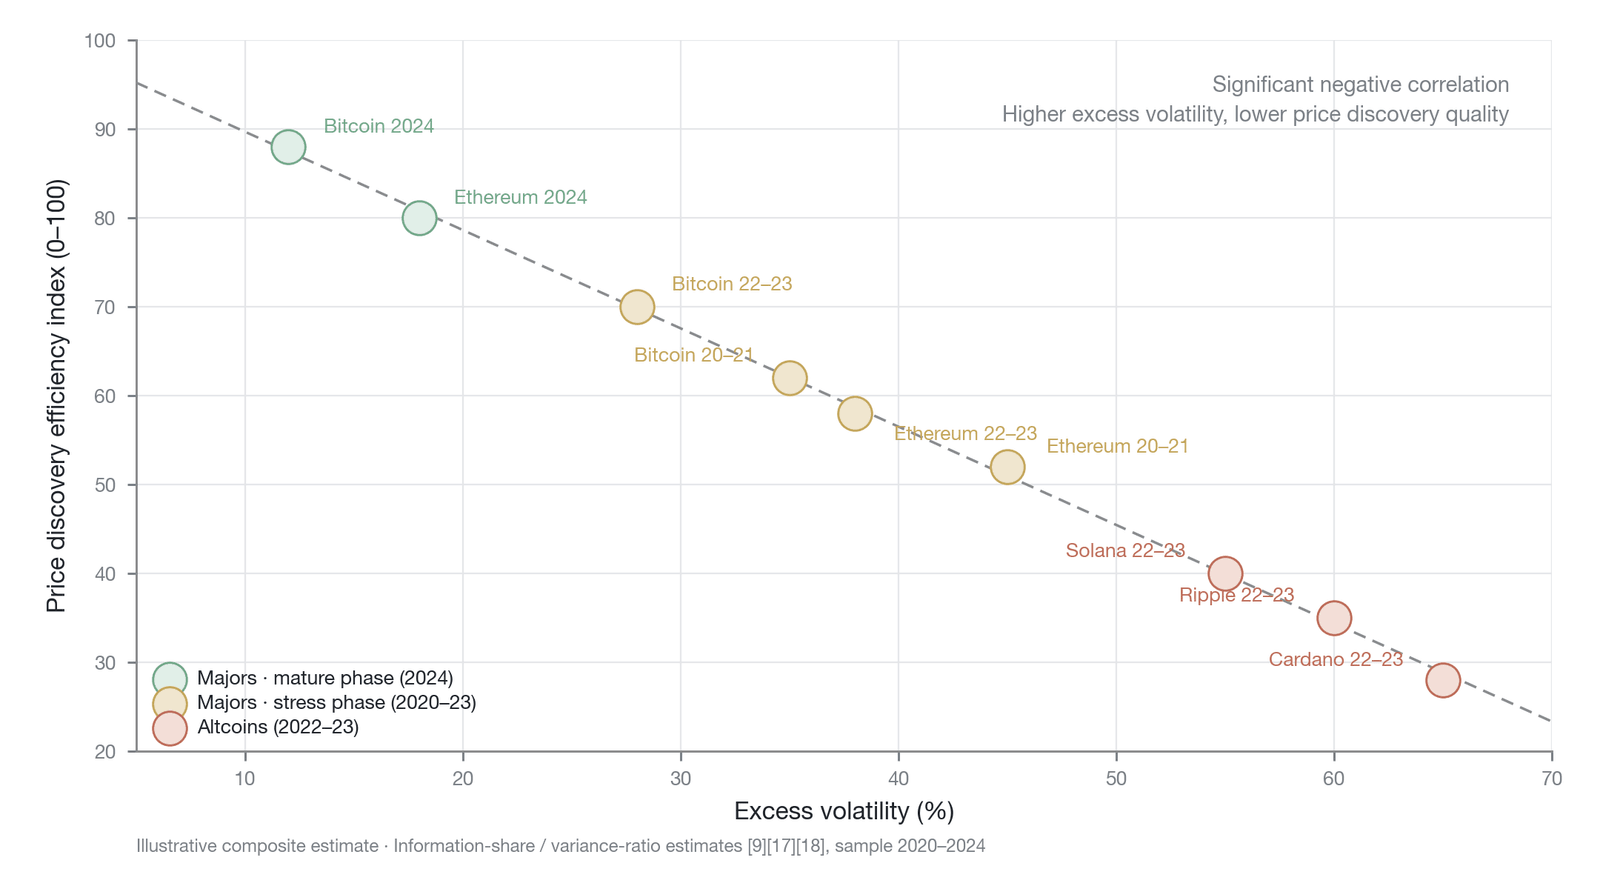
Figure 25-3. The inverse relationship between excess volatility and price-discovery efficiency (illustrative composite estimate, not direct measurement; the two are significantly negatively correlated and are presented qualitatively only, with no precise correlation coefficient reported so as to avoid false precision; based on the information-share and variance-ratio estimates of Alexander et al. [9], He et al. [17], and Robertson [18], with excess volatility defined as the difference between realized volatility and the fundamental volatility weighted by the Hasbrouck information share, sample period 2020–2024)
The scatter plot clearly reveals the significant negative correlation between the two. In more mature market phases, such as 2024, Bitcoin and Ethereum exhibit low excess volatility and high price-discovery efficiency. During the high-stress period of 2022–2023, by contrast, the excess volatility of even major assets rose significantly, accompanied by a decline in efficiency. More strikingly, altcoins such as Solana, Ripple, and Cardano sit systematically in the lower-right region of the chart—the zone of high excess volatility and low price-discovery efficiency. This empirical evidence strongly supports treating excess volatility as an important dimension for gauging perpetual futures market quality and informational efficiency, providing an intuitive, quantifiable yardstick for comparisons across assets and across cycles.
25.4 Resilience
Resilience is an underrated yet critical dimension of perpetual futures market quality. In day-to-day trading, traders usually attend only to the narrowness of the spread or the depth of the order book, overlooking resilience altogether. Resilience becomes visible only in a crisis, yet the loss from a single failure of resilience can exceed the returns accumulated over years of calm. In a market like crypto—highly leveraged, running around the clock, and lacking a central bank as lender of last resort—understanding and measuring the market's capacity for self-repair is key to assessing systemic risk. This section analyzes resilience across three layers—liquidity resilience, depth resilience, and system resilience—moving from the micro level of spread recovery and order-book reconstruction, to differences in the design of liquidation mechanisms and margin systems, to the resilience function of the funding rate under extreme conditions, and finally to the macro-level systemic risk of cross-exchange contagion.
25.4.1 Definition and measurement framework
In financial microstructure theory, market liquidity is typically decomposed into three interrelated dimensions. Under the classic taxonomy proposed by Kyle, these are tightness, depth, and resilience [19]. Tightness measures the direct cost of trading, usually expressed as the bid-ask spread; depth reflects the market's ability to absorb large orders without causing large price movements; and resilience is defined as the speed at which prices recover from random, uninformative shocks [19]. In perpetual futures markets, resilience is not merely the recovery of price but the self-repair of the entire market structure after extreme stress.
Resilience differs fundamentally from the other dimensions of liquidity. Liquidity is static: it describes how many trading opportunities the market can offer at a given moment. Resilience is dynamic: it concerns the market's ability to replenish liquidity once it has been consumed. A market may exhibit excellent tightness and depth in calm periods yet dry up in an instant when shocked, for lack of resilience. This dynamic property matters especially in crypto markets, because high leverage and programmatic trading tend to amplify local shocks into systemic events.
A comprehensive assessment of perpetual futures market resilience requires a multilayered measurement framework. The first layer is liquidity resilience, concerned mainly with the speed at which the bid-ask spread returns to normal after widening. The second is depth resilience, which measures the time it takes for limit orders to refill the gaps after a large market order has punched through the order book. The third is system resilience, which assesses the ability of an entire exchange to keep functioning normally and to prevent risk from spreading to other markets when confronted with a large-scale liquidation cascade. These three layers are interwoven and together determine a market's survival capacity under extreme conditions.
In analyzing resilience, we must distinguish two conceptually distinct layers: price resilience and system resilience. Price resilience concerns the speed at which an asset's price reverts to fundamentals after a short-term shock, whereas system resilience measures the market's ability to keep its core functions—trade execution, clearing and settlement, and price discovery—uninterrupted when it suffers a severe external shock or internal liquidity exhaustion. For perpetual futures markets, whose underlying assets are themselves extremely volatile, pursuing absolute price stability is neither realistic nor necessary; the core of a resilience assessment should therefore focus on system-level robustness: whether the market can keep operating under stress, not whether the price stays unchanged.
Perpetual futures markets face particular structural challenges in maintaining system resilience. Perpetual futures have no expiry date, which means risk exposure can accumulate indefinitely and the market cannot force a periodic release of accumulated pressure through delivery settlement. These markets generally offer very high leverage multiples, so that small price movements can trigger forced liquidation and, in turn, set off a chain reaction. Empirical observation indicates that when the market's aggregate leverage ratio—defined as the ratio of the notional value of network-wide open interest to total margin deposits—climbs to a high level, systemic fragility rises significantly, and at that point any small negative shock can trigger an uncontainable liquidation cascade [20]. The specific leverage threshold that triggers systemic fragility varies with the measurement approach and sample (illustratively, somewhere around 25%), and there is no single, precise critical value. Actual fragility depends not only on the absolute level of leverage but also on its distribution: high-leverage positions concentrated among a few large holders are far more dangerous than low-leverage positions dispersed across many retail traders, because liquidating the former releases far greater instantaneous selling pressure.
25.4.2 The spread-recovery half-life
The most intuitive expression of liquidity resilience is the spread-recovery half-life. When the market is hit by a large trade or an external news shock, market makers typically withdraw their limit orders quickly to avoid adverse-selection risk, causing the bid-ask spread to widen sharply. The spread-recovery half-life is the time it takes for the spread to fall halfway from its post-shock peak back to its initial normal level [21]. This indicator directly reflects the confidence and speed with which liquidity providers reassess risk and return to the market.
In traditional financial markets, electronic limit order books usually recover quite quickly. Research shows that in mature markets such as the London Stock Exchange, the order book's post-trade recovery half-life is about 20 seconds [21]. In crypto perpetual futures markets, however, the spread-recovery process is often more complex, owing to the widespread use of leverage and the high degree of market fragmentation: under normal conditions the recovery half-life of top exchanges can match or even surpass that of traditional markets, but during periods of stress it may be significantly delayed. Figure 25-4 compares the spread-recovery performance of several major exchanges under both normal and stressed conditions.
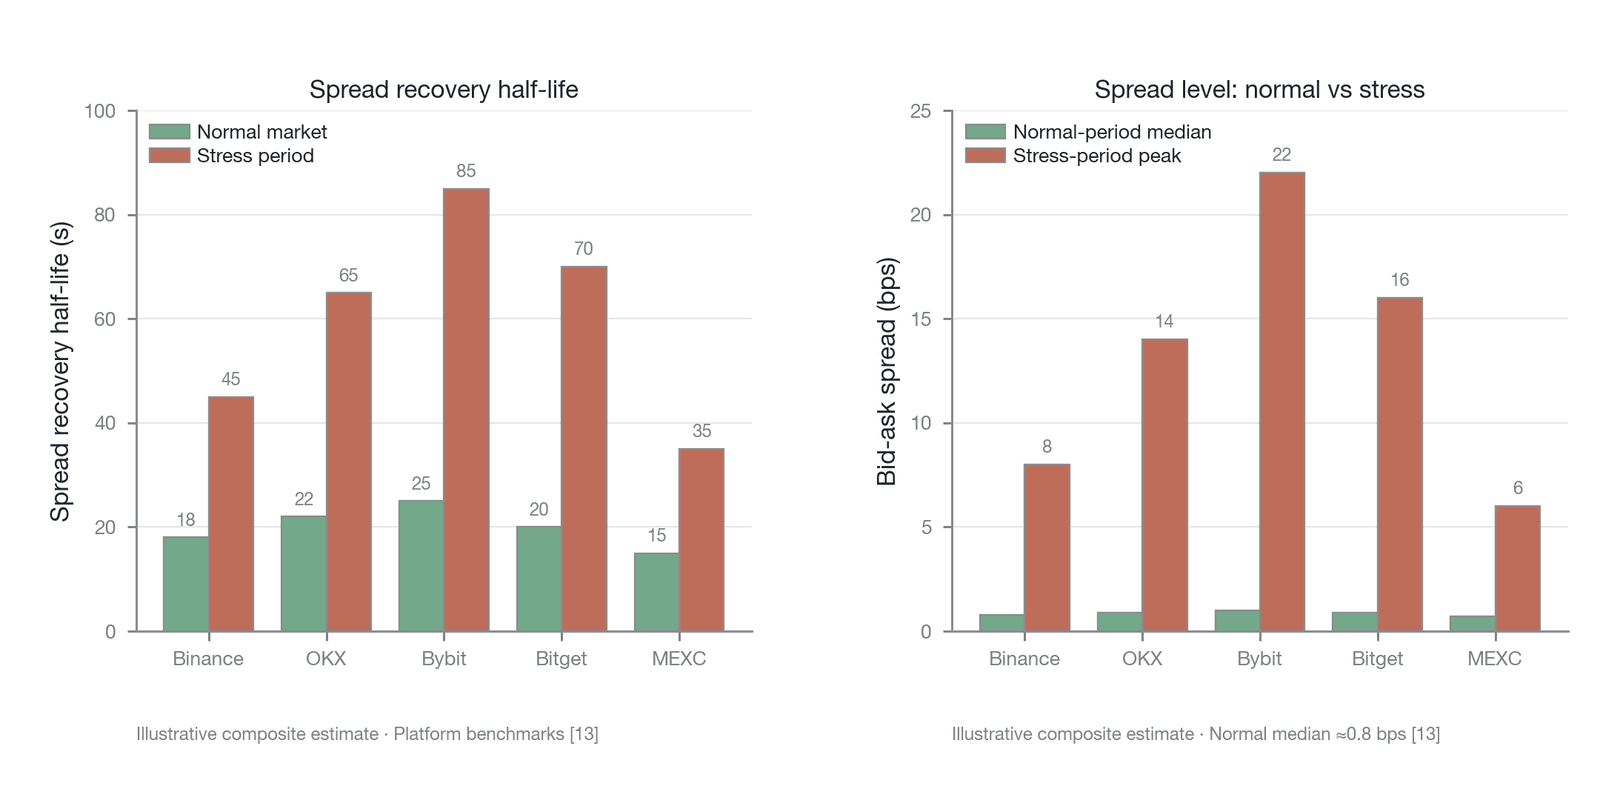
Figure 25-4. Cross-platform comparison of liquidity-resilience indicators (illustrative composite estimate, not direct measurement): the left panel shows the spread-recovery half-life (normal market versus periods of stress), and the right panel shows the median spread in normal periods (≈0.8 basis points) versus the peak spread during stress; recovery diverges markedly under stress and the peak spread widens substantially (data source: commercial-platform review [13] and exchanges' market data)
The cross-platform comparison in the figure clearly shows the differences in resilience across exchanges. Under normal market conditions, the Bitcoin perpetual futures spread on major exchanges is extremely small, with a median typically held at about 0.008% (about 0.8 basis points) [13]. During periods of stress, however, recovery speeds diverge markedly across platforms. Some can restore the spread to normal within 30 to 40 seconds, while others may need more than 1 minute [13]. This difference arises not only from the composition of each platform's market-maker community but, more fundamentally, from the efficiency of each exchange's liquidation engine and the design of its risk-management mechanisms. Platforms with a shorter recovery half-life generally offer traders a more reliable execution environment and thus attract greater liquidity inflows during a crisis.
25.4.3 The speed of order-book reconstruction
Depth resilience concerns the physical process by which the order book rebuilds after a shock. When a large market order sweeps through the order book and consumes liquidity across multiple price levels, it leaves a hole in the market. Depth resilience measures the speed at which new limit orders fill these holes and restore the original market depth. This process depends heavily on the behavioral logic of high-frequency traders and market makers.
Figure 25-10 presents the liquidity baseline before a shock: the order-book depth within a ±0.1% price band around the best price under normal market conditions on major exchanges, with most leading platforms in the range of $40 million to $50 million and a few notably higher. It is precisely this baseline that is punched through in an instant under a violent shock, and the speed of its reconstruction determines a platform's depth resilience.
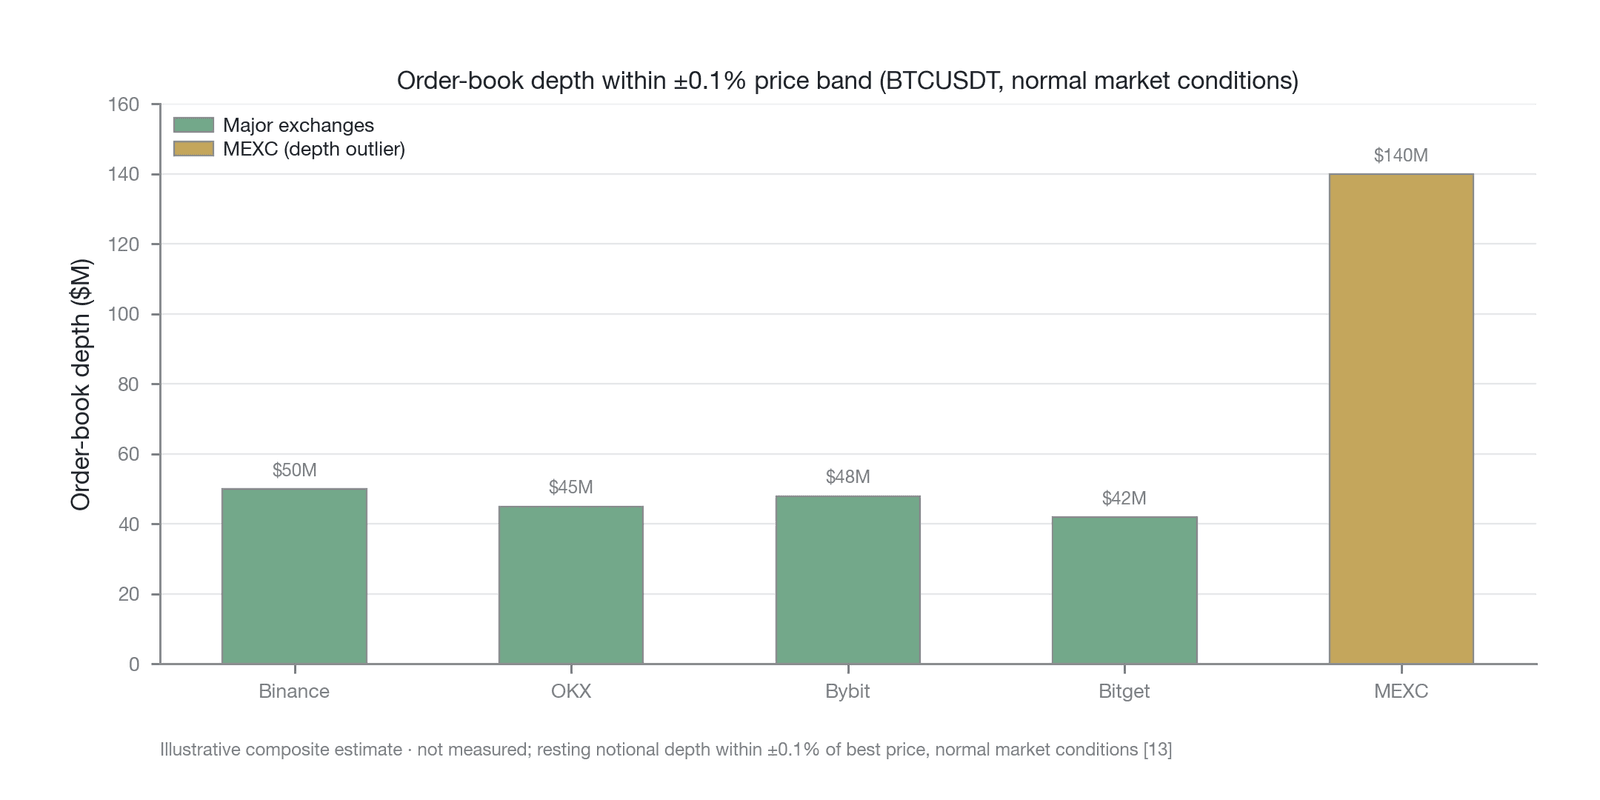
Figure 25-10. Order-book depth of Bitcoin perpetual futures on major exchanges (illustrative composite estimate, not direct measurement; notional resting depth within a ±0.1% price band around the best price, normal market conditions; data source: composite estimate from exchanges' market data [13])
After a shock, market makers face a dilemma. On one hand, the widened spread offers higher market-making profits; on the other, violent price swings entail enormous inventory risk. In crypto markets, market makers often adopt a retreat-observe-return strategy. The market crash of March 2020 offers an extreme case of depth-resilience failure. At the time, the Bitcoin price plunged in a short span, triggering a large-scale wave of liquidations [22]. Faced with enormous one-sided selling pressure and a cross-platform spread of more than $500, many market makers simply shut down their trading algorithms and stopped providing liquidity [22].
During that crisis, the order-book depth of one leading derivatives exchange dried up at one point to only about $20 million in buy orders, while the long positions awaiting liquidation reached as much as $200 million [22]. Had all these liquidation orders been dumped at market, the price of Bitcoin might have been driven down to near zero. This total collapse of depth resilience shows that when a market shock exceeds market makers' risk tolerance, the order book's reconstruction mechanism fails entirely. Only after the price stabilized at a new equilibrium, or the exchange intervened (for example, by halting trading), did market makers begin submitting orders again and the order-book depth slowly recover.
25.4.4 The capacity to withstand liquidation cascades
System resilience is the dimension of resilience unique to—and most critical for—perpetual futures markets. It measures the market's survival capacity when confronted with a liquidation cascade. A liquidation cascade is a vicious cycle in which a price decline triggers the liquidation of long positions, the market sell orders generated by those liquidations push the price down further, and the lower price triggers still more liquidations. In crypto markets, which lack circuit breakers and price limits, liquidation cascades are the primary threat leading to systemic collapse.
To withstand liquidation cascades, perpetual futures markets have developed a distinctive set of buffering mechanisms, of which the insurance fund is the most central. When a liquidated position fills below its bankruptcy price, the resulting shortfall is covered by the insurance fund, protecting the profits of winning traders from being clawed back. The size and burn rate of the insurance fund are important indicators of system resilience. The insurance funds of major exchanges are not a single pool but are established separately by currency and contract type: BTC perpetual futures, ETH perpetual futures, and the various altcoin perpetual futures each have their own independent insurance fund. While this segmented structure provides risk isolation, it also means that the insurance-fund protection for long-tail asset contracts is far weaker than for major assets: in extreme conditions, the insurance fund for a given altcoin contract may already be exhausted and have triggered auto-deleveraging (ADL) while the fund for the BTC contract remains ample. If a single market shock consumes most or all of the insurance fund, the market's system resilience is near its limit. In the extreme, if the insurance fund is exhausted, the exchange must activate the auto-deleveraging mechanism to forcibly close profitable positions, which severely damages the market's credibility and liquidity.
The design of the liquidation mechanism has a profound effect on system resilience. Some early exchanges, for example, accepted only Bitcoin as margin, which meant that when the price fell, long traders faced not only losses on their positions but also a shrinking value of their margin—a nonlinear leverage effect that significantly increased the risk of a liquidation cascade [22]. As the market has evolved, modern exchanges have generally introduced multi-currency blended margin and tiered liquidation mechanisms, which effectively slow the instantaneous impact of liquidations on the market and thereby improve the system's overall resilience.
The architectural choice of the margin system has a decisive effect on the capacity to withstand liquidation cascades. The isolated-margin model isolates the risk of a specific position by allocating independent margin to each contract; its advantage is that it caps the loss from any single bad decision. Isolated margin, however, leaves each position with very little buffer, making it more prone to frequent micro-liquidations during violent volatility and thereby increasing trading friction and short-term volatility at the micro level [23]. The cross-margin model lets a trader use all available balance in the account as shared collateral, which significantly lowers the probability of liquidation under normal market conditions and allows the portfolio to better absorb local shocks [23]. But cross margin proves extremely fragile in extreme tail events: when the market suffers a broad sell-off, the synchronized decline of correlated assets can rapidly exhaust the entire account's margin, causing all positions to be force-liquidated at once and instantly releasing enormous selling pressure into the market. At the system level, when most traders use cross margin, this individually reasonable risk-control choice produces a fallacy of composition in the aggregate: the crash of a single asset liquidates not only that asset's position but also, by extension, all other positions in the same account, spreading a shock originally confined to one market into cross-asset systemic selling pressure.
Tiered liquidation mechanisms and the insurance fund form a second line of defense that buffers the shock of liquidations. Modern liquidation engines have evolved from the early days of simple market-order closeouts into complex multi-stage systems: the first stage attempts to liquidate with limit orders, placing the liquidated position into the order book to await matching; the second stage, when the limit orders fail to fill, initiates counterparty matching to find market makers willing to take over the position at a discount; and only the final stage executes a market liquidation. Some exchanges have also introduced a liquidation-delegation mechanism that allows third-party market makers to proactively take over liquidated positions at a price better than the bankruptcy price, thereby reducing the impact on the market. Tiered liquidation refines this further by reducing positions gradually in batches according to market depth and price slippage, smoothing the selling pressure to some degree. The insurance fund serves as a pool for absorbing shortfall losses, using the penalties collected in routine liquidations to cover systemic losses in extreme situations; but its size is typically only a small fraction of total open interest [23].
25.4.5 The resilience function of the funding rate
The funding rate is the most central innovation of perpetual futures. It was designed as a price-anchoring mechanism that, through periodic funding exchanges between longs and shorts, forces the perpetual futures price back toward the spot index price. Under normal market conditions, the funding rate serves as an effective corrective mechanism: when the contract price is above spot, longs pay shorts, dampening excessively bullish sentiment, and vice versa. This anchoring mechanism continuously draws arbitrage capital into the market, sustaining pricing efficiency and forming an important microfoundation of market resilience.
In extreme conditions, however, the funding-rate mechanism may not only fail to perform its resilience function but also exhibit strong procyclicality that amplifies market volatility. When the market swings violently in one direction, speculative order flow tends to overwhelm the capacity of arbitrage capital to absorb it [24]. The funding rate then spikes to extreme levels. Traders holding counter-trend positions must bear not only large paper losses but also steep funding payments. This dual negative effect accelerates the depletion of margin, forcing traders to close early or be force-liquidated, which in turn drives the price still further from fundamentals. The failure of the funding rate's resilience function is not a sudden jump from normal to collapse but a process of gradual exhaustion: during a spell of moderately high funding, arbitrageurs keep stepping in to compress the funding deviation, but their margin buffer is progressively consumed at each settlement cycle. When a truly extreme shock arrives, arbitrage capital has already been significantly weakened, so the corrective mechanism collapses far faster than it would from a fully normal starting state. This path dependence means that after a prolonged one-sided market, the market's resilience to a sudden shock is systematically lower than in its initial state.
Another key condition for the failure of the funding rate's resilience function is the exhaustion of underlying liquidity. When spot-market liquidity dries up, small movements in the index price are amplified, so the basis for calculating the funding rate loses its representativeness. Some exchanges, moreover, set a funding-rate cap to prevent the rate from excessively penalizing one-sided position holders. Under extreme sentiment, when the true degree of market imbalance far exceeds this cap, the funding rate loses its price-anchoring and supply-demand-adjusting functions, causing the perpetual futures price to diverge from the spot price over a prolonged period and to a severe degree.
25.4.6 Cross-exchange contagion
The crypto-asset market is composed of many mutually independent exchanges, yet they are tightly connected through cross-exchange arbitrageurs, shared market makers, and highly overlapping pools of collateral assets. This network structure means that a crisis at any single node can rapidly evolve into a market-wide systemic crisis, constituting the ultimate test of market resilience.
The mechanism of cross-exchange price contagion works mainly through two channels. The first is the direct transmission of a liquidity shock. When a large exchange suffers a run or a liquidation cascade, asset prices on that platform plunge. Because arbitrage algorithms monitor price differences across platforms at the millisecond level, they quickly sell the same assets on other, still-functioning exchanges to lock in profits, transmitting the price collapse across the entire network in an instant. The second channel is balance-sheet cross-contagion. Many institutional investors hold exposure on multiple platforms at once; when a position on one platform is force-liquidated, they must liquidate healthy positions on other platforms to top up margin, and this cross-platform deleveraging spreads the liquidity crisis to assets and exchanges that were originally unrelated.
Beyond these two channels, the bidirectional contagion between decentralized protocols and centralized exchanges forms a third, increasingly important transmission channel. Large-scale liquidations on centralized exchanges transmit through oracle price feeds to on-chain lending and perpetual futures protocols, triggering on-chain liquidations and imbalances in liquidity pools; conversely, the collapse of an on-chain protocol (such as the Terra-Luna event of 2022) transmits the shock to centralized exchanges through arbitrageurs and shared collateral. A stablecoin depeg constitutes a particularly dangerous, standalone contagion channel: when the peg of USDT or USDC deviates, stablecoin-denominated margin shrinks simultaneously across all exchanges and protocols, triggering liquidations synchronously across venues and protocols, with a contagion reach far exceeding that of a crisis in a single asset or on a single platform.
The collapse of FTX in November 2022 offers a canonical case for studying systemic contagion. As the world's third-largest crypto derivatives exchange at the time, FTX's bankruptcy not only destroyed its native token but also produced a significant downside-risk spillover. Empirical research shows that during the FTX collapse, assets deeply tied to the platform bore the strongest risk contagion, and even the relatively independent Bitcoin and Ethereum underwent violent repricing as overall market liquidity was withdrawn [25]. More strikingly, the FTX crisis left many cross-exchange market makers badly wounded or bankrupt, and the network-wide liquidity baseline fell sharply over the following months, inflicting lasting damage on the market's overall resilience.
Figure 25-5 renders the contagion mechanisms above as a network structure, in which the nodes represent major exchanges and key institutional participants, and the thickness and direction of the edges reflect the intensity and pathways of liquidity-shock and balance-sheet contagion. The key amplifying nodes marked in the figure—large market makers and hedge funds connected to multiple exchanges at once—act as liquidity bridges in normal times but become accelerators of systemic contagion during a crisis.
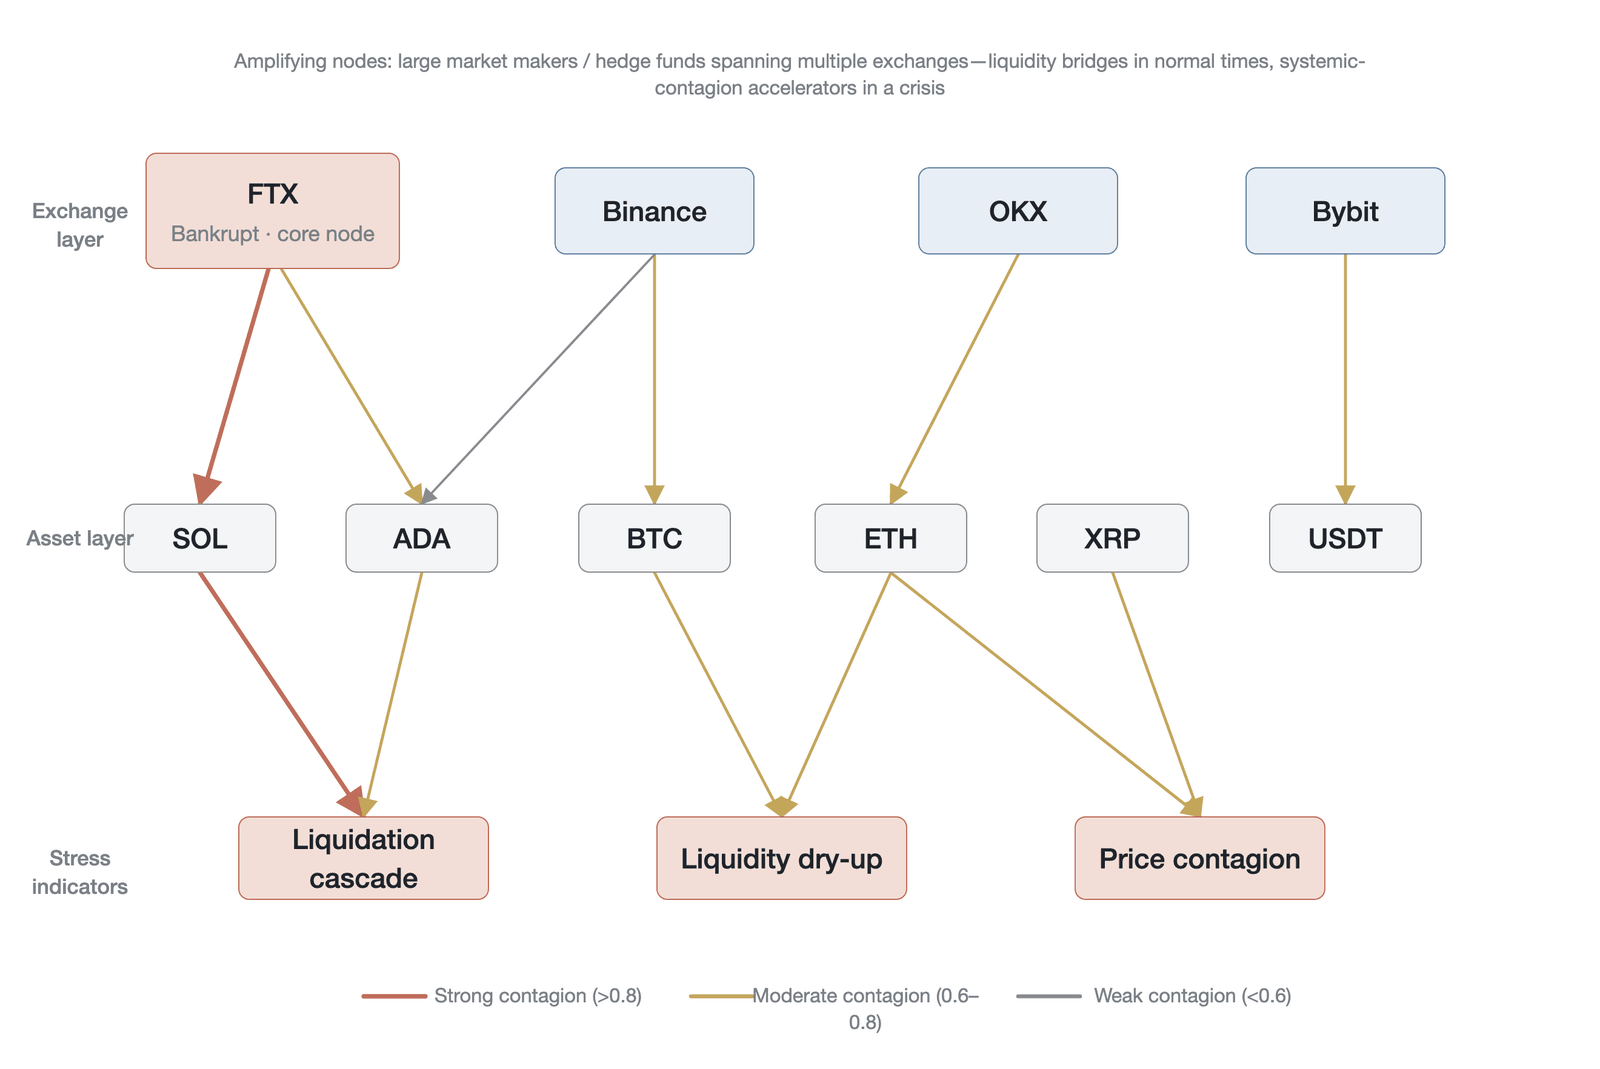
Figure 25-5. Network structure and transmission pathways of cross-exchange stability contagion (a representative reconstruction based on empirical research on the FTX collapse [25] and the October 2025 liquidation cascade [20][26]; edge strengths are qualitative gradations, not measured weights)
Similar network effects have recurred in subsequent episodes of market stress. In the liquidation cascade triggered by a macroeconomic shock in October 2025, for example, an unprecedented scale of liquidations occurred network-wide within about 36 hours (measured as notional value liquidated, not open interest wiped out) [20]. In this crisis, the intensity of cross-asset contagion even exceeded that of previous macro stress tests, demonstrating once again that, absent a network-wide coordination mechanism, the risk controls of individual exchanges cannot halt the spread of a systemic crisis.
25.4.7 Cross-platform comparison and evolution
Although the liquidity of perpetual futures markets has improved significantly over the past few years, resilience has been the slowest to improve. This is because liquidity can be enhanced through short-term incentives such as lower fees or market-maker rebates, whereas strengthening resilience requires systematic institutional reform and long-term investment in infrastructure. Viewed through the lens of historical evolution, the resilience of crypto markets has already undergone several major tests and rounds of evolution.
Comparing several major market crises reveals the trajectory of resilience's evolution clearly. In the crash of March 2020, market structure nearly collapsed entirely: network congestion prevented arbitrageurs from moving funds between exchanges, intensifying local liquidity exhaustion [22]. By the Terra-Luna collapse of May 2022, although the market again experienced violent price swings and large-scale liquidations, the systems of major exchanges did not suffer prolonged outages, and the recovery time for spread and depth had shortened from hours to tens of minutes. In the turmoil triggered by FTX's bankruptcy in November 2022, although market confidence was badly shaken, the liquidity metrics of the remaining major platforms largely returned to normal within 10 to 20 minutes [27]. Attributing this recovery entirely to a rise in the maturity of market structure, however, calls for caution. The FTX collapse was essentially a credit event rather than a pure liquidity event, and the rapid recovery of liquidity on other platforms stemmed in part from the migration of FTX users' funds and trading activity to surviving platforms—essentially a mechanism of liquidity redistribution rather than the market's own capacity to regenerate liquidity. Distinguishing these two recovery mechanisms is essential to any accurate assessment of market resilience: liquidity redistribution works only when some platforms are in crisis and cannot be relied upon in a market-wide systemic shock.
The improvement of resilience, however, is not without cost; it often requires a trade-off against transaction costs. To maintain higher resilience, an exchange must build a larger insurance fund, implement stricter risk controls, and may impose stricter quoting obligations on market makers. These measures inevitably raise the system's overall friction cost, which is ultimately passed on to traders. Market resilience, moreover, comprises not only the liquidity- and liquidation-level recovery capacity described above but also technical reliability at the operational level. Exchange system outages, API interruptions, DDoS attacks, and security incidents all pose direct threats to market continuity. The 2024 Bybit security incident and the repeated system overloads at centralized exchanges during periods of extreme volatility show that a platform excelling in liquidity resilience but suffering frequent failures of its technical infrastructure will see its effective resilience sharply discounted. Assessing operational resilience should incorporate metrics such as system availability, the frequency of security incidents, and the speed of disaster recovery.
The future design of perpetual futures markets therefore needs to find an optimal balance between extreme liquidity and reliable resilience, so as to ensure that the market maintains its core functions in both normal and stressed states.
25.5 Fairness
Fairness is a dimension often neglected in traditional market-quality evaluation but especially prominent in crypto markets. In traditional financial markets, fairness is usually enforced by regulators through unified rules and severe penalties, so it is treated more as a precondition than as a market-quality metric requiring continuous assessment. In perpetual futures markets, however, the absence of a unified global regulatory framework and the fundamental architectural differences between centralized exchanges and decentralized protocols make fairness a highly variable core variable that directly affects participant welfare.
Fairness in perpetual futures markets is not a purely moral question but a profound question of market efficiency. When market rules are not applied equally, or when certain participants obtain systematic information privileges, the resulting unfairness translates directly into transaction costs for other participants. Information privileges and execution inequality amplify the advantage of informed traders, and market makers, to compensate for the risk of being adversely selected, inevitably widen the bid-ask spread or reduce liquidity supply. Ultimately, this unfairness—produced by institutional design or technical architecture—harms the welfare of all uninformed traders and lowers the overall quality of the market.
25.5.1 A multilayered structure
Market fairness is not a single-dimensional concept but is composed of several interwoven layers. To assess the fairness of perpetual futures markets systematically, we decompose it into three core layers: execution fairness, information fairness, and institutional fairness. These three layers correspond, respectively, to the unequal treatment a trader may encounter in how they trade, on what information they trade, and under what rules they trade.
Figure 25-6 presents the nested relationship among the three layers of execution fairness, information fairness, and institutional fairness, and their transmission paths to market-quality metrics; the three layers rise from the most micro-level execution quality up to the institutional layer that defines the boundaries of the rules of the game. The figure also shows how different architectures perform differently: centralized exchanges face greater challenges at the execution- and information-fairness layers (arising from market-maker privileges and colocation advantages) but can repair them at the institutional layer through internal governance; decentralized exchanges perform excellently at the institutional layer (with rules hardcoded into smart contracts) yet face a novel unfairness threat in maximal extractable value (MEV), which has the dual properties of both information and execution.
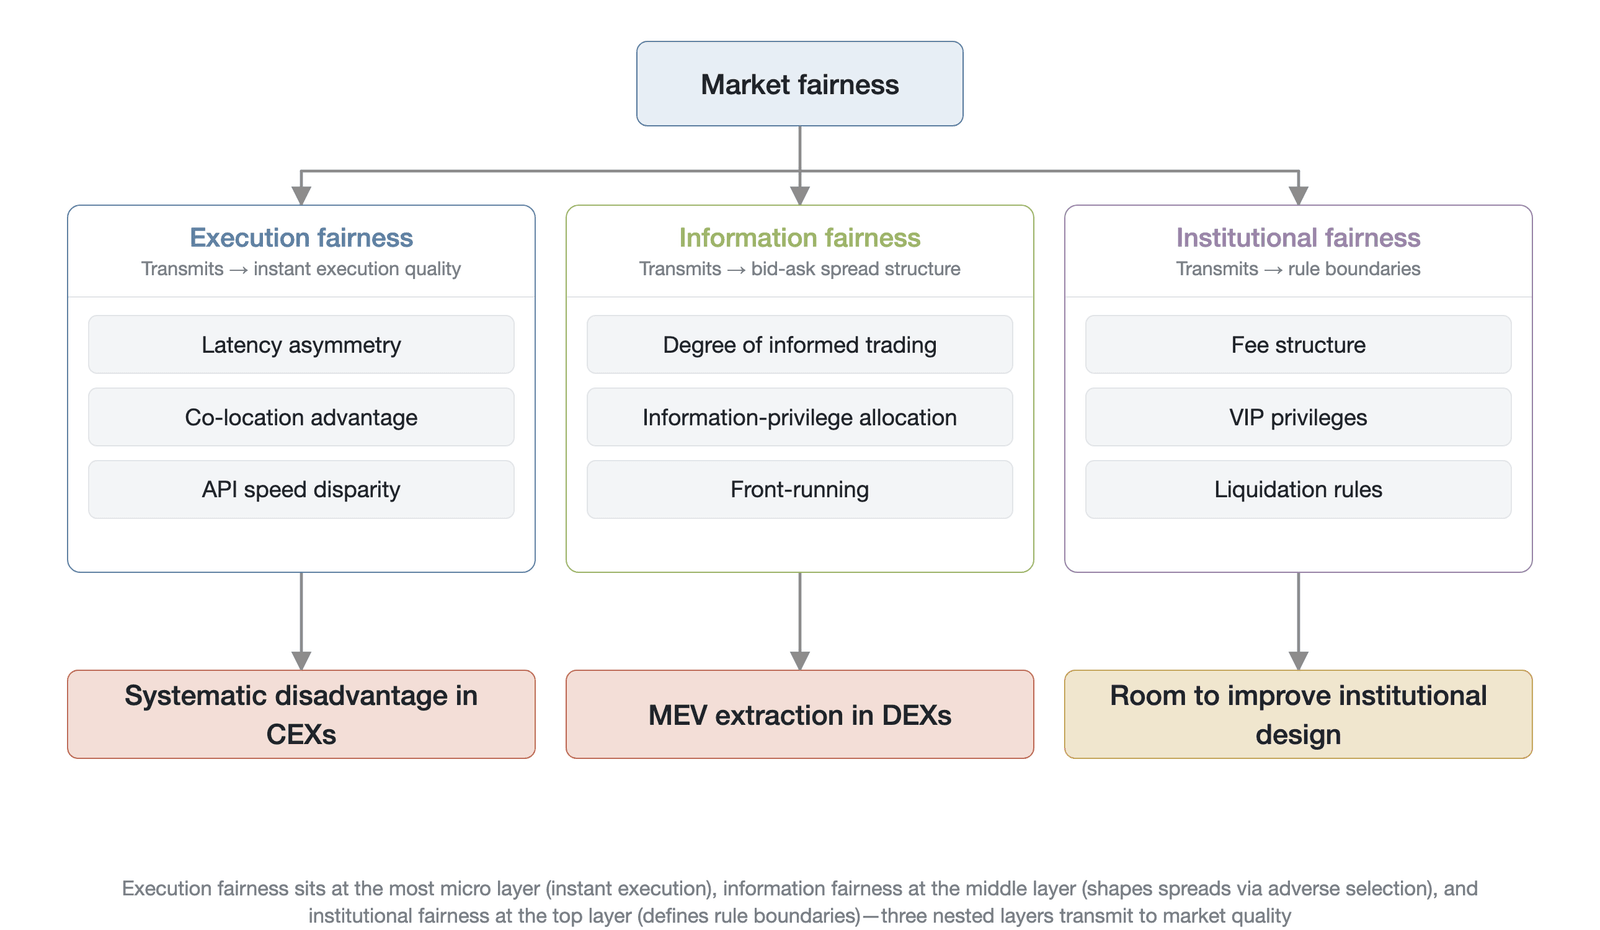
Figure 25-6. The multilayered structure of fairness and its market-impact pathways (author's integrated conceptual illustration, not measured data; theoretical basis: Angel & McCabe, 2013 [28]; Lin et al., 2019 [29])
Execution fairness concerns differences among participants in the speed of order submission and processing. When certain participants obtain a systematic speed advantage through technical means or special channels provided by the exchange, execution fairness is undermined, and the orders of ordinary traders always lag behind those of high-frequency traders (the mechanism is elaborated in Section 25.5.2).
Information fairness concerns the distribution of market data and order-flow information. In an ideal market, all public information should be available to all participants simultaneously. In real perpetual futures markets, however, the degree of informed trading and the distribution of information privileges vary significantly. Market makers or high-frequency trading firms are often able to obtain deeper order-book data or faster market-data feeds. The classic model of Glosten and Milgrom (1985) shows that, under information asymmetry, a market maker's bid-ask spread is a rational compensation for adverse-selection risk [30]. When information privileges are monopolized by a tiny number of participants, this asymmetry forces other liquidity providers to widen their spreads, raising transaction costs across the whole market.
Institutional fairness is the highest layer of fairness, concerning how equitably an exchange or protocol makes and enforces its rules, and it is also the most destructive source of unfairness—it not only distorts price discovery but can also give rise to conflicts of interest and even a collapse of market trust (the mechanism is elaborated in Section 25.5.3).
25.5.2 Execution fairness
Unfairness at the execution level stems mainly from high-frequency traders' speed advantage in order processing and information acquisition. In perpetual futures markets, price discovery and liquidity supply depend heavily on market makers' continuous quoting. This microstructure, however, also creates room for rent-seeking by participants with ultra-low-latency connections. Angel and McCabe (2013), in examining market fairness in the age of high-frequency trading, note that although high-frequency trading can improve market liquidity in some cases, the microsecond-level speed advantage it relies on essentially constitutes an implicit cost levied on other, slower participants [28].
On centralized exchanges, this execution unfairness typically manifests as differences in physical location and API access. Well-funded trading firms can use server-colocation services to place their trading servers in the same data center as, and as close as possible to, the exchange's matching engine. This shortened physical distance lets them receive price updates earlier than ordinary traders and send orders faster. Exchanges, moreover, often provide dedicated API channels to top market makers, further amplifying this latency asymmetry. When new market information arrives, firms with the speed advantage can cancel stale quotes or establish new positions ahead of ordinary traders; this front-running behavior often leaves ordinary traders facing wider slippage or rejected orders.
Beyond a pure speed advantage, market makers also frequently obtain information privileges. On many centralized perpetual futures exchanges, market makers can obtain order-flow information through specific data-sharing agreements that ordinary users cannot see. This privileged data access lets them predict short-term price movements more accurately. Although exchanges typically argue that they provide this data to help market makers manage risk and thus quote more tightly, in practice it creates an unfair information hierarchy. Informed traders use this privileged information to earn excess profits in the market, and those profits are ultimately paid by uninformed traders (mainly retail) through wider effective spreads and higher slippage.
Under extreme conditions, execution-level unfairness gives rise to more serious problems. When the market swings violently and many positions face liquidation risk, firms that obtain liquidation information in advance and execute faster can establish positions near the liquidation price ahead of time and thus profit when the liquidation cascade unfolds. This behavior not only intensifies the market's excess volatility but also causes those being liquidated to suffer additional losses far exceeding their margin shortfall.
25.5.3 Institutional fairness
Unfairness at the institutional level stems from the deliberate favoritism of those who make the rules. In centralized perpetual futures markets, the exchange is not only the provider of the trading venue but often also the rule-maker, the referee, and even a participant. This multiplicity of roles creates severe conflicts of interest and gives rise to opaque market-maker agreements and extreme institutional favoritism.
The opacity of market-maker agreements is a typical expression of institutional unfairness. To attract liquidity, exchanges generally implement a maker-taker fee structure. Malinova and Park (2015) show that this fee structure can indeed significantly affect market quality and traders' behavioral choices [31]. In crypto markets, however, these agreements are often not disclosed. Top market makers can obtain not only a full rebate of maker fees but even additional cash subsidies or token rewards. These VIP privileges let large market makers trade at costs far below those of ordinary participants, giving them a decisive advantage in strategic competition. Although this price discrimination helps sustain nominal liquidity to some degree, it essentially constitutes an asymmetric cost burden on small and medium traders.
A more severe form of institutional unfairness arises from an exchange's proprietary market making and related-party trading. When an exchange operates its own market-making team or is closely tied by interest to a particular hedge fund, fairness is fundamentally compromised. The collapse of the FTX exchange in 2022 offers an extreme case of institutional unfairness. According to the complaint filed by the Commodity Futures Trading Commission (CFTC), FTX's affiliated hedge fund, Alameda Research, not only obtained special trading priority as the platform's principal market maker but also received a systematic exemption from risk controls at the code level [32].
In the FTX case, Alameda was able to bypass the automatic liquidation mechanism and continue trading even when its account balance was negative. This privilege let Alameda draw without limit on other customers' funds for high-risk speculation. Alameda also had faster API access than other institutional clients, letting it stay ahead of the market at the millisecond level [33]. This extreme institutional favoritism was not only unfair to all other traders but also fundamentally undermined the basis of trust in the exchange as a neutral matching engine. When the rule-maker can modify system parameters at will for particular participants, so-called market efficiency and price discovery degenerate into a channel through which internal stakeholders siphon off outside funds.
25.5.4 The fairness of DEXs
In response to the execution and institutional unfairness prevalent on centralized exchanges, decentralized exchanges offer an alternative built on blockchain architecture. One of the core value propositions of a DEX is to fundamentally eliminate human rule-favoritism and secret agreements through the properties of code-is-law and permissionlessness. Under this architecture, the fairness problem shifts from a game between people and institutions to a game between people and code.
DEXs enjoy a significant structural advantage in institutional fairness. In protocols based on automated market makers or on-chain central limit order books (CLOBs), all trading rules, fee structures, and liquidation parameters are hardcoded into open-source smart contracts. There are no opaque market-maker agreements, no hidden VIP channels, and no risk exemptions for an exchange's proprietary team. All participants—whether an institution with hundreds of millions of dollars in capital or a retail trader with only a few hundred dollars—must follow exactly the same execution logic. This on-chain transparency ensures the absolutely equal application of the rules. McMenamin et al. (2022) note that decentralized architectures have the potential to significantly reduce the value extraction of traditional markets through innovative protocol designs such as frequent batch auctions [34]. Yet hardcoding is not absolutely immutable: most DEX protocols adopt an upgradeable-contract model in which core parameters can be adjusted through governance votes or a multisignature wallet, and in practice governance power is often concentrated in the hands of a few large token holders. More critically, the sequencers of today's leading app-chain perpetual futures platforms (Hyperliquid, dYdX v4) are all run centrally by a single entity, which means that the sequencer operator theoretically holds trade-ordering power similar to that of a centralized exchange, including the ability to reorder transactions or selectively censor them. These factors show that although the DEX advantage in institutional fairness is real in terms of rule transparency, it still rests on trust assumptions—regarding how far power is actually dispersed—that are not fully consistent with its decentralization narrative.
The transparency and openness of DEXs, however, also introduce a new type of fairness challenge, the most prominent being the problem of maximal extractable value. In a blockchain network, because all pending transactions are publicly exposed in the mempool and block builders hold the power to decide the order in which transactions are packed, an unfairness arises that has the dual properties of both information and execution. Daian et al. (2019) describe in detail the phenomena of front-running and transaction reordering on DEXs, noting that these cause instability at the consensus level and directly harm the interests of ordinary traders [35].
On perpetual futures DEXs, MEV typically takes the form of a sandwich attack. When a searcher observes in the mempool a large order likely to cause significant price slippage, the searcher pays a higher priority fee to submit a same-direction trade ahead of that order, pushing the price up, and then immediately closes in the opposite direction for a profit once the order executes. This attack forces the victim to fill at a worse price. According to Uniswap's analysis, although this value extraction is a byproduct of blockchain transparency, it is essentially a hidden tax levied on ordinary users by exploiting the power to order transactions [36].
Beyond MEV attacks, liquidity providers on decentralized exchanges face a more insidious structural loss. The loss-versus-rebalancing framework proposed by Milionis et al. (2022) reveals a fundamental fairness defect in automated market makers: when the price on a centralized exchange updates first, informed arbitrageurs can execute trades against the stale quotes on a decentralized exchange, systematically extracting value from liquidity providers [37]. The existence of loss-versus-rebalancing (LVR) shows that even in a decentralized architecture that has eliminated institutional privileges, information asymmetry still imposes a hidden tax on liquidity providers through the channel of cross-market arbitrage—a fairness problem distinct from the market-maker privileges of centralized exchanges but no less deserving of attention.
Fairness on DEXs is further constrained by technical capability and capital scale. Although the rules are equal for everyone, the technically adept who can write complex smart contracts to arbitrage clearly hold an enormous advantage over ordinary users who can only trade manually through a web front end. At the same time, in protocols based on token governance, well-capitalized large holders can change protocol parameters by voting, achieving rule changes that serve their own interests. Thus, although DEXs eliminate the privileges of centralized institutions, they do not achieve absolute fairness; rather, they redefine the sources of advantage under transparent rules.
25.6 Accessibility
Accessibility measures the extent to which a market allows a broad range of participants to enter trading across the geographic, capital, and technical dimensions. In traditional financial markets, eligibility to participate is set in advance by regulatory rules, and the barrier to entry is treated as an exogenous institutional constraint rather than an endogenous variable of market quality. In crypto perpetual futures markets, however, permissionless decentralized architectures coexist with centralized platforms that impose strict identity screening, making accessibility a core quality dimension that directly determines the diversity of participants and the depth of liquidity pools. A market that performs excellently on transaction costs and price discovery but sets high barriers to entry for most potential participants will see its overall quality sharply discounted by the narrowness of its liquidity base.
25.6.1 Definition and measurement framework
Accessibility can be decomposed into three interrelated sub-dimensions. Geographic accessibility measures how open the market is to users in different jurisdictions, including regional bans, tiered Know Your Customer (KYC) screening regimes, and the coverage of fiat on- and off-ramp channels. Capital accessibility concerns the screening effect that minimum deposit thresholds, VIP volume tiers, and margin requirements have on participants of different capital sizes. Technical accessibility assesses the operational complexity users face in wallet setup, gas-fee payment, smart-contract interaction, and cross-chain bridging.
To quantify these three sub-dimensions, the following operational indicators can be constructed: a geographic coverage index (the share of the global active crypto market represented by the jurisdictions a platform can serve), minimum viable capital (the smallest amount of funds needed to open and maintain a meaningful position on a given platform), and a technical-barrier score (the number of steps and the level of technical knowledge required from wallet creation to completing a first trade) [38][39]. These indicators turn accessibility from a qualitative concept into a quantifiable dimension of market quality.
25.6.2 The entry barriers of CEXs
Centralized exchanges construct an implicit hierarchy of access through a tiered identity-verification system. At the most basic level, KYC screening excludes users who cannot provide valid proof of identity. Geographically, U.S. residents are excluded from the vast majority of offshore perpetual futures platforms, while users in several Asian and African countries face partial or complete service restrictions [38][40]. At the capital level, the VIP tier system constitutes structural discrimination against retail traders: as noted in Section 25.2.1, the $100 million monthly-volume threshold required to reach Binance's VIP 3 tier makes competitive fees structurally unattainable for the vast majority of retail users [10].
Users in developing economies face even harsher friction in fiat on- and off-ramps. The lack of bank-transfer channels, the high fees charged by payment processors, and the exchange-rate losses on local-currency conversion make the real cost of entering the crypto derivatives market from fiat far exceed explicit trading fees [41]. This friction not only limits individual participants' market access but also systematically weakens the ability of particular geographic regions to contribute to the global price-discovery process.
25.6.3 The permissionless access and technical barriers of DEXs
One of the core value propositions of decentralized exchanges is permissionless access: any user holding a digital wallet can participate in trading without identity verification [8][42]. This architecture fundamentally eliminates the geographic restrictions and identity-screening barriers of centralized platforms, achieving the greatest possible openness at the institutional level. Technical barriers, however, largely replace institutional barriers as the main constraint on the accessibility of decentralized markets.
Wallet management, the secure storage of seed phrases, gas-fee optimization, smart-contract risk assessment, and cross-chain asset bridging form a series of operational steps of considerable complexity for non-technical users. Smart-contract security risk deserves particular attention: in interacting with a DEX, non-technical users face not only operational complexity but also the security risk that carelessly authorizing a malicious contract can lead to the theft of their assets. This security barrier partly offsets the permissionless-access advantage of DEXs in practice. On the Ethereum mainnet, gas fees during periods of network congestion can make small trades economically unviable, creating a de facto minimum trade-size threshold. The rise of app-chain architectures exemplified by Hyperliquid and dYdX v4 has significantly eased this technical barrier by migrating trade execution to a dedicated chain and drastically lowering trading fees [43]. While lowering trading fees, however, app-chains also introduce a new barrier: cross-chain asset bridging. Users must bridge assets from the Ethereum mainnet or another chain to the app-chain, a process that involves trust assumptions about the bridge's security, a wait of several minutes to tens of minutes, and additional bridging fees. For non-technical users, the cognitive complexity and security risk of bridging may be higher than gas-fee optimization itself. Account abstraction and mobile-first interface design have further reduced the complexity of wallet management, so that the user experience of decentralized markets is gradually converging toward that of centralized platforms.
25.6.4 The feedback loop between accessibility and market quality
Accessibility is not an isolated dimension of market quality but forms a deep feedback loop with the other dimensions through the intermediate variable of participant diversity. Broader access means a more diverse body of participants—with different risk preferences, different information sets, and different trading time zones—converging in the same market, which deepens liquidity pools, improves price-discovery efficiency, and strengthens the market's resilience to local shocks. Restricted access, by contrast, concentrates participation among professional institutions; while this may raise execution efficiency in the short run, it also leaves the market overly dependent on a few homogeneous actors for liquidity supply and risk-bearing, so that it proves more fragile in periods of stress.
The marked climb in DEX trading volume during regulatory crackdowns on centralized exchanges provides natural-experiment evidence of accessibility's effect on market quality. When a particular jurisdiction restricts users' access to centralized platforms, trading activity migrates rapidly to permissionless decentralized protocols, revealing participants' strong preference for accessibility [44]. This migration pattern shows that the accessibility constraint is not merely a question of welfare distribution but a structural force shaping the global allocation of liquidity. Section 25.8.1 further examines the regulatory dilemma between consumer protection and market accessibility.
25.6.5 Cross-platform comparison and evolution
On the accessibility dimension, centralized and decentralized exchanges present a complementary pattern of strengths and weaknesses. Through smooth user interfaces, well-developed fiat channels, and professional customer service, centralized exchanges greatly lower the technical barrier, letting users without a technical background participate in trading with ease. Their geographic coverage, however, is strictly limited by regulatory-compliance requirements, and the tiered KYC system, while protecting investors, also constitutes an institutional constraint on global participation. Decentralized exchanges, by contrast, have a structural advantage in geographic accessibility—their permissionless architecture means any internet user can participate—but their higher technical complexity forms a de facto entry barrier at the level of user experience.
These two architectures are undergoing marked convergent evolution. Centralized exchanges have begun to introduce on-chain settlement and non-custodial wallet options, seeking to grant users greater autonomy over their assets within a compliance framework. Decentralized exchanges, through technical innovations such as account abstraction, social login, and mobile-native applications, keep lowering the technical barrier [43][45]. This bidirectional convergence shows that market competition is driving an overall improvement in the accessibility dimension. The focus of future competition will shift from whether access is possible to at what cost access is possible—that is, how to minimize the combined friction that users face across the geographic, capital, and technical sub-dimensions while maintaining broad access [41].
25.7 Integrated assessment
A single-dimensional market-quality metric is inevitably one-sided. As noted earlier, an extremely narrow bid-ask spread or extremely high informational efficiency alone cannot establish that a market possesses high overall quality. Only by integrating the five dimensions of transaction costs, price discovery, resilience, fairness, and accessibility into a composite index can we capture the full picture of market quality. This integration, however, itself faces the fundamental challenges of weight selection and trade-offs among dimensions. This section sets out in detail the methodology for constructing a five-dimensional market-quality index and applies it to comparative analysis across platforms and across architectures.
25.7.1 Construction methodology
The core objective of the five-dimensional market-quality index is to convert microstructure indicators of different units and properties into comparable, standardized scores. This process requires establishing a unified measurement benchmark while preserving the independent characteristics of each dimension.
Construction of the index begins with the standardization of base indicators. The transaction-cost dimension relies chiefly on the reciprocal of the effective spread and market-impact cost; the price-discovery dimension uses the Hasbrouck information share or the variance-ratio-test score; the resilience dimension is quantified as the spread-recovery half-life and depth-recovery rate after a liquidity shock; the fairness dimension is based on inverse indicators of market-maker-agreement transparency and the probability of informed trading; and the accessibility dimension jointly assesses the minimum capital threshold and the degree of global access (see Section 25.6). These base indicators are mapped onto a 0-to-100 score range through min-max normalization, turning originally incommensurable physical quantities into quality scores on a common scale [7]. Min-max normalization is highly sensitive to extreme values, and extreme values occur frequently in crypto markets—the bid-ask spread of a given altcoin, for example, may suddenly spike to several hundred basis points during a liquidity crisis. In practice, one can use quantile normalization or winsorize extreme values to enhance robustness. Moreover, the choice of reference sample for normalization (whether to benchmark against all assets or only against major assets) fundamentally changes the score ranking of the platforms, so the reference scope must be stated explicitly in any specific application.
Once standardization is complete, computing the composite index confronts the core difficulty of weight selection. An equal-weighting scheme assumes that the five dimensions contribute identically to overall market quality; this treatment is mathematically simpler but often lacks solid theoretical support in economic terms. A functional-weighting scheme, by contrast, has greater explanatory power. For a high-frequency arbitrageur, for example, the transaction-cost and price-discovery dimensions carry far greater weight than the others, whereas for a long-term institutional investor or a regulator, the resilience and fairness dimensions dominate. The practical application of the five-dimensional index therefore does not pursue a single universal total score but emphasizes a weighted result under a specific evaluation objective.
Although the five-dimensional model offers a more comprehensive evaluative perspective, its limitations must not be ignored. The incommensurability of the dimensions means that a higher score on one dimension cannot fully compensate for a lower score on another. The score gain from lowering transaction costs through extreme leverage, for example, cannot offset the collapse in the resilience score caused by the resulting liquidation cascade. This nonlinear relationship requires that, in applying the five-dimensional index, we not look at the weighted total alone but examine the distribution of scores across dimensions and the trade-offs inherent among them.
25.7.2 A cross-sectional comparison of CEXs
Figure 25-7 uses a heatmap to compare the quality scores of Binance, OKX, Bybit, and the decentralized exemplar Hyperliquid across the five dimensions of transaction costs, price discovery, resilience, fairness, and accessibility. The figure exhibits a striking diagonal pattern of divergence: centralized exchanges lead on the efficiency-oriented dimensions, whereas the decentralized exchange shows an advantage on the fairness and accessibility dimensions.
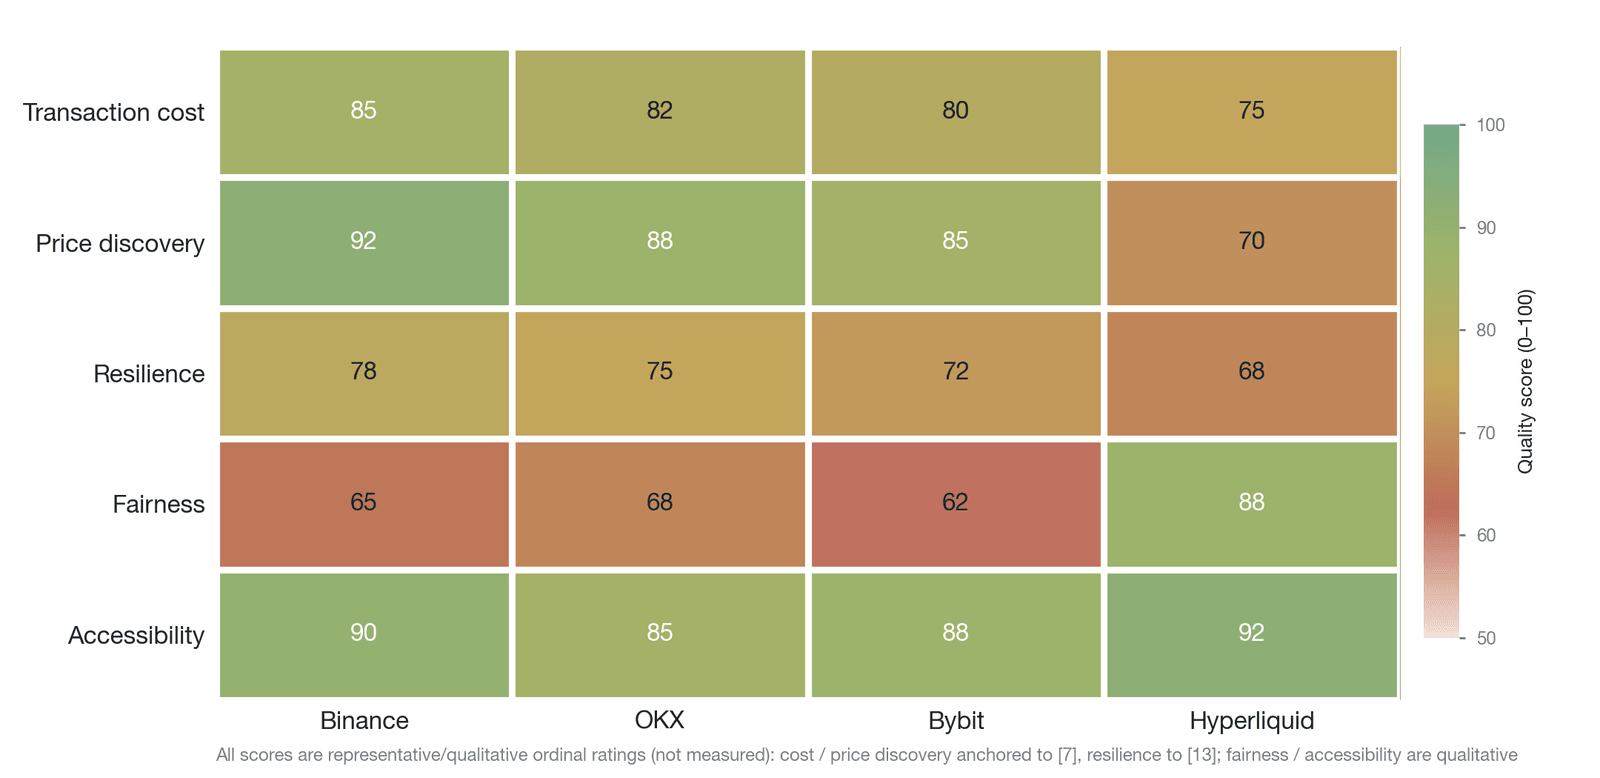
Figure 25-7. Heatmap of five-dimensional market-quality scores for major exchanges (the scores on all five dimensions are representative/qualitative ordinal ratings, not precise direct measurements; the transaction-cost and price-discovery scores are based on the methodology of Barbon and Ranaldo [7], the resilience score is estimated from platforms' publicly disclosed insurance-fund data and spread-recovery speed [13], the fairness score is a qualitative rating based on market-maker-agreement transparency and API-access tiering, and the accessibility score is based on geographic access restrictions and the minimum capital threshold)
On the two efficiency-oriented dimensions of transaction costs and price discovery, Binance shows a marked lead. Its deep order-book liquidity and vast trading-volume base keep the bid-ask spread at an extremely low level over the long run while it also dominates the price-discovery process. OKX and Bybit follow close behind on these dimensions, and the gap among the three leading platforms is gradually narrowing, reflecting a homogenization trend driven by market-maker competition and infrastructure upgrades [46].
On the institutional-safeguard dimensions, however, the platforms perform with different characteristics. On resilience, leading centralized exchanges, backed by large insurance funds and mature liquidation engines, can restore liquidity relatively quickly when facing medium-sized market shocks. On the fairness dimension, however, centralized exchanges generally score low. This stems mainly from the opacity of their market-maker agreements and the execution privileges enjoyed by VIP clients. Although this institutional design effectively lowers overall transaction costs, it inevitably harms the relative fairness experienced by ordinary traders.
25.7.3 A comparison of CEXs and DEXs
Centralized and decentralized exchanges represent two sharply different paradigms of market architecture, and this underlying architectural difference profoundly shapes their quality characteristics within the five-dimensional model.
Decentralized exchanges hold a structural, absolute advantage in fairness and transparency. On platforms exemplified by Hyperliquid or dYdX, the core logic rests on the enforced execution of on-chain rules. All liquidation parameters, fee structures, and order-matching logic are fully public to every participant, thoroughly eliminating the private market-maker agreements and information privileges prevalent on centralized exchanges [42]. The permissionless nature of the decentralized architecture, moreover, gives it an equally strong performance on the accessibility dimension: any user with a digital wallet can participate in the market without hindrance.
This advantage in fairness and accessibility, however, comes at the expense of some transaction cost and resilience. Decentralized exchanges can often offer competitive execution costs for large trades [7] but still face a cost disadvantage for small trades. For AMM-type decentralized exchanges on the Ethereum mainnet, the fixed gas fee is the main reason small trades are too costly; for app-chain-architecture perpetual futures platforms (such as Hyperliquid and dYdX v4), trades themselves incur no gas fee, and the cost disadvantage for small trades comes mainly from the larger price impact caused by relatively limited liquidity depth rather than from a fixed fee. More critical is the resilience dimension: decentralized platforms face a greater risk of liquidity exhaustion under extreme market stress. When the market swings violently, a decentralized liquidity pool that lacks the backstop of centralized market makers may dry up rapidly, causing the spread to widen sharply and the price-discovery function to stall briefly. This shows that CEXs and DEXs are not simple substitutes in market quality but are highly complementary.
25.7.4 Dynamic evolution
Market quality is not static cross-sectional data but a dynamic process that evolves continually over time. Looking back over the development from 2019 to 2025, the perpetual futures market shows a significant but uneven trajectory of improvement across its dimensions.
Over the past 6 years, the transaction-cost and price-discovery dimensions have improved the fastest. With the full-scale entry of high-frequency trading firms and upgrades in matching-engine technology, the bid-ask spread on major assets has fallen by nearly an order of magnitude [47]. At the same time, the information share of perpetual futures in price discovery has risen steadily, transforming them from an early spot follower into the primary pricing venue. This rapid improvement in the efficiency-oriented dimensions is due chiefly to the direct drive of fierce commercial competition and technical innovation.
By contrast, the two institutional-safeguard dimensions of resilience and fairness have improved at a relatively slow pace. Although the major platforms have progressively refined their liquidation mechanisms and expanded their insurance funds, momentary liquidity vacuums and liquidation cascades continued to occur frequently during the repeated extreme market shocks of 2022 and 2025 [48]. This shows that technical upgrades alone cannot fundamentally resolve the endogenous fragility produced by high leverage and procyclical mechanisms. Progress on fairness has been equally slow, with market-maker privileges and information asymmetry remaining persistent problems in the market microstructure. The future direction of market-quality improvement will necessarily require a shift from purely technical efficiency competition toward deeper optimization of institutional design and architectural innovation.
25.8 Regulatory implications
Measuring market quality is not merely an academic description of the trading environment but a scientific basis for making regulatory policy. The regulatory frameworks of traditional financial markets are largely built on intervening in specific market-quality defects—for example, improving price-discovery efficiency by requiring disclosure, or strengthening system resilience through capital-adequacy requirements. Transposing this regulatory logic to perpetual futures markets, however, confronts regulators with entirely new challenges. The decentralized character, cross-border nature, and around-the-clock trading of the crypto derivatives market often cause interventions to deviate from their intended effect. More importantly, regulatory intervention itself reshapes the market microstructure, so that resolving a quality problem on one dimension may trigger a deterioration on others. Understanding how each dimension of market quality maps onto regulatory objectives, and the effects of regulatory arbitrage across jurisdictions, is therefore a prerequisite for finding a reasonable balance among efficiency, fairness, and stability.
25.8.1 The correspondence with regulatory objectives
The five dimensions of market quality are not isolated academic metrics; they correspond directly to the core policy objectives of financial regulation. A regulator's intervention in the market is, in essence, a correction and reinforcement of one or more of these dimensions. Figure 25-8 presents, in matrix form, the mapping between the five dimensions of market quality and the main regulatory objectives, and marks the direct strength of each regulatory tool's effect on each dimension along with its potential negative spillovers. From this a key insight emerges: there is almost no regulatory tool that affects only a single dimension. Each intervention, while improving its target dimension, produces positive or negative spillovers onto other dimensions through complex transmission chains—and this multidimensional interconnection is precisely the core difficulty in designing regulatory policy.
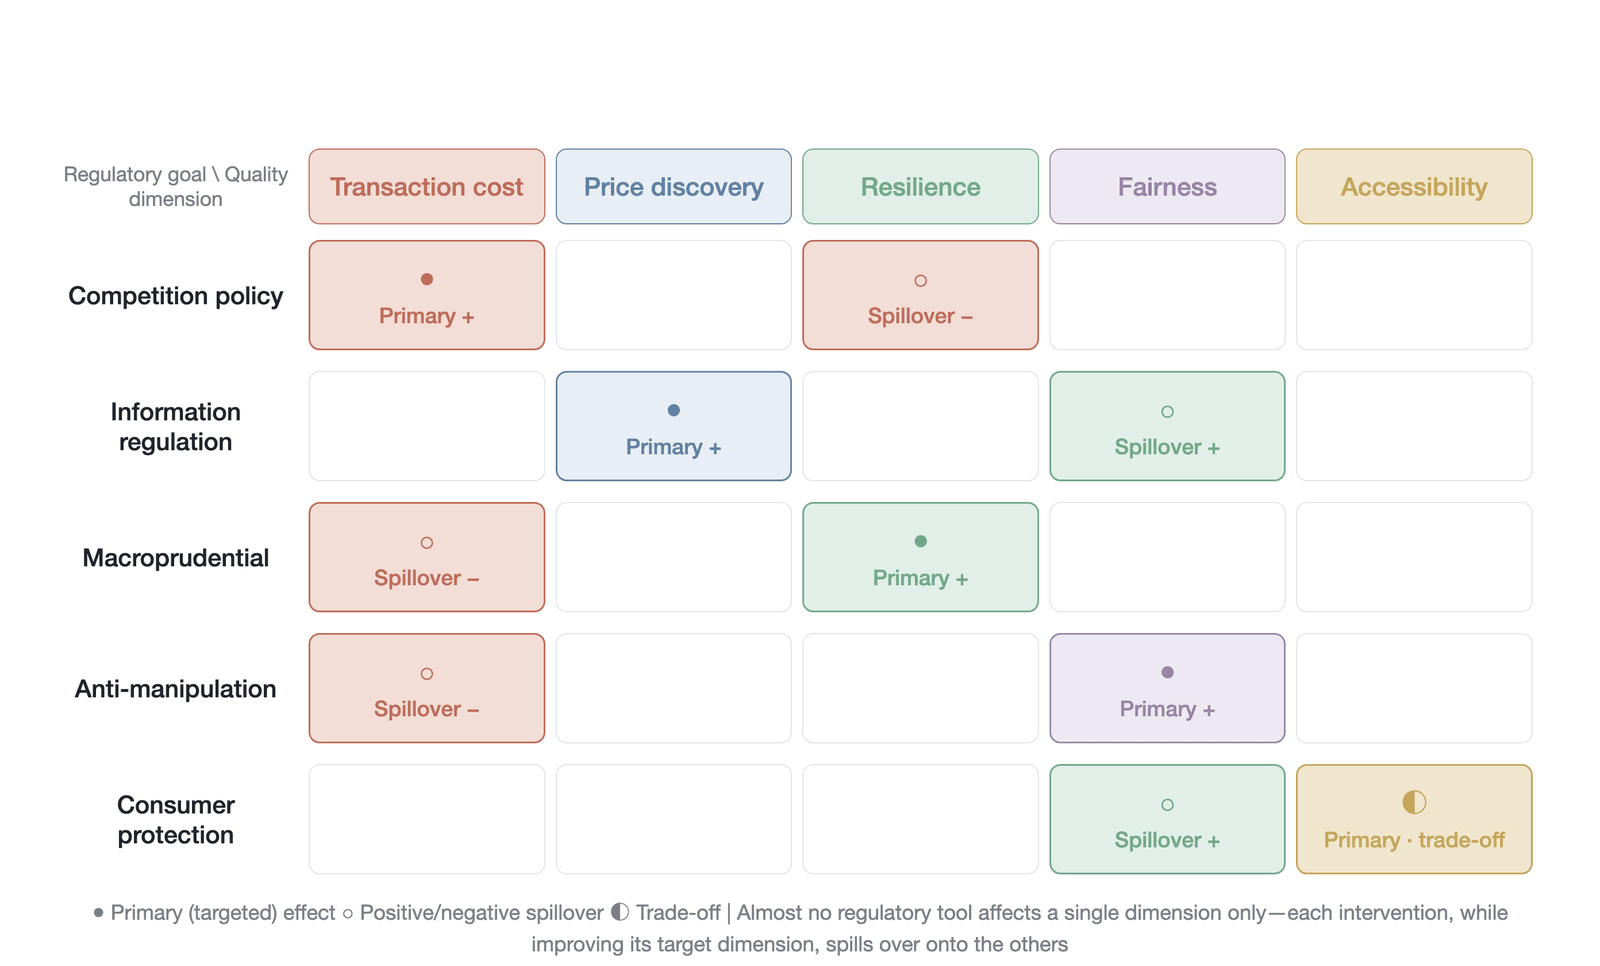
Figure 25-8. The mapping between regulatory objectives and market-quality dimensions (a 5×5 qualitative mapping matrix constructed by the author based on Harris [4] and various regulatory frameworks, not direct measurement): the horizontal axis is the five quality dimensions and the vertical axis is the five categories of regulatory objective—competition policy, information regulation, macroprudential regulation, anti-manipulation, and consumer protection; the principal effects lie along the diagonal, and the off-diagonal cells are marked with plus/minus signs for positive and negative spillovers (per Section 25.8.1)
The transaction-cost dimension is directly linked to competition policy. Regulators lower explicit and implicit transaction costs through antitrust measures and by promoting market transparency. In perpetual futures markets, the intensity of competition among market makers and the fee structures of exchanges directly determine investors' transaction costs [17]. Regulatory intervention in transaction costs typically takes the form of requiring exchanges to disclose order-book data and reduce information asymmetry, thereby promoting full competition among market makers. Pushing transaction costs down excessively, however, may squeeze out marginal market makers, concentrating liquidity among a few leading institutions and thereby harming the market's overall resilience.
The price-discovery dimension corresponds to information regulation. A basic objective of financial regulation is to ensure that market prices reflect all available information accurately and in a timely manner [4]. To this end, regulators typically require issuers to make periodic and ad hoc disclosures and crack down hard on insider trading. In perpetual futures markets, for lack of corporate fundamental information in the traditional sense, price discovery relies more on macroeconomic data, on-chain activity indicators, and the signal transmission of the funding rate. The challenge for regulators is how to define material nonpublic information for crypto assets and how to govern the process by which oracle quotes are generated, so as to prevent the price-discovery mechanism from being maliciously distorted.
The resilience dimension is the central concern of systemic-risk regulation. Through macroprudential tools such as capital-adequacy and liquidity-coverage ratios, regulators aim to strengthen financial institutions' ability to withstand external shocks [49]. In perpetual futures markets, for the general absence of a central clearing house's credit guarantee, resilience relies mainly on exchanges' auto-deleveraging mechanisms and insurance funds. The objective of regulatory intervention on this dimension is to prevent a single participant's default from evolving into a systemic liquidation cascade. Requiring exchanges to maintain adequate insurance-fund reserves and to stress-test their risk-management models is a key regulatory means of enhancing market resilience.
The fairness dimension points directly to anti-market-manipulation regulation. A fair market environment requires all participants to enjoy equal opportunity in trade execution and information acquisition. In the crypto derivatives market, latency arbitrage, front-running, and exchanges' VIP privileges for particular market makers constitute the main threats to fairness [50]. Regulators safeguard market fairness by prohibiting specific trading behaviors and requiring exchanges to allocate order flow fairly. Strict fairness regulation, however, may dampen market makers' willingness to provide liquidity, thereby pushing transaction costs up to some degree.
The accessibility dimension is closely tied to consumer protection and access regulation. As analyzed in Section 25.6, regulators decide who may participate in the market through customer-identification and anti-money-laundering (AML) requirements and through assessments of investor suitability [38]. The high leverage of perpetual futures markets makes them enormously attractive to retail investors but also carries a very high risk of liquidation. Regulators face a hard trade-off here: raising the barrier to entry can effectively protect investors who lack the capacity to bear risk, but it also runs counter to the permissionless founding ideal of crypto markets and lowers the market's overall accessibility.
25.8.2 The applicability of existing frameworks
Applying traditional securities and derivatives regulatory frameworks directly to perpetual futures markets exposes significant misfits. The traditional framework is built on centralized clearing, clear jurisdictional boundaries, and a standardized product life cycle—assumptions that often do not hold in crypto markets.
The European Union's Markets in Financial Instruments Directive II (MiFID II) is one of the most comprehensive financial-market regulatory frameworks in the world. Under the directive, crypto derivatives may be classified as financial instruments and thus become subject to complex reporting, transparency, and best-execution requirements [51]. Yet MiFID II was not designed with the features of perpetual futures—no expiry date and a continuous funding rate—in mind. Its pre-trade and post-trade transparency requirements, when applied to the high-frequency, volatile crypto market, may have unintended negative effects on market makers' quoting strategies. MiFID II also relies on clear clearing and settlement infrastructure, which fundamentally conflicts with the logic of many decentralized exchanges that execute automatically through smart contracts. The European Union's Markets in Crypto-Assets Regulation (MiCA), which formally took effect in December 2024, explicitly excludes crypto derivatives from its direct scope, pushing them back under MiFID II for regulation. This classification decision creates a significant regulatory gap: perpetual futures, the most innovative and also the most risky of crypto derivatives, in practice remain subject to a traditional framework that was not designed for them.
The U.S. Regulation National Market System (Reg NMS) aims to enhance the overall efficiency and fairness of the equity market through unified market-data distribution and order-protection rules [52]. Its core order-protection rule requires exchanges to execute orders at the best price available marketwide. Introducing this principle into perpetual futures markets could, in theory, resolve the spread problems caused by liquidity fragmentation. The reality of crypto markets, however, is that exchanges lack a unified clearing system and interoperability protocols, so best execution across platforms faces extremely high technical and fund-transfer costs. Mandating a Reg NMS-like rule would not only be technically difficult to implement but could also trigger severe execution delays that instead harm market quality.
The distinctive features of perpetual futures markets leave large gaps in the traditional regulatory framework. The first is the absence of a regulatory subject under a decentralized architecture. When a trading protocol runs on immutable smart contracts with no clear centralized operating entity, the traditional model of regulation based on institutional licensing becomes difficult to apply. The second is jurisdictional conflict arising from cross-border liquidity. Crypto assets can be transferred worldwide in an instant, so a single jurisdiction's regulatory ban can often only push trading activity toward more lenient jurisdictions rather than eliminate the risk at its root. The third is the new type of risk introduced by the funding-rate mechanism. Traditional regulation lacks tools for assessing this continuous leverage cost and struggles to effectively measure the hidden exploitation it inflicts on investors under extreme conditions.
25.8.3 The design of regulatory tools
Given the limitations of the traditional regulatory framework, regulators need to design more targeted, dynamic tools—tools that anchor directly to specific market-quality indicators rather than relying solely on static compliance checks.
A liquidity-based leverage cap is an important tool for regulating market resilience. Margin requirements in traditional derivatives markets are typically static or adjusted only periodically according to historical volatility. In perpetual futures markets, there is a tight nonlinear relationship between the leverage ratio and liquidity depth [53]. When market depth is insufficient to absorb large-scale liquidation orders, high leverage readily triggers a liquidation cascade. Regulators could therefore require exchanges to implement a dynamic leverage cap based on real-time order-book depth: permitting higher leverage in the liquidity-rich normal state to lower transaction costs, and automatically lowering the maximum permitted leverage in a liquidity-exhausted stressed state, thereby enhancing the market's shock-absorbing capacity without entirely sacrificing capital efficiency.
A resilience-based insurance-fund requirement is another key mechanism for guarding against systemic risk. At present, the size of most exchanges' insurance funds is determined by their internal models, without transparency or external oversight. Regulators could introduce a mechanism similar to stress testing in traditional banking, requiring an exchange's insurance fund to be large enough to cover an extreme price shock at a specified confidence level [54]. Such a requirement directly enhances the market's institutional resilience, ensuring that in a black-swan event the profits of winning traders are not subject to a forced clawback because of a counterparty's shortfall.
Market-quality-based regulatory intervention, however, must be wary of unintended consequences. When a jurisdiction imposes strict leverage limits or high capital requirements, the most immediate market reaction is often liquidity migration. Market makers and high-frequency traders quickly move their funds and trading volume to more lightly regulated offshore platforms. This loss of liquidity widens spreads and raises impact costs in the regulated market, ultimately putting it at a disadvantage on the transaction-cost and price-discovery dimensions. The design of regulatory tools must therefore strike a delicate balance between enhancing market safety and preserving market competitiveness.
25.8.4 Regulatory arbitrage and international coordination
The global connectivity of the crypto derivatives market and the fragmentation of national regulatory policies have together given rise to widespread regulatory arbitrage, with a significant effect on global market quality.
Different jurisdictions display sharply different attitudes toward regulating perpetual futures, and those attitudes are themselves evolving rapidly [40]. The U.S. regulatory stance has shifted from aggressive enforcement to cautious openness: between 2022 and 2024, the SEC and CFTC filed suits against numerous crypto exchanges, treated most crypto assets as securities, and cracked down hard on unregistered derivatives platforms; but after a new administration took office in early 2025, the SEC withdrew its suits against some exchanges, and the CFTC began exploring a more inclusive framework for regulating derivatives. This policy shift may significantly improve the accessibility dimension of the U.S. market, but its long-term effect on resilience and fairness remains to be seen. The European Union, for its part, has sought to establish a unified compliance framework through the Markets in Crypto-Assets Regulation, though ambiguity remains in the classification of derivatives. By contrast, some offshore financial centers in Asia and the Caribbean have adopted a more lenient regulatory stance, attracting the registration of many crypto-native exchanges. The direct consequence of these regulatory differences is that global perpetual futures liquidity is highly concentrated on a few offshore platforms.
The effect of regulatory arbitrage on market quality is two-sided. On one hand, it gives participants a channel to escape stringent regulation, letting the perpetual futures market achieve very high accessibility and low transaction costs at low compliance cost. On the other, it severely harms the market's overall fairness and resilience. Offshore platforms often lack rigorous investor-protection mechanisms and transparent market-maker rules, exposing retail investors on these platforms to very high risks of manipulation and systemic collapse. When a crisis strikes an offshore platform, moreover, the absence of a lender of last resort and clear bankruptcy-resolution procedures allows its negative effects to spread rapidly to global markets through the price-transmission mechanism.
International coordination is the fundamental route to resolving regulatory arbitrage, but it faces enormous limits in practice. Although international bodies such as the Financial Stability Board and the International Organization of Securities Commissions have issued high-level recommendations on crypto-asset regulation, a binding, globally unified regulatory framework remains out of reach, owing to fundamental disagreements among countries over financial sovereignty, tolerance for innovation, and philosophies of investor protection [55]. Absent global coordination, a single country's stringent regulation can often only cost its own investors the opportunity to participate in global pricing, without truly eliminating the structural risks inherent in crypto markets. Future regulatory evolution may therefore rely more on bilateral agreements among major economies and on coordinated control over the fiat on- and off-ramp channels for key fiat currencies.
25.9 Technological change and institutional evolution
The evolutionary trajectory of market quality is not linear growth along a single dimension but a complex process in which technical innovation and institutional regulation interact. Technical progress can significantly lower trading friction and improve the efficiency of information processing, but it does not automatically bring an all-around improvement in market quality. On the contrary, the introduction of new technology, while solving old frictions, often creates new structural fragility or fairness imbalances. Assessing the future of market quality turns on discerning whether technical change can reach the fundamental defects of the current market structure and whether institutional evolution can establish a new equilibrium between innovation and stability.
25.9.1 AI market makers
The application of artificial intelligence and machine learning at the microstructure level is reshaping the basic model of liquidity supply. Traditional algorithmic market makers rely on preset parameters and static inventory-control models, whereas AI market makers based on reinforcement learning can dynamically adjust their quoting strategies in response to high-frequency order-flow data [56]. This technical upgrade displays a marked efficiency advantage in normal markets: AI models can predict short-term price direction more accurately, thereby narrowing the bid-ask spread and lowering adverse-selection costs [57]. In inventory management, intelligent algorithms dynamically adjust their position preferences, providing deeper liquidity while maintaining a lower rate of capital utilization, which directly improves the market's overall trading efficiency [58].
The proliferation of AI market makers, however, also introduces new systemic risk. When most liquidity providers in the market adopt similar machine-learning architectures and training datasets, the problem of strategy homogenization becomes acute. Faced with an extreme shock absent from their training data, homogeneous intelligent algorithms may produce highly correlated order cancellations or aggressive, unidirectional closing of positions [59]. This behavioral pattern drains order-book depth during periods of stress, causing liquidity to dry up in an instant and thereby amplifying local price fluctuations into a systemic liquidity crisis.
The behavioral logic of AI market makers during stress reveals an intrinsic conflict between technical efficiency and market resilience. Although intelligent algorithms can compress transaction costs to extremely low levels in calm periods, their risk-avoidance mechanisms often retreat faster in moments of crisis. This means that a liquidity environment dominated by AI may exhibit a highly fragile character: extremely smooth under normal conditions but highly prone to structural rupture in tail-risk events. Assessing the ultimate effect of AI on market quality must therefore go beyond spread metrics under normal conditions and focus on the willingness to supply liquidity under extreme conditions.
25.9.2 On-chain derivatives
Fully on-chain derivatives protocols represent decentralized finance's (DeFi) latest attempt at complex trading structures. Architectures exemplified by dYdX and Hyperliquid seek to reproduce the execution efficiency of centralized exchanges in a permissionless blockchain environment [43] (this dimension is analyzed systematically in Section 25.6). The core advantage of on-chain derivatives lies in the systematic improvement in market fairness that their transparency brings. On centralized platforms, market makers' privileged agreements and internal liquidation parameters are often hidden from ordinary participants; in an on-chain environment, by contrast, the liquidation logic, funding-rate calculation, and order-matching rules are all executed publicly by smart contracts [8]. This architecture eliminates the space for information privileges and opaque operations, placing all market participants on absolutely equal footing at the level of the rules.
Although fairness improves markedly, on-chain derivatives still face the constraints of physical law in execution efficiency and transaction costs. The consensus mechanism of a blockchain network inevitably introduces a delay in state updates, making on-chain order books less efficient than centralized matching engines at processing high-frequency information [45]. This delay not only widens market makers' adverse-selection risk but also creates room for maximal extractable value. When a trader's intent is exposed before it is packed into a block, arbitrageurs can extract rents through sandwich attacks or front-running, which in effect constitutes a hidden trading tax that erodes the price-discovery quality of on-chain markets.
Whether on-chain derivatives can compete with centralized exchanges on liquidity depth depends on whether their architecture can effectively balance decentralization against capital efficiency. Current data indicate that although leading on-chain protocols can support the opening of positions on the order of tens of millions of dollars while maintaining reasonable price impact [60], the variability of their liquidity is significantly higher than that of centralized platforms [43]. Under extreme conditions, constrained by the throughput bottleneck of the underlying chain, the on-chain liquidation mechanism may fail because of network congestion, triggering a more severe systemic cascade. The future evolution of on-chain derivatives therefore needs to find a new design space between technical breakthroughs at the consensus level and risk isolation at the application level.
25.9.3 Cross-chain liquidity integration
The proliferation of independent blockchains has made liquidity fragmentation the most severe structural obstacle to crypto-asset market quality. The liquidity of a single asset is dispersed across many independent blockchain networks and protocols, thinning the depth of local markets, enlarging price impact, and thereby pushing up overall transaction costs [61]. This physical isolation impedes the flow of capital to the most efficient trading venues, leaving the price-discovery processes on different chains mutually independent and weakening the pricing efficiency of the global market [62].
The development of cross-chain interoperability protocols offers a technical path out of this predicament. Infrastructure exemplified by LayerZero and Chainlink CCIP establishes standardized cross-chain message-passing mechanisms that let assets and state transfer securely between networks [63]. Such liquidity integration not only lets traders access the globally best quote but also greatly reduces the friction of cross-chain arbitrage. When arbitrageurs can iron out price differences across chains with lower latency and cost, the market's overall informational efficiency improves significantly, and the price-discovery process evolves from a locally fragmented state into a globally coordinated whole [64].
Cross-chain liquidity integration, however, likewise faces serious technical and regulatory challenges. On the technical side, the security model of cross-chain bridges often becomes the weakest link in the entire system; once validator nodes are compromised or a smart contract contains a vulnerability, the integrated liquidity pool faces the risk of devastating asset loss. On the regulatory side, the flow of cross-chain assets blurs jurisdictional boundaries, making anti-money-laundering and compliance monitoring exceptionally difficult. How to build a technical firewall strong enough to withstand systemic contagion, and to meet compliance requirements, while achieving unified liquidity is an obstacle that cross-chain integration must clear on its way to maturity.
25.9.4 Long-term equilibrium
The long-term evolution of market quality can be conceptualized as a dynamic game among competition, innovation, and regulation. Competitive pressure is the most direct force driving improvements in market quality. To compete for market share and liquidity providers, exchanges continually compress fees, optimize matching engines, and offer richer product lines [65]. This commercially driven competition has produced an order-of-magnitude decline in transaction costs over the past 10 years while also driving continual growth in order-book depth.
Technical innovation, in turn, plays the role of breaking the existing equilibrium. Whether through innovations in the mathematical models of automated market makers or through architectural breakthroughs in cross-chain protocols, innovation provides new tools for resolving old frictions. Yet innovation is often unpredictable: while raising efficiency in one respect, it may harm market fairness or introduce new fragility [66]. Regulatory pressure then becomes the necessary constraint that steers market quality toward the socially optimal direction. Through minimum-capital requirements, mandatory disclosure, and limits on conflicts of interest, the regulatory framework aims to protect participants at an information disadvantage and to guard against the accumulation of systemic risk [67].
Competition, innovation, and regulation together shape the trade-off frontier of market quality. Excessively strict regulation may suppress technical innovation and entrench the competitive advantages of existing oligopolies, impeding further declines in transaction costs; wholly unrestrained competition and innovation, on the other hand, may tilt the market toward an extreme pursuit of efficiency at the expense of fairness and stability. The future of market quality will depend on how these three forces reach a new institutional equilibrium. Only when technical innovation is steered toward resolving fundamental defects, and the regulatory framework can adapt to the features of decentralized architectures, can the perpetual futures market build the deep resilience to withstand extreme shocks while maintaining efficient price discovery.
Figure 25-9 uses a competition-innovation-regulation triangular-game framework to present how these three forces pull differentially on the five dimensions of market quality: the efficiency-oriented dimensions (transaction costs, price discovery) are pulled by the competition-innovation axis and improve rapidly, the institutional-safeguard dimensions (resilience, fairness) strengthen as they draw closer to the regulation vertex, and accessibility occupies a bridging position. The long-term evolution of market quality cannot be dominated by any single force but depends on the equilibrium position of the three forces within a specific institutional environment: when competitive and innovative pressures are too great and regulatory constraints too weak, the efficiency-oriented dimensions are pushed to an extreme and resilience and fairness may deteriorate severely; conversely, excessive regulation may lock the market into a low-efficiency but superficially stable equilibrium.
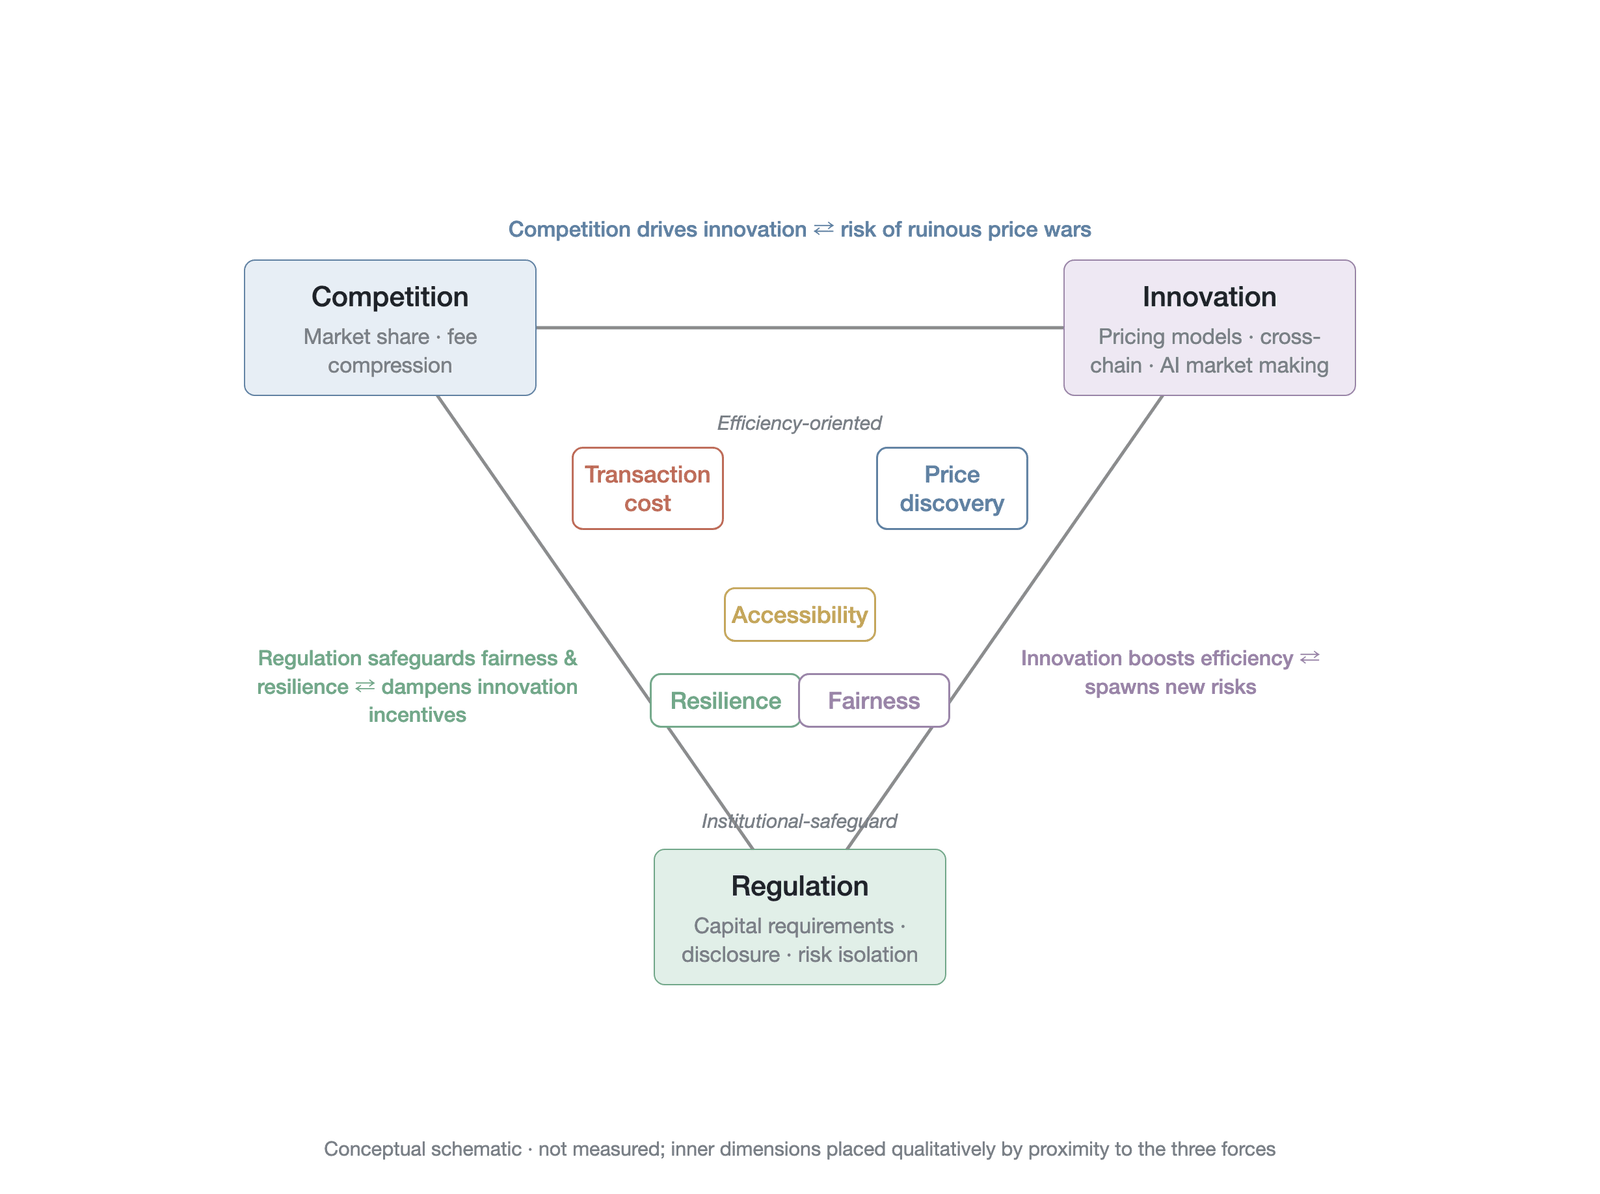
Figure 25-9. The triangular-game framework of market-quality evolution (conceptual illustration, not measured data; an integrated analysis based on market microstructure theory [66][67])
25.10 Chapter summary
Market quality is a multidimensional, dynamically evolving systemic concept. Traditional market microstructure research has tended to focus on single-dimension analysis—using the bid-ask spread as a proxy for liquidity, for example, or the information share as a measure of price discovery [3]. A single-dimension assessment, however, cannot capture the global characteristics of market structure, especially in an innovative derivatives market like perpetual futures that lacks centralized clearing and permits high leverage. The five-dimensional model constructed in this chapter (transaction costs, price discovery, resilience, fairness, and accessibility) provides a comprehensive evaluation framework that reveals the structural characteristics of the perpetual futures market across its different dimensions.
These five dimensions are not mutually independent but harbor intrinsic tensions: improvements in liquidity often come at the cost of declining resilience—the extremely narrow bid-ask spreads of high-frequency market makers lower transaction costs in normal times, but their rapid order cancellations during extreme volatility also amplify the risk of liquidity exhaustion [68]; and between fairness and efficiency, and between accessibility and fairness, there exist the same systematic trade-offs described in Section 25.1.4. These trade-offs show that no market attains the optimum on all dimensions, and constructing a composite index necessarily involves assigning weights to the different dimensions—an assignment that essentially reflects the value preferences of a particular set of market participants or regulators.
Over the past 10 years of evolution, the improvement in perpetual futures market quality has been markedly asymmetric. As analyzed in Section 25.7.4, the dimensions driven directly by competition have improved fastest—transaction costs have fallen sharply and the leadership position in price discovery has grown ever firmer [69]—whereas dimensions that require institutional change to support them, such as resilience and fairness, have progressed slowly, and market-maker privileges and information asymmetry still leave ordinary traders at a structural disadvantage [4]. This asymmetric evolution shows that the expansion of market size and the deepening of liquidity cannot automatically eliminate structural defects; improving the institutional-safeguard dimensions must rely on deliberate institutional design and external regulatory intervention.
Assessing market quality is not only a diagnosis of the current state of the market but also an integrative framework for market microstructure research. Liquidity sets the baseline for transaction costs, arbitrage efficiency shapes the boundary of price discovery, the characteristics of volatility reflect the level of market resilience, and governance mechanisms fundamentally define the market's fairness and accessibility. The perpetual futures market's lead on the efficiency-oriented dimensions (transaction costs and price discovery) demonstrates the value of its mechanism innovation, but its persistent lag on the institutional-safeguard dimensions (resilience and fairness) exposes the systemic risk of unconstrained development. As the bridging dimension linking efficiency and institutions, accessibility shows a structural advantage in decentralized architectures but still needs continual improvement in user experience and technical barriers. Chapter 26 will approach, from the standpoint of regulatory economics, how to find the optimal balance between innovation and stability.
References
[1] Ruan, Q., & Streltsov, A. (2025). Perpetual futures contracts and cryptocurrency market quality: Insights from emerging markets. Cornell SC Johnson College of Business. https://business.cornell.edu/article/2025/02/perpetual-futures-contracts-and-cryptocurrency/
[2] Stigler, G. (1961). The economics of information. Journal of Political Economy, 69(3), 213-225.
[3] O'Hara, M. (1995). Market Microstructure Theory. Blackwell Publishers.
[4] Harris, L. (2003). Trading and Exchanges: Market Microstructure for Practitioners. Oxford University Press.
[5] Amihud, Y. (2002). Illiquidity and stock returns: Cross-section and time-series effects. Journal of Financial Markets, 5(1), 31-56. https://doi.org/10.1016/s1386-4181(01)00024-6
[6] Ruan, Q., & Streltsov, A. (2022). Perpetual futures contracts and cryptocurrency market quality. SSRN Electronic Journal. https://doi.org/10.2139/ssrn.4218907
[7] Barbon, A., & Ranaldo, A. (2024). On the quality of cryptocurrency markets: Centralized versus decentralized exchanges. arXiv preprint arXiv:2112.07386v7. https://doi.org/10.48550/arXiv.2112.07386
[8] Capponi, A., & Jia, R. (2025). Liquidity provision on blockchain-based decentralized exchanges. The Review of Financial Studies, 38(10), 3040–3085. https://doi.org/10.1093/rfs/hhaf046
[9] Alexander, C., Choi, J., Massie, H. R. A., & Sohn, S. (2020). Price discovery and microstructure in ether spot and derivative markets. International Review of Financial Analysis, 71, 101506. https://doi.org/10.2139/ssrn.3511533
[10] Binance. (2026). USDⓈ-M Futures Trading Fee Rate. Retrieved from https://www.binance.com/en/fee/futureFee
[11] OKX. (2026). Trading Fee | Fee Rate | Crypto Exchange Fees. Retrieved from https://www.okx.com/fees
[12] Petersen, M. A., & Fialkowski, D. (1994). Posted versus effective spreads: Good prices or bad quotes? Journal of Financial Economics, 35(3), 269-292.
[13] Jain, A. (2025, September 5). Comparing hidden trading costs: Liquidity analysis across six major platforms [Commercial review]. Analytics Insight. Retrieved June 24, 2026, from https://www.analyticsinsight.net/
[14] Kasinski, D. (2025). Digital asset funding rates as a distinct risk factor: Evidence from a systematic harvesting approach. Available at SSRN 5551719.
[15] Hasbrouck, J. (1995). One security, many markets: Determining the contributions to price discovery. Journal of Finance, 50(4), 1175-1199. https://doi.org/10.1111/j.1540-6261.1995.tb04054.x
[16] Gonzalo, J., & Granger, C. (1995). Estimation of common long-memory components in cointegrated systems. Journal of Business & Economic Statistics, 13(1), 27-35.
[17] He, S., Manela, A., Ross, O., & von Wachter, V. (2022). Fundamentals of perpetual futures. arXiv preprint arXiv:2212.06888. https://doi.org/10.48550/arXiv.2212.06888
[18] Robertson, K., & Zhang, R. (2025). Price discovery in bitcoin spot and futures markets. Journal of International Money and Finance, 159, 103415. https://doi.org/10.1016/j.jimonfin.2025.103415
[19] Kyle, A. S. (1985). Continuous auctions and insider trading. Econometrica, 53(6), 1315-1335. https://doi.org/10.2307/1913210
[20] Ali, Z. (2025). Anatomy of the Oct 10-11, 2025 crypto liquidation cascade: Macroeconomic triggers, market microstructure, and systemic risk lessons. Available at SSRN 5611392.
[21] Large, J. (2007). Measuring the resiliency of an electronic limit order book. Journal of Financial Markets, 10(1), 1-25. https://doi.org/10.1016/j.finmar.2006.09.001
[22] Samani, K. (2020). March 12: The day crypto market structure broke (Part 1). Multicoin Capital.
[23] Chen, Z., He, Z., & Wei, W. (2024). Margin rules and margin trading: Past, present, and implications. Annual Review of Financial Economics, 16, 153–177. https://doi.org/10.1146/annurev-financial-110921-102509
[24] Gornall, W., Rinaldi, M., & Xiao, Y. (2025). Funding payments crisis-proofed bitcoin's perpetual futures [Working paper]. European Corporate Governance Institute (ECGI).
[25] Bouri, E., Kamal, E., & Kinateder, H. (2023). FTX collapse and systemic risk spillovers from FTX Token to major cryptocurrencies. Finance Research Letters, 56, 104099. https://doi.org/10.1016/j.frl.2023.104099
[26] Corbet, S., & Muñiz, J. A. (2025). When cryptocurrency collapses: Systemic risk transmission and corporate finance. Available at SSRN 5904822.
[27] Vidal-Tomás, D., Briola, A., & Aste, T. (2023). FTX's downfall and Binance's consolidation: The fragility of centralised digital finance. Physica A: Statistical Mechanics and its Applications, 625, 129044. https://doi.org/10.1016/j.physa.2023.129044
[28] Angel, J. J., & McCabe, D. (2013). Fairness in financial markets: The case of high frequency trading. Journal of Business Ethics, 112(4), 585-595.
[29] Lin, Y., Swan, P. L., & Harris, F. H. deB. (2019). Why maker-taker fees improve exchange quality: Theory and natural experimental evidence. Available at SSRN 3034901. https://doi.org/10.2139/ssrn.3034901
[30] Glosten, L. R., & Milgrom, P. R. (1985). Bid, ask and transaction prices in a specialist market with heterogeneously informed traders. Journal of Financial Economics, 14(1), 71-100. https://doi.org/10.1016/0304-405x(85)90044-3
[31] Malinova, K., & Park, A. (2015). Subsidizing liquidity: The impact of make/take fees on market quality. The Journal of Finance, 70(2), 509-536. https://doi.org/10.1111/jofi.12230
[32] Commodity Futures Trading Commission. (2022). Complaint for Injunctive and Other Equitable Relief and for Civil Monetary Penalties: CFTC v. Samuel Bankman-Fried, FTX Trading Ltd., and Alameda Research LLC. https://www.cftc.gov/media/8021/enfftxtradingcomplaint122122/download
[33] Securities and Exchange Commission. (2022). Complaint: SEC v. Samuel Bankman-Fried. https://www.sec.gov/files/litigation/complaints/2022/comp-pr2022-219.pdf
[34] McMenamin, C., Daza, V., & Fitzi, M. (2022). Fairtradex: A decentralised exchange preventing value extraction. Proceedings of the 2022 ACM CCS Workshop on Decentralized Finance and Security, 21-30.
[35] Daian, P., Goldfeder, S., Kell, T., Li, Y., Zhao, X., Bentov, I., ... & Juels, A. (2019). Flash boys 2.0: Frontrunning, transaction reordering, and consensus instability in decentralized exchanges. arXiv preprint arXiv:1904.05234. https://doi.org/10.48550/arXiv.1904.05234
[36] Uniswap Labs. (2025). What is Maximal Extractable Value (MEV)? https://blog.uniswap.org/maximal-extractable-value-mev
[37] Milionis, J., Moallemi, C. C., Roughgarden, T., & Zhang, A. L. (2022). Automated market making and loss-versus-rebalancing. arXiv preprint arXiv:2208.06046. https://doi.org/10.48550/arXiv.2208.06046
[38] Johnson, K. N. (2021). Decentralized finance: Regulating cryptocurrency exchanges. William & Mary Law Review, 62(6), 1911. https://doi.org/10.2139/ssrn.3831439
[39] Demirgüç-Kunt, A., Klapper, L., Singer, D., & Ansar, S. (2022). The Global Findex Database 2021: Financial Inclusion, Digital Payments, and Resilience in the Age of COVID-19. World Bank. https://doi.org/10.1596/978-1-4648-1897-4
[40] Dell'Erba, M., & Vianelli, A. (2025). Crypto-derivatives regulation(s). Cornell International Law Journal (forthcoming). https://papers.ssrn.com/sol3/papers.cfm?abstract_id=5895082 https://doi.org/10.2139/ssrn.5895082
[41] Chainalysis. (2025). The 2025 Geography of Cryptocurrency Report. Retrieved June 24, 2026, from https://go.chainalysis.com/2025-geography-of-cryptocurrency-report.html
[42] Hasbrouck, J., Rivera, T. J., & Saleh, F. (2024). An economic model of a decentralized exchange with concentrated liquidity. Management Science. Advance online publication. https://doi.org/10.1287/mnsc.2024.04510
[43] Ved, T. (2025). Inside dYdX: On-chain perpetual futures. Coin Metrics State of the Network. https://coinmetrics.substack.com/p/state-of-the-network-issue-318
[44] Makarov, I., & Schoar, A. (2020). Trading and arbitrage in cryptocurrency markets. Journal of Financial Economics, 135(2), 293-319.
[45] Chainlink. (2026). DeFi derivatives: The future of onchain trading. https://chain.link/article/defi-derivatives
[46] Madhavan, A. (2000). Market microstructure: A survey. Journal of Financial Markets, 3(3), 205-258. https://doi.org/10.1016/s1386-4181(00)00007-0
[47] Bongaerts, D., & Van Achter, M. (2016). High-frequency trading and market stability [Working paper]. SSRN. https://doi.org/10.2139/ssrn.2698702
[48] International Monetary Fund. (2015). Market liquidity -- Resilient or fleeting? Global Financial Stability Report.
[49] Financial Stability Board. (2025). Recommendations to address financial stability risks created by leverage in nonbank financial intermediation. https://www.fsb.org/2025/07/
[50] Easley, D., O'Hara, M., & Yang, L. (2016). Differential access to price information in financial markets. Journal of Financial and Quantitative Analysis, 51(4), 1071-1110. https://doi.org/10.1017/s0022109016000491
[51] Financial Conduct Authority. (2018). Cryptocurrency derivatives statement. https://www.fca.org.uk/news/statements/cryptocurrency-derivatives
[52] Securities and Exchange Commission. (2005). Regulation NMS. Release No. 34-51808.
[53] International Swaps and Derivatives Association. (2025). Policy ideas to enhance market liquidity and risk management. https://www.isda.org/
[54] Aramonte, S., Huang, W., & Schrimpf, A. (2021). DeFi risks and the decentralisation illusion. BIS Quarterly Review, December 2021.
[55] Draganidis, S. (2023). Jurisdictional arbitrage: Combatting an inevitable by-product of cryptoasset regulation. Journal of Financial Regulation and Compliance, 31(2), 170-185.
[56] Kearns, M., & Nevmyvaka, Y. (2013). Machine learning for market microstructure and high frequency trading. High Frequency Trading: New Realities for Traders, Markets, and Regulators, 1-22.
[57] Chakrabarty, B., & Pascual, R. (2023). Stock liquidity and algorithmic market making during the COVID-19 crisis. Journal of Banking & Finance, 147, 106415. https://doi.org/10.1016/j.jbankfin.2022.106415
[58] DWF Labs. (2025). The impact of AI on crypto trading and market making. https://www.dwf-labs.com/news/the-impact-of-ai-on-crypto-trading-and-market-making
[59] Bogoev, D. (2025). Liquidity pricing and crisis: New metrics from traditional and blockchain-based markets. Durham University Theses.
[60] GMX. (2026). GMX | Decentralized perpetual exchange. https://gmx.io/
[61] Sim, J. Y., Chun, H., & Park, J. (2025). Toward unified liquidity in cryptocurrency markets: A comparative survey and architectural perspective. International Journal of Advanced Smart Convergence, 14(2), 33–45. https://doi.org/10.7236/IJASC.2025.14.2.33
[62] Johnson, W. C., & Scharnowski, S. (2025). Price discovery through wrapped tokens. Economics Letters, 257, 112703. https://doi.org/10.1016/j.econlet.2025.112703
[63] Chainlink. (2026). Multi-chain liquidity integration: Unifying fragmented assets. https://chain.link/article/multi-chain-liquidity-integration
[64] Lao, X., Chen, S., & Wang, Q. (2025). FLUXLAYER: High-performance design for cross-chain fragmented liquidity. IEEE International Conference on Blockchain and Cryptocurrency.
[65] OECD. (2023). Competition and innovation, Part I: A theoretical perspective. OECD Competition Committee.
[66] Auer, R., Farag, M., Lewrick, U., Orazem, L., & Zoss, M. (2022). Banking in the shadow of Bitcoin? The institutional adoption of cryptocurrencies. BIS Working Papers No. 1013.
[67] Rana, H. A., Audi, M., & Ali, A. (2025). Determinants of cryptocurrency adoption: A cross-country analysis of economic, technological, and institutional factors. Journal of Social Signs Review, 3(8), 58–76.
[68] Alexander, A. (2025). The impact of market-making incentives on crypto liquidity & price stability. Available at SSRN 5143194. https://doi.org/10.2139/ssrn.5143194
[69] Griffith, T., & Clancey-Shang, D. (2023). Cryptocurrency regulation and market quality. Journal of International Financial Markets, Institutions and Money, 84, 101744. https://doi.org/10.1016/j.intfin.2023.101744