On December 18, 2024, the Federal Open Market Committee (FOMC) of the Federal Reserve released its final interest rate decision of the year. Within seconds of the release, the microstructure of the digital asset market displayed its distinctive complexity. The price of Binance's Bitcoin perpetual futures fell 1.2%, Coinbase's spot price fell only 0.7%, and on the decentralized derivatives protocol Hyperliquid an oracle-update delay meant that the price had not yet fully caught up. This rapid divergence caused the basis of the perpetual futures relative to spot to widen abruptly from +15 basis points (bps) to +65 bps. Within a short window after the divergence emerged, three types of arbitrage mechanism engaged simultaneously. High-frequency traders' automated systems detected the price gap between Binance and Coinbase at microsecond resolution and executed cross-market hedges. Systematic quantitative funds detected the abnormally widened basis between spot and perpetual futures, which triggered signals to open basis-arbitrage positions. And on-chain-native MEV (maximal extractable value) searchers captured the 42-bps gap between Hyperliquid's oracle price and the real-time price on centralized exchanges. Starting from their respective areas of specialization, these three forces converged on a single objective: eliminating the spread. Over the following tens of seconds, the basis was gradually compressed back to +22 bps; by the end of the first minute, prices across the three markets had realigned tightly. The market dynamics of these 30 seconds crystallize the central questions of this chapter: Who drives the rapid convergence of prices, and what does their profit-seeking behavior mean for the efficiency of the market as a whole? (This passage is a stylized scenario reconstructed from real market mechanisms; the specific figures are illustrative and do not constitute a precise observational record of any particular event.)
These questions carry us from the descriptive analysis of Chapter 15 to the causal analysis of this chapter. Using an "efficiency spectrum" framework, Chapter 15 systematically assessed the level of efficiency in the digital asset market and revealed its pronounced heterogeneity across assets, platforms, and time. The central task of this chapter is to dissect the mechanisms by which market efficiency is generated, maintained, and self-repaired. In a crypto market that lacks a central clearinghouse, unified regulation, and standardized settlement infrastructure, the traditional financial definition of arbitrage as the "capture of riskless profit" proves inadequate: it cannot explain why spreads persist, nor can it fully capture the systemic function that arbitrage performs in this ecosystem. This chapter therefore proposes the arbitrage infrastructure hypothesis: arbitrageurs are not merely passive correctors of price deviations but active providers of market infrastructure. Their profit-seeking behavior, in effect, performs three key infrastructure functions: along the price-linkage dimension it partly serves as a cross-market price-transmission bus (but does not assume the concentrated management of counterparty credit risk or the default-fund functions of a traditional central counterparty); through continuous basis arbitrage it provides the stabilizing mechanism that anchors perpetual-futures prices, substituting for the delivery at maturity of traditional futures; and it integrates the local liquidity dispersed across hundreds of isolated exchanges and protocols into a virtual global liquidity pool.
Building on this theoretical perspective, the chapter analyzes the arbitrage ecosystem of the digital asset market at three levels. Theoretically, it re-examines the shift of arbitrage from the capture of "riskless profit" to the provision of "infrastructure services" and dissects the multi-tiered ecological structure formed by high-frequency traders, quantitative funds, protocol-level arbitrageurs, MEV searchers, and individual traders. Mechanistically, it decomposes the sources of return and the efficiency contributions of six core mechanisms: spot-perpetual basis arbitrage, cross-exchange arbitrage, spot-futures-perpetual triangular arbitrage, funding rate arbitrage, cross-asset statistical arbitrage, and CEX-DEX cross-tier arbitrage. At the level of transmission, it constructs an "arbitrage-efficiency transmission model" that explains how micro-level arbitrage behavior propagates to macro-level market efficiency through price calibration, information aggregation, and liquidity integration, thereby forming a causal bridge to the efficiency diagnosis of Chapter 15.
16.1 The theoretical foundations of arbitrage
In financial theory, arbitrage is regarded as the core mechanism driving market efficiency—a persistent price-correcting force that pushes deviating asset prices back toward their intrinsic value. Yet when this classical theoretical framework is applied to the emerging domain of digital assets, a series of striking anomalies comes into view. The crypto market—a distinctive ecosystem of globalized, fragmented, around-the-clock (24/7) trading and complex derivatives—not only challenges the conventional understanding of riskless arbitrage but forces a reconsideration of the fundamental role that arbitrageurs play in the market. The systematic violation of the classical law of one price in the crypto market is the starting point for rethinking the nature of arbitrage. By replacing delivery at maturity with a funding rate mechanism, perpetual futures fundamentally alter the logic of arbitrage, transforming it from a one-off convergence-at-maturity trade into an ongoing position-management activity. This paradigm shift provides the micro-mechanistic foundation for the chapter's central theoretical contribution: the arbitrage infrastructure hypothesis.
16.1.1 The persistence paradox of the law of one price
One of the most basic and intuitive principles in economics is the law of one price. It holds that in an efficient market free of trading frictions—such as transaction costs, taxes, or capital controls—any homogeneous asset should have only one price, wherever it is traded. If a price gap appears, rational arbitrageurs profit by buying in the low-price market and selling in the high-price market, and their actions quickly erase the gap and restore equilibrium. In mature traditional financial markets, such as equity or foreign exchange markets, the law of one price holds to a high degree almost all the time. Brief deviations occasionally occur, but they are typically eliminated within milliseconds or seconds by high-frequency trading algorithms.
In the crypto asset market, however, the situation is entirely different. There, the law of one price is not a stable empirical regularity but a theoretical assumption that is systematically and persistently violated. Early academic research on crypto markets quickly identified this striking phenomenon. Makarov and Schoar (2020) [1] were the first to systematically document the vast arbitrage opportunities pervasive in crypto markets. Analyzing Bitcoin trading data from dozens of exchanges worldwide, they found that cross-exchange spreads were not only large but persistent. They reported that cross-border spreads were far larger than spreads within a single country: about 3% between the United States and Europe, about 10% between Japan and the United States, and about 15%—peaking above 40%—between Korea and the United States. For example, the "kimchi premium" of the Korean market relative to the U.S. market once exceeded 40% at the peak of the bull market in late 2017 and early 2018, meaning that buying Bitcoin in Korea cost nearly half again as much as buying it in the United States.
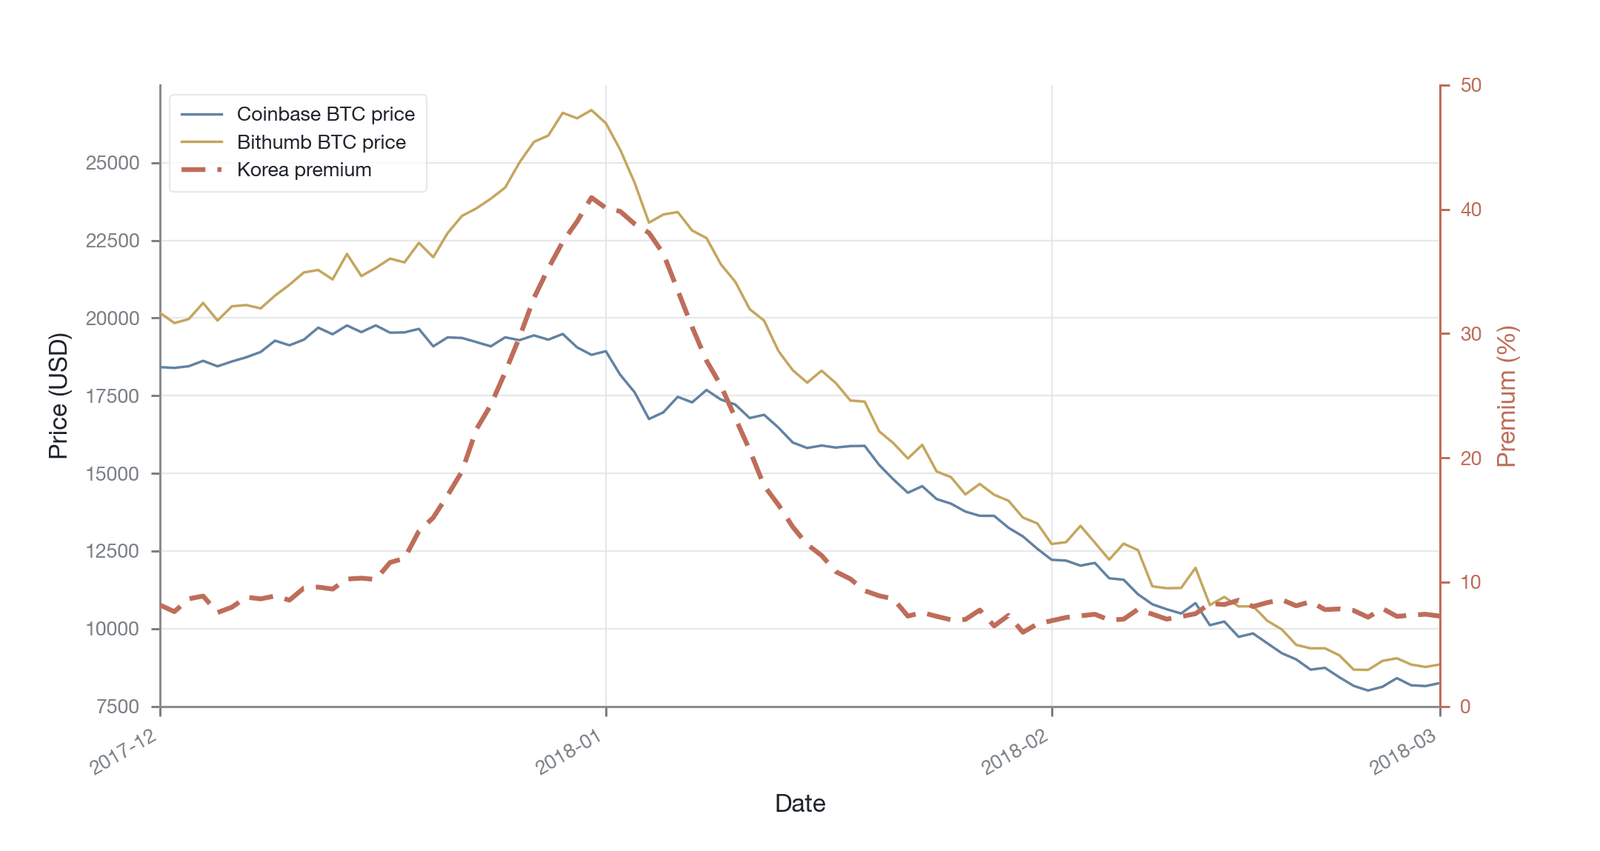
Figure 16-1. Cross-exchange Bitcoin price spreads, December 2017 to February 2018 (this figure focuses on the Korea-versus-U.S. kimchi premium, which peaked above 40%; the cross-border spreads of about 3% for U.S.-Europe and about 10% for Japan-U.S. are discussed in the text; data source: Makarov & Schoar 2020 [1])
These spreads were not fleeting price deviations but structural phenomena that could persist for hours, days, or even weeks. Makarov and Schoar estimated that, over their sample period, the theoretically capturable arbitrage profit exceeded $75 million per day on average. This raises a central paradox: if such a large and substantial space for riskless profit existed, why did rational arbitrageurs fail to eliminate it quickly, as classical theory would predict?
This "persistence paradox" is the starting point for understanding arbitrage mechanisms in crypto markets. It strongly suggests that treating arbitrage in crypto markets simply as the capture of riskless profit is an oversimplification. The answer appears to lie not in arbitrageurs being insufficiently clever or fast, but in the fact that arbitrage in crypto markets faces frictions and costs of a magnitude that traditional markets never encountered. These frictions may arise from strict capital controls across countries, which make it difficult for arbitrageurs to move fiat-currency profits freely from one market to another; from the weak clearing and settlement links between exchanges, which mean that transferring assets across platforms entails time delays and counterparty risk; or from the execution risk and liquidity evaporation that arbitrage exchanges face during sharp price swings. The persistent spreads we observe may therefore be not a sign of complete market inefficiency but rather a monetized pricing of these real "friction costs" that impede the free flow of arbitrage capital. This requires us to shift the analytical framework from an idealized frictionless assumption toward an arbitrage-engineering perspective that takes real-world constraints into account. This perspective aligns closely with the classic analysis of the limits of arbitrage by Shleifer and Vishny (1997) [2]: real-world arbitrageurs are not ideal agents with unlimited capital and zero risk but economic actors subject to multiple constraints—funding constraints, principal-agent problems, and noise-trader risk—so that even in the face of a clear price deviation, their corrective capacity is systematically limited by these constraints. The empirical study of equity-market arbitrage by Mitchell, Pulvino, and Stafford (2002) [3] further corroborates this point: even in mature, highly liquid markets, arbitrageurs are often unable to eliminate known pricing deviations in time because of capital constraints and execution risk, allowing spreads to persist.
16.1.2 From point convergence to flow anchoring
As noted above, the core innovation of perpetual futures is that they replace the delivery-at-maturity regime of traditional futures with a funding rate mechanism, fundamentally changing the logic of arbitrage. The no-arbitrage pricing of traditional futures relies on the cost-of-carry model and on the forced price convergence at maturity, which we term point convergence. Through the funding rate—a continuous cash-flow payment mechanism—perpetual futures extend price anchoring from a discrete point in time into a continuous, dynamic process, forming a new paradigm we call flow anchoring. Under this paradigm, arbitrage is no longer a one-off convergence-at-maturity trade but an ongoing position-management activity: by constructing a delta-neutral position, the arbitrageur earns the profit from basis convergence while continuously collecting the funding rate as compensation for risk.
He et al. (2022) [4] established a rigorous no-arbitrage pricing framework for perpetual futures and revealed a key fact: the deviation between the perpetual-futures price and the theoretical no-arbitrage price is not an anomaly signaling market failure but an equilibrium outcome that reflects the true cost of arbitrage. They found an annualized mean absolute deviation from no-arbitrage prices of as much as 60% to 90%; He et al. emphasize that this magnitude of deviation is significantly larger than the deviations recorded for comparable products in traditional money markets. This measure captures the cumulative deviation of the price from the no-arbitrage benchmark (annualized); its economic meaning can be further understood as the systematic difference between actual financing costs and the theoretical no-arbitrage-implied financing cost, reflecting market frictions and risk premia that the model does not fully capture. Such a large magnitude of deviation is rare in traditional financial markets but is the norm in the crypto world. It reflects the various risks and costs that arbitrageurs must bear when executing basis arbitrage, including transaction fees, slippage, funding costs, and the risk of forced liquidation in extreme conditions. The expected return that arbitrageurs demand must be sufficient to compensate for these costs and risks, so a significant and persistent basis and funding rate is precisely the natural state in which the market reaches equilibrium.
From a macro-financial perspective, this deviation can be decomposed into at least three components. The first is the macro financing cost that reflects the global dollar interest rate environment; during a Federal Reserve tightening cycle, the opportunity cost of arbitrage capital rises, and the equilibrium basis and rate levels increase accordingly. The second is the leverage premium endogenous to the crypto market; during bull markets, participants' excess demand for leverage pushes up the perpetual-futures premium and the funding rate, and this component is strongly procyclical. The third is the purely structural friction cost, including transaction fees, cross-platform fund-transfer delays, and margin lock-up—inherent frictions that do not vary with the macro cycle. Attributing such a large deviation entirely to structural frictions while ignoring the transmission effect of macro-financial conditions could lead to a misjudgment of market efficiency.
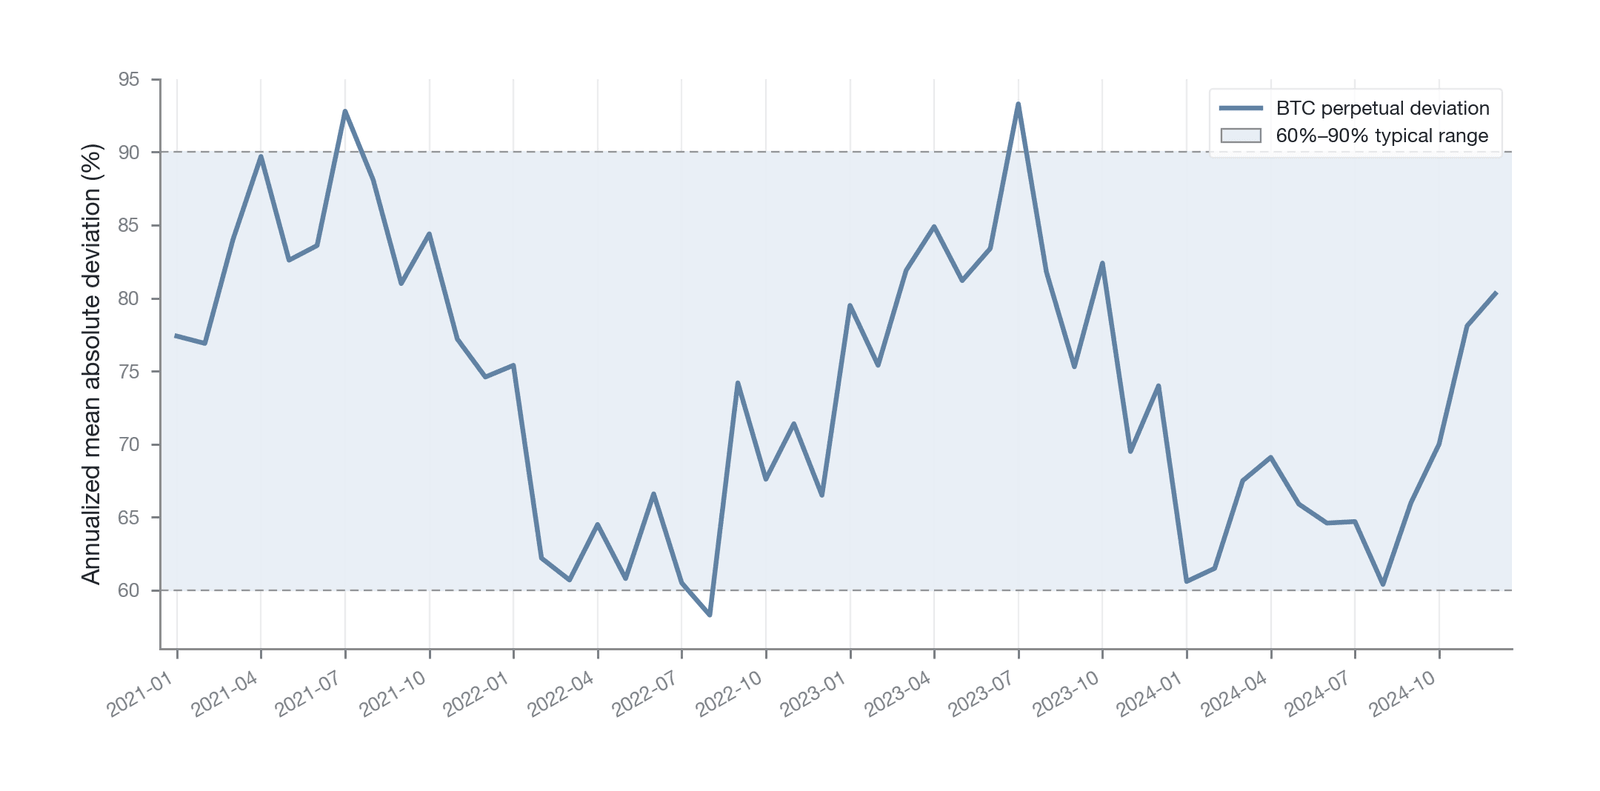
Figure 16-2. Annualized deviation of perpetual futures from no-arbitrage prices (Data source: He et al. 2022 [4])
Figure 16-2 shows that the annualized mean absolute deviation of perpetual futures from no-arbitrage prices remains persistently in the 60%–90% range, far higher than for comparable products in traditional markets—a monetized expression of the costs and risks that arbitrageurs bear.
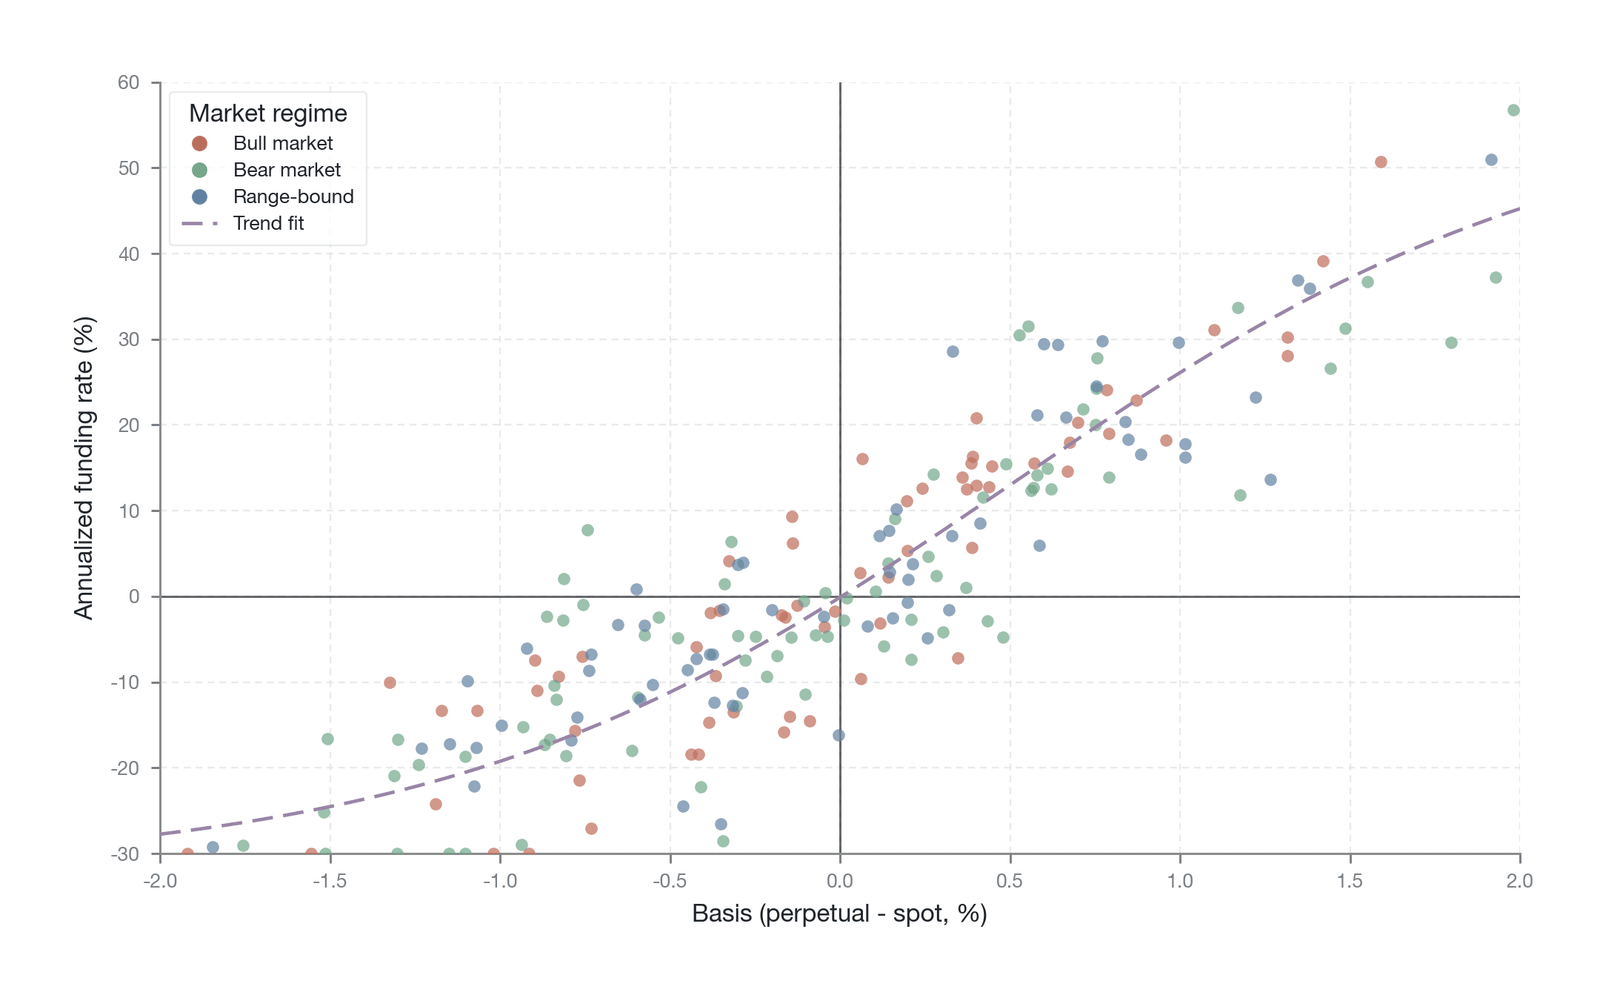
Figure 16-3. The relationship between the funding rate and the basis (Data source: He et al. 2022 [4])
Figure 16-3 depicts the pronounced positive correlation between the funding rate and the perpetual-futures basis: when the basis widens (the perpetual premium rises), the funding rate rises in step, reflecting that the financing cost of maintaining a leveraged long position grows with the premium—the empirical basis of the flow anchoring mechanism.
The emergence of perpetual futures thus marks a paradigm shift in arbitrage theory. It forces us to move our focus from the convergence of prices at some future "point" to the anchoring relationship among prices in the present, driven by a cash "flow." Under this new paradigm, arbitrageurs are no longer mere discoverers of price deviations; they effectively perform the dual functions of liquidity provision and risk management. By continuously managing arbitrage positions, they provide the perpetual-futures market with a critical price-stabilization mechanism, earning a corresponding risk premium in return. This lays a solid micro-mechanistic foundation for the arbitrage infrastructure hypothesis that we propose next.
16.1.3 The arbitrage infrastructure hypothesis
Building on the foregoing analysis of persistent spreads in crypto markets and of the flow anchoring mechanism of perpetual futures, we can now propose an overarching theoretical framework in this chapter: the arbitrage infrastructure hypothesis (AIH). The hypothesis aims to redefine the core role of arbitrageurs in the digital asset market ecosystem and to provide a unified theoretical lens for understanding the various arbitrage activities examined later in the chapter.
The central claim of the arbitrage infrastructure hypothesis is this: in a crypto market that lacks a central clearinghouse and whose regulatory frameworks are still evolving rapidly and have not yet converged on a globally unified standard (although the EU's Markets in Crypto-Assets (MiCA) regulation has been implemented in phases—the stablecoin rules applying from June 2024 and the rules for other issuers and service providers from December 30, 2024, with a transition period running to 2026—so that regulatory frameworks across major jurisdictions are taking shape at an accelerating pace), the role of the arbitrageur has evolved from the "price corrector" of classical financial theory, which reacts passively to price deviations, into an "infrastructure provider" that actively supplies core functions to the market. Their profit-seeking behavior, in effect, builds and maintains three pillar functions on which the market's efficient operation depends:
The first function is the cross-market clearing bus. In the traditional financial system, institutions such as the Depository Trust & Clearing Corporation or central counterparty clearinghouses ensure that trades among different exchanges and market participants can be cleared and settled smoothly and efficiently. The crypto market inherently lacks such centralized institutions, and the individual exchanges are independent of one another. Arbitrageurs—especially high-frequency trading firms—by simultaneously buying and selling across different exchanges, effectively act as the price-transmission hub connecting these independent markets; their capital and technology constitute a cross-market value-transfer network that, along the price-linkage dimension, partly assumes a function that should be provided by a central institution (but does not assume that institution's concentrated management of counterparty credit risk or its default-fund functions; see Proposition 1 below).
The second function is the price-anchoring mechanism. Because of their no-maturity design, perpetual futures lack the convergence-at-maturity mechanism of traditional futures. By continuously hedging between the spot and perpetual-futures markets, basis arbitrageurs anchor the perpetual-futures price around the spot price; their collective action constitutes a dynamic, funding-rate-based, continuous anchoring mechanism that substitutes for delivery at maturity.
The third function is the liquidity-integration network. Liquidity in the crypto market is highly fragmented, dispersed across hundreds of exchanges worldwide, thousands of trading pairs, and two starkly different tiers—centralized and decentralized. Arbitrage activity—particularly cross-exchange arbitrage, cross-asset statistical arbitrage, and CEX-DEX arbitrage—serves to integrate this dispersed liquidity. When a large buy order appears on one exchange, arbitrageurs buy on other exchanges with deeper liquidity or lower prices and sell on the first exchange, thereby transmitting global liquidity to the market where demand is concentrated and forming what this chapter calls the virtual global liquidity pool (the market-wide depth, aggregated from the local liquidity of individual exchanges through arbitrageurs' cross-market transmission, that a single trader can effectively access; at the order-book level it also manifests as a virtual consolidated order book).
Although these three functions derive from similar cross-market trading behavior, they operate on different dimensions and are not equivalent to one another: the price-transmission bus operates on the net transfer of value or positions across participants (the value-flow dimension), the price-anchoring mechanism operates on the continuous-in-time convergence between perpetuals and spot (the time dimension), and the liquidity-integration network operates on the cross-exchange aggregation of available depth (the depth dimension).
The central claim above can be further formalized as the following testable propositions:
Proposition 1 (infrastructure-function substitutability along the price dimension): In a market structure that lacks a central clearinghouse, the collective behavior of arbitrageurs partly substitutes for the functions of a traditional central clearinghouse along price dimensions such as price calibration, liquidity integration, and cross-market value transfer. It must be stressed that this substitution is confined to the price dimension: the concentrated management of counterparty credit risk and the default-fund guarantee that a traditional central counterparty clearinghouse also provides cannot be substituted by dispersed arbitrage behavior. When an exchange defaults (as in the FTX collapse of 2022), arbitrageurs cannot serve as a credit-risk buffer; on the contrary, their cross-platform position exposure may make them transmitters and amplifiers of risk.
Proposition 2 (the cost-function nature of the equilibrium spread): Given the macro interest rate environment and the competitive density of arbitrageurs , the equilibrium level of the cross-market spread is a monotonically increasing function of the cost of providing arbitrage-infrastructure services (including transaction costs, capital costs, technology investment, and risk premia), that is, = f(c \mid r, N), . We retain and explicitly as conditioning variables because the macro financing cost and the competitive density also affect (see Sections 16.6.3 and 16.11); should therefore not be reduced to a single-variable function of .
Corollary 2.1: Any technological or institutional innovation that reduces the arbitrage friction cost will reduce the equilibrium spread —that is, reduce the cost the market pays for the infrastructure service. Two kinds of efficiency must be distinguished. This corollary bears directly on spread efficiency (the law-of-one-price dimension—how wide or narrow the spread is), whereas informational efficiency (the speed and completeness with which prices reflect information) must be measured independently using metrics orthogonal to the spread, such as information share and the speed of price discovery. Where the remainder of this chapter speaks of "improving market efficiency," it means the former when spreads are at issue and the latter when price discovery is at issue; the two should not be conflated.
Proposition 3 (the compensatory nature of returns): The persistent positive returns that arbitrageurs earn are not "abnormal returns" signaling market inefficiency but the reasonable, risk-adjusted economic compensation they receive as infrastructure providers.
The AIH framework allows us to understand many features of the crypto market from a fresh perspective. It stands in sharp contrast to classical arbitrage theory, as shown in Table 16-1:
| Dimension | Arbitrage infrastructure hypothesis (AIH) | Classical arbitrage theory |
|---|---|---|
| Role of the arbitrageur | Infrastructure provider | Price corrector |
| Meaning of the spread | Equilibrium price of an infrastructure service | Sign of market inefficiency |
| Core assumption | Frictions and costs present | Frictionless / perfectly competitive |
| Market structure | Fragmented / no central clearing | Unified, centrally cleared market |
| View of efficiency | Dynamic-equilibrium efficiency | Perfectly efficient market attainable |
| View of risk | Arbitrage has costs and risks | Arbitrage is riskless |
Table 16-1. Classical arbitrage theory versus the arbitrage infrastructure hypothesis (Data source: constructed by the author)
This framework matters, first, because it explains the "persistence paradox" raised in Section 16.1.1. The persistently positive arbitrage returns in crypto markets are not "costless returns" signaling market inefficiency but the reasonable economic reward that arbitrageurs earn as infrastructure providers for bearing risk and investing capital and technology. The spreads we observe are, in essence, the fees the market pays for these "infrastructure services." Second, the AIH provides a coherent logic for the discussions in the chapters that follow. This framework resonates with the theoretical analysis of Gromb and Vayanos (2010) [5] on the relationship between arbitrageurs' capital constraints and financial stability: when the capital base of the arbitrage infrastructure is shocked, its market-stabilizing function can reverse. The arbitrage risks that Chapter 17 will examine can, under the AIH framework, be reinterpreted as "fragilities of the infrastructure," while the arbitrage failures and market anomalies that Chapter 18 will analyze can be seen as "local or systemic ruptures of the infrastructure." Finally, the AIH directly links micro-level arbitrage behavior to the macro-level market-efficiency-spectrum framework of Chapter 15: the efficiency level of a market is, to a large extent, a function of the completeness, robustness, and cost of the arbitrage infrastructure behind it. The more complete the arbitrage infrastructure, the lower its service cost (the equilibrium spread) and the higher the market's efficiency.
16.1.4 The Grossman-Stiglitz paradox
In discussions at the frontier of arbitrage theory, it is worth introducing a classic proposition in financial economics—the Grossman-Stiglitz paradox—and examining its distinctive expression in crypto markets. This paradox provides an important theoretical precedent for the AIH sub-claim that "the equilibrium spread is persistently positive" (namely Propositions 2 and 3 below) and reveals the intrinsic tension in market efficiency and the nature of dynamic equilibrium. The paradox does not, by itself, directly support the stronger core metaphor that "arbitrageurs are infrastructure providers."
Grossman and Stiglitz (1980) [6] posed a central question: if a market is fully informationally efficient—that is, if all information is already fully reflected in prices—then it would be unprofitable for any individual or institution to spend resources gathering and analyzing information. But if no one has an incentive to gather information, how could prices come to reflect all information and thereby become efficient? The paradox points to a conclusion: a fully informationally efficient market is logically impossible. A market must contain some degree of "inefficiency"—prices must deviate from fundamental value—so as to provide a sufficient return to those who bear the cost of acquiring information, keeping them engaged in information discovery.
We can now extend this classic paradox, by analogy, to the arbitrage context of crypto markets. A caveat must be drawn first—the two are structurally isomorphic but concern different objects: the original Grossman-Stiglitz proposition concerns traders' acquisition of "costly private fundamental information" and whether prices can fully reveal that information, and its equilibrium spread arises from an information rent; the arbitrage in this chapter, by contrast, exploits "publicly observable cross-market spreads," and its equilibrium spread arises from the cost of infrastructure services. Under this analogy, "information gathering" corresponds to "arbitrage activity" and "information cost" corresponds to the "infrastructure-service cost" of the AIH framework. The Grossman-Stiglitz-style paradox for crypto markets can be stated as follows.
If arbitrage activity were perfectly efficient and could rapidly eliminate all cross-market and cross-asset spreads to zero, then arbitrageurs would earn nothing—because their return (the spread) would be zero while the cost they incur to execute arbitrage (transaction fees, funding costs, technology investment, risk-bearing, and so on) would be positive. In that case, rational arbitrageurs would cease activity and exit the market. Yet once arbitrageurs—the "infrastructure providers"—collectively exit, the market's clearing bus, price anchoring, and liquidity-integration functions would fail, and spreads would inevitably reappear and widen. When spreads widen enough to cover arbitrage costs and offer an attractive risk-adjusted return, new or returning arbitrageurs would again be drawn into the market. This process forms a never-ending dynamic cycle.
The equilibrium state of this cycle is not a "perfectly efficient market" with zero spreads but a "dynamic-equilibrium market" in which spreads are maintained at some persistently positive level. At this equilibrium point, the return the marginal arbitrageur can earn just covers all the costs of executing arbitrage activity. The level of this equilibrium spread defines the practical ceiling on that market's efficiency. It is at once the minimum compensation the market must pay to keep arbitrageurs providing infrastructure services and the implicit cost that market participants must bear to obtain an integrated, relatively efficient trading environment.
This analytical conclusion provides a theoretical foundation for connecting to the chapters that follow. When arbitrage costs (the infrastructure-service cost of the AIH) rise for some reason—for example, tighter regulation that strengthens capital controls, network congestion that increases transaction delays, or violent market swings that enlarge risk exposure (all of which Chapter 17 will discuss in detail)—the equilibrium spread must rise correspondingly to maintain the incentive for arbitrageurs. A systematic widening of spreads, that is, a decline in market efficiency, is the condition under which various market anomalies (to be examined in Chapter 18) arise and persist. The crypto version of the Grossman-Stiglitz paradox thus tells us that the spread is not an inefficiency to be eliminated entirely but a key indicator of the operating state of the market ecosystem; it measures the operating cost of arbitrage—the market's core infrastructure—and reflects the efficiency frontier and the potential risk level of the entire market.
16.2 The structure of the arbitrage ecosystem
If the arbitrage infrastructure hypothesis proposed in Section 16.1 provides a theoretical lens for understanding the micro-foundations of crypto-market efficiency, the aim of this section is to analyze further the entity structure that constitutes this infrastructure—a complex ecosystem composed of diverse participants, clearly stratified and dynamically evolving. In the perpetual-futures market, arbitrage has evolved from the individual behavior of a handful of speculators into a highly specialized pattern of collective cooperation and competition with a clear division of labor. Participants of different backgrounds, drawing on their divergent endowments in capital scale, technological latency, risk appetite, and strategy complexity, occupy different tiers of the ecological pyramid and form a complex network that is at once mutually dependent and fiercely competitive. The collective action of this network jointly constitutes the key infrastructure functions—cross-market clearing, price anchoring, and liquidity integration—described by the AIH.
The analysis of this ecosystem begins with the tiered structure of participants. A map of participants comprising five main tiers (Tier 0 through Tier 4) identifies the distinct roles and niches ranging from protocol-level participants to individual traders. As a representative case of "protocol-level arbitrage," the Ethena protocol reveals how this crypto-native phenomenon has reshaped the capital structure and dynamics of the entire ecosystem. The interaction network among participants combines tiered competition with functional complementarity, and the systemic risks latent within it warrant attention. Placing this ecosystem in a framework of historical evolution allows us to trace its path from the early stage to the institutionalized era and to consider the transformations that an AI-driven new paradigm may bring.
16.2.1 A five-tier map of participants
The arbitrage ecosystem of perpetual futures is not a flat competitive structure but exhibits clearly differentiated tiers. According to capital scale, technological capability (especially execution speed), strategy complexity, and market influence, the main participants can be grouped into a five-tier pyramid model from Tier 0 to Tier 4. This model reveals not only the core competitiveness of the different participants but also the different divisions of labor they assume in playing the role of "arbitrage infrastructure." Note that Tier 0 (protocol-level arbitrageurs) is a special tier that emerged only in recent years; following an evolutionary logic from traditional to emerging players, this section discusses it after Tiers 1 through 4. The "0" in its label signals that its capital scale and systemic influence are the most prominent, not its order of appearance.
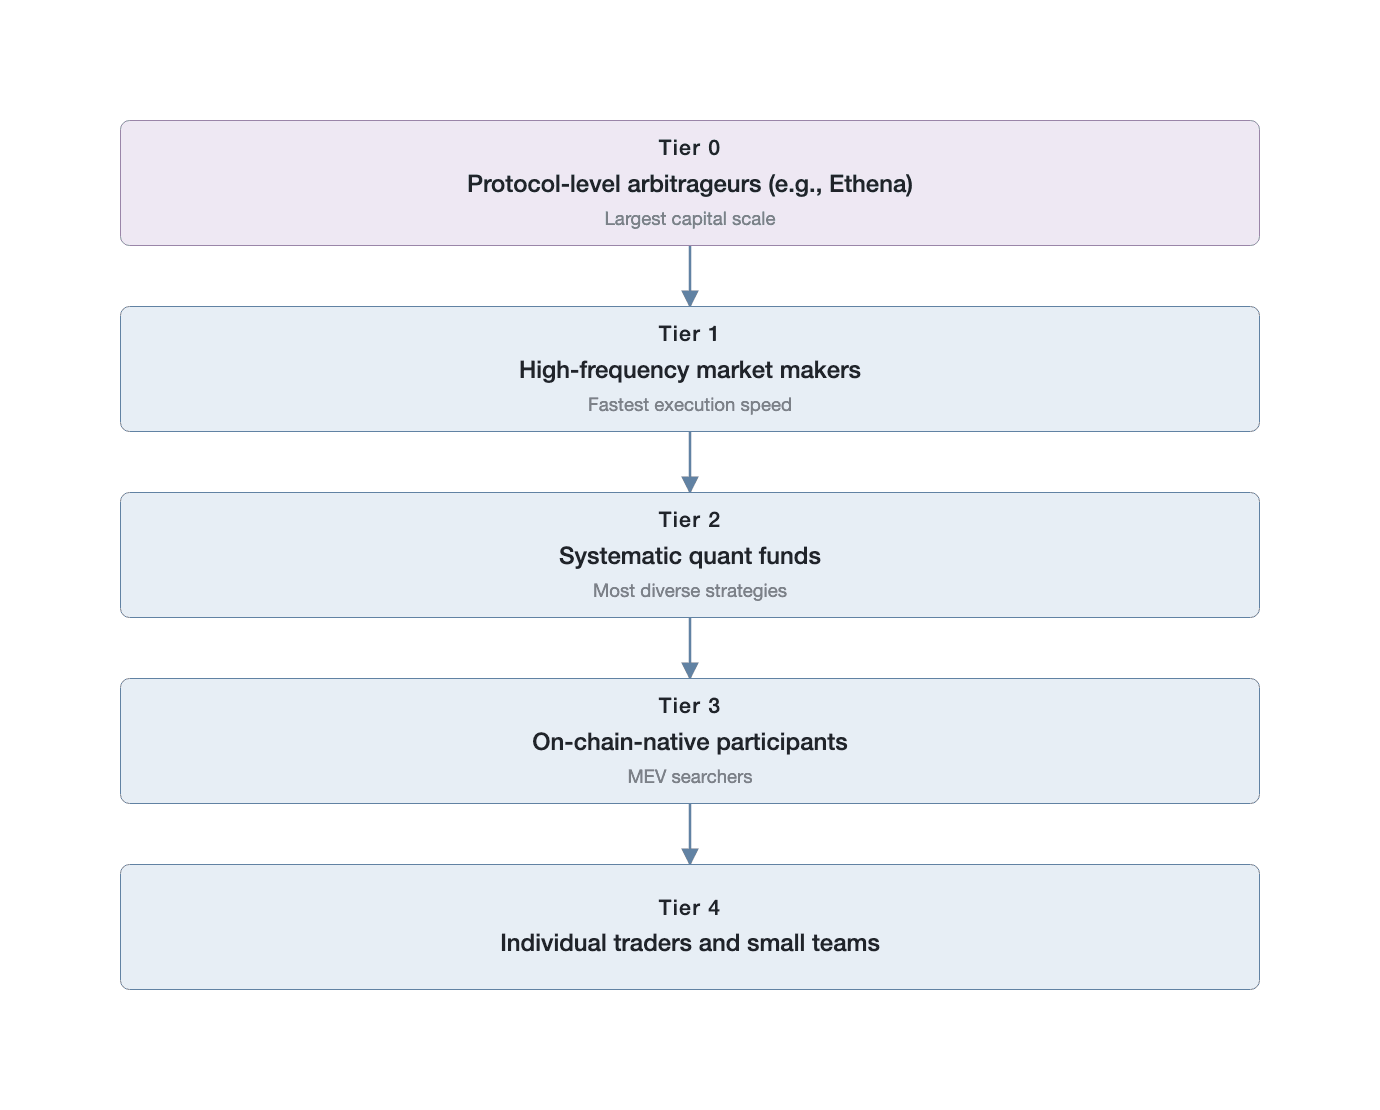
Figure 16-4. The five-tier participant structure of the arbitrage ecosystem (Data source: a conceptual schematic constructed by the author from public market data)
Figure 16-4 shows the vertical stratification of the arbitrage ecosystem from Tier 0 to Tier 4: the higher the tier, the more concentrated the capital and the fewer the participants. The top tiers, drawing on their capital and technology advantages, capture the most stable and largest arbitrage opportunities, while the bottom tiers compete in more crowded, thin-margin domains.
Tier 1: High-frequency market makers
Tier 1 sits at the top of the traditional arbitrage hierarchy and consists mainly of high-frequency trading firms with deep traditional-finance backgrounds, such as Jump Trading, Wintermute, and GSR. Their capital typically runs into the hundreds of millions of dollars or more, and their core advantage is extremely low trading latency. Through server colocation at exchanges and optimized network connectivity, they can execute trades with latencies on the order of microseconds to milliseconds. Their core strategy is to capture fleeting cross-exchange spreads. For example, when the price of BTC perpetual futures on Binance is a few basis points higher than the spot price on Coinbase, Tier 1 algorithms quickly short the perpetual on Binance while buying spot on Coinbase, locking in a nearly riskless, direction-neutral spread. The profit per operation is thin, but through enormous volume and high frequency it accumulates into a considerable return. Under the AIH framework, Tier 1 participants act as the core cross-market price-clearing hub; their near-real-time arbitrage helps bring prices across the world's major exchanges into close alignment, forming the micro transmission network of the virtual global liquidity pool.
Tier 2: Systematic quantitative funds
Next come the Tier 2 systematic quantitative funds. These participants typically command capital ranging from tens of millions to hundreds of millions of dollars. Although they cannot match Tier 1 on execution speed (they operate at second-to-minute latencies), their core advantage lies in the depth and complexity of their strategies. Once Tier 1 has fully consumed the simple microsecond-scale spread opportunities, Tier 2 focuses on more durable and complex arbitrage opportunities. Their strategy libraries include, but are not limited to, spot-perpetual basis arbitrage, funding rate arbitrage, calendar-spread arbitrage (such as the spread between perpetual futures and quarterly futures), and pairs trading based on statistical models. These strategies place relatively low demands on speed but higher demands on the accuracy of market models, the granularity of risk management, and capital efficiency. For example, a Tier 2 fund might construct a complex portfolio, simultaneously going long a set of perpetual futures with expected positive funding rates and shorting another set with expected negative rates, so as to earn a stable rate differential. Within the AIH framework, Tier 2 acts as a cross-maturity liquidity provider and a maintainer of relative pricing; it connects contract markets across different maturities and instruments, ensuring pricing consistency within the entire derivatives ecosystem.
Tier 3: On-chain-native participants
Tier 3 represents an innovative force unique to the crypto market, comprising mainly MEV searchers and liquidation bots. Their capital may range from millions to tens of millions of dollars, but their core arena is the blockchain itself, and their execution speed is measured in "block time." MEV searchers use complex algorithms to scan the mempool for and exploit arbitrage opportunities in transaction ordering—for example, when a spread exists between an automated market maker (AMM) pool on a decentralized exchange (DEX) and a centralized exchange (CEX), capturing profit through "sandwich attacks" or front-running. Liquidation bots monitor lending protocols (such as Aave and Compound) and DEX margin trading for under-collateralized positions; once one is found, they trigger the liquidation process, buying the collateral at a discount and repaying the debt to earn the liquidation penalty. Under the AIH framework, Tier 3 participants are the key transmission nodes connecting the CEX and DEX tiers of the market; they rapidly propagate and correct pricing deviations from the on-chain world and are also the actual executors of the risk-control mechanisms (such as liquidation) of the on-chain financial system.
Tier 4: Individual traders and small teams
At the base of the pyramid is the large population of Tier 4 participants, including sophisticated individual traders and small proprietary trading teams. Their capital is typically below a million dollars, their execution speed depends on commercial trading terminals or manual operation, and their reaction time runs from minutes to hours. Because of their disadvantages in capital and technology, they cannot compete with Tiers 1 and 3, and their strategies typically center on simplified versions of Tier 2 strategies—for example, manually executed spot-perpetual basis arbitrage, or capturing large funding rate differentials across exchanges. Although the market influence of any single Tier 4 participant is negligible, their collective behavior has a significant aggregate effect on the market, especially in driving the funding rate back toward its mean. When the funding rate is too high, large numbers of individual traders pile into basis arbitrage, and their collective selling pressure helps dampen the rate. In the AIH framework, therefore, Tier 4 serves as an "auxiliary rate stabilizer" and forms the broad participatory base of the market's self-regulating mechanism.
Tier 0: Protocol-level arbitrageurs
Finally, and most distinctively, at the apex of the pyramid is Tier 0: protocol-level arbitrageurs. This is an entirely new type of participant that has emerged only in recent years, whose outstanding representative is Ethena. Such a participant is itself a decentralized protocol that pools massive amounts of user capital (which can reach billions or even tens of billions of dollars) through smart contracts and executes, programmatically and at large scale, the arbitrage strategies that formerly belonged to Tier 2. The emergence of Tier 0 marks a paradigm leap in arbitrage from "individual or institutional strategy" to "protocolized infrastructure." It "productizes" and "democratizes" complex arbitrage strategies, allowing any user to share indirectly in arbitrage returns by holding a protocol token (such as USDe). This model substantially extends the capital frontier of arbitrage, from the balance sheets of a few professional institutions to the liquidity of the entire DeFi world. Under the AIH framework, Tier 0 is an "infrastructure provider" that has itself become a huge, systemic tool for price anchoring and liquidity integration. This scale, however, also brings new problems, which we examine in detail in the Ethena case in the next section.
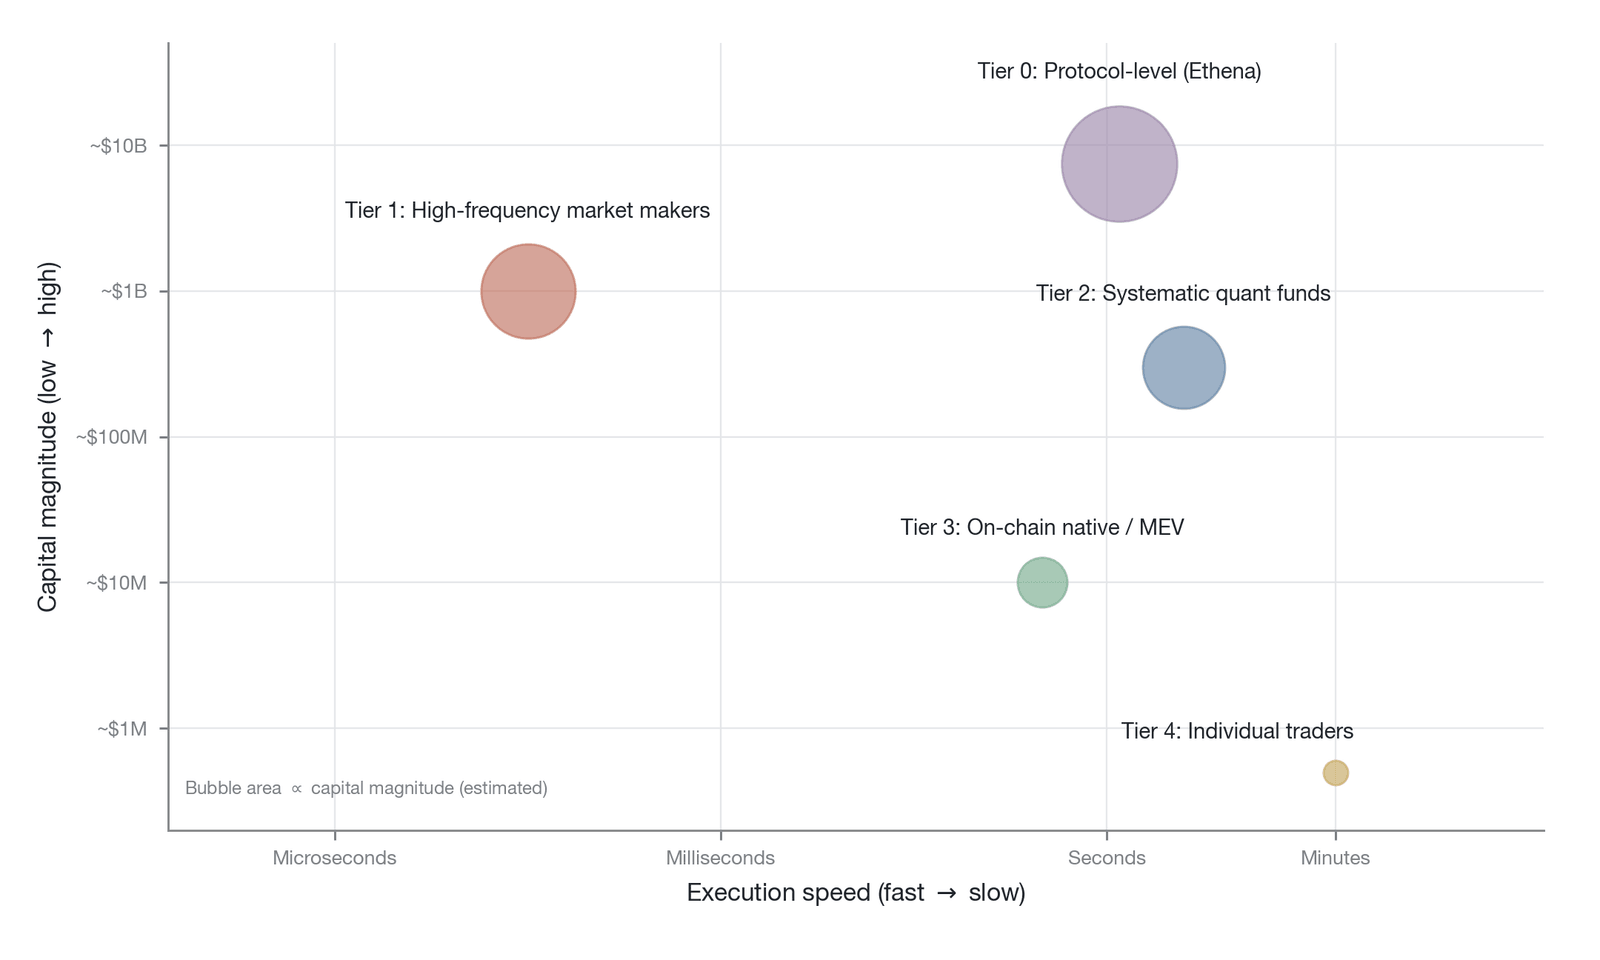
Figure 16-5. The distribution of capital scale and execution speed across the five tiers of arbitrage participants (Data source: estimated by the author from public disclosures of firms such as Jump Trading and Wintermute and from industry reports; data as of the fourth quarter of 2025)
Figure 16-5 uses a bubble chart (bubble size represents capital scale, the vertical axis represents execution speed) to depict each tier's niche: Tier 1 is fastest but not the largest in capital, Tier 0 far exceeds the other tiers in capital but executes more slowly, and Tiers 2, 3, and 4 each occupy their own position in the trade-off between capital and speed.
16.2.2 Ethena and arbitrage-as-a-service
In the evolution of the crypto arbitrage ecosystem, the rise of the Ethena protocol is a representative case. It not only created the synthetic dollar USDe at an unprecedented scale but, more importantly, pioneered an entirely new business model: "arbitrage-as-a-service." By packaging an institutional-grade spot-perpetual basis-arbitrage strategy into a permissionless, composable on-chain protocol, Ethena transformed an arbitrage strategy once confined to a few professional institutions into yield infrastructure open to all DeFi users. This paradigm breakthrough provides a representative empirical case for understanding the arbitrage infrastructure hypothesis.
Ethena's core mechanism is conceptually simple. Users deposit assets such as ETH, BTC, or liquid staking tokens into the protocol; the protocol automatically uses the deposited assets as collateral and opens an equivalent short position in the perpetual-futures market on a CEX (such as Binance or Bybit), constructing a delta-neutral portfolio. The captured funding rate income, net of operating costs, is distributed to sUSDe holders. In essence, Ethena has built a large-scale automated basis-arbitrage system, and USDe is the tokenized claim on the stable cash flow that this system generates.
Although Ethena manages user deposits and withdrawals through on-chain smart contracts, its core operation—opening and managing perpetual-futures short positions on CEXs—relies on off-chain custodians for execution. This hybrid architecture of "on-chain interface plus off-chain execution" means that Ethena is not a fully decentralized protocol, and its custody chain contains at least three critical risk nodes: the operational security and key-management risk of the custodian, the counterparty credit risk of the CEX (the lesson of the FTX collapse remains fresh), and the operational risk of the settlement channel between the custodian and the CEX. In addition, the CEX where Ethena's positions reside could unilaterally freeze accounts, change margin rules, or suspend trading in extreme conditions, and any such event would instantly invalidate the protocol's delta-neutral assumption.
Ethena's structural innovation as a Tier 0 participant manifests in three respects. First, it "productizes" and "democratizes" the arbitrage strategy, allowing any user to share indirectly in arbitrage returns by holding a protocol token, substantially extending the capital frontier of arbitrage from the balance sheets of a few professional institutions to the liquidity of the entire DeFi world. Second, it operates within DeFi's composability framework: USDe and sUSDe can be embedded in other DeFi protocols as collateral, liquidity, or yield instruments, forming a secondary distribution network for arbitrage returns across the DeFi ecosystem. Third, its protocolized mode of operation makes strategy execution transparent and auditable, reducing the principal-agent risk of the traditional fund model.
Viewed through a behavioral-finance lens, the growth curve of Ethena's total value locked (TVL) is not driven entirely by rational capital allocation. The early sUSDe yield of over 20% triggered a pronounced fear-of-missing-out (FOMO) effect in the crypto community, and the spread of the yield narrative on social media accelerated the pace of capital inflows, quite possibly far faster than rational expectations would support. Investors tended to anchor the early high yield as the "normal" level and displayed lagged exit behavior when the yield declined as the strategy became crowded. The 2022 collapse of Terra/UST, which followed a similar high-yield narrative, offers a cautionary precedent for these behavioral dynamics.
This model, however, also introduces a new dimension of risk. When a single protocol grows to command a significant share of the market's total open interest, it shifts from a price "taker" to a price "maker," and its own behavior can trigger positive or negative feedback loops in the market. This "Ethena effect"—how the protocol's own expansion systematically affects the very target of its arbitrage (in essence, the reflexive suppression that large-scale arbitrage exerts on its own source of returns, a protocol-scale manifestation of arbitrage's self-limiting nature)—is analyzed quantitatively in Section 16.4.3.
Moreover, the regulatory characterization of the "arbitrage-as-a-service" model remains deeply uncertain. An entity that raises funds from the general public, executes an investment strategy, and distributes returns may constitute a regulated investment product under the securities laws of major jurisdictions. "Protocolization" does not equal "deregulation," and this legal risk poses a potential challenge to the long-term sustainability of Ethena and all similar models.
The systemic risks that protocol-level arbitrageurs bring to the ecosystem as a whole are examined further in Chapter 17.
16.2.3 The participant interaction network
The participants in the arbitrage ecosystem do not exist in isolation; through complex trading relationships and information flows, they form a tightly coupled interaction network. This network contains both a tiered competitive structure and complementary collaborative relationships, and it also harbors systemic risks that could trigger chain reactions. Understanding this interaction network is key to grasping the stability and fragility of the arbitrage ecosystem.
The logic of tiered competition is the most salient feature of this network. It follows a simple principle: faster, better-capitalized participants preferentially capture the simplest and most obvious arbitrage opportunities, forcing others toward more complex, thinner-margin domains. Tier 1 high-frequency traders sit at the top of the competitive hierarchy; at microsecond speed they rapidly eliminate spreads among the major exchanges, so that any simple cross-market arbitrage opportunity lasting more than a second quickly disappears. This forces Tier 2 quantitative funds to abandon direct competition on speed and instead develop strategies requiring longer holding periods and more complex models, such as basis arbitrage and statistical arbitrage. And when Tier 0's Ethena enters with tens of billions of dollars to execute basis arbitrage at scale, it significantly compresses the profit space of Tiers 2 and 4 in that strategy. The funding rate is systematically depressed, rendering the manual carry trade—once quite attractive to individual traders—unprofitable. This effect of progressively compressing profit margins tier by tier is the inevitable result of the arms race in arbitrage technology; it pushes the entire ecosystem to evolve toward ever greater efficiency and refinement, but it also raises the barriers to entry for new participants.
This ecosystem, however, is not defined solely by competition; complementary collaborative relationships are equally important to keeping it running. Participants at different tiers are, in effect, one another's counterparties and create the conditions for one another's operations. For example, Tier 1 market makers, in providing liquidity, also lower the transaction costs (slippage) of strategy execution for Tiers 2 and 4. A market with deeper order books and narrower bid-ask spreads benefits all participants. Conversely, the basis-arbitrage strategies that Tier 2 funds execute (such as buying BTC spot and shorting BTC perpetual futures) provide important hedging positions for Tier 1 market makers. When large numbers of speculators pile into long perpetual-futures positions, it is Tier 2 arbitrageurs who supply the short-side counterparty, thereby maintaining market balance. Likewise, when Tier 3 MEV searchers execute CEX-DEX arbitrage, although they extract value from the DEX's liquidity providers, they also help keep the DEX's price aligned with the external market, lowering transaction costs for ordinary users. This complex symbiotic network gives the arbitrage ecosystem a dynamic, self-regulating balance.
Competition within a single tier also plays the role of an "automatic stabilizer." When a particular arbitrage strategy (such as funding rate arbitrage on some altcoin) shows excess profit, it attracts many same-tier participants. For example, several Tier 2 funds may simultaneously discover and execute the strategy. Their collective action rapidly compresses the arbitrage space (the funding rate falls, the basis converges) until the strategy's expected return declines to a level commensurate with its risk and cost. At that point, some less efficient funds or those with higher capital costs choose to exit, so the profit space rebounds slightly and attracts a new round of competition. This process constitutes a negative feedback mechanism that ensures no riskless arbitrage opportunity can persist for long and keeps market efficiency at a dynamic equilibrium determined by the average arbitrage cost of all participants. This negative feedback mechanism may, however, turn nonlinear during the de-crowding phase. Behavioral-finance research shows that the upswing phase of strategy crowding is often accompanied by participant overconfidence and an underestimation of tail risk, and that when market conditions deteriorate, panicked exit can cause arbitrage intensity to fall far more than equilibrium requires—that is, spreads to widen excessively—similar to the "quant quake" that quantitative strategies experienced in 2007. In a crypto market where information spreads extremely fast and participant behavior is highly homogeneous, the nonlinear overshoot risk of de-crowding is especially pronounced.
But this tight coupling and interdependence also accumulate systemic risk. When a key node in the ecosystem fails, risk can propagate rapidly across the whole network. The Ethena case again serves as a warning. If Ethena had to urgently unwind its tens of billions of dollars in short positions for some reason (such as a security vulnerability in its custody scheme, or a default by the CEX platform it hedges on), it would generate enormous buying demand in the market. This would not only push perpetual-futures prices up rapidly and turn the funding rate sharply positive but also inflict large mark-to-market losses on all the long-side speculators and market makers whose short counterparty was Ethena. More seriously, such a shock could trigger chain liquidations at other institutions and set off a full-blown market crash. This "centralization risk," arising from a single entity's excessive scale, is a new challenge that protocol-level arbitrageurs bring to the whole ecosystem. It shows that when arbitrageurs evolve from dispersed individuals into concentrated infrastructure, efficiency improves but the system's fragility may increase as well.
A deeper systemic risk is that an Ethena risk event could infect the broader market through three channels simultaneously. The first channel is a direct shock to the CEX perpetual-futures market: large-scale short covering pushes up the funding rate and perpetual-futures prices, affecting all traders holding positions on the relevant CEX. The second channel is a chain reaction in the DeFi collateral chain: USDe and sUSDe are already widely used as collateral in DeFi lending protocols and liquidity pools, and an Ethena risk event could cause the price of USDe to fall, triggering chain liquidations of positions collateralized by USDe. The third channel is a confidence crisis leading to a stablecoin depeg: market panic could drive the secondary-market price of USDe below its $1 peg, further intensifying the positive feedback of the first two channels. Under stress, these three channels could activate in synchrony, constituting a textbook "correlation jump" scenario in which risk factors that appear independent in normal times suddenly become highly correlated in a crisis, amplifying a local event into a systemic shock.
16.2.4 The protocolization of arbitrage
The perpetual-futures arbitrage ecosystem is not static; it has undergone dramatic evolution over the past several years. This process is closely synchronized with the three-stage evolutionary framework of crypto-market efficiency described in Chapter 15 (the early stage, the institutionalized era, and the regulated era) and clearly displays the path along which arbitrage behavior has migrated from scattered individual strategies to a highly organized infrastructure service.
In the early market stage, during the infancy of perpetual futures (roughly 2016–2019), the arbitrage ecosystem consisted mainly of Tier 4 individual traders and a few small teams with market insight. At the time, the market was severely fragmented, spreads across exchanges were large and persistent, and funding rates were extremely volatile. The pronounced efficiency gaps offered rich profits to early participants but also reflected the market's extreme lack of infrastructure. Arbitrage at this stage was opportunistic and unsystematic, far from constituting an "infrastructure" capable of stably anchoring prices.
Entering the "institutionalized era" (roughly 2020–2023), as crypto assets gradually drew the attention of mainstream financial institutions, Tier 1 high-frequency traders and Tier 2 systematic quantitative funds entered at scale. These institutions brought mature trading algorithms, large-scale capital, and professional risk-management systems. In this phase, the efficiency of core markets improved markedly. Cross-exchange spreads were compressed to the millisecond scale, and the funding rates of mainstream assets became smoother and more predictable. Arbitrage shifted from experience-driven individual behavior to systematized quantitative strategy and became a routine allocation for institutional capital. It was in this phase that arbitrage's infrastructure functions as a "cross-market clearing bus" and a "price anchor" took initial shape.
We are now in the "regulated era" (roughly 2024 to the present). The defining feature of this phase is the rise of Tier 0 (protocol-level arbitrageurs) and Tier 3 (on-chain-native participants). The emergence of Ethena symbolizes the "institutionalization" and "protocolization" of the arbitrage strategy itself, which has become a foundational building block of the DeFi world. At the same time, as DEXs and on-chain derivatives protocols have flourished, on-chain-native forces such as MEV searchers and liquidation bots have grown steadily in importance. They have established new efficiency links between CEXs and DEXs and among different on-chain protocols, extending the infrastructure functions of arbitrage from the centralized world into the decentralized substrate. In this phase, the complexity and integration of the arbitrage ecosystem have reached levels not seen in any earlier phase, but they are accompanied by the centralization risk noted above and by new ethical challenges (such as the fairness of MEV).
Looking ahead, the evolution of the arbitrage ecosystem is far from over. One frontier direction worth watching is the application of artificial intelligence in arbitrage. As large language models and reinforcement-learning techniques advance, fully autonomous AI arbitrage agents may become a reality. Such potential AI-native arbitrage agents, surpassing today's Tier 1, might process and respond to unstructured information (such as news and social-media sentiment) faster than Tier 1 high-frequency traders, or autonomously discover statistical-arbitrage patterns more complex than those of Tier 2 quantitative funds. If such AI agents emerge, they could reshape the existing ecosystem, pushing the technological competition of arbitrage into a new dimension—from a contest of execution speed based on code and hardware toward a contest of cognitive capability based on algorithms and intelligence. At that point, the form, efficiency, and risk characteristics of arbitrage infrastructure would undergo another round of structural transformation.
16.3 A taxonomy of arbitrage
Before dissecting the various concrete arbitrage mechanisms in depth, establishing a clear classification framework is a necessary prerequisite for the analysis that follows. The institutional distinctiveness of the perpetual-futures market—its funding rate mechanism, its lack of a fixed maturity, its high leverage, its round-the-clock trading, and its complex ecosystem in which centralized and decentralized exchanges coexist—jointly forms an arbitrage strategy space far richer and more multidimensional than that of traditional financial derivatives markets. These strategies do not exist in disarray but follow a specific structural logic. This section aims to establish a unified analytical coordinate system that systematically classifies the core arbitrage activities of the perpetual-futures ecosystem by identifying the type of boundary each arbitrage "crosses," and reveals their intrinsic progression from simple to complex.
16.3.1 The classification framework
The traditional way to classify market arbitrage often relies on asset class or the mathematical model of the strategy. In the highly heterogeneous and rapidly evolving environment of crypto markets, however, a more robust taxonomy should focus on the essence of arbitrage behavior: identifying and exploiting the "spread" or "inconsistency" between different markets, assets, or instruments. The core of the classification framework we propose therefore lies in defining precisely which boundary the "deviation" that arbitrageurs seek to eliminate occurs across. We decompose this core idea into two principal dimensions and one implicit dimension.
The first principal dimension is the "type of boundary" that the arbitrage crosses. This defines the fundamental cause of the spread—the dimension along which the market has become segmented or inconsistent. We identify six key boundary types. A cross-market-tier boundary refers to the price deviation of the same asset across different market tiers, the most typical being the spread between the spot market and the derivatives market. A cross-space/platform boundary refers to the price deviation of the same asset or contract across different geographic locations or trading platforms. A cross-institutional-parameter boundary refers to arbitrage opportunities that arise for the same asset across different trading venues because of their distinctive institutional designs (such as the funding rate, settlement timing, or margin rules). A cross-asset boundary refers to a temporary deviation in the price relationship between two or more strongly correlated or cointegrated assets within the same market. A cross-term-structure boundary refers to a distortion in the pricing relationship implied among derivatives of different maturities on the same underlying asset. A cross-infrastructure-architecture boundary refers specifically to spreads that arise between platforms operating on the two starkly different technical and trust assumptions of CEXs and DEXs, owing to differences in oracle latency, transaction-packing mechanisms, or liquidity models.
The second principal dimension is the "combination of market tiers" involved in the arbitrage operation. This defines specifically which market segments the two or more legs of the arbitrage trade fall into—for example, whether it connects spot and perpetual futures, hedges between different perpetual futures, or constructs a complex portfolio involving spot, futures, and perpetual futures.
Beyond these two explicit dimensions, there is an implicit dimension: the "holding period." The time scales required to discover, execute, and close different arbitrage strategies vary enormously. A high-frequency trader may complete a cross-exchange arbitrage within microseconds, whereas funding rate arbitrage may require holding for days or even weeks. The length of the holding period directly reflects the risk exposure, capital cost, and technological threshold of an arbitrage strategy; together with the two preceding dimensions, it determines the complexity and profit model of a given arbitrage strategy.
Through this two-dimensional "boundary type × market tier" matrix, supplemented by the holding-period consideration, we can construct a clear map of the seemingly tangled arbitrage activities in the perpetual-futures ecosystem, providing a unified logical starting point for the deconstruction in the sections that follow.
16.3.2 An overview of the six arbitrage types
Based on the classification framework above, we can group the mainstream arbitrage activities of the perpetual-futures ecosystem into six core types. The table below systematically organizes the characteristics of these six types, including the boundary each crosses, the market tiers involved, the core instrument, and the "efficiency function" each plays for the market ecosystem as a whole—that is, which dimension of market inefficiency each primarily repairs.
| No. | Arbitrage type | Boundary crossed | Market tiers | Core instrument | Efficiency function |
|---|---|---|---|---|---|
| ① | Spot-perpetual basis arbitrage | Cross-market-tier | Spot ↔ perpetual | Basis / funding rate | Anchors the perpetual-futures price to spot |
| ② | Cross-exchange perpetual arbitrage | Cross-space/platform | Perpetual ↔ perpetual | Cross-exchange spread | Unifies global perpetual-futures prices |
| ③ | Funding rate arbitrage | Cross-institutional-parameter | Perpetual ↔ perpetual | Rate differential / rate surface | Smooths the rate structure |
| ④ | Cross-asset statistical arbitrage | Cross-asset | Perpetual ↔ perpetual | Spread / correlation | Maintains relative-pricing consistency |
| ⑤ | Spot-futures-perpetual triangular arbitrage | Cross-term-structure | Spot ↔ futures ↔ perpetual | Term structure | Integrates term-structure information |
| ⑥ | CEX-DEX cross-tier arbitrage | Cross-infrastructure-architecture | CEX perpetual ↔ DEX perpetual | Spread / rate differential | Bridges the CEX-DEX efficiency gap |
Table 16-2. The six core arbitrage types of the perpetual-futures ecosystem and their efficiency functions (Data source: constructed by the author)
These six arbitrage mechanisms do not exist in isolation but form a functionally complementary network that jointly maintains market efficiency. To understand their "division of labor" more intuitively, we can map each arbitrage type to the market boundary it crosses—this is precisely the concrete unfolding, at the micro-mechanistic level, of the market-efficiency spectrum of Chapter 15. As the figure below shows (corresponding to the six boundary types summarized in Table 16-2), the six arbitrage types cover six distinct boundary types, each assuming a corresponding price-correction function, and together they drive the improvement of market efficiency.
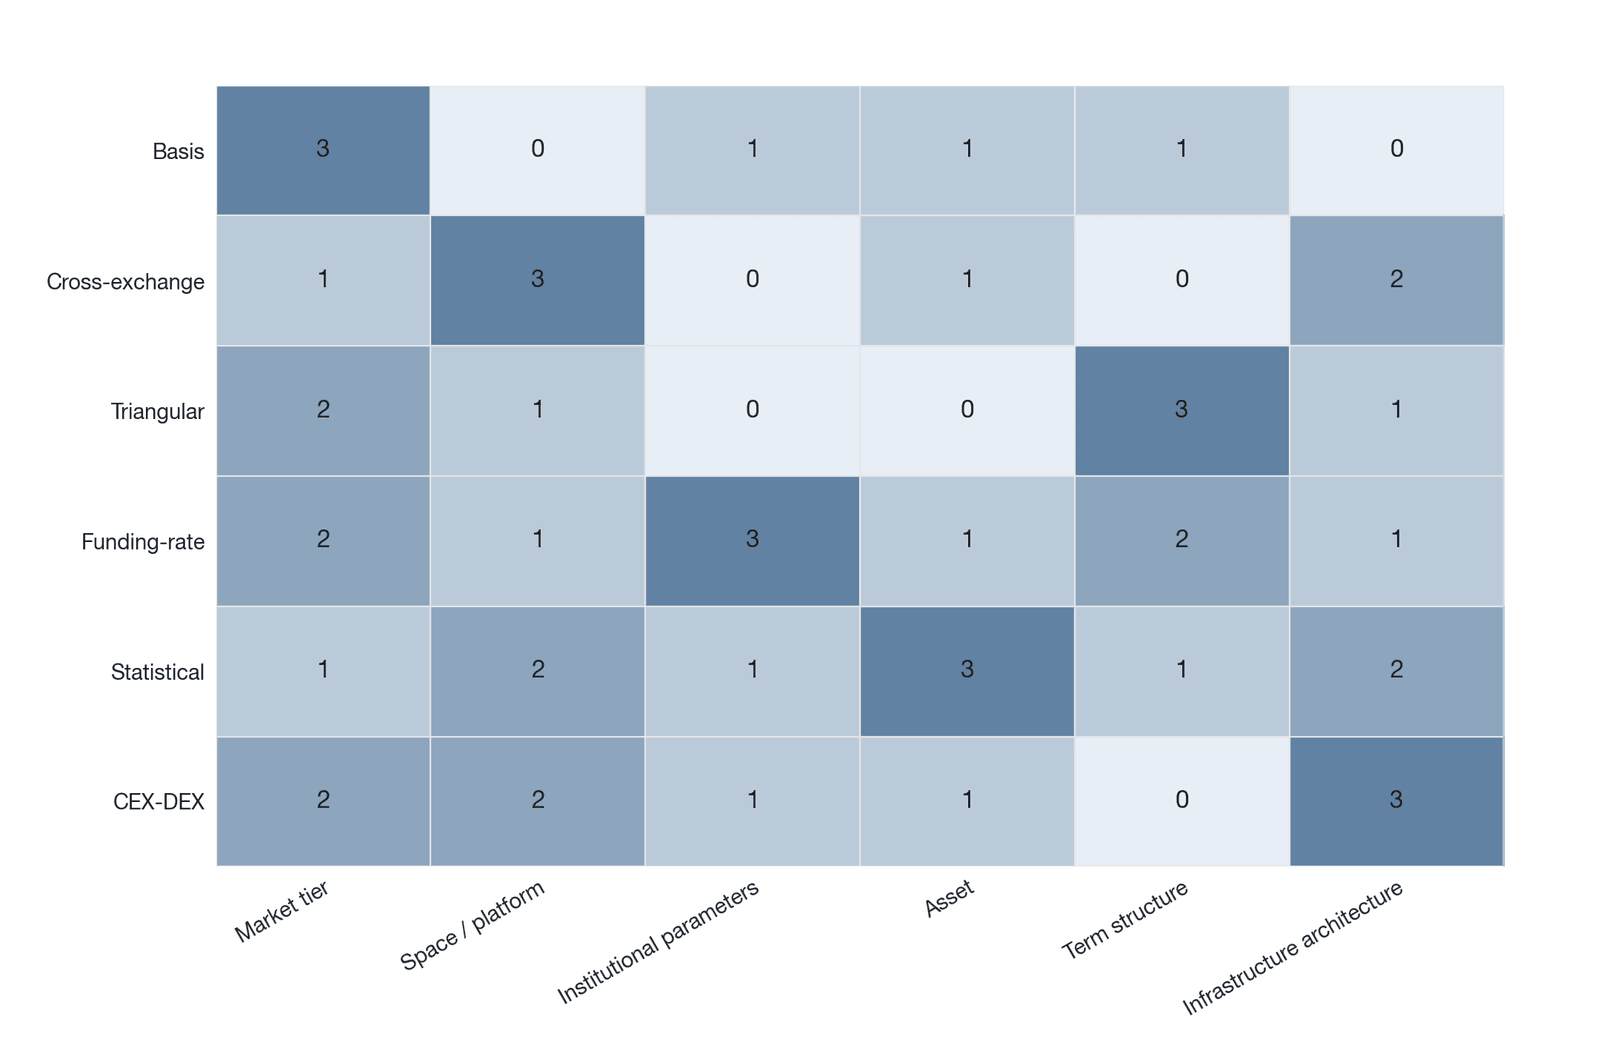
Figure 16-6. The functional coverage of the six arbitrage types across the six boundary types they cross (corresponding to Table 16-2; source: a conceptual schematic constructed by the author from the analysis in each section)
The six arbitrage types form a functional division of labor across the six boundary types listed in Table 16-2: spot-perpetual basis arbitrage anchors the "market-tier" boundary, CEX-DEX cross-tier arbitrage bridges the "infrastructure-architecture" boundary, cross-exchange perpetual arbitrage governs the "space/platform" boundary, funding rate arbitrage smooths the "institutional-parameter" boundary, cross-asset statistical arbitrage maintains relative pricing across the "asset" boundary, and triangular arbitrage integrates the "term-structure" boundary.
Through this mapping, we can see clearly that a seemingly unified market price is, behind the scenes, the result of different types of arbitrageur continuously performing price-correction operations within their respective functional domains. Together they constitute a dynamic, multi-tiered error-correction system that is the micro-foundation on which market efficiency is maintained.
16.3.3 The complexity gradient
Dividing arbitrage activity into six types is not merely a matter of classificatory tidiness; more importantly, it reveals the intrinsic progression among them. From type ① to type ⑥, we observe a clear evolutionary trend from simple to complex. This increase in complexity manifests in several respects: the number of markets involved, the sources of institutional friction to be overcome, the demands on technological infrastructure, and the risk dimensions embedded in the strategy itself.
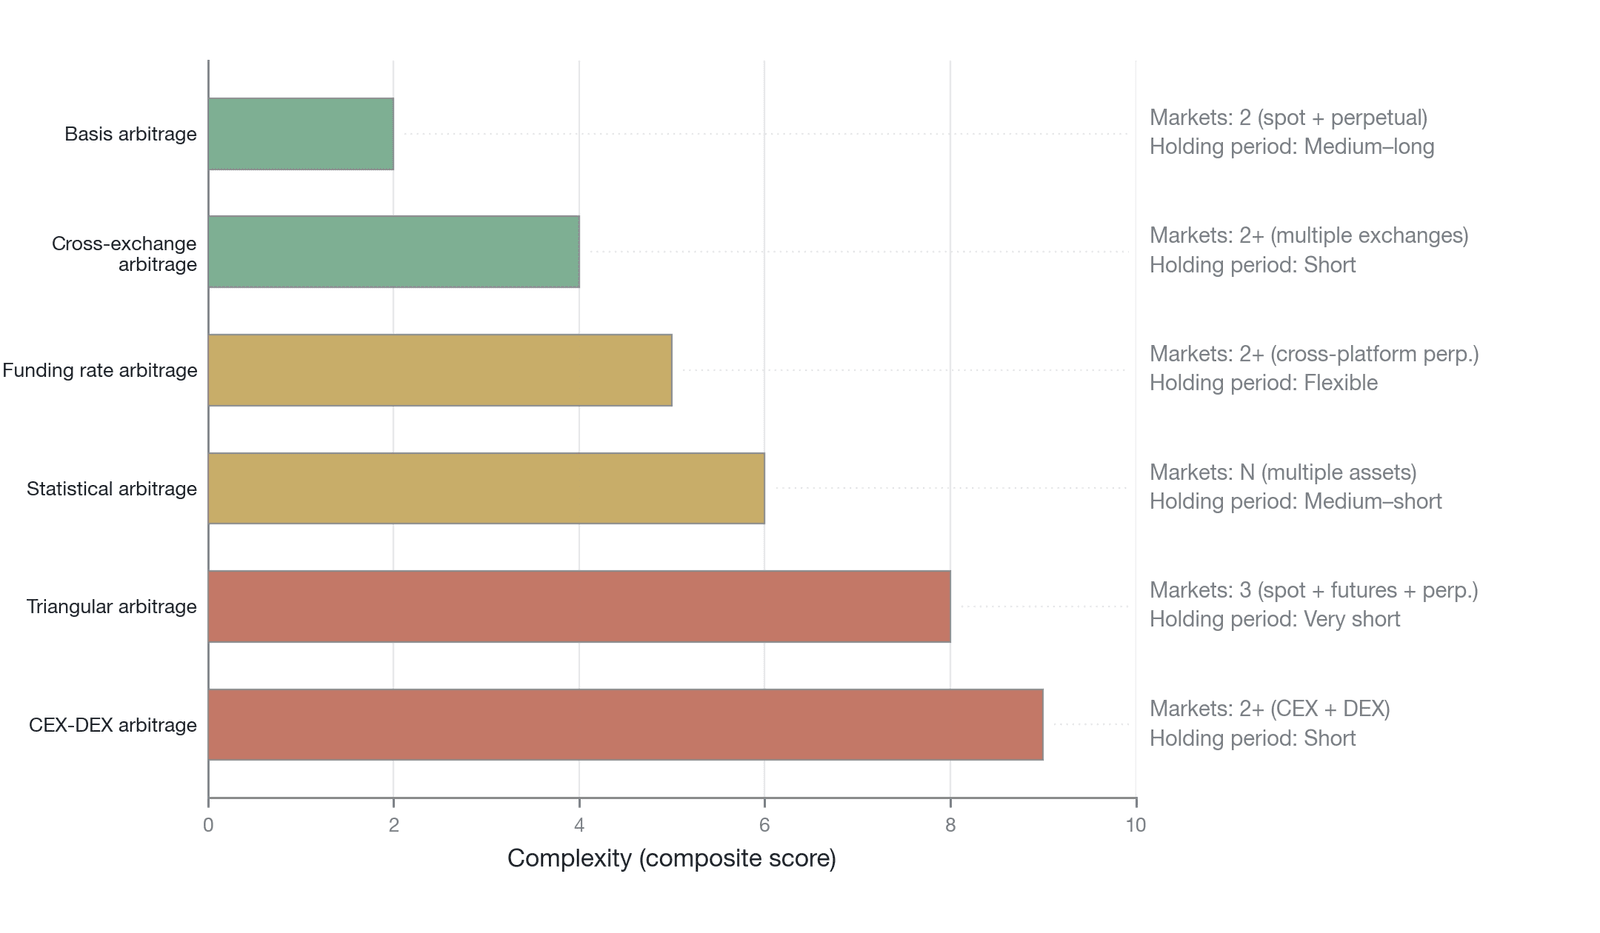
Figure 16-7. The complexity gradient of the six arbitrage types (Data source: a qualitative assessment constructed by the author from three indicators—the number of markets involved, the variety of friction sources, and the technological-infrastructure requirements)
As the figure shows, complexity escalates step by step. Spot-perpetual basis arbitrage (①) is the most basic form; it typically involves only two markets (one spot, one perpetual), and its core frictions arise mainly from transaction costs and short-term fluctuations in the funding rate. This makes it the arbitrage type with the lowest threshold and the widest range of participants, from large quantitative funds to individual traders.
By contrast, although cross-exchange perpetual arbitrage (②) also involves only two markets, it demands extremely high speed; the technological threshold rises significantly, and it is dominated mainly by high-frequency trading firms. Funding rate arbitrage (③), meanwhile, introduces the need to understand differences in institutional parameters across platforms, and its complexity lies in the fine-grained grasp of rate-calculation mechanisms and settlement cycles.
The complexity of cross-asset statistical arbitrage (④) stems from the word "statistical." It is no longer based on a deterministic riskless pricing relationship but relies on modeling the historical correlation between assets, which introduces model risk and a higher technological threshold.
The complexity of spot-futures-perpetual triangular arbitrage (⑤) manifests in the increase to three markets involved and in the need to handle simultaneously the pricing logic of different term structures, with a corresponding increase in risk dimensions.
Finally, CEX-DEX cross-tier arbitrage (⑥) stands at the top of the complexity ladder. It must contend not only with the two starkly different trading environments of CEXs and DEXs but also with a variety of distinctive friction sources and risk dimensions, including on-chain congestion, gas-fee fluctuations, oracle latency, and even MEV. This confines the effective participants in this domain to a small number of on-chain searchers and high-frequency trading firms with top-tier technical capabilities.
This progression from simple to complex also broadly matches the chronological order in which these arbitrage strategies historically emerged and scaled. Basis arbitrage existed from the very birth of perpetual futures; as the number of exchanges grew, cross-exchange arbitrage followed; after competition among exchanges intensified and institutional designs diverged, funding rate arbitrage became popular; and CEX-DEX arbitrage became possible only after the rise of DeFi and decentralized perpetual-futures protocols. This evolutionary path clearly shows that the arbitrage ecosystem is itself continuously adapting and developing: as the market deepens and expands, new and more complex arbitrage opportunities keep emerging, drawing in more specialized participants and together constituting a dynamically evolving efficiency landscape.
16.4 Spot-perpetual basis arbitrage
In the arbitrage ecosystem of perpetual futures, spot-perpetual basis arbitrage—often called "cash-and-carry" arbitrage—constitutes the most basic price-stabilization mechanism. Through continuous price-correction operations, basis arbitrage anchors the perpetual-futures price near the spot price and is the micro-foundation that allows the funding rate mechanism to function effectively.
16.4.1 The bidirectional operating mechanism
The core of basis arbitrage lies in capturing temporary deviations between the perpetual-futures price and the spot price. When the basis deviates significantly from zero because of market sentiment, leverage demand, or liquidity shocks, an arbitrage opportunity arises. Depending on the direction of the basis, the operation can be divided into two modes: positive-basis arbitrage and negative-basis arbitrage.
Positive-basis arbitrage is executed in an environment of positive basis and positive funding rate: the arbitrageur buys spot and shorts an equivalent amount of perpetual futures at nearly the same time, constructing a delta-neutral position. The phrase "at nearly the same time" matters here, because in actual execution there is always a time gap of milliseconds to seconds between the two legs—the spot leg and the perpetual-futures leg—whether across exchanges or even within the same exchange. This "execution lag" implies a window of directional risk exposure between the two legs, known as "leg risk." In a highly volatile market, even a lag of a few hundred milliseconds can cause significant slippage or a single-leg fill, so managing the execution lag constitutes a core component of arbitrage technology. Its sources of return include the funding rate collected periodically and the spread profit when the basis converges. From the standpoint of market efficiency, positive-basis arbitrage increases the short-side supply in the perpetual-futures market, exerts downward pressure on the overheated perpetual-futures price, and prompts the basis to narrow, achieving an automatic calibration of prices.
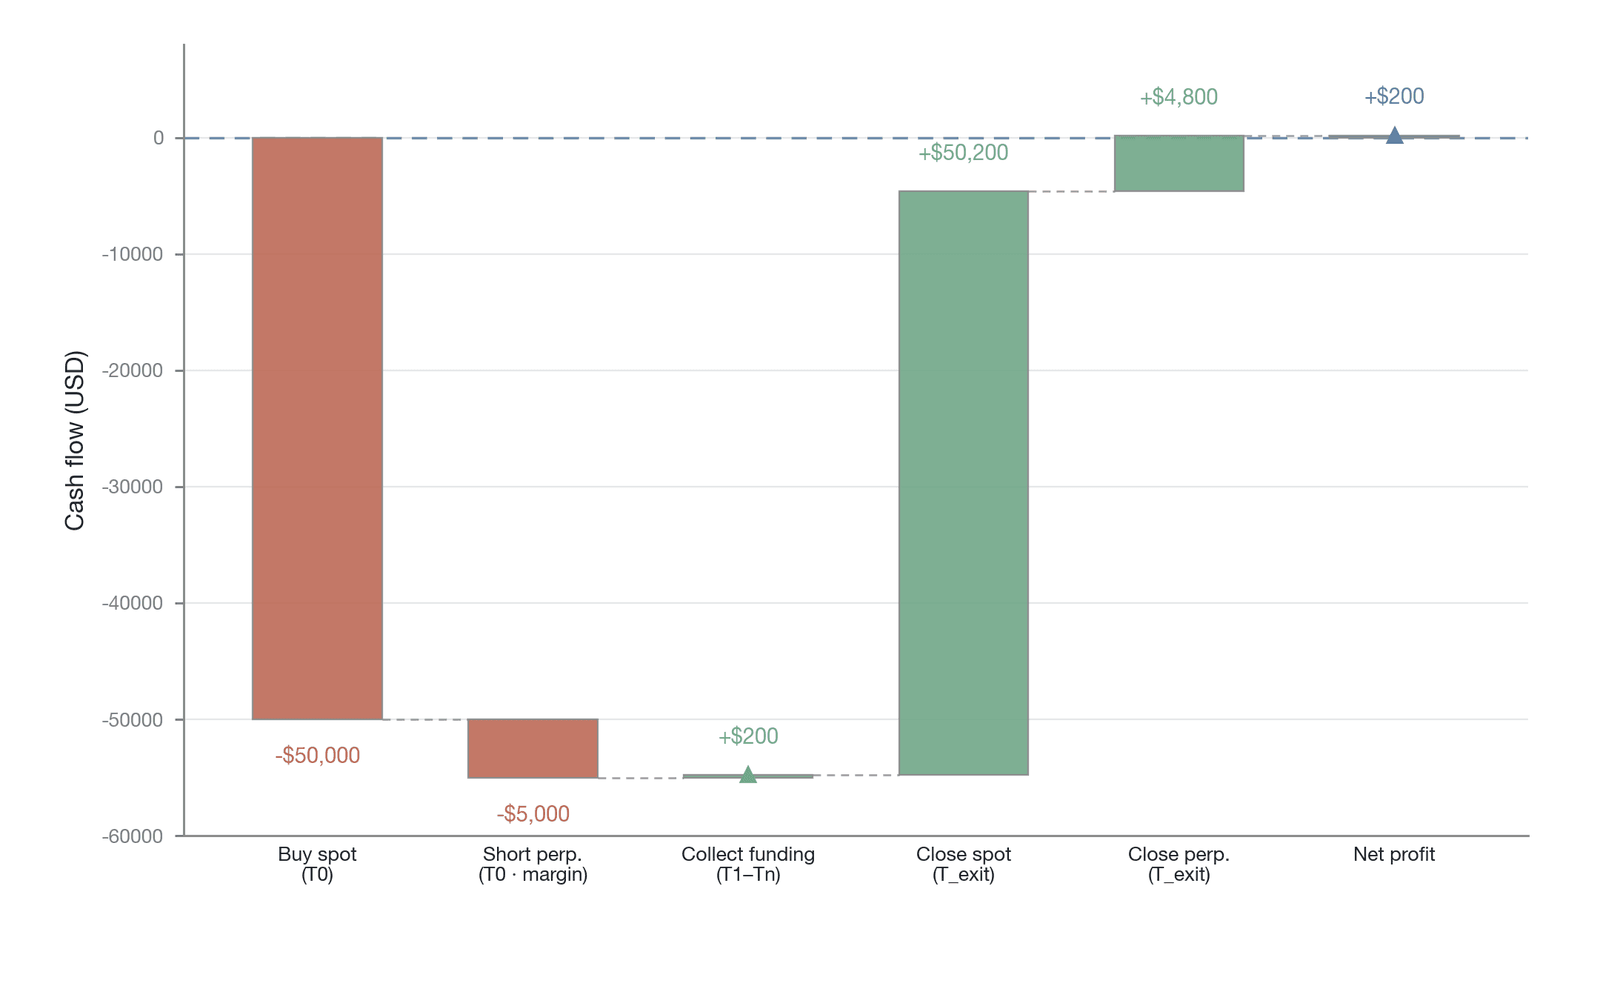
Figure 16-8. The cash-flow timeline of basis arbitrage (Data source: a conceptual schematic constructed by the author)
Figure 16-8 depicts the cash-flow timeline of positive-basis arbitrage over the holding period: at entry, buying spot and shorting the perpetual; during the holding period, collecting the funding rate at each settlement cycle; and at exit, realizing the profit from basis convergence—so that the net return equals the sum of the accumulated funding rate and the basis-convergence gain, less all transaction costs. The diversification of settlement frequency (4-hour and 1-hour intervals now coexist with the traditional 8-hour interval) directly affects returns: the more frequent the settlement, the smaller the amount collected each time, the shorter the lock-up period, and the lower the funding-rate volatility risk the arbitrageur faces.
Negative-basis arbitrage performs the reverse operation: shorting spot and going long the perpetual futures. In the crypto market, however, spot shorting faces pronounced asymmetric friction, so the execution efficiency and scale of negative-basis arbitrage fall far short of those of positive-basis arbitrage. Specifically, the currently available channels for spot shorting include borrowing through centralized lending platforms (the available platforms have been greatly reduced after the bankruptcies of several leading institutions, and borrowing rates are typically between 5% and 30% annualized); borrowing through DeFi lending protocols such as Aave (which requires over-collateralization and is extremely capital-inefficient); and the coin-borrowing (margin) features of some exchanges (with limited quotas and opaque rates). The availability, cost, and counterparty risk of each channel differ starkly. This asymmetry of shorting friction directly explains why the negative-basis state tends to persist longer, and deviate further, than the positive-basis state—one of the market anomalies that Chapter 18 will examine.
16.4.2 Decomposing the returns
The returns from basis arbitrage are not riskless profit but compensation for bearing specific risks and friction costs, fully consistent with the arbitrage infrastructure hypothesis proposed in this chapter. He et al. (2022) [4] note that the perpetual-futures price shows an annualized mean absolute deviation of 60% to 90% from its theoretical no-arbitrage price, while a simulated basis-arbitrage strategy can generate a very high Sharpe ratio (for Bitcoin perpetual futures, about 1.8 for retail traders facing high transaction costs and as much as 3.5 for zero-fee high-frequency market makers). This statistic should be viewed with caution, however: the Sharpe ratio assumes normally distributed returns, whereas the return distribution of basis arbitrage exhibits pronounced negative skewness and fat tails—stable positive returns in normal conditions and enormous losses under extreme stress. This return structure means that the Sharpe ratio may severely understate the strategy's risk exposure in tail events. A more robust risk assessment should be supplemented with metrics sensitive to tail risk, such as maximum drawdown and conditional value-at-risk.
The net return of basis arbitrage can be decomposed into three main parts: the funding rate income, the basis-convergence income, and the various transaction costs. The formula can be expressed as:
{k} + (\text{basis}{\text{open}} - \text{basis}_{\text{close}}) - \text{transaction costs} - \text{margin opportunity cost} - \mathbb{E}[\text{liquidation/ADL loss}]
where indexes the settlement cycles within the holding period.
Here, transaction costs are a composite concept encompassing trading fees, the bid-ask spread (slippage), spot carrying costs or borrowing costs (in negative-basis arbitrage), and the cost and time delay of cross-platform fund transfers. These costs directly erode the gross return and determine that arbitrage is economically viable only when the gross basis is large enough to cover them. In addition, two cost items often overlooked but critical in actual execution are: the margin opportunity cost—the initial and maintenance margin that must be locked up on the perpetual-futures leg cannot be used for other investments, and in a high-rate environment this implicit cost is not negligible; and the probability-weighted loss from forced-liquidation and auto-deleveraging (ADL) risk—during violent market swings, unrealized losses on the perpetual-futures leg may trigger margin calls or even forced deleveraging, while at that moment the unrealized gains on the spot leg cannot be used to top up margin because they sit on a different platform. Some exchanges have introduced unified margin modes (such as OKX's portfolio margin and Binance's unified account) that allow spot assets to serve directly as margin for perpetual futures, partly alleviating the problem of cross-platform margin separation and improving the capital efficiency of basis arbitrage.
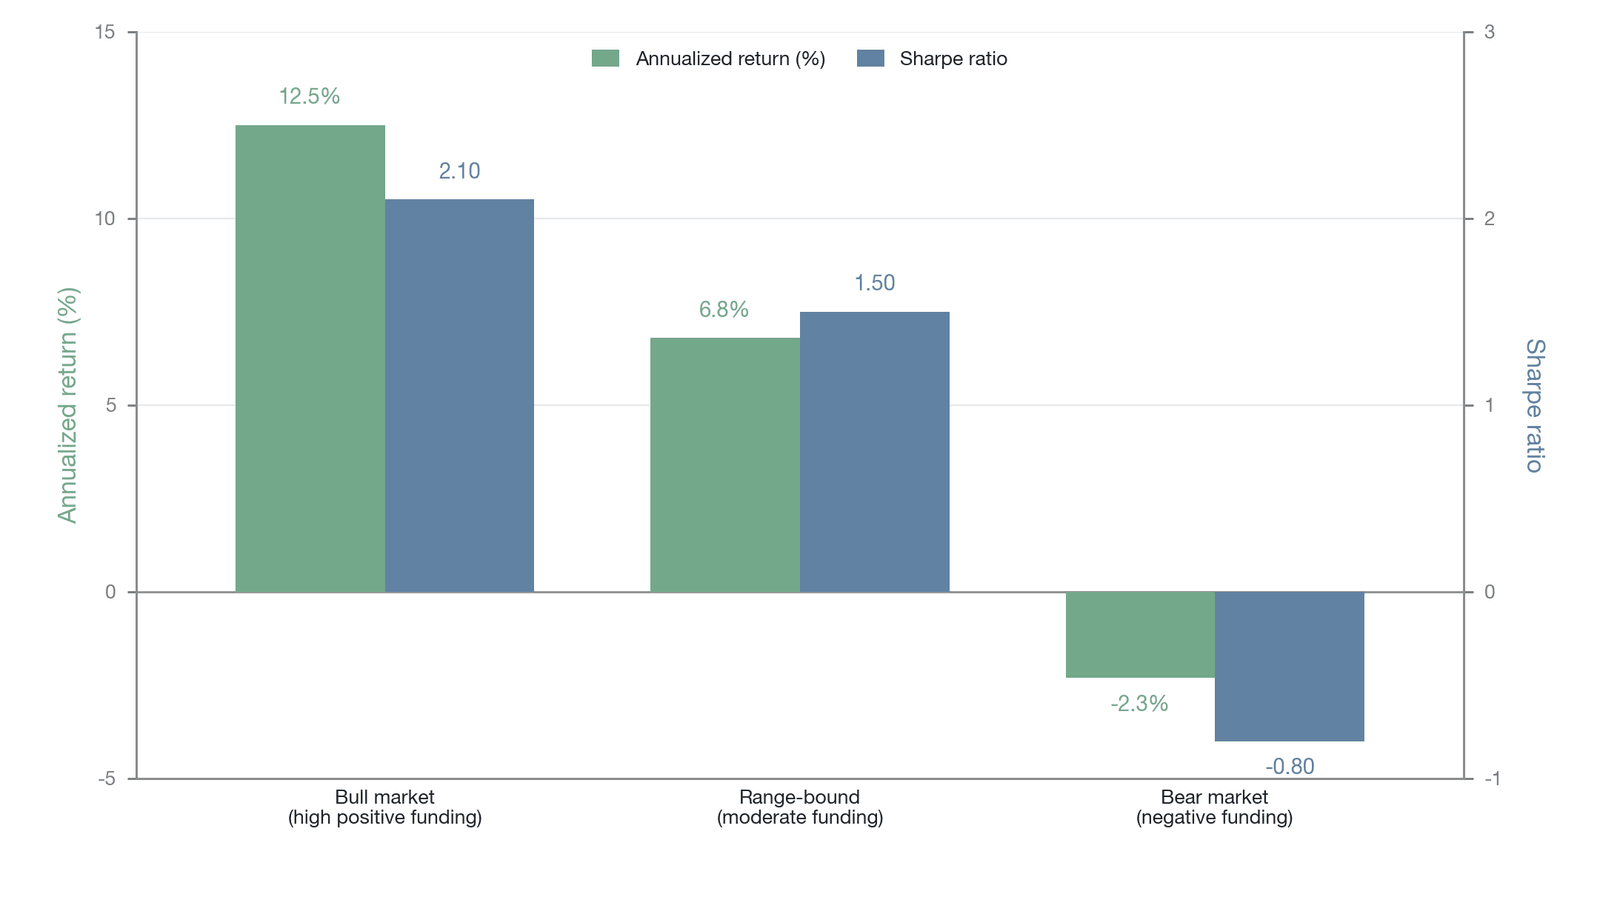
Figure 16-9. The returns and Sharpe ratios of basis arbitrage across different market states (the overall Sharpe ratio is based on He et al. 2022 [4]; the by-state decomposition into bull, bear, and range-bound markets is a representative illustration, not the original by-state series of [4])
Figure 16-9 compares the returns and Sharpe ratios of basis arbitrage across three market states—bull, bear, and range-bound: returns are highest and volatility lowest in a bull market (the Sharpe ratio can exceed 2.0), returns fall markedly in a bear market as the funding rate turns negative, and the range-bound market lies in between.
Importantly, the returns of basis arbitrage exhibit pronounced dependence on the market state. During bull markets, sentiment runs high, leverage demand keeps the perpetual-futures price persistently above the spot price, and the funding rate stays at a relatively high positive level for a long time. In such conditions, the returns of the positive-basis-arbitrage strategy are the highest and least volatile of the three market states. Conversely, during bear markets, panic drives the perpetual-futures price below spot, and the funding rate turns negative. In such conditions, positive-basis arbitrage faces losses, and arbitrageurs must turn to the more difficult negative-basis arbitrage, whose returns are also fraught with uncertainty owing to the cost of spot shorting. In a range-bound market, the basis and funding rate fluctuate little, and although arbitrage returns are lower than in a bull market, they can still provide a relatively stable cash flow. This time-variation in returns is closely tied to the crowding effect. When an arbitrage opportunity becomes widely known and profitable, large amounts of capital pile into the strategy, rapidly compressing the basis and driving down the funding rate, thereby squeezing the excess-profit space. This is precisely the crypto-market version of the Grossman-Stiglitz paradox: arbitrage, in the very act of creating market efficiency, also eliminates the profit space that drives it.
16.4.3 The Ethena effect
The rise of the Ethena protocol marks the shift of basis arbitrage from dispersed execution to a protocolized, scaled paradigm. Its "arbitrage-as-a-service" mechanism (users deposit collateral, the protocol automatically constructs a delta-neutral position, and the funding rate and basis income are distributed in the form of sUSDe) was detailed in Section 16.2.2; this section focuses on the quantitative effects that its scaling produces.
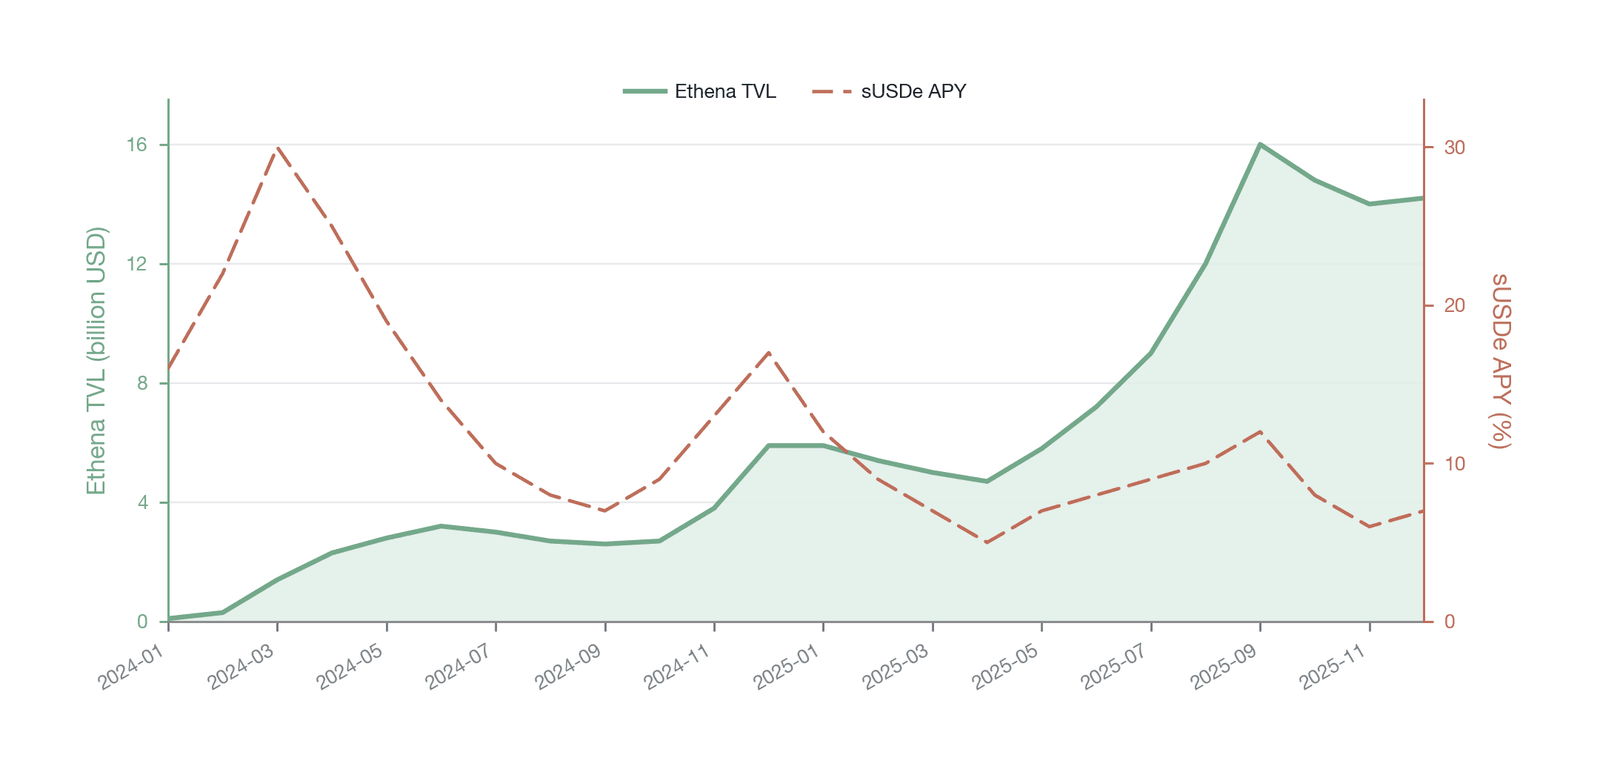
Figure 16-10. The historical trajectory of Ethena's TVL and sUSDe APY (data source: DefiLlama [7], accessed March 10, 2026; the TVL peak of about $16 billion is on the DefiLlama basis, or about $14.5 billion on the USDe-supply/market-cap basis—the two bases are not interchangeable—as of September 2025)
Ethena's success produced an extremely rare scale effect. Its TVL climbed rapidly from under $1 billion within a few months and peaked in September 2025—about $16 billion on the DefiLlama TVL basis, or about $14.5 billion if measured by USDe supply/market cap (the two bases are not interchangeable; the DefiLlama figure is used here [7], accessed March 10, 2026). According to derivatives-industry data, the perpetual short positions Ethena held accounted for about 5% of ether perpetual-futures open interest across the market in early 2024 [8]; at the peak of its scale, on specific BTC and ETH perpetual-futures contracts at some centralized exchanges, industry estimates put its share of that contract's open interest at as much as roughly 10-15% (the basis depends on the specific contract; see Section 17.10 in Chapter 17). This scale turned it from a mere "arbitrageur" into a "market maker" capable of influencing the market itself, producing what is called the "Ethena effect." When the Ethena protocol absorbs vast amounts of capital and builds large short positions, it itself becomes one of the main forces depressing the funding rate. The market thereby enters a textbook reflexive loop: Ethena's high yield attracts large TVL inflows → the growth in TVL forces Ethena to open more perpetual-futures shorts → the enormous short position exerts downward pressure on the funding rate → the decline in the funding rate in turn erodes Ethena's own source of returns. This is a protocolized version of the classic "arbitrage paradox": when an arbitrage strategy is scaled up excessively, its own behavior compresses the space that generates its profit.
Ethena's quarterly revenue data clearly reflect this dynamic. As the figure below shows, Ethena's total revenue peaked at $151 million in the third quarter of 2025, precisely during the high-yield phase when its TVL was growing rapidly, market sentiment was optimistic, and the funding rate was elevated. However, as its TVL topped out at the end of the third quarter and began to decline, and as changing market conditions compressed the funding rate, its quarterly revenue fell accordingly (to about $96 million in the fourth quarter). The staking yield of sUSDe also retreated from an early high of over 20% to single digits. This shows that even protocolized arbitrage infrastructure cannot escape the economic law of diminishing returns.
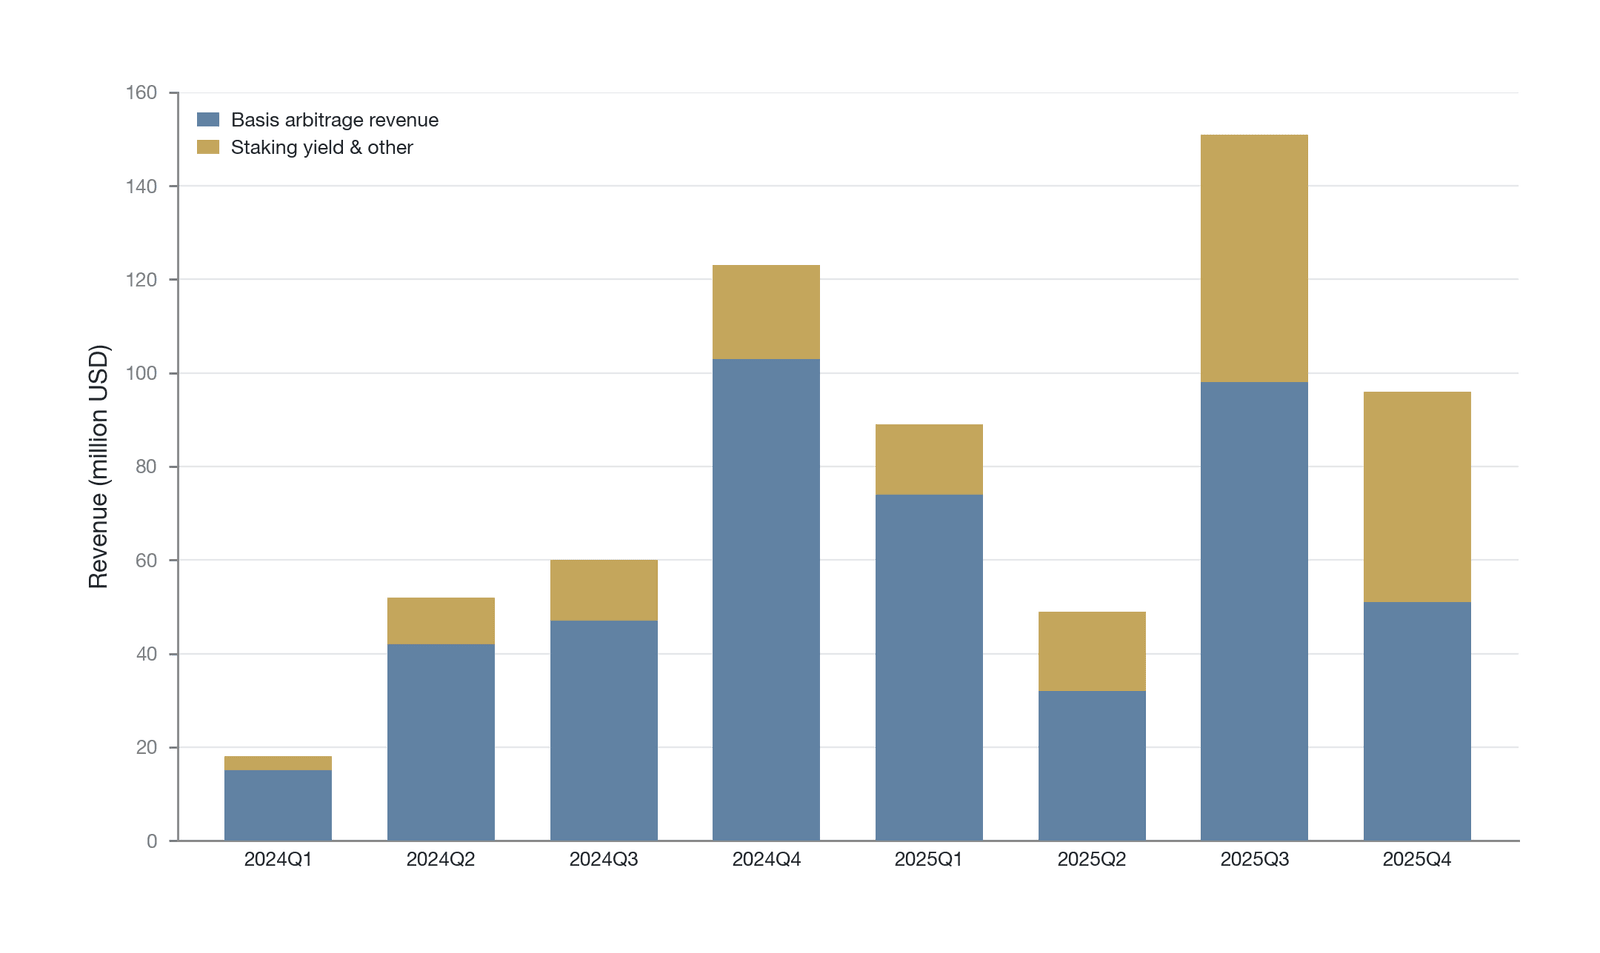
Figure 16-11. The composition of Ethena's quarterly total revenue (data source: Token Terminal [9] "total revenue" basis, accessed March 10, 2026; not interchangeable with the DefiLlama "fees" basis)
Historical precedents warn of the concentrated-unwinding risk of large-scale basis trades. During the global panic triggered by the COVID-19 pandemic in March 2020, the basis trade in the U.S. Treasury market (hedge funds going long Treasury cash securities and short Treasury futures at large scale to earn the basis) suffered chain forced liquidations as margin calls hit; positions that had been nearly riskless caused billions of dollars in losses within days, and stability was ultimately restored only through the Federal Reserve's emergency intervention as lender of last resort. In the crypto space, during the Terra/LUNA collapse of May 2022, many delta-neutral strategies based on perpetual futures saw the "market-neutral" assumption fail under extreme stress as the liquidity of the underlying evaporated instantly and the basis widened sharply. The fundamental institutional difference between the two is that the crypto market has no equivalent "lender of last resort" mechanism to interrupt the positive feedback of a liquidity spiral, and cross-platform margin separation (margin cannot be shared between different CEXs or between a CEX and a DEX) makes the transmission path of a liquidity crisis more fragmented. These cases show that the systemic risk of basis arbitrage is highly nonlinear in strategy scale: when the executors of a single strategy command too large a share, their unwinding demand can exceed the market's absorptive capacity, turning a "riskless" strategy into a source of systemic risk. Ethena's current scale places it under similar risk constraints.
This process clearly displays the feedback loop between arbitrage intensity and market efficiency and provides strong case support for the arbitrage infrastructure hypothesis: when infrastructure providers evolve from dispersed individuals into a concentrated protocol, efficiency improves, but concentration risk follows—a point that Chapter 17 will examine further.
16.4.4 Empirical evidence for price anchoring
The core efficiency function of basis arbitrage is that it constitutes the micro-economic force maintaining the anchoring of the perpetual-futures price to the spot price. Whenever the perpetual-futures price deviates from the spot price because of speculation, leverage, or liquidity imbalance, the profit-seeking behavior of basis arbitrageurs constitutes an endogenous price-convergence force that drives the two back into alignment. This price-anchoring function can be verified through empirical data along several dimensions.
First, there is a significant negative correlation between the intensity of basis-arbitrage activity and the level of the basis. We can proxy the intensity of arbitrage activity by observing the estimated share of delta-neutral positions in perpetual-futures open interest, or changes in exchange margin-lending balances. Mechanistically, one would expect that when the arbitrage activity reflected in these proxy indicators strengthens, the level and volatility of the basis typically decline in turn, which supports the corrective effect of arbitrage on price deviations (note that arbitrage intensity here is measured by proxy indicators; one should avoid inferring arbitrage intensity from spread convergence itself, which would be circular). The mean-reversion property of the funding rate observed in Chapter 15 is driven, at bottom, by basis arbitrage. When the funding rate is too high, arbitrageurs enter the market to build short positions and collect the rate, thereby depressing it; when the rate is too low, the reverse operation applies—ultimately pushing the rate back toward its long-run mean.
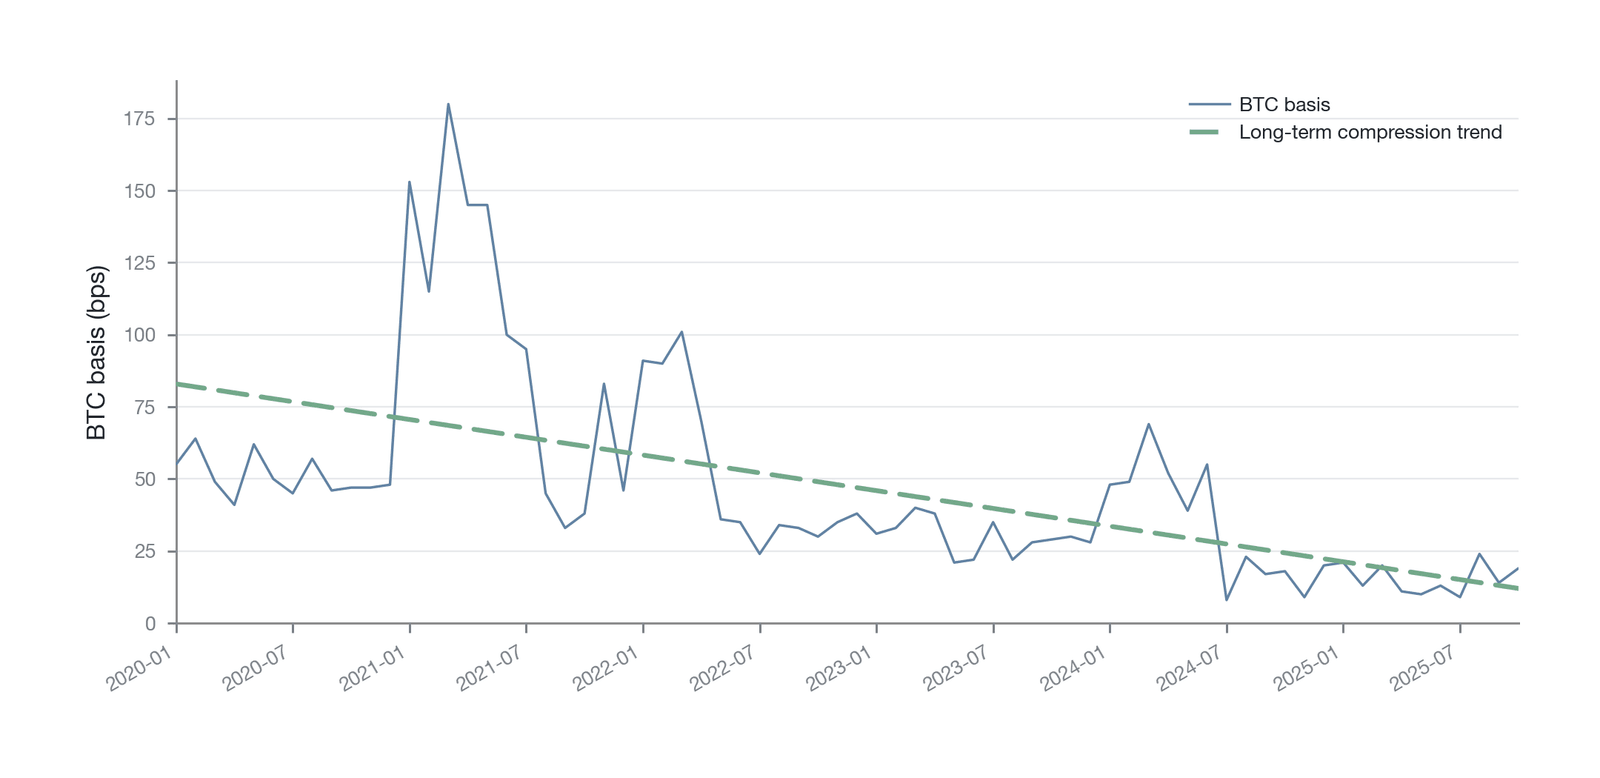
Figure 16-12. The long-run compression trend of the basis (Data source: Binance and OKX exchange API data [10])
Taking BTC as an example, Figure 16-12 tracks the long-run evolution of the spot-perpetual basis from 2020 to 2026: both the average level and the amplitude of fluctuation have fallen markedly, and the basis of tens of basis points in the early years has been compressed under normal market conditions to a low of a dozen or so basis points—the most direct evidence that the arbitrage infrastructure is steadily maturing.
Second, from a more macro perspective, as the crypto market has matured, the number and capital scale of basis arbitrageurs have grown continuously, producing a long-run "compression" trend in the basis. A review of the data from recent years shows that both the average level and the amplitude of the spot-perpetual basis for mainstream assets (such as BTC and ETH) exhibit a clear downward trend. In the early market, a basis of tens or even over a hundred basis points was not uncommon, whereas today, under normal market conditions, the basis is typically confined to a very narrow range. This declining curve is the most direct evidence of improving market efficiency; it shows that the arbitrage infrastructure is becoming ever more complete and efficient, able to identify and repair price deviations more quickly. The strength of this "efficiency anchor," however, is not unlimited. Under extreme market stress—for example, during a violent price crash or a liquidity crisis—arbitrageurs may be forced to unwind because of margin risk, forced liquidation, or counterparty risk, causing the arbitrage force to weaken or even vanish. At such times the anchoring mechanism may temporarily "fail," producing a persistent deviation of the basis; these "arbitrage failure" scenarios will be analyzed in depth as core anomalies in Chapter 18.
16.5 Cross-exchange arbitrage
Cross-exchange arbitrage is the core mechanism that unifies globally fragmented trading markets. In a crypto market that lacks central clearing and unified regulation, price differences for the same asset across different trading venues are almost inevitable. Cross-exchange arbitrageurs drive these spreads to converge and integrate global liquidity, constituting the second pillar of this chapter's arbitrage infrastructure hypothesis.
The generation, propagation, and elimination of a spread constitute the micro-foundation for understanding cross-exchange arbitrage. From early manual cross-platform arbitrage to today's sub-millisecond automated competition, the evolutionary path of arbitrage execution clearly reflects how technological progress has advanced market efficiency. The classic study by Makarov and Schoar (2020) [1] revealed the deep institutional frictions behind the persistence of cross-border spreads, while the long-run compression trend of cross-exchange spreads provides the empirical basis for a "core-periphery" efficiency model.
16.5.1 The life cycle of a price spread
The law of one price (see Section 16.1.1) is far from perfectly satisfied in the digital asset market, and the market's distinctive structural features provide the structural conditions for spreads to arise. The life cycle of a spread—from its generation and propagation to its eventual elimination by arbitrage activity—fully reveals the dynamic process by which market efficiency is generated.
The generation of a spread is rooted in the market's inherent segmentation. First is the delay in information propagation. Although information travels globally at extremely high speed, on the scale of milliseconds or even microseconds, delays still exist. The price impact of a large buy order on Coinbase takes some time to propagate fully to the order books of Binance or Kraken. This tiny delay constitutes the "time window" that high-frequency arbitrageurs exploit. Second is the segmentation of liquidity. Hundreds of exchanges worldwide each have their own order books and liquidity pools. When one exchange faces a large one-directional order flow (for example, heavy buying or selling), its limited liquidity depth causes a significant price deviation, while at that moment prices on other exchanges may not yet have been affected, and a spread thereby arises. Finally, differences in institutions and infrastructure also play an important role. Differences in exchanges' fee structures, API performance, physical server locations, and even deposit and withdrawal speeds all affect trader behavior and the price-formation process, generating or entrenching spreads.
Once a spread forms, it "propagates" through the market via arbitrageurs' observation and action. At first, perhaps only a few Tier 1 high-frequency traders at the trading frontier can capture the signal rapidly on their global server clusters. Their algorithms quickly assess whether the magnitude of the spread is enough to cover their highly optimized execution costs. If the answer is yes, the arbitrage trade is triggered: buying on the lower-priced exchange and selling on the higher-priced exchange. This action is itself the beginning of the spread-elimination mechanism. Buying pushes up the price on the low-price exchange, and selling depresses the price on the high-price exchange, thereby narrowing the spread.
As information spreads further, Tier 2 quantitative funds and a broader set of traders begin to observe the opportunity. Their reaction speed may be on the order of seconds or even minutes, but their collective action further drives prices toward convergence. This process forms a tiered transmission of efficiency: the fastest arbitrageurs capture the largest and most perishable profits and complete the initial price calibration; subsequent participants clean up the remaining, smaller spreads until the magnitude narrows to a level at which even the lowest-cost participants can no longer profit. The spread-convergence process above is not always monotonically decreasing, however. In a highly volatile market, arbitrage itself may temporarily widen the spread by consuming order-book depth: when arbitrageurs execute large buy orders on the low-price exchange, their market impact may push that exchange's price up by more than the spread converges, producing an oscillating "widen-converge" dynamic. In addition, when market makers sense the presence of active arbitrageurs, they may cancel orders or widen their quotes to reduce their own adverse-selection risk, and this strategic behavior may likewise delay or even temporarily reverse the spread's convergence. At such times the spread does not vanish entirely but stabilizes at a "residual" level reflecting the market's average arbitrage cost. The existence of this residual validates the crypto-market version of the Grossman-Stiglitz paradox: in a market with no spread at all, no arbitrageur would have any incentive to keep its prices aligned. A tiny but persistent spread is therefore the cost that must be paid to keep the arbitrage infrastructure functioning effectively.
16.5.2 The evolution of the latency race
The history of cross-exchange arbitrage is a history of continuous iteration in technology and strategy, at the core of which is the relentless pursuit of ever-lower latency. From the manual cross-platform arbitrage of Bitcoin's infancy to today's sub-millisecond automated competition dominated by high-frequency trading firms, this path clearly shows how arbitrage evolved from simple opportunity discovery into a highly precise and capital-intensive science.
In the early market stage before 2017, cross-exchange arbitrage was typically conducted in a rudimentary way, often called manual cross-platform spread arbitrage. Traders manually observed price differences on the web pages of different exchanges, bought Bitcoin manually on one platform, then withdrew it and deposited it on another, higher-priced platform to sell, earning the difference. The latency of this process was measured in hours or even days and involved cumbersome manual operations and enormous price-fluctuation risk. Market efficiency at the time was extremely low; spreads could reach more than 10% and persist for days, leaving ample profit space for this slow form of arbitrage. The limitations of this model, however, were obvious: the network-confirmation delays of withdrawal and deposit, exchange processing speed, and counterparty risk all severely limited the scale and efficiency of arbitrage.
The 2017 bull market and the spread of API trading ushered arbitrage into the "automation era." Traders began writing scripts to fetch real-time quotes from multiple exchanges via API and to execute trades automatically when a spread was detected. This slashed arbitrage latency from hours to seconds or even minutes. In this phase, arbitrageurs no longer needed to transfer assets frequently between exchanges. They pre-deposited fiat and crypto as inventory at several major exchanges, and once a spread was detected, they could simultaneously execute a buy order on the low-price exchange and a sell order on the high-price exchange, completing the hedge. After the market stabilized, they rebalanced asset positions across exchanges through slow on-chain transfers. This "inventory management" model significantly improved arbitrage efficiency, made high-frequency intraday trading possible, and compressed cross-exchange spreads to below 1%.
After 2020, as traditional high-frequency trading firms such as Jump Trading and Wintermute entered in force, the latency race in the crypto market was pushed to an extremely high level, entering the "sub-millisecond era." These top HFT firms deploy their own servers near the data centers of the world's major exchanges and connect via dedicated lines to obtain the lowest quote and trade latencies. Their competitive edge lies no longer merely in strategy but in a contest of infrastructure. From hardware and networks (microwave towers) to software (highly optimized C++ code), every link involves heavy investment to shave off a few microseconds of latency. In their world, the discovery, decision, and execution of an arbitrage opportunity are all completed within a few hundred microseconds. This extreme speed allows them to capture the fleeting, basis-point-scale spreads. Their high-frequency activity has effectively eliminated the vast majority of simple arbitrage opportunities, forcing other participants toward more complex, longer-horizon strategies.
The ultimate result of this latency race is a great improvement in market efficiency. Spreads that once took hours to erase now converge within seconds. It has also clearly stratified the arbitrage ecosystem: Tier 1 HFT firms dominate the frontier latency game, Tier 2 quantitative funds seek more complex statistical-arbitrage opportunities at the second and minute scales, and Tier 4 individual traders have been almost entirely squeezed out of pure cross-exchange spread arbitrage. This deep coupling with exchange infrastructure, however, has also created a new dimension of operational risk. When a major exchange suffers an outage, an API failure, or a suspension of withdrawals, all Tier 1 participants relying on that exchange as one leg of their arbitrage face single-leg exposure risk—the perilous situation in which one leg of a position has been established while the other cannot be hedged. During the FTX collapse, the funds of many market makers holding arbitrage positions on the platform were frozen, starkly revealing exchange-concentration risk as a systemic vulnerability of the arbitrage infrastructure. The end point of the latency race is a highly automated, global price-integration mechanism dominated by algorithms and infrastructure.
16.5.3 The Makarov-Schoar effect
Although technological progress has significantly compressed cross-exchange spreads, a central question remains: why can certain spreads—especially cross-border spreads involving different national fiat currencies—persist, sometimes reaching significant magnitudes? Makarov and Schoar (2020) [1] offered a classic explanation. Their findings reveal that beyond technological frictions, institutional frictions (especially capital controls) are the key to understanding the limits of crypto-market efficiency.
By analyzing tick-level data from 34 exchanges worldwide during 2017–2018, Makarov and Schoar documented the extent to which the crypto market violated the law of one price: spreads between exchanges within the same country typically did not exceed 1%, but cross-border spreads were large and could persist for weeks or even months (as noted earlier in Section 16.1.1, the Korean "kimchi premium" peaked above 40% and the Japan-U.S. spread was about 10%). They estimated that during the period of violent market fluctuation from December 2017 to February 2018, the total potential profit from global cross-exchange arbitrage reached at least $2 billion.
If such enormous riskless profit existed, why did arbitrageurs not eliminate it entirely? Makarov and Schoar's analysis points out that the answer lies not in arbitrageurs being insufficiently fast or clever but in the fact that capital could not flow freely. A typical cross-border arbitrage operation is: buy Bitcoin with U.S. dollars on a U.S. exchange, then move the Bitcoin to a Korean exchange and sell it for Korean won. At that point, although the arbitrageur has earned a won profit, the initial capital (U.S. dollars) has become won. Because of Korea's strict capital controls, converting that won profit back into dollars at scale and low cost and remitting it abroad is extremely difficult. This means arbitrage capital flows "one way" and easily gets "stuck" in a particular country. Once large amounts of arbitrage capital flowed into Korea, it was trapped within the local financial system and could not flow back to execute a new round of arbitrage. Arbitrage activity therefore soon halted for lack of capital, and the large spread persisted.
To test this hypothesis further, Makarov and Schoar conducted two ingenious tests. First, they compared the spreads of "crypto-fiat" pairs with those of "crypto-crypto" pairs. They found that at the same Korean exchange, when the price of Bitcoin against the won carried a premium of as much as 20%, the price of Bitcoin against Ethereum was essentially in line with the global market, with a spread of only about 3%. This is because the exchange and transfer between cryptocurrencies is completed entirely on-chain and can bypass the traditional banking system, escaping the constraint of capital controls. This comparison strongly confirms that institutional frictions are the main source of the spread. Second, they found that countries with stricter capital controls showed stronger correlation in the fluctuations and premium levels of their Bitcoin prices with those of other likewise-controlled countries, forming a "regulated club." This indicates that capital controls are a common systemic factor causing market segmentation and efficiency loss.
The Makarov-Schoar effect provides key empirical support for this chapter's arbitrage infrastructure hypothesis. It strongly shows that arbitrage returns are not always a simple manifestation of market inefficiency but, more often, the risk compensation that arbitrageurs demand for overcoming enormous institutional frictions. When arbitrageurs must confront risks such as capital being frozen and legal-policy uncertainty, the "profit" they earn is in fact the reward for providing the entire market with the infrastructure services of "cross-border liquidity" and "price integration." The size of the spread is a direct measure of the cost of this service.
16.5.4 The long-run compression of spreads
Although the Makarov-Schoar effect reveals persistent spreads caused by institutional frictions, over a longer horizon, as the market has matured and the arbitrage infrastructure has become more complete, the overall level of cross-exchange spreads has undergone a marked long-run compression. This downward trend is the most direct evidence that arbitrage activity continuously compresses spreads. It shows that despite structural obstacles, arbitrageurs' sustained activity is indeed gradually drawing global market prices together and improving overall efficiency.
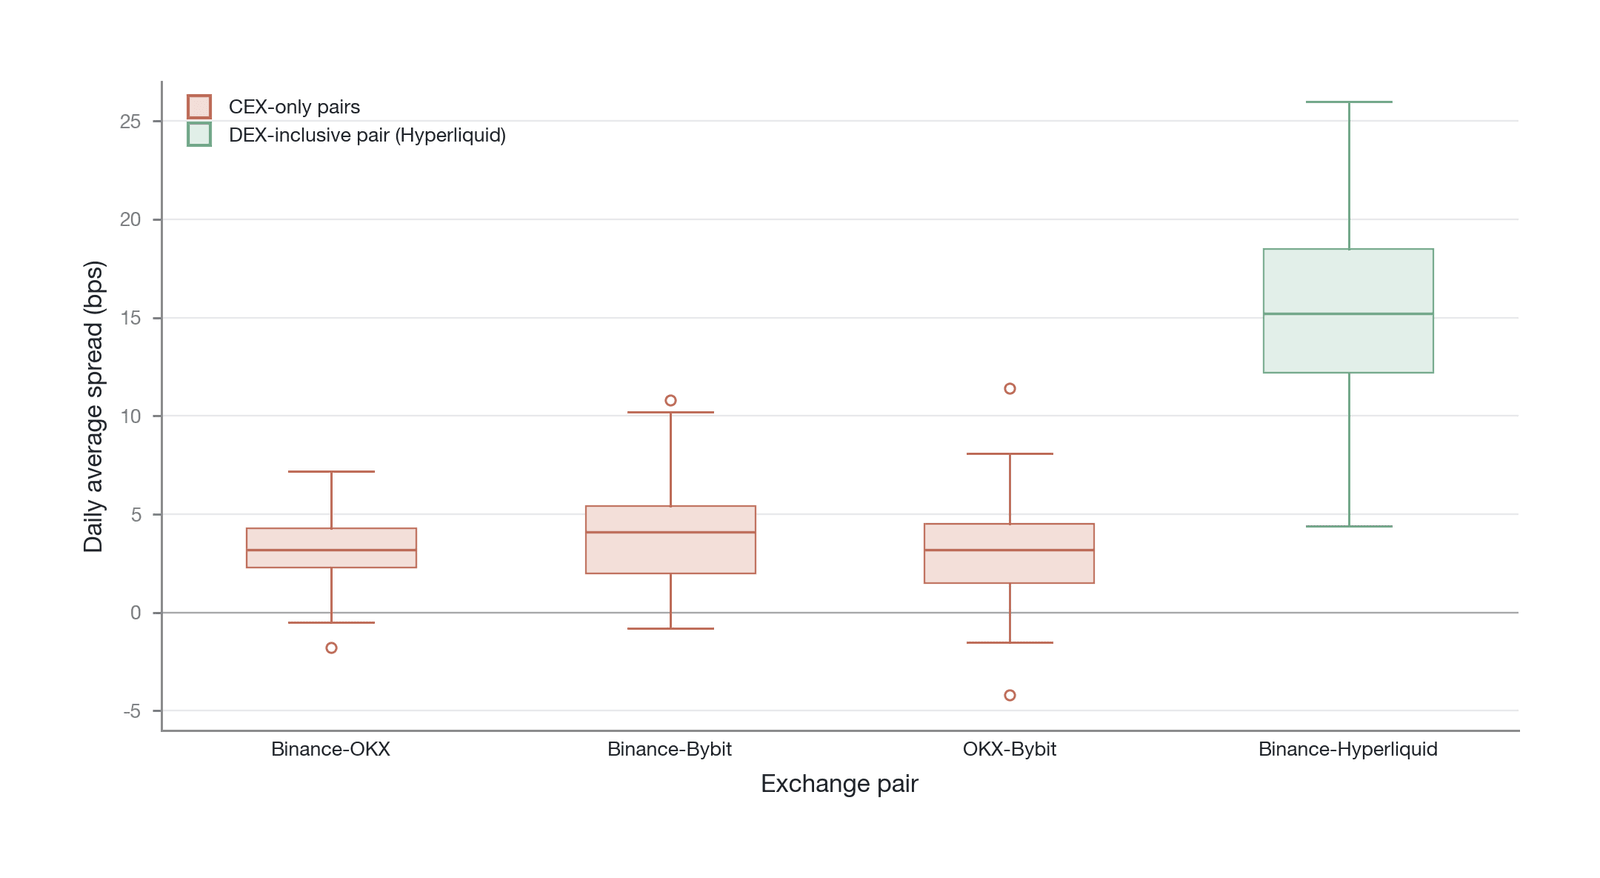
Figure 16-13. The characteristics of cross-exchange perpetual-futures spreads (Data source: Binance, OKX, and Bybit exchange API data [10])
Figure 16-13 shows the spreads of major exchanges' BTC perpetual futures relative to the industry benchmark Binance since early 2023, exhibiting three key features. First, spreads persist but their absolute level is now far below that of the Makarov-Schoar period—the median daily spread among purely centralized exchanges has narrowed to about 3-4 basis points, while pairs involving decentralized exchanges (such as between Binance and Hyperliquid) are higher, at about 15 basis points, and this stratification itself reflects the enormous overall improvement in market efficiency. Second, spreads widen briefly during periods of violent market fluctuation and fall back rapidly as arbitrage intervenes. Third, the systematic stratification of spreads across exchanges introduces the "core-periphery" structural model discussed below.
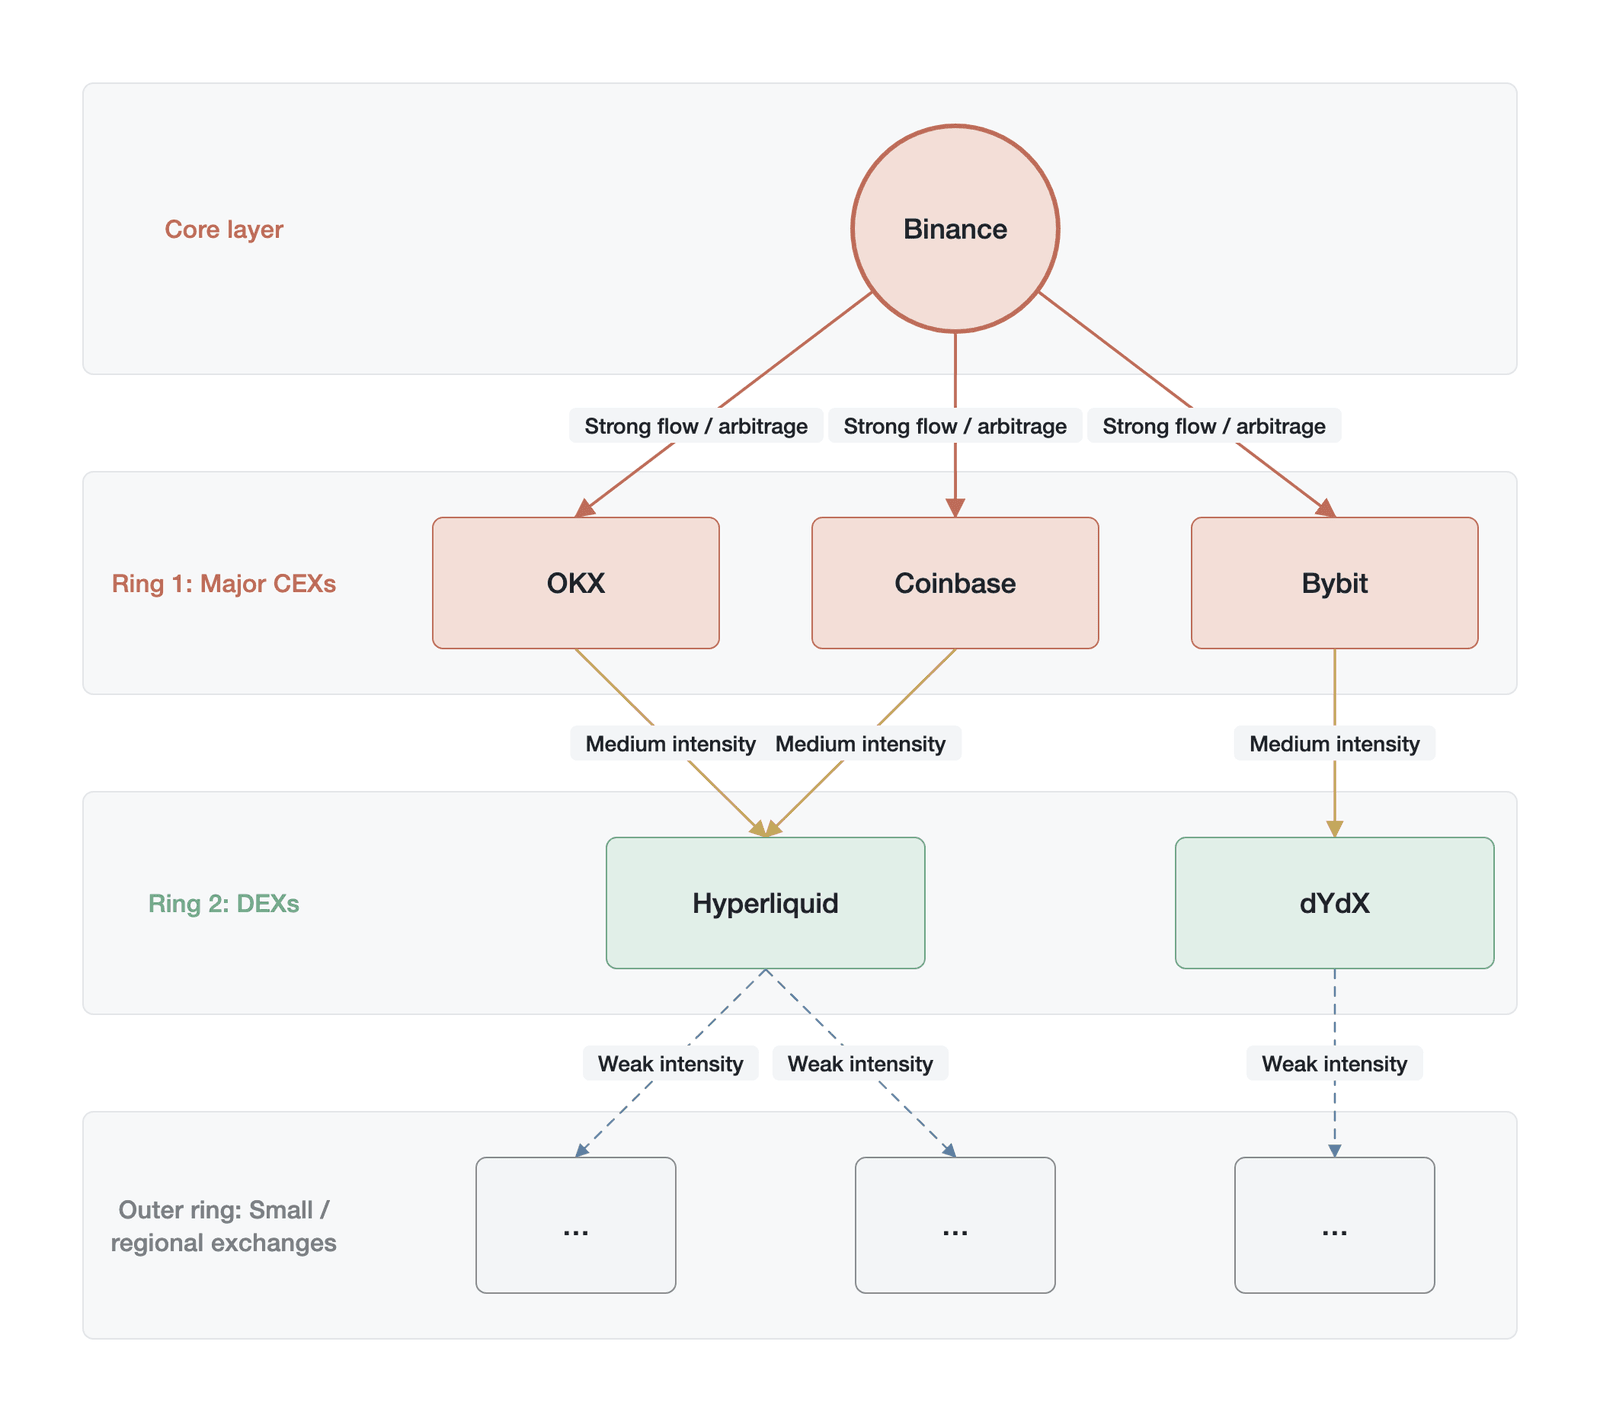
Figure 16-14. The core-periphery efficiency structure of cryptocurrency exchanges (Data source: a conceptual schematic constructed by the author)
The current efficiency structure of the global cryptocurrency market can be depicted as a "core-periphery" model. As the figure above shows, this structure consists of a small number of core "central markets" and a large number of "peripheral markets." The central markets—with Binance at the core and leading exchanges such as Coinbase next—have the highest liquidity, the strongest price-discovery capability, and the most complete infrastructure. Most of the world's price information and trading volume originates here; they are the "emission source" of global prices. The peripheral markets include other second- and third-tier exchanges, whose liquidity is thinner and whose price-discovery capability is weaker, and whose prices largely follow the movements of the central markets. Cross-exchange arbitrage assumes the price-transmission function in this structure: it rapidly propagates price movements from the central markets to the peripheral markets, ensuring that peripheral prices do not deviate too far from the center. The "efficiency distance" of an exchange from a central market (such as Binance) can be measured along three dimensions: (1) the average absolute spread , which measures the magnitude of pricing deviation; (2) the spread half-life , which measures the time required for the spread to converge from its peak to the equilibrium level and reflects the speed of information transmission; and (3) the Hasbrouck information share , which measures the exchange's contribution to global price discovery. The greater the efficiency distance (that is, the wider the spread, the slower the convergence, and the lower the information share), the more peripheral the exchange's position in the global efficiency hierarchy.
This core-periphery structure is a natural result of arbitrage competition. Because arbitrageurs always operate first between the markets with the best liquidity and lowest costs, the spreads among central markets are eliminated first and their efficiency is the highest. Arbitrage that connects the center with the periphery, or one peripheral market with another, involves higher slippage and risk costs, so its equilibrium spread is naturally higher. The efficiency of the entire market therefore exhibits a gradient distribution that declines from the center toward the periphery. The significance of this model is that it recasts cross-exchange arbitrage from simple "error correction" into a strategic force that shapes the entire market structure and efficiency hierarchy. Through the optimal allocation of their capital, arbitrageurs in effect define for the whole ecosystem what is "central" and what is "peripheral," and continuously maintain the dynamic stability of this hierarchy.
16.6 Triangular arbitrage
In the arbitrage ecosystem of perpetual futures, spot-futures-perpetual triangular arbitrage (hereafter "triangular arbitrage") is a composite strategy that simultaneously checks the pricing of three interrelated market tiers for the same asset: spot, traditional delivery futures, and perpetual futures. By constructing a three-point closed loop, the strategy captures pricing inconsistencies produced by the joint action of different term structures and financing costs.
When the same asset—Bitcoin, for example—simultaneously has an active spot market (such as Coinbase), a strictly regulated delivery-futures market (such as the CME's BTC futures), and a globally liquid perpetual-futures market (such as Binance's BTC/USDT perpetual futures), a multi-tiered pricing structure forms. In theory, the prices of these three markets should be tightly locked together by no-arbitrage relationships. Because they each have different participant structures, institutional designs, liquidity characteristics, and information-transmission paths, however, temporary inconsistencies among the prices inevitably arise. The work of the triangular arbitrageur is to identify and correct these inconsistencies within the three-market system, thereby integrating information dispersed across different "time layers" and "financial worlds" into a unified, internally consistent asset term structure.
After the United States approved spot Bitcoin ETFs in 2024, this mechanism gained unprecedented importance. Traditional financial institutions enter through compliant spot ETFs and CME futures, while crypto-native forces dominate the perpetual-futures market. Triangular arbitrage has therefore become the key information conduit and efficiency anchor connecting these two parallel but increasingly interwoven financial systems. This section dissects the theoretical foundation and operating logic of triangular arbitrage and, through cases, reveals how it has reshaped the term structure of crypto assets in the post-ETF era and become a key integrator of market efficiency.
16.6.1 Theoretical foundations
Triangular arbitrage can exist because two classic no-arbitrage pricing relationships coexist within an expanded market system and may come into temporary conflict. These two relationships are the "flow anchoring" relationship connecting spot and perpetual futures, and the "point convergence" relationship connecting spot and delivery futures.
The first is the perpetual-futures "flow anchoring" relationship set out in Section 16.1.2, in which the funding rate mechanism anchors the perpetual-futures price near spot through continuous cash-flow payments:
Relationship A:
The second is the traditional cost-of-carry model, which defines the no-arbitrage price of delivery futures through forced price convergence at maturity:
Relationship B: , where is the spot price, is the cost-of-carry rate, and is the time to maturity
When the spot, perpetual-futures, and delivery-futures markets all exist simultaneously, a "triangular closed loop" forms. If the market were perfectly frictionless and efficient, Relationships A and B should be able to coexist in harmony. In reality, however, the financing cost implied by the perpetual futures under Relationship A (the funding rate) and the financing cost implied by the delivery futures under Relationship B (the futures basis) often diverge. We call this divergence the "triangular residual."
This residual has important economic meaning. It essentially reflects the market's different pricing of "short-term financing cost" (embodied in the high-frequency-settled funding rate) and "forward financing cost" (embodied in the one-off-at-maturity futures basis). For example, when market sentiment is extremely optimistic and large numbers of retail traders enter the perpetual-futures market to build long positions, the funding rate may rise to a high level (say, 30% annualized), while during the same period the CME futures market, dominated by institutional participants, may remain relatively calm, with its basis implying an annualized yield of only 15%. This 15% difference is the direction-neutral profit opportunity that triangular arbitrageurs can capture (as described in Section 16.4.2, such returns are not truly riskless but compensation for frictions such as execution lag, margin lock-up, and counterparty risk).
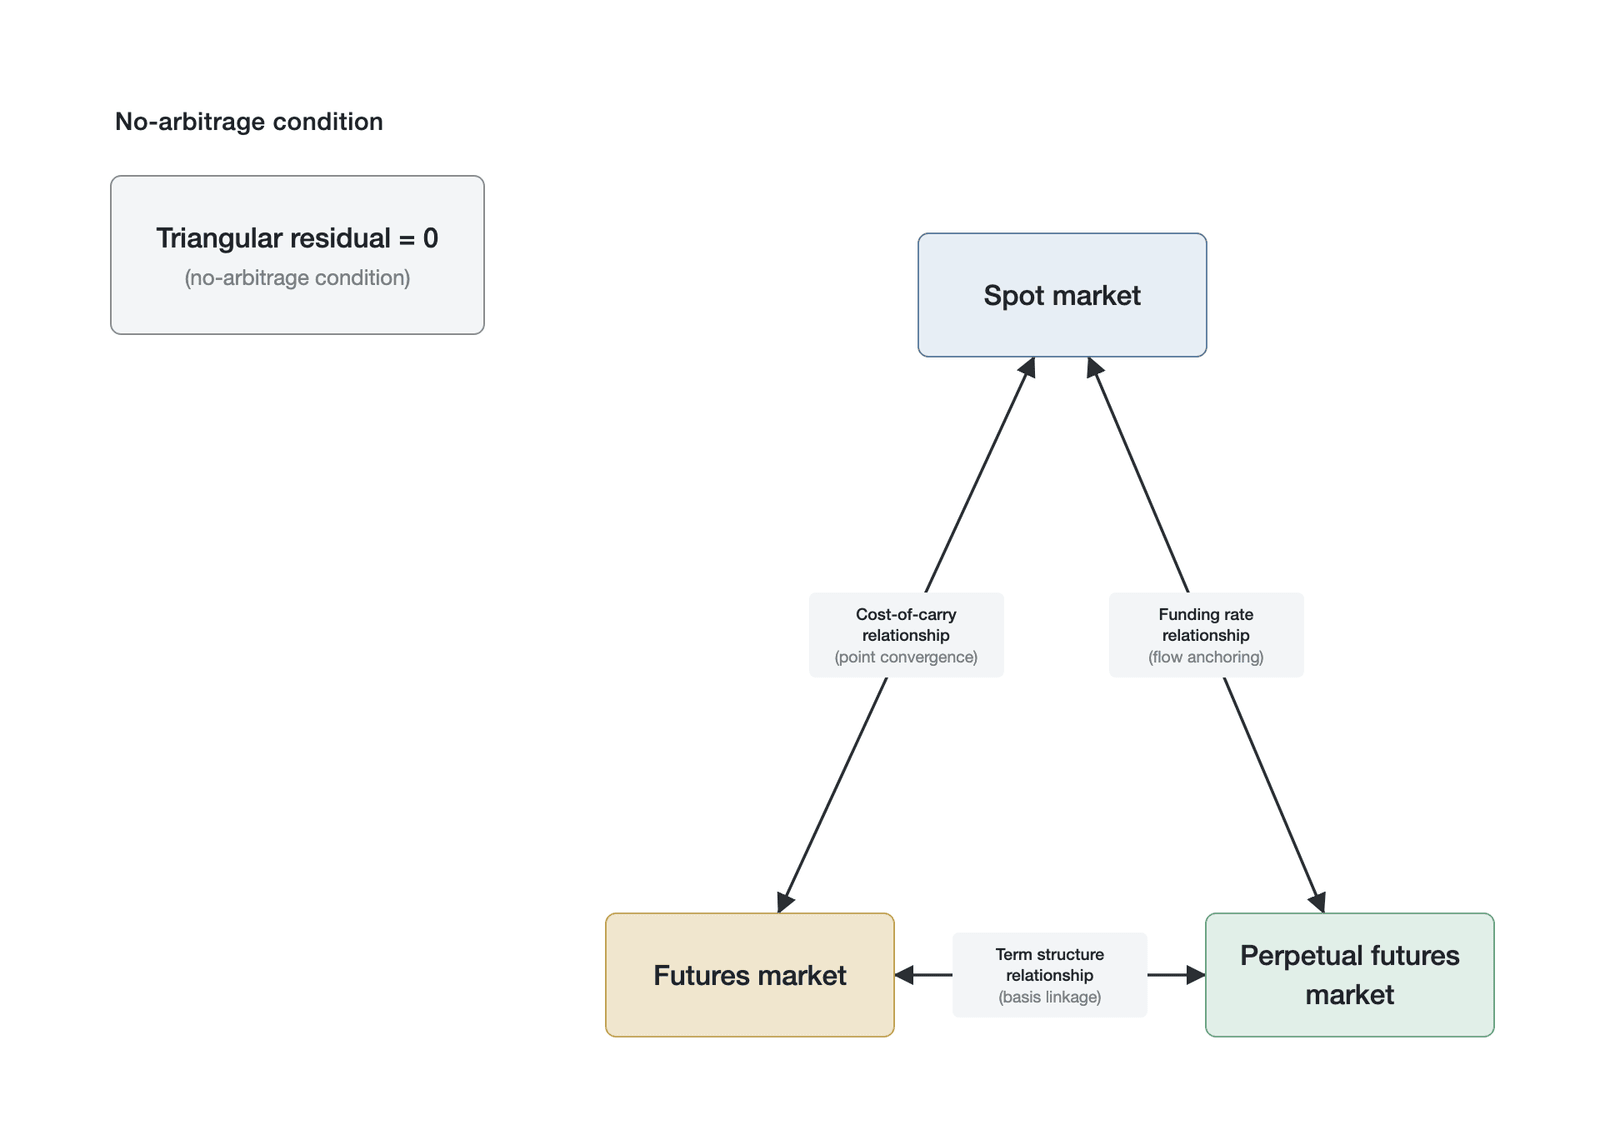
Figure 16-15. The three no-arbitrage relationships of triangular arbitrage (Data source: a conceptual schematic constructed by the author)
Figure 16-15 presents the three no-arbitrage relationships on which triangular arbitrage depends: the "flow anchoring" relationship connecting spot and perpetual futures (Relationship A), the "point convergence" relationship connecting spot and delivery futures (Relationship B), and the implied financing-cost consistency relationship between perpetual and delivery futures derived from the first two (Relationship C). When all three relationships hold simultaneously, no arbitrage opportunity exists; when any one of them deviates—that is, a "triangular residual" appears—the arbitrageur can capture riskless profit by constructing positions across the three legs.
16.6.2 Construction and execution logic
The construction logic of triangular arbitrage is essentially to build a portfolio with zero net risk exposure across three markets so as to lock in and extract the "triangular residual." Its core is to short simultaneously in the market that is overpriced (high implied financing cost) and go long in the market that is underpriced (low implied financing cost), hedging through the spot market.
Take the scenario mentioned earlier: suppose that at a given moment the funding rate of BTC perpetual futures, converted to annualized terms, is 30%, while the annualized basis of the same asset's CME delivery futures maturing in three months is only 15%. The arbitrageur identifies this persistent 15% annualized differential and constructs the arbitrage position along the following logic.
The arbitrageur first shorts a certain quantity (say, 1 BTC) of perpetual futures on a liquid exchange such as Binance, with the aim of collecting the annualized funding rate of as much as 30%. Because the funding rate is typically settled every 8 hours, the arbitrageur will continuously receive cash-flow income. At the same time, the arbitrageur goes long an equivalent amount of delivery futures maturing in three months on the CME, paying the annualized basis cost of 15%; by buying the futures, the arbitrageur locks in a lower future purchase price and hedges the price risk of the perpetual-futures short. In theory, one perpetual-futures short and one futures long already constitute a delta-neutral portfolio, but in practice, to hedge risk more precisely and manage margin, the arbitrageur may hold a small amount of assets or cash in the spot market to cope with the unrealized profit and loss from price fluctuations.
Through this portfolio, the arbitrageur constructs a market-neutral position whose profit and loss no longer depend on the absolute rise or fall of the Bitcoin price and whose net return approximately equals the difference between the implied financing costs of the two markets: 30% − 15% = 15% (annualized).
The theoretical return above is eroded by multiple constraints in actual execution. First, the standard contract size of CME Bitcoin futures is 5 BTC (with a micro contract of 0.1 BTC), whereas the minimum trading unit of Binance perpetual futures is 0.001 BTC, and this difference in contract specifications increases the difficulty of precise hedging. Second, CME trades from Sunday to Friday U.S. Eastern time, whereas Binance perpetual futures trade around the clock, which means the arbitrageur faces the risk of being unable to adjust one leg while the CME is closed. Furthermore, the CME's SPAN margin system is entirely incompatible with Binance's USDT margin system, so the arbitrageur must lock up margin separately at both ends, and the actual capital efficiency is far below the theoretical calculation. Finally, CME futures settle in U.S. dollar cash, whereas Binance perpetual futures settle in USDT, so there is a risk that USDT depegs from the dollar. Although the deviation is usually minimal, USDT has briefly deviated from its $1 peg during periods of market panic, adding an extra risk dimension to cross-system arbitrage.
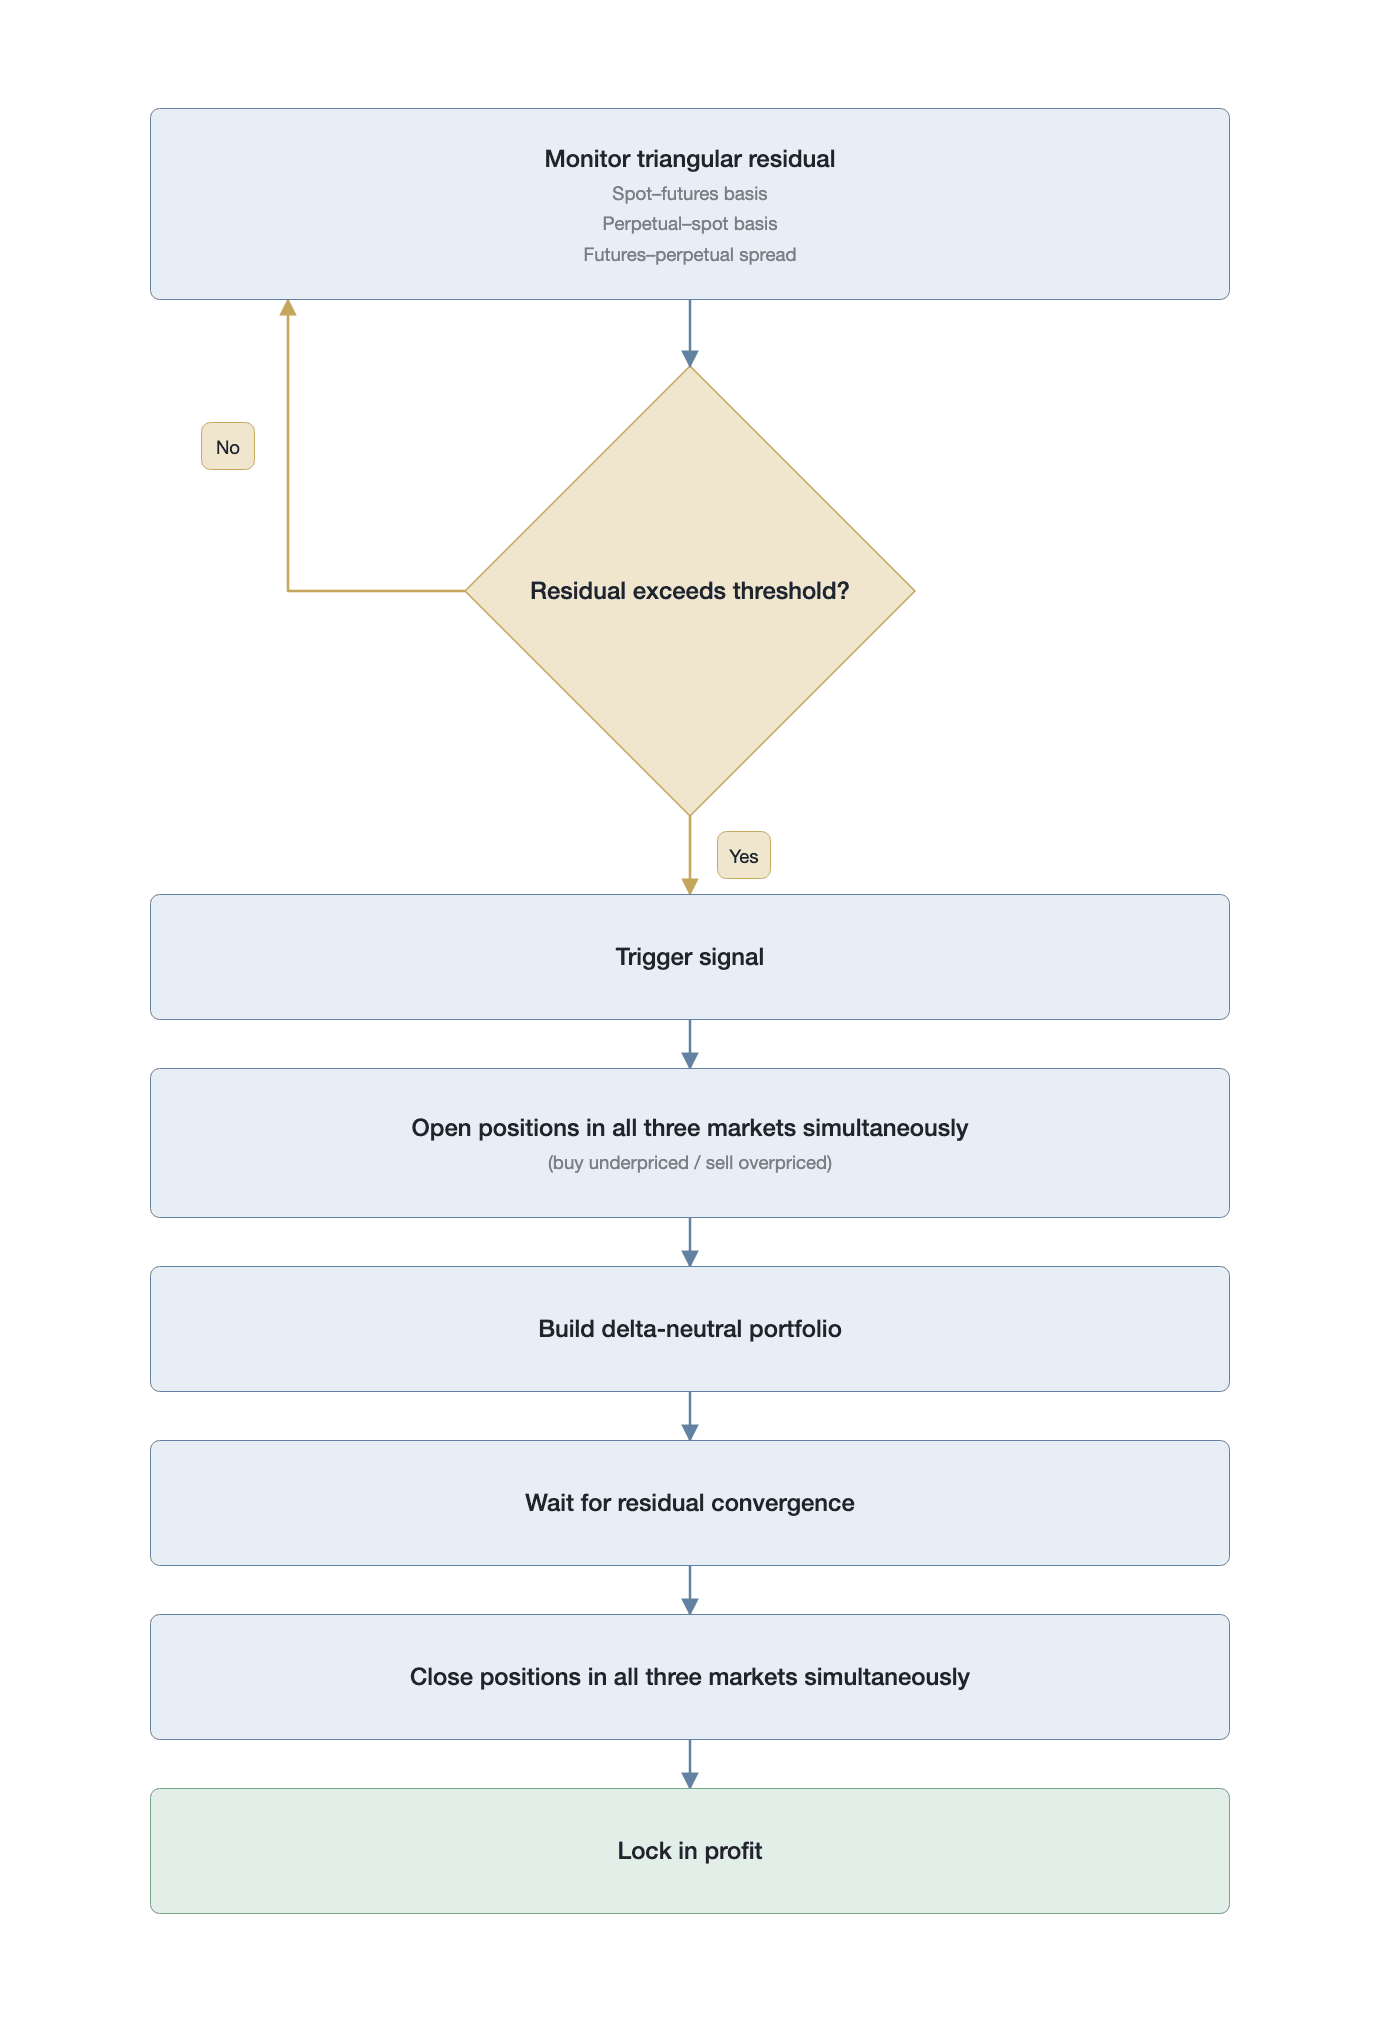
Figure 16-16. The execution decision flow of triangular arbitrage (Data source: constructed by the author)
The figure above presents, in the form of a decision flow, the execution logic of a complete triangular arbitrage. The flow begins with continuous monitoring of the triangular residual—that is, tracking the basis relationships among spot-futures, perpetual-spot, and futures-perpetual. When the residual exceeds a preset threshold, an arbitrage signal is triggered, and the arbitrageur simultaneously opens positions in the three markets, buying the relatively underpriced leg and selling the relatively overpriced leg, and constructing a delta-neutral portfolio to strip out directional price risk. Before the residual converges, the arbitrageur continues to hold the portfolio, collecting the cash flow corresponding to the difference between the implied financing costs of the two markets; once the residual converges, the arbitrageur simultaneously closes positions in the three markets, and the locked-in net return approximately equals the difference between the two markets' implied financing costs, less all execution costs. If the residual does not exceed the threshold, the flow returns to continuous monitoring.
This behavior is central to calibrating market efficiency. When large numbers of arbitrageurs execute this strategy, the short-side force in the perpetual-futures market increases and exerts downward pressure on its price and funding rate, while the long-side force in the futures market increases and lifts the futures price, compressing its basis. Ultimately the implied financing costs of the two markets converge, the market's term structure is "flattened" again, and the triangular residual vanishes—until the next imbalance appears.
Entering 2024, the approval of spot Bitcoin ETFs brought triangular arbitrage an entirely new dimension and set of participants. A larger-scale, more compliant triangular structure formed: the secondary-market price of the spot ETF ↔ CME Bitcoin futures ↔ global perpetual futures. The authorized participants of the ETF are themselves professional arbitrageurs who, through the creation and redemption mechanism, ensure that the ETF price tracks its net asset value closely. When the ETF's secondary-market price, the CME futures price, and the global perpetual-futures price diverge, traditional financial institutions can construct more complex cross-market arbitrage strategies by trading futures on the CME and the ETF on the U.S. stock market while hedging with crypto-native funds in the perpetual-futures market. This established, for the first time at the institutional level, a direct, high-frequency channel of price discovery and efficiency transmission between traditional finance and crypto finance.
The actual smoothness of this transmission channel, however, is constrained by compliance limits across regulatory jurisdictions. Institutional investors regulated by the SEC or the CFTC in the United States are, in most cases, prohibited or strictly limited from trading perpetual futures on unregulated offshore crypto exchanges. This means that the two ends of the "CME futures ↔ global perpetual futures" arbitrage chain fall under different regulatory jurisdictions, presenting a compliance obstacle for U.S. institutional participants. In practice, this role is more often assumed by crypto-native funds registered in jurisdictions with lighter regulation. This regulatory segmentation itself constitutes an institutional friction of triangular arbitrage and is one reason the cross-market efficiency gap persists.
16.6.3 Triangular arbitrage dynamics in the post-ETF era
In January 2024, the U.S. Securities and Exchange Commission approved the first batch of spot Bitcoin ETFs, marking the formal incorporation of crypto assets into the mainstream financial regulatory system. This event not only introduced hundreds of billions of dollars in incremental capital but also fundamentally reshaped the market's microstructure, creating in particular the previously nonexistent market conditions and complex dynamics for triangular arbitrage.
Before the ETFs' approval, triangular arbitrage was conducted mainly within crypto-native exchanges (such as Binance's spot, futures, and perpetual futures) or with a few offshore regulated exchanges (such as the CME), but both scale and participants were limited. The emergence of the ETFs established a high-capacity capital channel between the spot market and the traditional financial system, allowing institutional-grade capital to participate in a compliant, large-scale manner. According to data released by CME Group, after the ETFs' approval, leveraged funds' net short positions in CME Bitcoin futures increased significantly. This does not mean institutions are bearish on Bitcoin; on the contrary, it is evidence of large-scale basis trading and triangular arbitrage: obtaining long exposure by buying the spot ETF while shorting futures on the CME to hedge risk and earn the basis.
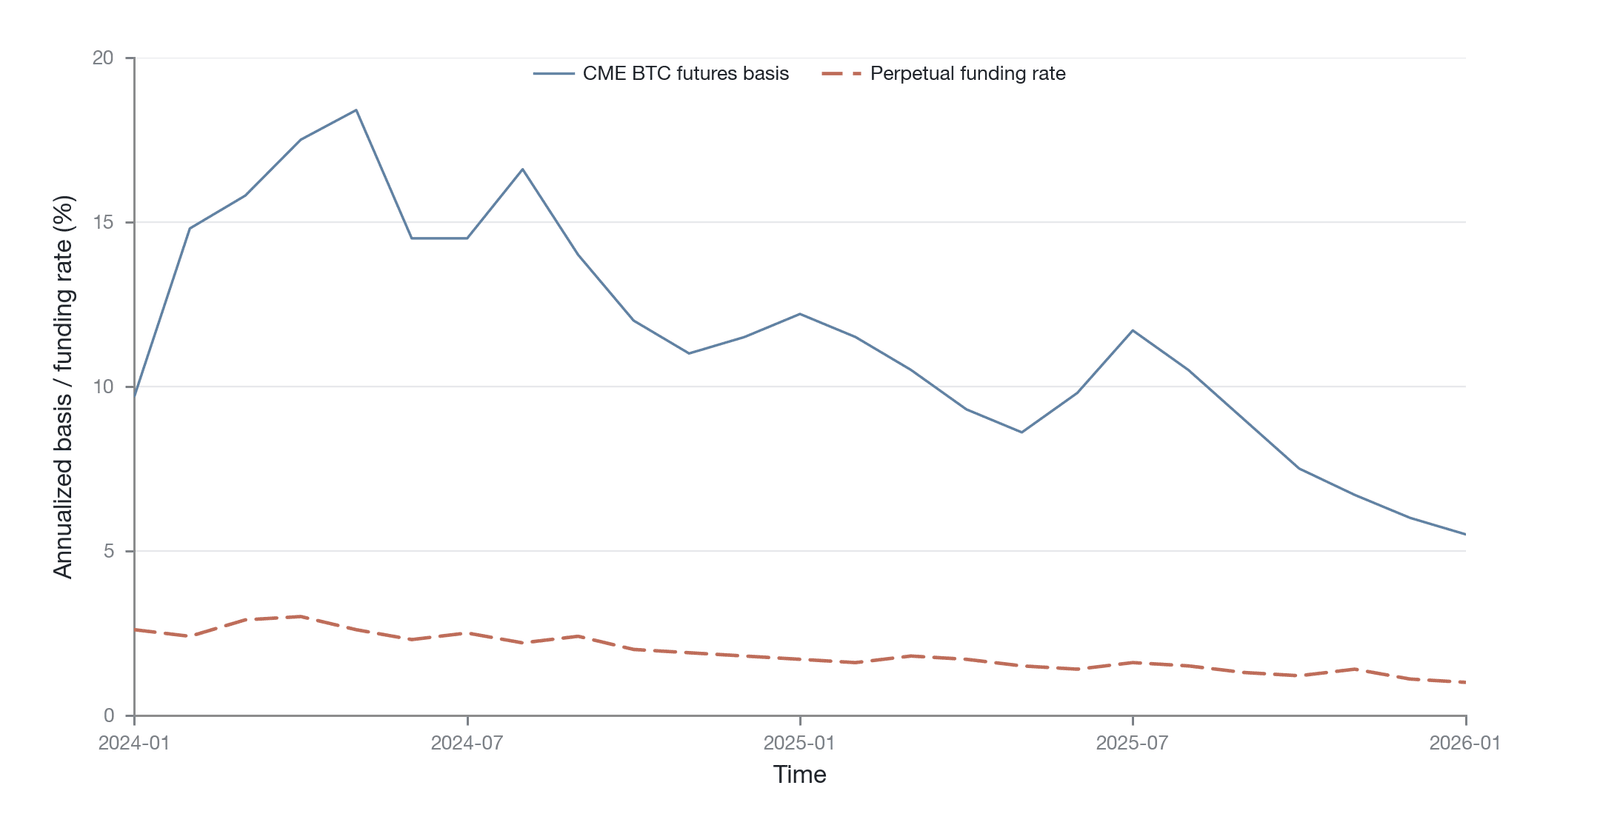
Figure 16-17. The evolution of the CME futures basis and the perpetual-futures rate (illustrative simulation: constructed from public basis/rate parameters of CME Group [11] and Binance [10], drawn by the author)
Figure 16-17 simulates the evolutionary path of the CME futures basis and the mainstream perpetual-futures funding rate from early 2024 to early 2026, from which the following key phenomena can be observed.
In the first half of 2024, strong market expectations of the ETFs and heavy capital inflows pushed the annualized basis of CME futures above 10%, forming a significant triangular-arbitrage space relative to the then relatively calm perpetual-futures funding rate (about 1-3% annualized), and large amounts of arbitrage capital accordingly entered the market to execute the "buy the spot ETF + short CME futures" strategy. As arbitrage activity intensified, market sentiment normalized, and the Federal Reserve's rate policy shifted from hiking to cutting, the CME futures basis was significantly compressed from the second half of 2024 through 2025: by early 2026, the annualized basis had fallen back to 4-5%, while the average perpetual-futures rate remained around 1%, and the potential profit space of triangular arbitrage narrowed from 5-9% in the early bull market to an equilibrium level of 3-4%. Meanwhile, a distinctive linkage formed between the ETFs' trading hours (U.S. stock-market hours) and perpetual futures' around-the-clock trading: during U.S. stock-market hours, large ETF creations and redemptions dominate price discovery and are rapidly transmitted through triangular arbitrage to the CME futures and global perpetual-futures markets; while the U.S. stock market is closed, price movements in the perpetual-futures market become a leading indicator of the next day's ETF opening price. Triangular arbitrageurs continuously perform the function of transmitting price information between these two asynchronous markets. The compression of the CME basis, however, is not driven entirely by arbitrage activity. Under the cost-of-carry model, the risk-free-rate component of the futures basis is directly affected by the Federal Reserve's policy rate. Between 2024 and 2026, the Federal Reserve's policy shift (from a hiking cycle into a cutting cycle) itself compressed the interest-rate component of the basis. The observed basis compression is therefore the joint result of arbitrage activity and the macro interest rate environment, and attributing it entirely to improved arbitrage efficiency may overstate the independent contribution of arbitrage activity.
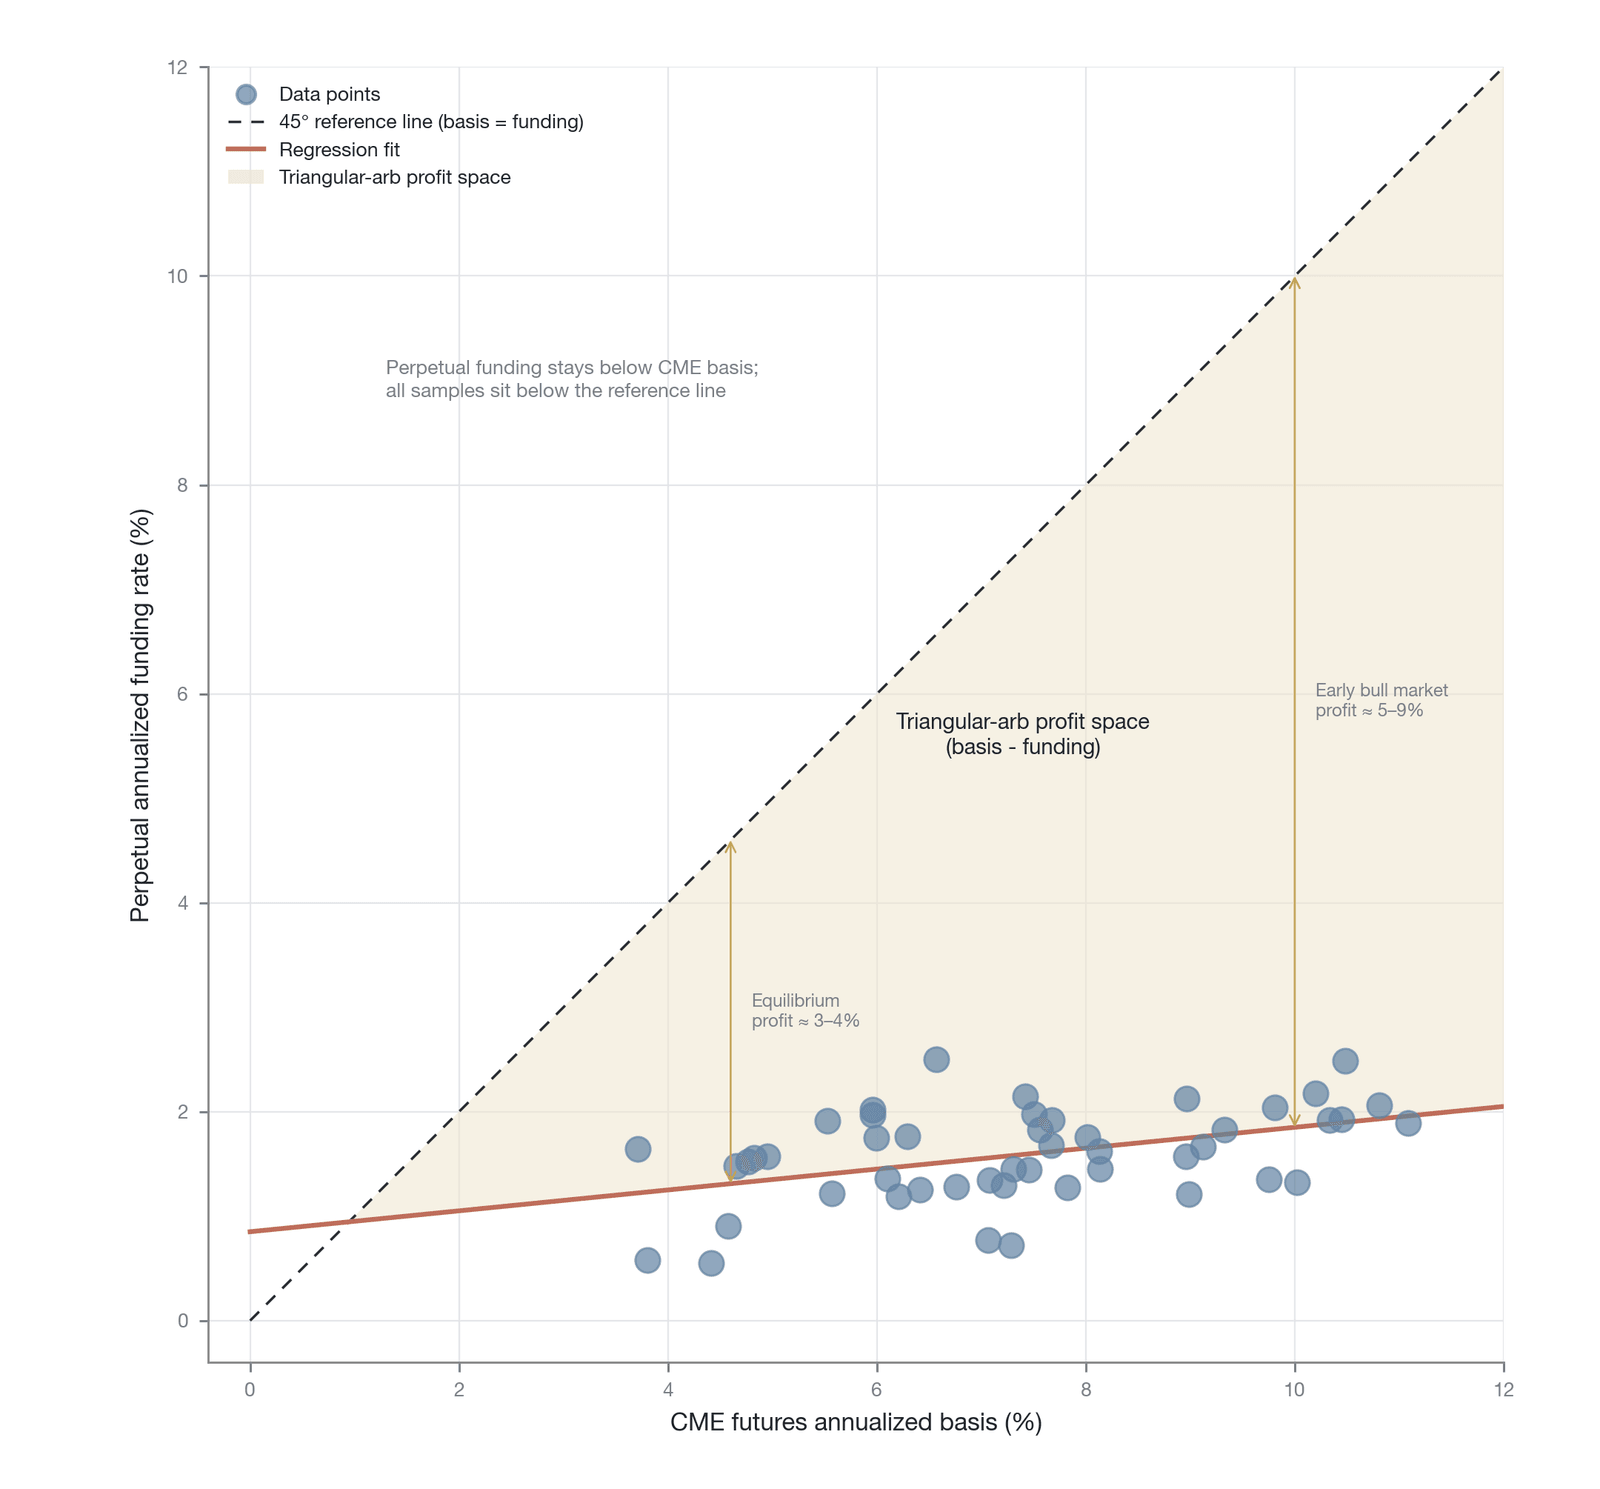
Figure 16-18. A comparison of the CME futures basis and the perpetual-futures rate (illustrative simulation: constructed from public basis/rate parameters of CME Group [11] and Binance [10], drawn by the author)
Figure 16-18 illustrates the efficiency improvement brought by arbitrage: the once-significant cross-market spread has been greatly compressed by arbitrageurs' profit-seeking behavior (again, this figure is an illustrative simulation rather than original data, and, as noted above, the basis compression is also driven by the macro interest rate environment). This confirms that arbitrageurs are not merely profit capturers but builders of market infrastructure that advance global pricing unification and liquidity integration.
16.6.4 Term-structure integration
The core efficiency function of triangular arbitrage is to serve as a systematic calibration mechanism that continuously integrates and unifies the term-structure information of crypto assets. The term structure—the pricing relationship among assets or contracts of different maturities—is a key gauge of a financial market's maturity. In an efficient market, short-, medium-, and long-term financing costs should form a smooth and logically self-consistent yield curve. Triangular arbitrage constitutes the micro force that shapes this curve.
First, by connecting perpetual futures (which can be viewed as a rolling, ultra-short-term contract) and delivery futures of various maturities (such as monthly and quarterly), triangular arbitrage anchors together the market's expectations of the short-term funding cost (the funding rate) and the forward funding cost (the futures basis). Without triangular arbitrage, the perpetual-futures market might see its funding rate deviate substantially from fundamentals for a long time because of short-term speculative sentiment, while the futures market might produce a distorted basis because of shifts in institutional risk appetite. The presence of triangular arbitrageurs forces these two price signals to calibrate each other, forming a more consistent implied yield curve from "now" (perpetual futures) to the "future" (futures).
Second, in the post-ETF era, triangular arbitrage performs the information-transmission function of connecting the two market systems of traditional finance and crypto finance. The CME futures market is dominated by institutional investors bound by U.S. regulation, and its pricing reflects the risk appetite, capital cost, and macroeconomic expectations of the traditional financial system. The offshore perpetual-futures market, represented by Binance and Bybit, is driven more by crypto-native funds and retail users worldwide, and its pricing more sensitively reflects sentiment, narratives, and capital flows within the crypto community. The participants, information sources, and pricing logic of these two markets differ significantly.
By operating simultaneously across the CME, spot ETF, and perpetual-futures markets, triangular arbitrageurs become the key medium for transmitting information. When a change in the Federal Reserve's macro policy affects the risk appetite of CME investors, this effect is transmitted through triangular arbitrage to the funding rate of perpetual futures. Conversely, when a new DeFi protocol or technological breakthrough sparks enthusiasm in the crypto community and drives up perpetual-futures prices, arbitrageurs also transmit this signal in reverse to the CME futures and spot ETF markets. This bidirectional information flow significantly improves the price-discovery efficiency of the entire crypto asset market, so that any local price shock can be absorbed and digested by the whole market more quickly.
In sum, triangular arbitrage is not merely a complex arbitrage strategy but a core driver of the crypto financial market's maturation and integration. By connecting the three key markets of spot, futures, and perpetual futures, it integrates the pricing logic of different participants, different institutional frameworks, and different information sources into a unified system, ultimately forming a more unified, more efficient global crypto-asset pricing system with smoother information transmission. This integration function, which crosses institutional and geographic boundaries, is a concentrated embodiment of this chapter's arbitrage infrastructure hypothesis.
16.7 Funding rate arbitrage
In the complex mechanism design of perpetual futures, the funding rate is not only the core tool for maintaining price anchoring but has itself evolved into a distinctive, tradable financial parameter. When the same asset displays persistent and significant funding rate differences across different trading platforms and market tiers, a crypto-native, highly institution-driven form of arbitrage arises. Unlike arbitrage strategies that capture short-lived price deviations, the core of funding rate arbitrage is to capture and exploit the "institutional premium" caused by differences in exchange microstructure, participant composition, and leverage demand. This arbitrage activity not only provides traders with a relatively independent source of return but, at the macro level, plays the key role of smoothing the global rate structure and unifying market expectations of financing costs. This section dissects the micro-mechanics of the funding rate as a tradable asset, proposes the analytical framework of the "funding rate surface," and, through representative case studies of centralized and decentralized exchanges, reveals how funding rate arbitrage drives the efficiency calibration of the perpetual-futures ecosystem.
16.7.1 The tradability of the funding rate
When the same underlying asset shows different funding rates across different exchanges, the rate difference itself constitutes a tradable arbitrage instrument. Funding rate arbitrage captures persistent differences in institutional parameters by constructing a delta-neutral portfolio—shorting on the high-rate exchange and going long on the low-rate exchange. Unlike price arbitrage, this strategy typically has a longer holding period, which can last from hours to days.
Compared with traditional cross-exchange spread arbitrage, funding rate arbitrage is deeper along the strategy dimension. The former trades the deviation of "price," a zeroth-order variable, pursuing rapid convergence on the millisecond scale; the latter trades the "funding rate," a first-order institutional parameter derived from price, capturing the persistence of a state. Moreover, differences in the settlement frequency of the funding rate across exchanges (for example, every 8 hours, every 4 hours, or every 1 hour) add a "term-structure" dimension to the strategy, giving rise to a more complex "settlement-window arbitrage" strategy—that is, exploiting the mismatch of different settlement times to optimize returns and risk exposure. This trading logic, which turns the institutional parameter itself into an asset, is an important marker of the perpetual-derivatives market's maturation and growing complexity.
Funding rate arbitrage simultaneously faces multidimensional risk constraints. Because the arbitrage position involves cross-exchange holdings, execution risk, liquidity risk, and operational risk all constitute substantive constraints. In particular, when the arbitrageur must build positions simultaneously in two markets, rapidly changing market conditions can produce "leg risk" (the mechanism is described in Section 16.4.1). In addition, cross-exchange fund-transfer delays, exchange technical failures, or policy changes can all affect the execution of the arbitrage strategy. The successful execution of funding rate arbitrage therefore often depends on the arbitrageur's technological infrastructure, risk-management capability, and thorough understanding of market microstructure.
16.7.2 The funding rate surface framework
To understand and uncover cross-market and cross-asset funding rate arbitrage opportunities systematically, we can draw on the concept of an interest rate surface or a volatility surface to construct an analytical framework of a "funding rate surface." This is a multidimensional information matrix that can intuitively display the "financing-cost topography" of the global perpetual-futures market.
We can formally define the funding rate surface as a three-dimensional mapping function , where is the set of exchanges, is the set of assets, and is the time domain. denotes the annualized funding rate that exchange quotes for asset at time . There is an important difference from a traditional volatility surface, however: a volatility surface constructs a smooth surface by interpolation over the two continuous dimensions of strike and maturity, whereas both the exchange dimension and the asset dimension of the funding rate surface are discrete, with no natural basis for interpolation. Calling it a "funding rate matrix" might therefore be more precise mathematically, but the term "surface" helps emphasize the holistic perspective of analyzing arbitrage opportunities across multiple dimensions, so this chapter retains it.
Within this framework, we can define at least two core dimensions. The exchange dimension arranges the world's major perpetual-futures exchanges horizontally—such as Binance, OKX, and Bybit, as well as emerging decentralized platforms such as Hyperliquid and dYdX. The asset dimension arranges different crypto assets vertically, from the mainstream BTC and ETH, to popular public-chain tokens such as SOL and AVAX, to various long-tail assets. The value at each coordinate point on the surface represents the real-time or forecast funding rate of a specific asset on a specific exchange (typically expressed as an annualized percentage).
The "shape" of this surface contains extremely rich market-microstructure information. Along the exchange dimension, the "slope"—the rate differences across exchanges for the same asset—reflects differences in their user composition, leverage preferences, market depth, and risk-management mechanisms. For example, a retail-dominated platform may exhibit a higher funding rate than an institution-dominated platform during a bull market. Along the asset dimension, the "slope"—the rate differences across assets within the same exchange—reveals the degree of the market's short-term chase after specific narratives and hot spots. High rates typically cluster on the "star assets" with large recent gains and high market attention. The local "peaks" and "valleys" of the surface—its extreme points—are the direct embodiment of arbitrage opportunities. The difference between a pronounced "peak" (an exchange with a rate far above the market average for some asset) and a "valley" (a rate significantly negative or far below average) constitutes the potential profit space of an arbitrage trade.
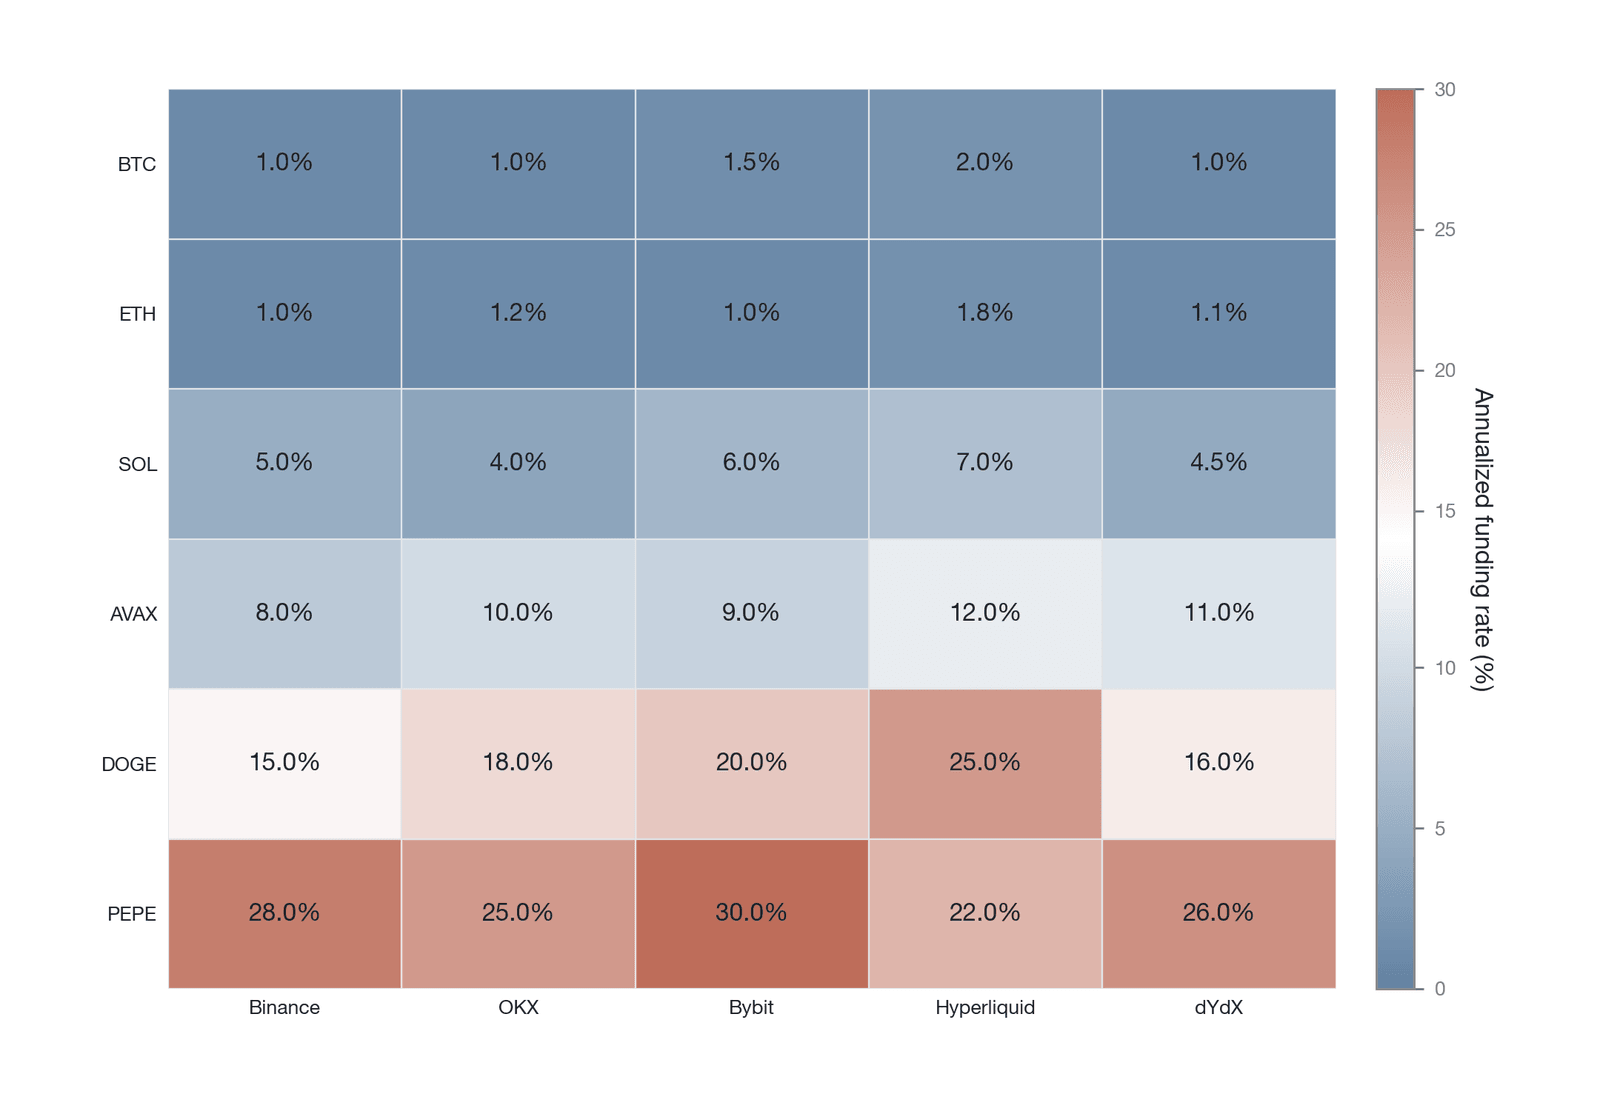
Figure 16-19. A schematic of the funding rate surface (Data source: constructed by the author)
Figure 16-19 presents the funding rate surface at a given moment as a three-dimensional heatmap (the horizontal axis is the major exchanges, the vertical axis is different crypto assets, and the color depth represents the annualized rate): the surface exhibits a pronounced "peak-and-valley" structure, with some exchanges' rates for certain assets far above the market average (a "peak") or significantly below the average or even negative (a "valley"), and the difference between peak and valley is the potential profit space that arbitrageurs can capture.
The core work of arbitrageurs is to monitor this dynamically changing funding rate surface in real time and capture significant "peak-valley differences," smoothing the rate differences by constructing cross-platform, cross-asset hedged positions. Their collective action, in effect, smooths the entire surface, prompting the rate structure of the global perpetual-futures market toward greater balance and efficiency. This process can be understood as a market self-correction mechanism: when an exchange's rate is too high, arbitrageurs' shorting increases the short-side supply in that market and thereby depresses the rate; and vice versa. Through this spontaneous behavior of market participants, the funding rate surface gradually moves from a highly heterogeneous state toward equilibrium, ultimately achieving a balance of global financing costs.
16.7.3 The Hyperliquid case
To understand concretely how funding rate arbitrage operates in practice, and how different market microstructures give rise to arbitrage opportunities, we take Binance, the world's largest centralized exchange, and Hyperliquid, the fastest-growing decentralized perpetual-futures platform, for a comparative analysis. Their significant differences in user base, technical architecture, and mechanism design make them a representative comparative case for analyzing the logic of CEX-DEX rate arbitrage (the mechanism differences between the two are shown in Table 16-3).
The core differences between the two in the funding rate mechanism constitute the institutional basis of the arbitrage opportunity. In the settlement cycle, Binance is typically 8 hours and Hyperliquid is 1 hour. In rate calculation, Binance uses a premium index plus a fixed interest rate, whereas Hyperliquid includes only the premium index. In the execution environment, Binance uses a centralized matching engine, whereas Hyperliquid is based on a self-developed layer-1 blockchain that implements a fully on-chain order book. In addition, the difference in cross-platform fund-transfer delay constitutes an important operational constraint.
These mechanism differences directly cause the two platforms' funding rates to behave differently. The most salient is the mismatch of settlement cycles. Binance's 8-hour settlement cycle means its funding rate is a "blunted" reflection of market sentiment over the past 8 hours, whereas Hyperliquid's 1-hour high-frequency settlement makes its rate more sensitive to short-term market fluctuations. This temporal mismatch creates a "settlement-window arbitrage" opportunity for arbitrageurs. For example, in a rapidly rising market, an arbitrageur can anticipate that Binance will show a high positive rate at its next settlement point while Hyperliquid's rate may already have responded to a short-term price correction. The arbitrageur can short on Binance and go long on Hyperliquid in advance, capturing the pulse-like payoff at Binance's rate settlement.
| Dimension | Binance | Hyperliquid |
|---|---|---|
| Settlement cycle | 8 hours | 1 hour |
| Rate calculation | Premium index + fixed interest rate (set to 0 for some pairs) | Premium index + damping coefficient |
| Execution environment | Centralized matching engine | Layer-1 on-chain order book |
| Fund transfers | Instant, internal | Cross-chain bridging |
| Maximum leverage | 125x | 50x (after March 2025, reduced to 40x for BTC and 25x for ETH) |
Table 16-3. A comparison of the settlement mechanisms of Binance and Hyperliquid (data source: official documentation of Binance and Hyperliquid, data as of early 2025)
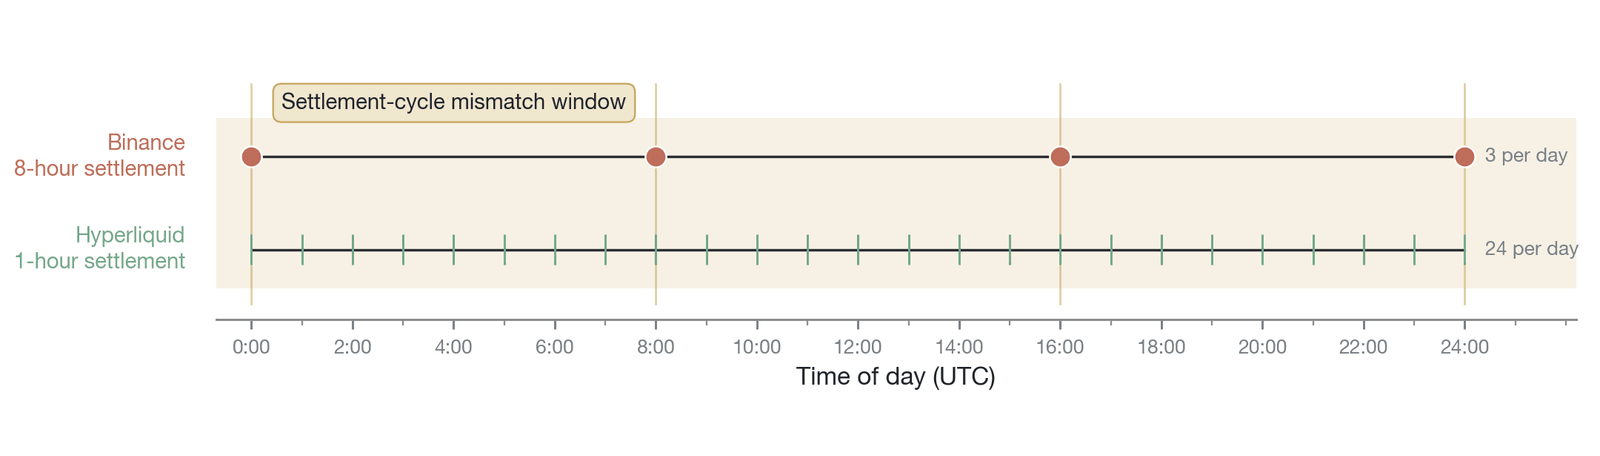
Figure 16-20. An analysis of the settlement-cycle mismatch (Data source: a conceptual schematic constructed by the author from the settlement parameters of Binance and Hyperliquid)
Figure 16-20 uses parallel timelines to compare the funding-rate settlement timing of Binance (8-hour settlement) and Hyperliquid (1-hour settlement): Hyperliquid responds to market changes at a higher frequency and rises first, whereas Binance's rate lags noticeably because of its 8-hour "blunting window," and the region where the two curves are temporally offset marks the potential operating space for "settlement-window arbitrage."
Differences in the rate-calculation method and rate cap also widen the rate gap. Hyperliquid's rate calculation more purely reflects the long-short imbalance within its platform, and its extremely high rate cap allows it to show funding rates far above those of a CEX under extreme conditions, which directly creates a significant arbitrage space. Based on a high-frequency sample spanning 26 exchanges over several consecutive days, Zhivkov (2026) [12] found that the average annualized funding rate of BTC perpetual futures on Hyperliquid is systematically higher than on Binance, with a difference on the order of about 18 percentage points annualized (in that study's high-frequency sample, the annualized rates of the two were about 23% and 4.5%, respectively; note that this figure comes from that particular high-frequency observation window rather than the mean of a full quarter, and its specific numbers could not be fully re-verified through public channels, so it is best understood as an indicative order of magnitude of the structural difference). This structural rate difference provides arbitrageurs with a considerable source of profit and also reflects the fundamental difference in the two platforms' user composition and participant behavior. The causes of this structural rate difference are multidimensional. Besides the long-short imbalance caused by the higher proportion of retail and high-leverage traders in Hyperliquid's user base, there are at least two other important factors. First, the order-book depth of Hyperliquid is far below that of Binance (the resting order volume within a ±2% price range is typically only 10-20% of Binance's), which means a directional trade of the same size has a larger impact on the Hyperliquid perpetual premium. Second, the points and airdrop incentive mechanisms that Hyperliquid implemented during its growth phase may have artificially distorted trading behavior, with some traders deliberately maintaining high-leverage positions to earn airdrop points—an incentive-driven behavior that differs from natural supply and demand. The limitation in liquidity depth also means that arbitrage positions above a moderate size face significant slippage when executed on Hyperliquid, especially during periods of heightened market volatility. Therefore, although a rate difference of about 18 percentage points is extremely attractive on paper, there is a clear capacity ceiling on the size of the arbitrage position that can actually be executed with low friction.
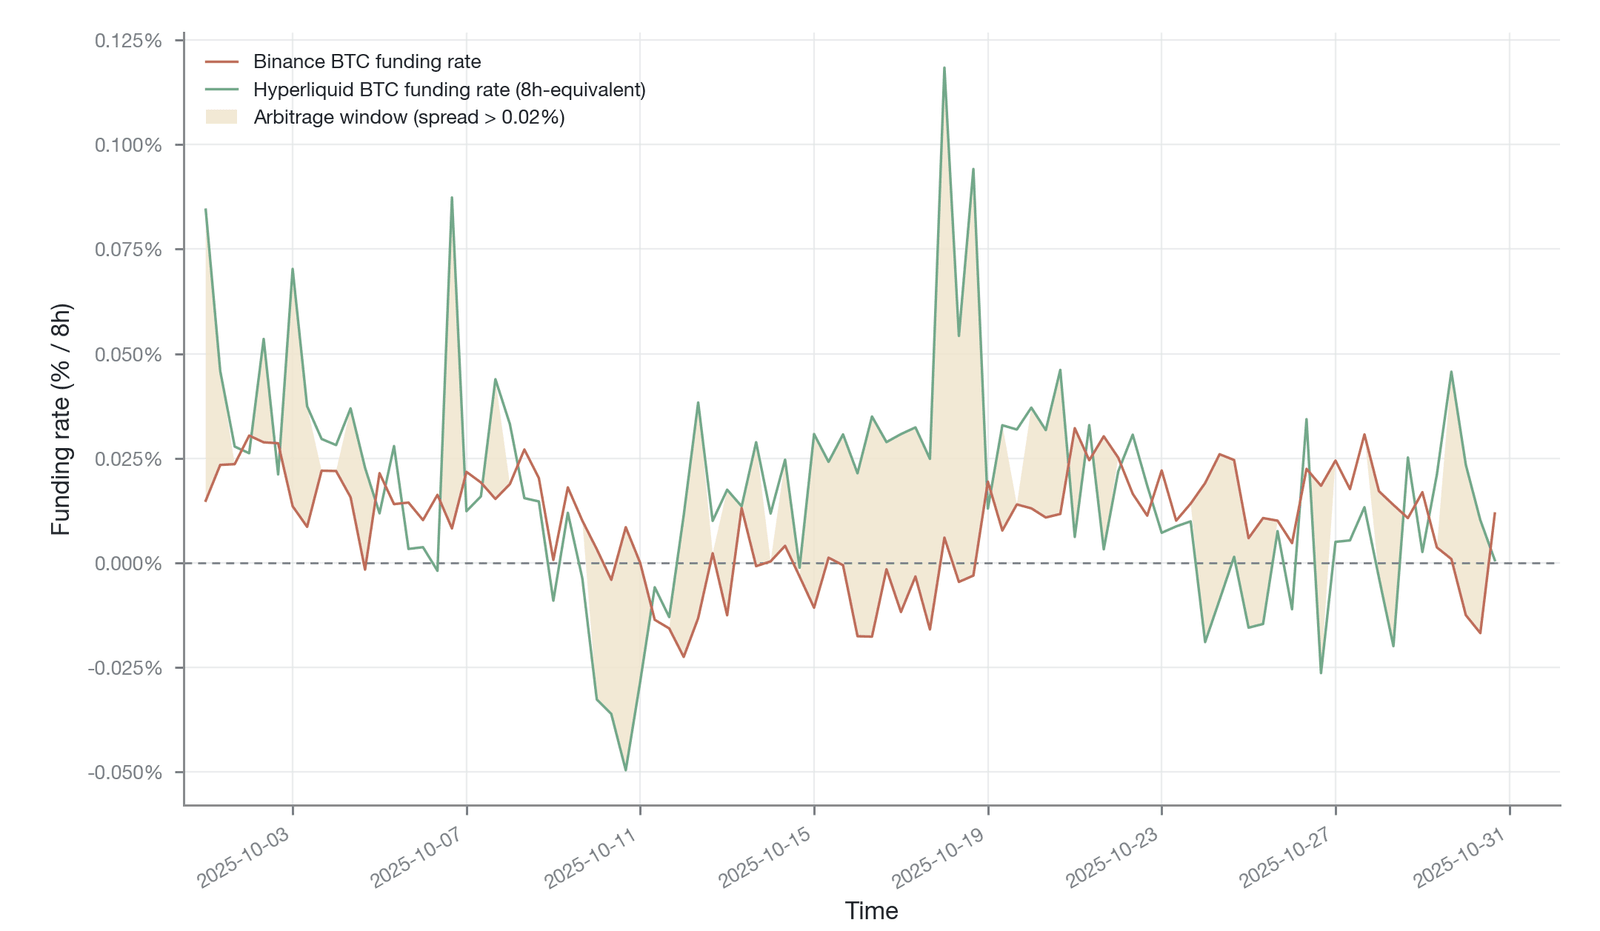
Figure 16-21. A comparison of Binance and Hyperliquid BTC funding rates (indicative order of magnitude: drawn from the CEX-DEX structural rate difference described by Zhivkov 2026 [12]; about 23% versus 4.5%, a difference of about 18 percentage points, as an indicative magnitude, with the horizontal axis an indicative interval rather than the exact high-frequency sample window of that study)
Figure 16-21 compares the funding rate trajectories of Binance and Hyperliquid on BTC perpetual futures on an every-8-hours basis: the two curves move in the same direction, but Hyperliquid's rate level is higher than Binance's in most periods and its amplitude is larger, and when the difference between the two exceeds a threshold, an arbitrage window forms (the shaded area in the figure). Converted to an annualized basis, this systematic structural difference is on the order of about 18 percentage points (the about 23% versus about 4.5% mentioned above; see [12]), providing a source of profit for cross-platform rate arbitrage.
Executing CEX-DEX funding rate arbitrage, however, also faces distinctive challenges. The greatest friction comes from capital efficiency and operational risk: fund transfers between two CEXs are nearly instantaneous, whereas moving funds between a CEX and a DEX must go through a cross-chain bridge, and its delay, smart-contract security, and bridging-fee risks (see Section 16.9.1) directly erode the arbitrage profit space. This execution friction is the core reason a significant rate difference can persist for a long time between CEXs and DEXs, and it also constitutes a test of arbitrageurs' "infrastructure-service" capability. Only arbitrageurs with efficient cross-chain infrastructure and the ability to execute and manage risk rapidly can earn sustained profits in this market.
16.7.4 Financing-cost calibration
As a spontaneous market-correcting force, the core efficiency function of funding rate arbitrage is to "smooth" the funding rate surface proposed earlier, compressing rate outliers across exchanges and assets and thereby calibrating the implied financing cost of perpetual futures globally. When arbitrageurs short on rate "highlands" (such as Hyperliquid) and go long on rate "lowlands" (such as Binance), their behavior directly increases the short-side supply in the high-rate market and the long-side demand in the low-rate market. These two forces act together to push overly high rates down and overly low rates up, ultimately driving the market's rate level toward an equilibrium value.
Empirical research provides strong evidence for this mechanism. Although execution frictions prevent the rate difference from being eliminated entirely, arbitrage activity significantly limits the magnitude and persistence of the difference's expansion. Zhivkov (2026) [12] found that in the observed sample, as much as 17% of observations exhibited an economically significant (greater than 20 basis points) CEX-DEX funding rate arbitrage opportunity; however, only about 40% of the top opportunities still generated positive returns after transaction costs and spread reversals, and as many as 95% of the opportunities ultimately ended in a forced exit. This shows that funding rate arbitrage is not a "riskless," costless return; its persistent positive return is compensation for the costs and risks that arbitrageurs bear in overcoming multiple frictions to provide the service of market integration.
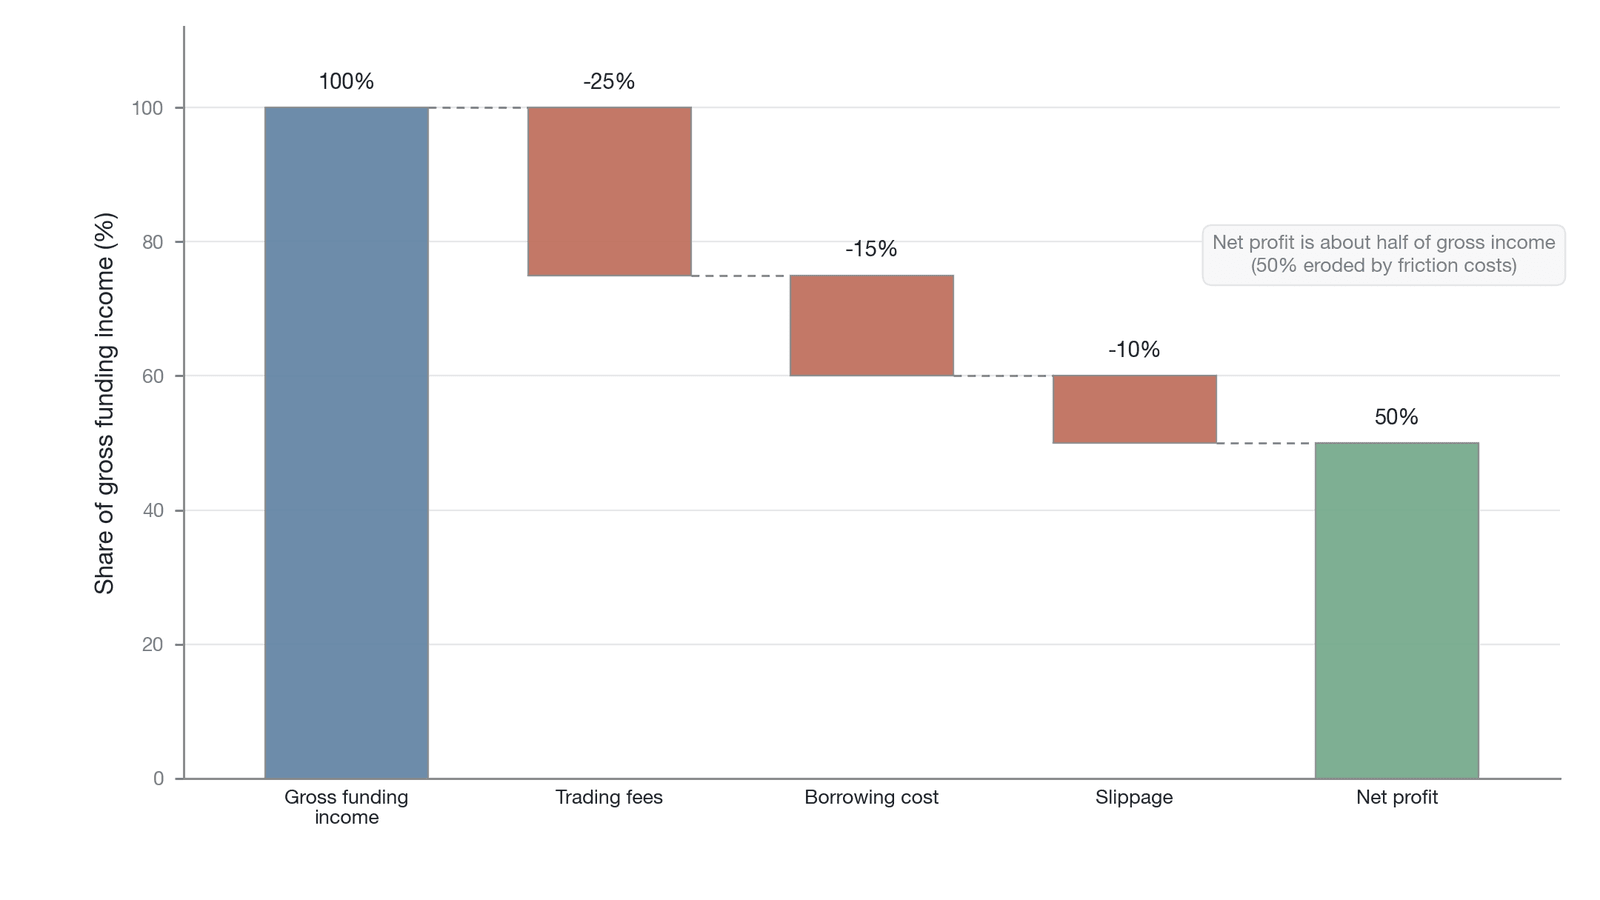
Figure 16-22. A decomposition of funding rate arbitrage returns (the cost-component proportions are illustrative values from the author's model, with parameters referencing the BTC perpetual-futures rate structures of Binance and Hyperliquid; the related arbitrage-opportunity and forced-exit proportions in the text are from Zhivkov 2026 [12])
Figure 16-22 shows the return and cost composition of the funding rate arbitrage strategy: the total rate income yields a net return only after a series of friction costs—trading fees, borrowing costs, and slippage—are deducted, and the net return can quickly turn negative when the rate difference narrows or slippage spikes. This shows that funding rate arbitrageurs provide the public good of "efficiency calibration" in a high-uncertainty environment and earn a risk premium for doing so.
There is also an important synergy between funding rate arbitrage and spot-perpetual basis arbitrage. Rate arbitrage brings the funding rates of exchanges worldwide into closer alignment, which provides basis arbitrageurs with a more stable and predictable cost environment. When the financing costs (funding rates) of all platforms are close, basis arbitrageurs can focus more on the price deviation between perpetual futures and spot, without worrying too much about the extra risk from rate fluctuations across different platforms, which improves the efficiency and robustness of basis arbitrage—the core anchoring mechanism. Funding rate arbitrage thus constitutes a secondary calibration system that, by finely tuning the financing costs across markets, provides a solid foundation for the effective operation of the primary price-anchoring mechanism.
At a more macro level, the existence and effective operation of funding rate arbitrage reflect a trend of institutionalization and efficiency improvement in the crypto-derivatives market. When enough capable arbitrageurs are present in the market, the market's microstructure becomes more efficient, the price-discovery function becomes more complete, and participants' financing costs become fairer and more transparent. This is a core embodiment of this chapter's arbitrage infrastructure hypothesis: through their self-interested trading behavior, arbitrageurs in effect improve the efficiency of the entire market, so that the crypto-derivatives market gradually evolves into a more mature and more efficient financial ecosystem.
16.8 Cross-asset statistical arbitrage
Cross-asset statistical arbitrage maintains the internal consistency of the pricing system along the asset dimension. This strategy focuses on the dynamic balance of the relative relationships among different assets; by constructing market-neutral positions between highly correlated assets, it ensures that the pricing of related assets does not deviate from the intrinsic linkage jointly determined by fundamentals, technology adoption, and market narratives.
Unlike strategies that rely on deterministic no-arbitrage relationships, statistical arbitrage is essentially a probability-based game. It does not pursue riskless-ness on any single trade but captures temporary pricing deviations through a large number of trades, in the belief that these deviations will ultimately revert to their statistical mean. In the violently volatile and narrative-driven crypto market, the effectiveness of this strategy depends not only on complex mathematical models but, more fundamentally, on the distinctive institutional advantages that perpetual futures provide as a financial instrument. The institutional characteristics of perpetual futures have allowed the classic pairs-trading strategy to evolve into a new and more powerful form in the crypto world.
16.8.1 Pairs trading in perpetual futures
The core logic of pairs trading is to identify pairs of assets with a stable cointegration relationship and, when the spread deviates from the mean, to take opposing positions, betting on the mean reversion of the spread. This strategy is market-neutral and in theory bears no systematic beta risk.
In the crypto asset market, pairs trading has broad applicability. The most typical pair is Bitcoin and Ethereum. This combination comprises not only the two largest crypto assets by market capitalization but also represents the relative valuation of two different functional positionings—store of value and smart-contract platform. The fluctuation of their spread largely reflects shifting market preferences between the two narratives of store of value and decentralized-application platform. Besides BTC-ETH, the spread dynamics of layer-1 (L1) public-chain competitor pairs (such as ETH and Solana) reflect the market's relative valuation of different public-chain ecosystems in terms of technical performance, developer activity, and user growth. The spread relationships of same-ecosystem token pairs (for example, different application tokens within the same layer-2 ecosystem, or protocol tokens with similar functions in DeFi, such as AAVE and COMP) are directly affected by internal ecosystem developments and the popularity of specific niches.
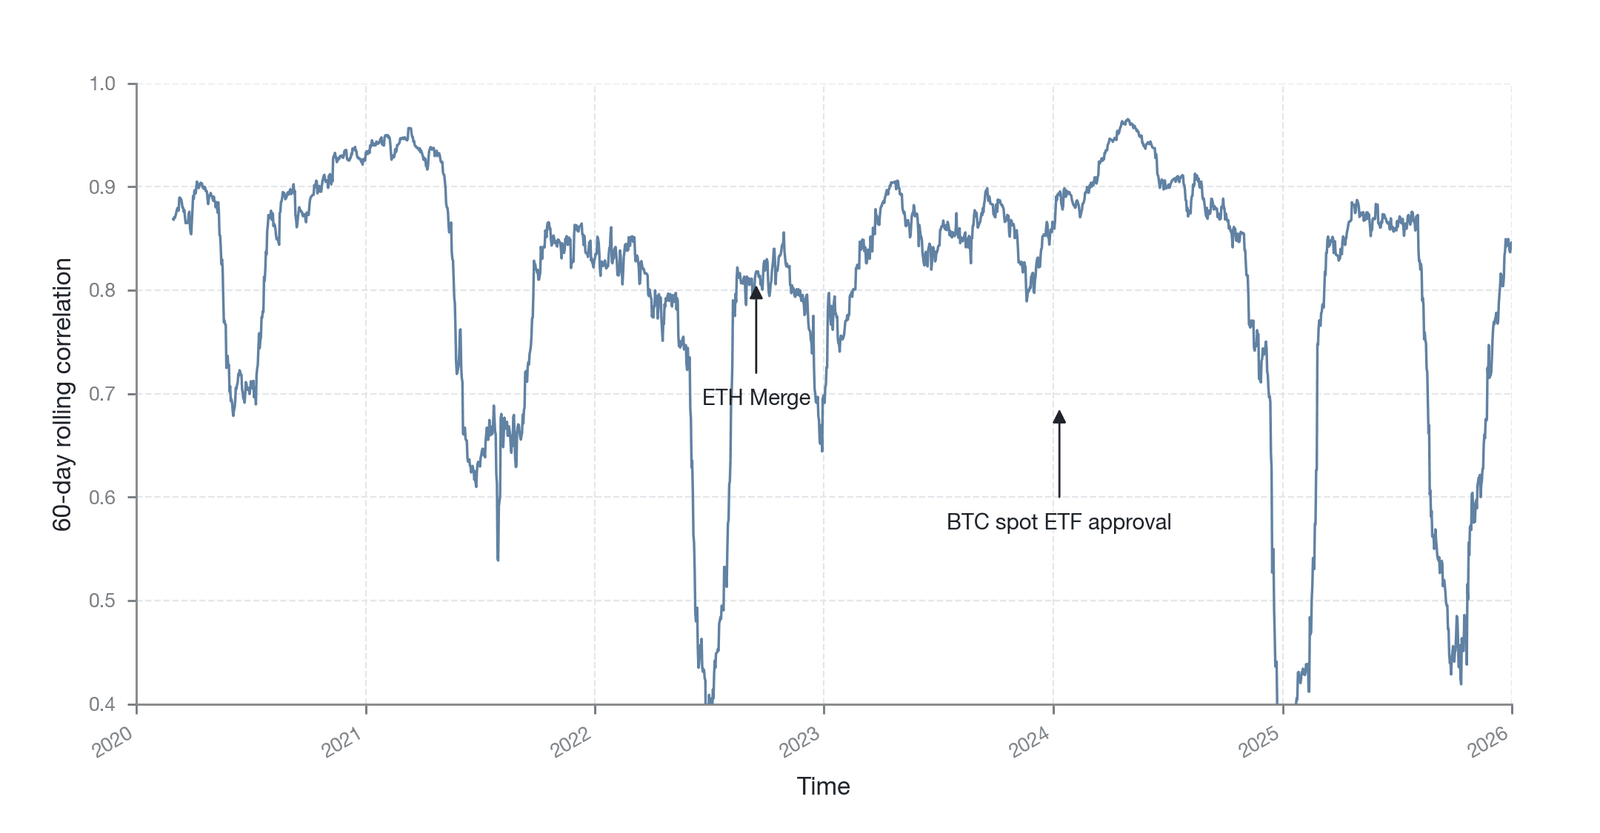
Figure 16-23. The evolution of the BTC-ETH rolling correlation (Data source: Binance exchange API data [10])
Figure 16-23 tracks the evolution of the 60-day rolling correlation coefficient between BTC and ETH: it remains in the high range of 0.7 to 0.9 in most periods (sharing significant systematic-factor exposure), but drops sharply—even briefly below 0.5—at key junctures such as major Ethereum upgrades, DeFi booms, or macro risk events. These moments of "correlation breakdown" are both the greatest source of risk for pairs trading and key signals for re-evaluating the hedge ratio and the cointegration relationship.
Gatev et al. (2006) [13], in a systematic study of pairs-trading strategies in the U.S. stock market, showed that the strategy still earns significant excess returns net of transaction costs, confirming the economic substance of the mean-reversion phenomenon. In the crypto market, the noise-trader risk described by DeLong et al. (1990) [14] (the risk that irrational traders' behavior may cause the spread to widen further before it converges) poses an additional challenge to pairs trading. The key to successfully constructing a pairs-trading strategy is to distinguish genuine statistical association from spurious, accidental correlation. Research shows that relying on high correlation alone is dangerous, because it may merely reflect two assets moving in the same direction under a common external factor (such as the macroeconomic environment) during a particular period—a relationship that can break at any time. A more robust statistical basis is cointegration. A cointegration relationship indicates that even if the price series of the two assets are individually non-stationary, some linear combination of them (the spread) is stationary, fluctuating around a long-run equilibrium value. This relationship implies a genuine, long-run economic link between the two, providing a more reliable guarantee of mean reversion. Sophisticated statistical arbitrageurs therefore use cointegration tests (such as the Engle-Granger test or the Johansen test [15]) to screen trading pairs and combine them with indicators such as the Z-score to gauge the degree of the spread's deviation, thereby deciding the timing of entry and exit.
Methodologically, pairs trading in the crypto market has evolved from the classic static-regression framework to more refined dynamic-modeling methods. Early practitioners typically used the Engle-Granger two-step method to estimate the cointegration relationship, but this method implicitly assumes constant parameters and struggles to capture the rapid evolution of the correlation structure among crypto assets. The current frontier practice is to introduce state-space models: through the Kalman filter, the hedge ratio and the spread mean are estimated in real time, allowing the model to adapt to dynamic changes in market microstructure. For possible structural breaks (for example, when a public chain undergoes a qualitative change in its valuation relationship with a competing chain because of a major technical upgrade), the Markov regime-switching model [16] allows the mean and volatility of the spread to switch between different market states, giving traders a more robust risk-control framework. In addition, the vector error correction model, when multiple pairs of cointegrated assets exist, can simultaneously model the dynamic adjustment of multiple spreads, capturing the linkage effects within a network of assets. Interpretable machine-learning methods have also recently entered the feature analysis of crypto-market microstructure—for example, Bieganowski and Ślepaczuk (2026) [17] used gradient-boosting models and SHAP attribution to systematically characterize the microstructural features of the perpetual-futures limit order book and their predictive power for short-term returns, providing new methodological tools for signal construction and feature selection in statistical arbitrage. The choice among these methods is not a purely technical matter but directly determines a strategy's survivability in the crypto market's environment of high volatility and rapid narrative shifts.
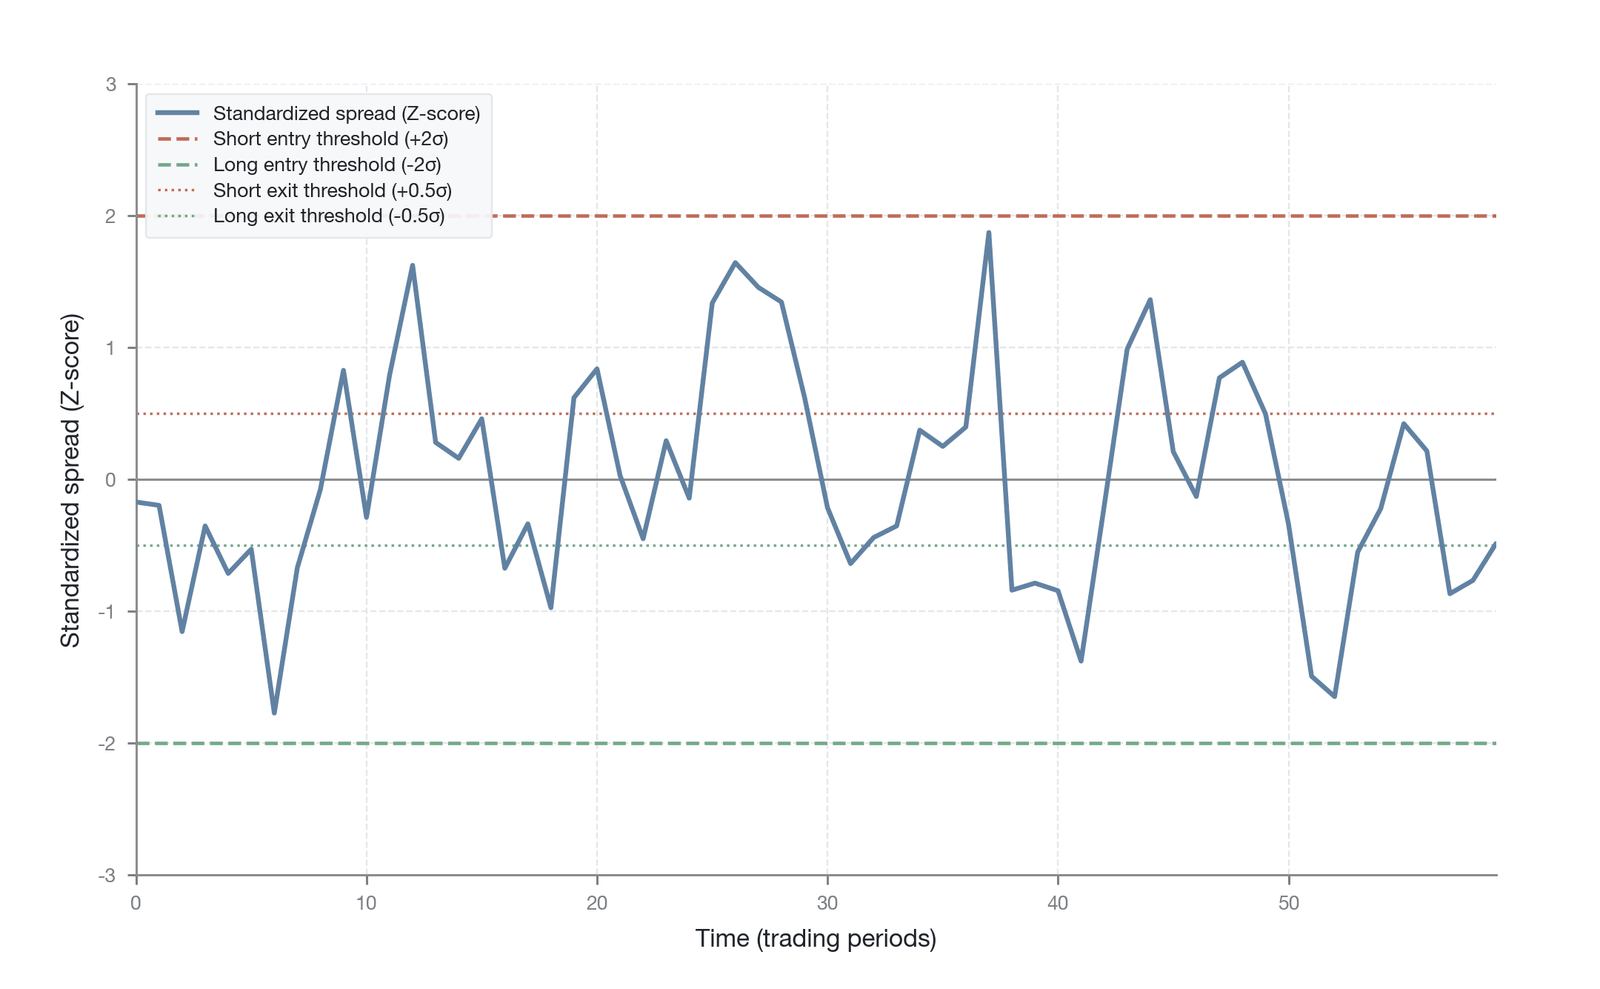
Figure 16-24. A schematic of spread reversion in pairs trading (Data source: constructed by the author)
Figure 16-24 schematically depicts the fluctuation and reversion of the spread of a cointegrated asset pair around its long-run mean: when the spread deviates from the mean by more than a set threshold (typically expressed as a multiple of the standard deviation via the Z-score), a trading signal is triggered—when the spread is too high, short the spread (short the relatively strong asset and long the relatively weak one), and when the spread is too low, long the spread. The figure uses threshold lines to mark the entry (±2σ) and exit (±0.5σ) triggers.
16.8.2 Differences between perpetual and spot statistical arbitrage
Although the concept of pairs trading can be applied to any market, implementing it in the perpetual-futures market offers a series of significant institutional advantages over the traditional spot market. These differences fundamentally change the strategy's risk-return profile and execution efficiency, making perpetual futures a near-ideal venue for statistical arbitrage, and pairs trading in particular.
First is the convenience of shorting. Shorting crypto assets in the spot market faces frictions such as high borrowing costs and limited quotas, whereas shorting perpetual futures is nearly frictionless, significantly lowering the execution threshold and cost of pairs trading.
Second, the funding rate mechanism adds a distinctive dimension of return or cost to pairs trading. For a pairs trader, the difference between the funding rates on the two legs directly constitutes an extra cash flow for the strategy. In the ideal case, if the funding rate on the long leg is negative and that on the short leg is positive, the trader can earn the funding rate on both legs at once, and this income can sometimes even exceed the profit from spread convergence. Conversely, an unfavorable rate difference becomes a continuous cost. The dynamic changes of the funding rate must therefore be treated as a core variable in model construction.
Third, the availability of high leverage is another important feature of the perpetual-futures market, and its effect cuts both ways. Pairs trading captures relatively small spread fluctuations, and high leverage can significantly amplify the returns from these tiny movements. Leverage, however, likewise amplifies risk. If the spread does not converge as expected but instead keeps diverging—the so-called "breakdown of the pair relationship"—high leverage will subject the position to enormous losses or even forced liquidation. The use of leverage must therefore be combined with a strict risk-management system. Particular caution is warranted regarding the asymmetric impact of the forced-liquidation mechanism, unique to perpetual futures, on statistical-arbitrage strategies. Even if the long-run cointegration relationship between two assets still holds, an extreme short-term divergence of the spread may trigger the forced liquidation of one or both legs, forcing the strategy to exit at the most unfavorable moment. More seriously, once one leg is liquidated, the originally market-neutral position instantly becomes a one-sided naked exposure, and this forced liquidation may further drive the spread's divergence, forming a positive-feedback liquidation cascade.
Finally, the crypto market's around-the-clock trading allows pairs-trading strategies to run at all hours and capture opportunities whenever they arise, unlike traditional markets constrained by opening and closing times. This also places higher demands on the automation of the trading system and the real-time nature of risk monitoring. The differences between the two types of statistical arbitrage are shown in Table 16-4.
| Dimension | Spot statistical arbitrage | Perpetual-futures statistical arbitrage |
|---|---|---|
| Ease of shorting | Restricted / high borrowing cost | Frictionless |
| Additional return dimension | None | Funding rate differential |
| Leverage availability | Limited | High leverage available |
| Trading hours | Limited | 24/7 |
| Settlement risk | T+2 | Real-time |
| Capital efficiency | Low | High |
Table 16-4. Perpetual-futures versus spot statistical arbitrage (Data source: constructed by the author)
16.8.3 Maintaining pricing consistency
The core function of cross-asset statistical arbitrage in the crypto market is to act as a decentralized regulating mechanism that continuously maintains the internal consistency of the entire asset-pricing ecosystem. Through the constant calibration of "relative value," it connects different assets into an interrelated, logically self-consistent value network. This efficiency function manifests at three levels.
First, it is a transmission mechanism for price discovery among assets. When one asset (such as BTC) rises in price because of some external information shock, a highly correlated asset (such as ETH) may not react immediately with an equal-magnitude move, causing the spread between the two to deviate from equilibrium. At this point, statistical arbitrageurs quickly step in, going long ETH perpetual futures and shorting BTC perpetual futures. This trading behavior amounts to "transmitting" the new information in the BTC market to the ETH market, increasing buying pressure on ETH and selling pressure on BTC, thereby accelerating ETH's "lagged rise" and BTC's "price correction" and ultimately pushing the spread between the two back toward equilibrium. In this process, arbitrageurs not only profit themselves but also, in effect, improve the information-transmission efficiency of the entire market.
Second, it integrates and reinforces cross-asset liquidity. Active pairs-trading activity simultaneously increases the trading volume and order-book depth of the perpetual futures of both underlying assets. A trader seeking to build a large position in ETH might find that placing the order directly would cause considerable market impact. But if active BTC-ETH pairs trading exists, the trader can indirectly affect ETH's price and liquidity by trading BTC. This liquidity "spillover effect" means that a single asset's liquidity is no longer isolated but can be supplemented and enhanced through the trading of related assets, thereby improving the depth and resilience of the entire market.
Third, it provides a dynamic reference frame for the valuation system of crypto assets as a whole. By observing the spread levels and fluctuation ranges of different asset pairs, market participants can intuitively grasp the relative strength of various assets and market sentiment. For example, when the spreads of L1 public-chain pairs (such as ETH-SOL) narrow broadly, it may mean the market is re-evaluating the value of different public chains and the competitive landscape is intensifying. And when the pair spreads across the entire market widen broadly, it may signal rising risk-aversion sentiment, with investors inclined to hold leading assets (such as BTC) and sell other, less correlated assets. The spread data generated by statistical-arbitrage activity thus becomes a valuable indicator of market sentiment and risk appetite in its own right.
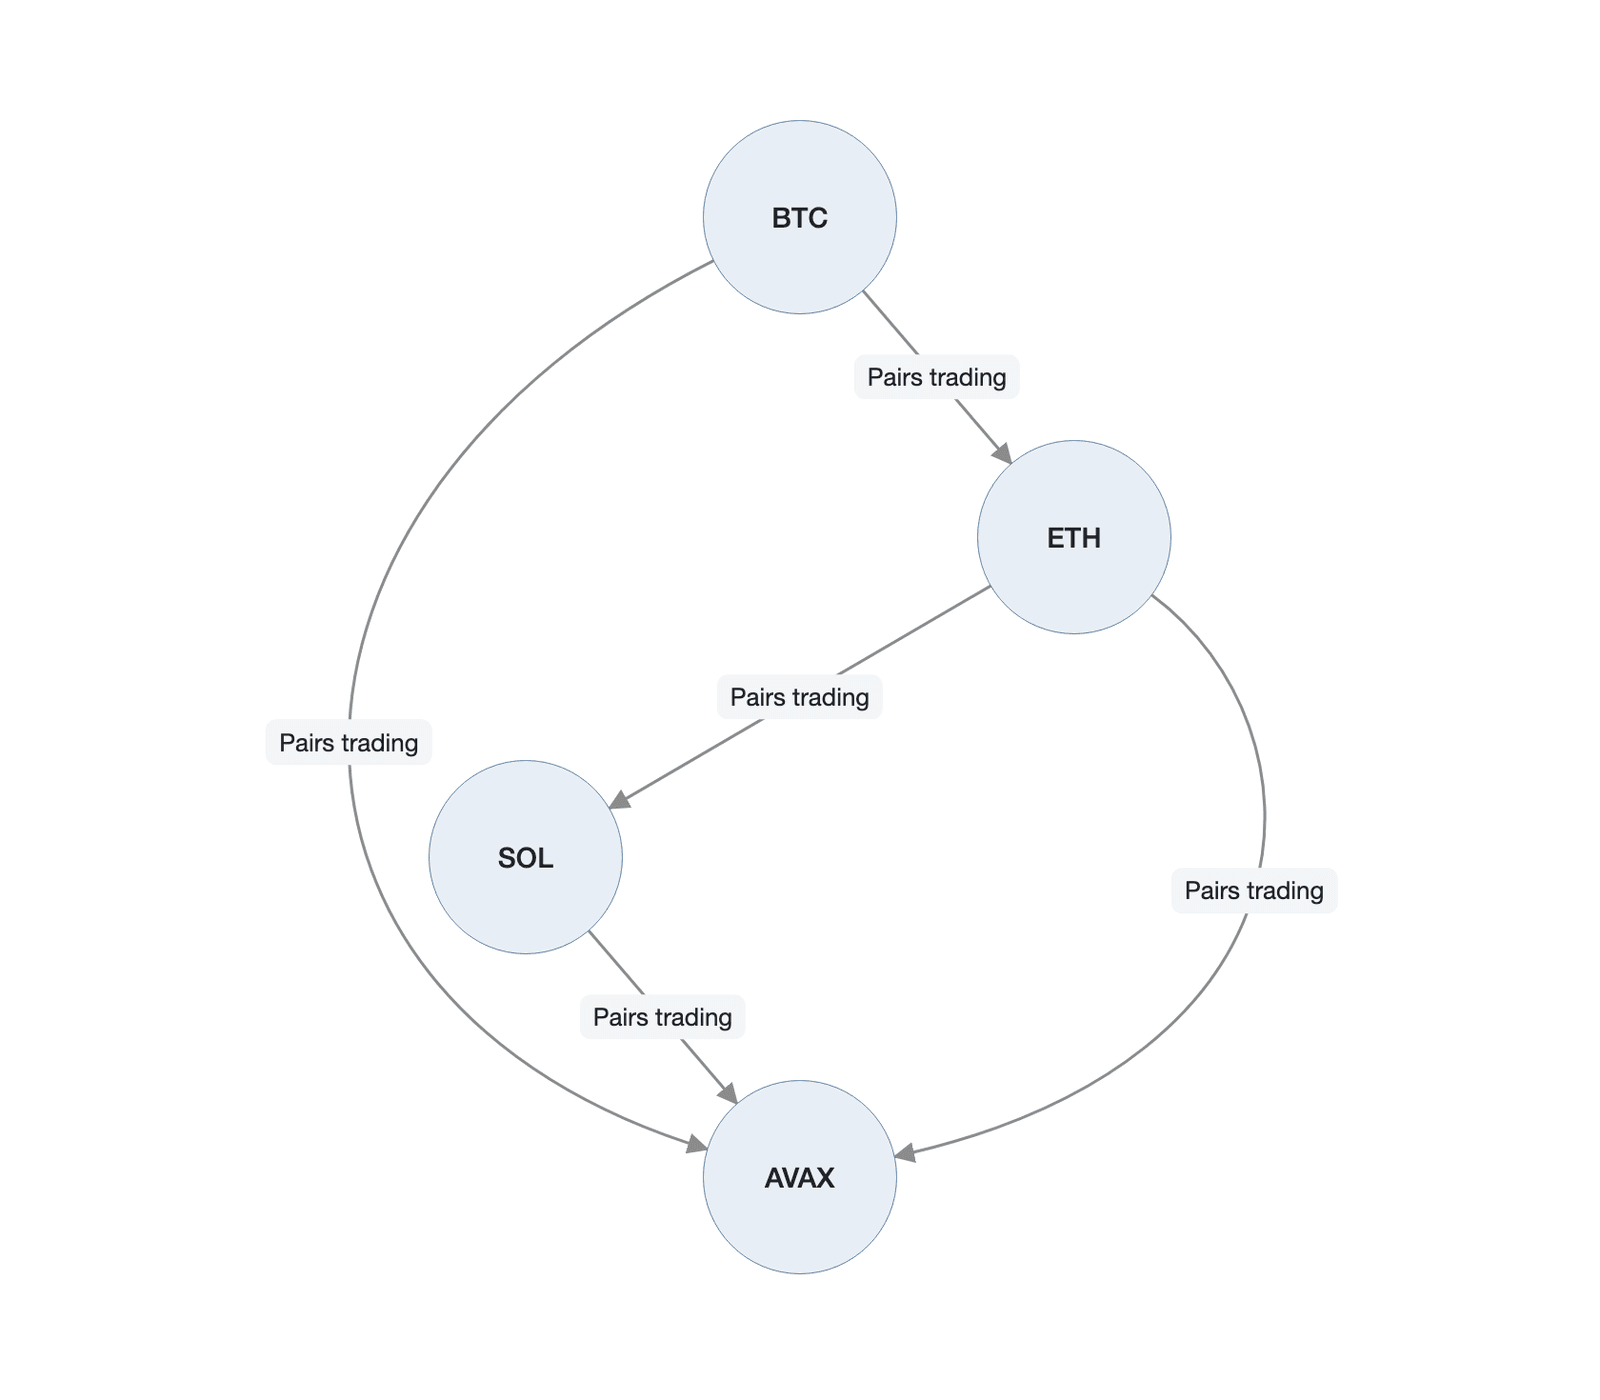
Figure 16-25. Relative-pricing maintenance in the asset-pricing ecosystem (Data source: a conceptual schematic constructed by the author)
Figure 16-25 uses a network topology to show the mechanism by which statistical arbitrageurs maintain relative pricing: each node represents a crypto asset, and the links between nodes represent the relative-pricing relationships that arbitrageurs maintain, in which mainstream assets such as BTC and ETH form the core pairs with the deepest liquidity and the most active arbitrage, while arbitrage coverage of long-tail assets is relatively limited—revealing how arbitrageurs weave isolated asset pricings into a mutually calibrated value network.
In sum, cross-asset statistical arbitrage is an inevitable result of the crypto market's maturation. It plays an indispensable role along the "asset dimension" of the efficiency spectrum, weaving isolated asset pricings into a dynamically balanced, logically self-consistent ecosystem through countless captures and corrections of tiny spreads. This strategy is not without risk, however, and its greatest intrinsic risk lies in the fragility of correlation itself. When the market undergoes a structural shift, historically formed statistical relationships may be broken entirely. In the crypto market, the triggers of such breakdowns have a distinctive narrative-driven character: an "ETH killer" narrative can completely change the ETH-SOL spread dynamics within weeks, and a single social-media wave can instantly dissolve a long-stable pair relationship. This narrative-driven structural break is fundamentally different from the gradual relationship evolution caused by fundamental changes in traditional markets: it is faster, larger in magnitude, and less predictable, posing a fundamental challenge to statistical models based on historical data and causing the strategy to suffer major losses. This will be developed further in the discussion of arbitrage risk in Chapter 17.
16.9 CEX-DEX cross-tier arbitrage
In the arbitrage ecosystem of perpetual futures, cross-tier arbitrage between centralized and decentralized exchanges is the most active arbitrage domain, where the structural contradictions of the crypto market intertwine with frontier innovation. As two starkly different paradigms of financial infrastructure, CEXs and DEXs create, through their inherent architectural differences, a persistent and dynamically evolving efficiency gap. Arbitrageurs continuously monitor and exploit the spread opportunities that arise from differences in information latency, transaction costs, and consensus mechanisms. The core argument of this section is that CEX-DEX cross-tier arbitrage is not only the last of the six core arbitrage mechanisms but also an important analytical vantage point, revealing the deep tension between centralized and decentralized financial infrastructure, the trade-off between efficiency and fairness, and an ongoing arbitrage-driven contest of technology and mechanism.
16.9.1 The sources of the efficiency gap
The efficiency gap between the CEX and DEX perpetual-futures markets is not accidental but stems from fundamental differences in their technical architecture, information transmission, and trade-execution mechanisms. This difference is structural, and it defines the conditions under which arbitrage opportunities arise and the forms they take. As the efficiency analysis of Chapter 15 and Zhivkov (2026) [12] reveal, the price-discovery integration of the CEX ecosystem (measured by the Hasbrouck information share) is 61% higher than that of the DEX ecosystem, and over the study's sample period all statistically significant information flows were transmitted one-way from CEXs to DEXs, with no significant reverse causality detected. As DEX trading volume grows rapidly—Hyperliquid's daily volume repeatedly exceeded $10 billion in the second half of 2025—this one-way dominance may be evolving, and the price-discovery contribution of DEXs deserves continued attention, especially in DEX-first-listed assets and long-tail tokens. This significant efficiency gap constitutes the macro backdrop against which cross-tier arbitrage can exist. We can decompose the sources of this efficiency gap into the following core layers.
First, the most central source is oracle latency. Different DEX perpetual-futures protocols vary significantly in their degree of dependence on oracles, and they can be divided into three categories. The first is fully oracle-dependent, exemplified by early virtual automated market maker (vAMM) protocols, whose internal pricing is determined almost entirely by external oracle price feeds and whose arbitrage window is the largest. The second is oracle-assisted, exemplified by Hyperliquid, whose price discovery is driven by the real-time order flow of an on-chain central limit order book (CLOB), with the oracle used mainly for mark-price calculation and liquidation triggers, so that its arbitrage window depends on the degree of synchronization between on-chain order flow and the CEX price. The third is hybrid, such as dYdX v4, which combines on-chain order-book data with an external oracle to construct the mark price. Although the architectures of these protocols differ significantly, they are all affected, to varying degrees, by oracle-update delay or the lag of on-chain price discovery. Updating external-world (mainly CEX) price information onto the chain takes time, however. This process involves data aggregation, network transmission, on-chain transaction packing, and consensus confirmation, and its delay ranges from a few hundred milliseconds to several seconds—or even minutes during network congestion. When the CEX price moves briefly because of major news or a large order, the DEX oracle price inevitably lags, forming a brief but deterministic window of price deviation, which constitutes the arbitrageur's main operating space.
Second, the inherent frictions of on-chain transactions are another key factor in the DEX's efficiency shortfall relative to the CEX. Executing a trade on a DEX requires the full process of broadcasting the transaction, entering the mempool, being packed into a block by validators, and finally waiting for block confirmation. This process is not only time-consuming (depending on the block time and finality of the underlying blockchain) but also requires paying a gas fee. By contrast, CEX trade execution occurs in the memory of its centralized servers, the matching engine can complete order matching in microseconds, and transaction costs are typically lower and more predictable. Therefore, even if an arbitrageur discovers an opportunity on a DEX, its execution faces the dual constraints of time delay and cost uncertainty.
Third, when arbitrage involves DEXs on different blockchains, cross-chain bridging delay and risk become a new obstacle. Moving funds between a CEX and DEXs deployed on different chains (such as Arbitrum, Solana, or Base) must go through a cross-chain bridge. This process can take minutes or even longer, and the bridge itself carries major security risks (according to Chainalysis, cross-chain bridge attacks caused losses of more than $2.5 billion between 2021 and 2023, including major incidents such as the Ronin bridge at $625 million, Wormhole at $320 million, and Nomad at $190 million). For CEX-DEX arbitrageurs, using a cross-chain bridge to move funds entails not only delay risk but also substantive smart-contract security risk, and this cost must be incorporated into the expected-return calculation of the arbitrage. This friction in capital flow prevents arbitrageurs from moving funds as quickly as they can between CEXs, thereby limiting the scale and efficiency of arbitrage activity.
Finally, the transparency of DEXs brings a distinctive paradox. Unlike the "opaque" order book of a CEX, the state of a DEX's liquidity pools, and even the pending transactions in the mempool, are fully public. This transparency, on the one hand, provides arbitrageurs with clear arbitrage targets, but on the other hand exposes their trading intentions to more technically advantaged competitors—MEV searchers. An arbitrage trade targeting oracle latency, once it enters the mempool, may be front-run by an MEV bot through a "sandwich attack," so that the original arbitrageur's profit is eroded or the transaction fails outright. This complex on-chain game further increases the execution difficulty and risk of CEX-DEX arbitrage, forming a highly adversarial on-chain environment.
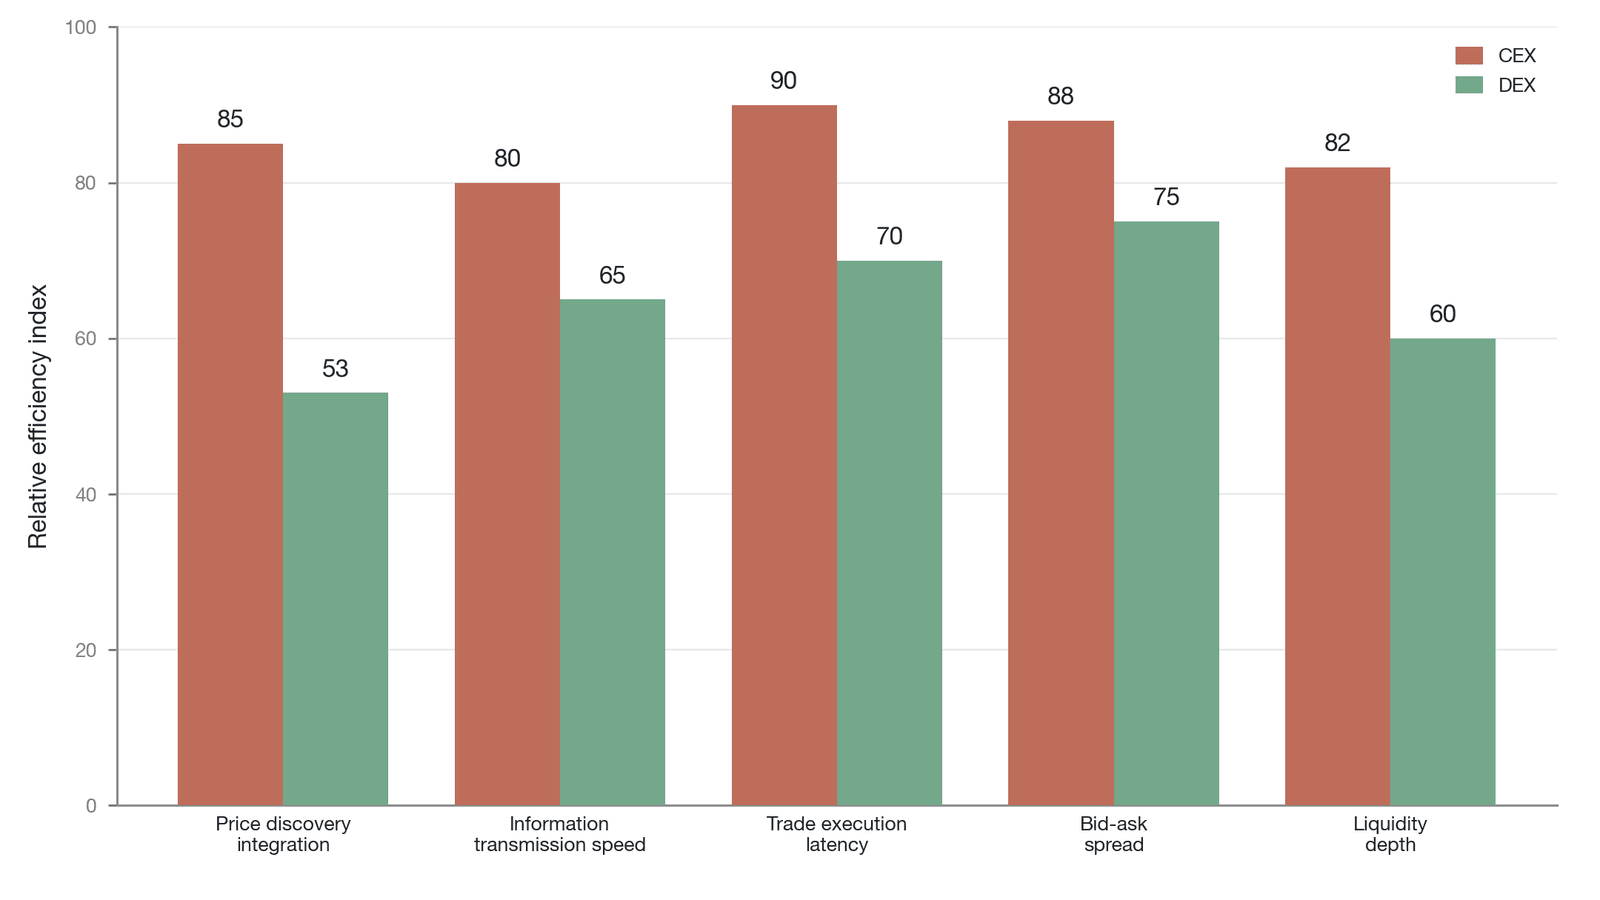
Figure 16-26. A comparison of CEX and DEX efficiency (for the "price-discovery integration" dimension, the CEX is about 61% higher than the DEX, based on Zhivkov 2026 [12]; the other dimensions are representative scores constructed by the author from Chapter 15 and Section 16.9)
Figure 16-26 intuitively shows the efficiency differences between CEXs and DEXs across several dimensions: whether in the integration of price discovery or the one-way dominance of information flow, CEXs display a clear advantage. These structural frictions allow the CEX-DEX efficiency gap to persist, constituting an emerging arbitrage domain that combines challenge and opportunity.
16.9.2 Oracle latency and OEV
The core of CEX-DEX cross-tier arbitrage lies in exploiting the structural efficiency gap described above to buy low and sell high between the two market tiers. Its most classic and common mode is oracle-latency arbitrage. Consider the following scenario: because of a piece of good news, the price of Bitcoin rises rapidly on Binance from $50,000 to $50,500. At that moment, however, the oracle price of a DEX perpetual-futures protocol deployed on Arbitrum remains at $50,000. After monitoring this deviation, the arbitrageur (typically an automated bot) immediately executes the following operations.
The arbitrageur opens a Bitcoin perpetual-futures long position on the DEX at the "stale" oracle price of $50,000 and, almost simultaneously, opens an equivalent Bitcoin perpetual-futures short position on Binance at the real-time price of $50,500.
Having completed these two steps, the arbitrageur has constructed a market-neutral position. When the DEX oracle price finally updates to $50,500, the arbitrageur can close the long on the DEX while closing the short on the CEX, locking in a spread profit of about $500 (less transaction costs). The source of profit in this process is essentially the short-lived pricing error produced by the DEX's failure to reflect fair market value in time. This arbitrage profit, arising from the oracle-update mechanism, is defined in the DeFi space as oracle extractable value (OEV) [18].
As Daian et al. (2020) [19] revealed in their pioneering study, transaction ordering on decentralized exchanges itself contains extractable value. Weintraub et al. (2022) [20] further provided a systematic measurement of MEV in private transaction ordering, confirming the prevalence and scale of this value-extraction phenomenon. The legal characterization of MEV activity remains contested. In traditional finance, front-running clearly constitutes illegal conduct; on-chain MEV, because of the public nature of the blockchain mempool, is more ambiguous at the legal boundary. However, the criminal charges the U.S. Department of Justice brought in 2023 against Avraham Eisenberg for market manipulation (the Mango Markets incident) indicate that enforcement agencies are attempting to extend the legal framework for traditional market manipulation into the DeFi domain (Eisenberg was convicted by a jury in April 2024, but that criminal conviction was vacated by the court in May 2025, while the civil actions brought by the SEC and the CFTC remain ongoing; this back-and-forth itself shows that the legal boundaries of on-chain market manipulation are still contested and in formation). From the standpoint of efficiency analysis, it is necessary to distinguish "benign MEV" (such as pure oracle arbitrage, whose effect is to accelerate the convergence of the DEX price with the global market) from "malicious MEV" (such as a sandwich attack, whose effect is to extract value from end users); the two have opposite effects on market efficiency. This chapter uses "the net direction of the effect on market efficiency" as the criterion for this dichotomy—that is, whether the behavior drives prices toward global fair value without harming informed users; note that this is a simplified classification, and in reality there exists an intermediate zone that is hard to categorize cleanly. Oracle extractable value (OEV) is an important subset of MEV, referring specifically to value captured by exploiting the timing gap or content difference in oracle-data updates. In the example above, the $500 spread is a typical instance of OEV. By trading ahead of the oracle update, the arbitrageur successfully "extracts" value that should belong to the protocol or the liquidity providers.
This arbitrage can be divided into two types. Atomic arbitrage occurs on the same chain (for example, between a DEX's spot pool and another DEX's perpetual futures), where the arbitrageur can use a flash loan to complete all the "borrow-trade-repay" steps within a single atomic transaction; because the transaction either succeeds as a whole or fails and rolls back as a whole, almost no own capital is put at risk. CEX-DEX arbitrage, by contrast, belongs to non-atomic / cross-chain arbitrage: because it involves two independent systems (one off-chain, one on-chain), the transaction cannot be completed in a single atomic operation, and the arbitrageur must execute on one end first and then hedge on the other, with a time gap in between. If the market price moves adversely before the hedge is completed, or if the on-chain transaction fails because of network congestion, the arbitrageur faces risk exposure. The study by Zhivkov (2026) [12] also confirms that even when a significant spread exists, a large number of arbitrage opportunities still result in losses because of spread-reversal risk.
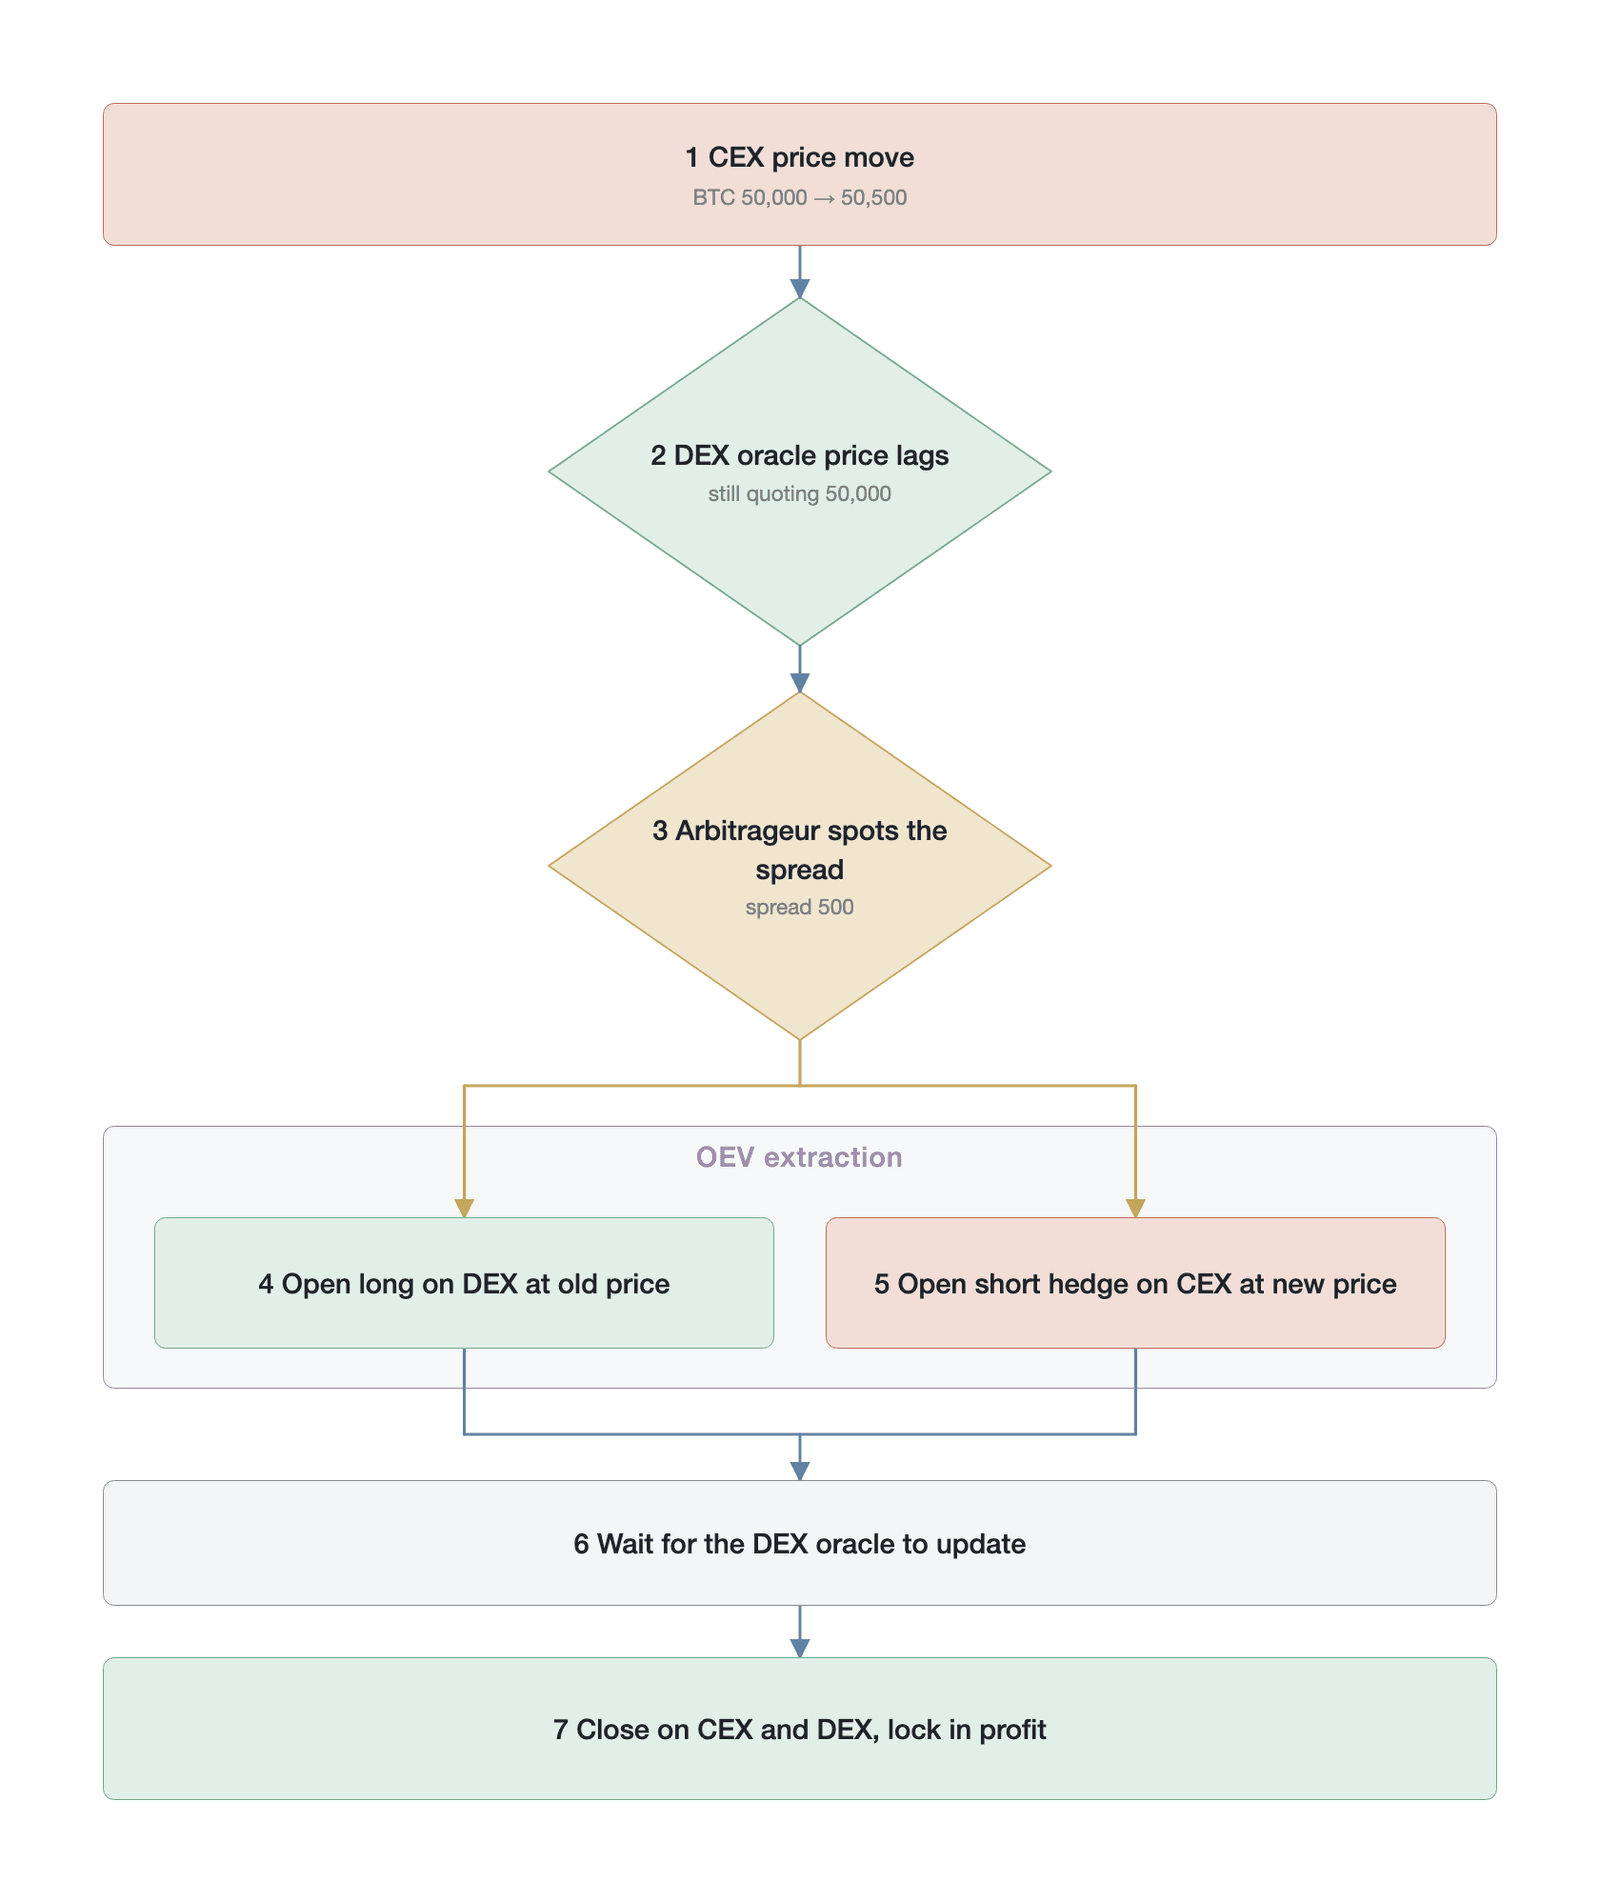
Figure 16-27. The CEX-DEX arbitrage workflow and OEV extraction (Data source: a mechanism schematic constructed by the author)
Figure 16-27 clearly depicts the complete flow of oracle-latency arbitrage and the arbitrageur's trade-off among return, cost, and risk: from discovering the spread to locking in the profit, each step involves a precise calculation of latency, cost, and execution certainty, at whose core is the extraction of OEV—which in turn introduces the institutional-design trade-off between efficiency and fairness.
16.9.3 The efficiency function and the LP-loss problem
At the macro level, the profit-seeking behavior of CEX-DEX arbitrageurs performs an important calibrating function for market efficiency. When the DEX price deviates from the global market because of oracle latency, arbitrageurs' intervention quickly applies opposing trading pressure (for example, buying when the price is too low and selling when it is too high), thereby pushing the DEX price back toward the CEX's fair value. From this angle, arbitrage activity accelerates the DEX's price-discovery process, narrows the information gap between market tiers, and makes the pricing of the entire crypto market more unified and efficient. Arbitrageurs assume the price-transmission function between the CEX and DEX market tiers, and their activity ensures that the law of one price can still function, to some degree, in a friction-laden decentralized environment.
This efficiency improvement, however, comes with a corresponding cost. In DEXs based on the AMM or vAMM model, the counterparty to a trade is the passive liquidity provider (LP), and the arbitrageur's adverse-selection loss is passed directly to the LP. A distinction must be drawn, however: in a pure order-book DEX (such as Hyperliquid's core CLOB mode), liquidity is provided by active market makers, and their loss mechanism is essentially different from the impermanent loss of an AMM—active market makers can respond to adverse selection by canceling orders, adjusting quotes, and managing inventory, and what they face is the classic market-maker adverse-selection cost of traditional finance. The following analysis addresses mainly the AMM/vAMM model, but its core logic (the arbitrageur's gain comes at the expense of the liquidity provider's loss) holds in both models. When arbitrageurs profit from OEV, their profit comes directly from the LP's loss. This constitutes an adverse-selection loss more direct than the "impermanent loss" that LPs face, which can be called "arbitrage loss." Every successful oracle-latency arbitrage means the LP has traded with the arbitrageur at an unfavorable "stale price." If such arbitrage occurs frequently, the LP's annualized return will be severely eroded.
This gives rise to a tension at the level of ethics and mechanism design. On the one hand, arbitrage is a necessary mechanism for the market to move toward efficiency; on the other hand, it harms the interests of the LPs who provide the market's basic liquidity. If LPs choose to withdraw liquidity because of continuous arbitrage losses, the DEX's trading depth will fall and slippage will increase, ultimately perhaps causing the DEX's overall efficiency to decline rather than improve, entering a negative feedback loop of falling liquidity. The efficiency improvement brought by CEX-DEX arbitrage is therefore, to a large extent, internalized as a cost borne by the more fragile participants in the DEX ecosystem—the LPs. This raises a core question: can we protect LPs from excessive adverse-selection loss without suppressing arbitrage, the very mechanism that delivers efficiency? The answer to this question has driven the continuous evolution of DEX protocols' anti-arbitrage design.
16.9.4 The evolution of DEX anti-arbitrage design
To address the OEV and LP-loss problems, DEX perpetual-futures protocols have advanced a series of iterative upgrades at the levels of technology and mechanism design. The core goal of this evolution is to keep narrowing the efficiency gap with CEXs while preserving decentralization, thereby compressing arbitrageurs' profit space or redistributing arbitrage profit to the protocol and LPs. This evolutionary path can be roughly divided into the following stages.
First is the iteration of oracle technology. First-generation DEXs often used oracles with low update frequency and high latency, leaving a large window for arbitrage. A new generation of "low-latency" oracles, represented by Pyth Network, has successfully shortened price latency to the level of a few hundred milliseconds by having data publishers submit price updates directly on-chain while placing the aggregation process off-chain, greatly compressing traditional oracle-arbitrage opportunities [21]. Going further, projects represented by API3 have proposed the concept of OEV Share—that is, auctioning the right to update the oracle so as to capture part of the OEV and return it to the DEX protocol or LPs, achieving a paradigm shift from "fighting arbitrage" to "coexisting with arbitrage and sharing the profit" [22].
Second is anti-MEV design at the protocol level. To cope with various MEV attacks, including OEV, DEX protocols have begun to explore more complex trade-execution mechanisms. For example, an "intent-driven" architecture allows users to express only a trading intent (such as "I want to swap 1 ETH for as much USDC as possible") and leaves the complex task of finding the optimal execution path to a network of professional "solvers." Solvers compete for the right to execute through mechanisms such as batch auctions and can settle multiple trades within a single block, thereby eliminating MEV problems such as front-running. In addition, techniques such as delayed execution and encrypted mempools aim to hide transaction details until they are finally confirmed, so as to protect users and LPs from adverse-selection loss.
Finally, and most fundamentally, evolution is heading toward a radical transformation of DEX perpetual-futures protocols at the level of their underlying architecture. The latest generation of DEXs, represented by dYdX v4 and Hyperliquid, has abandoned the traditional model of building applications on general-purpose smart-contract platforms (such as the Ethereum mainnet or L2 rollups) and instead developed "app-chains" designed specifically for high-performance trading.
As an independent Cosmos app-chain with its own validator network, dYdX v4 can achieve a block time of about 1 second and near-instant transaction finality. Its core design distributes the matching and maintenance of the order book across the memory of its validator nodes, with each validator independently maintaining an in-memory copy of the order book; consensus on trade results is reached through CometBFT consensus, and only the consensus-confirmed fills are written to the blockchain. This "distributed off-chain matching" architecture is essentially different from a CEX's single-server architecture: it retains Byzantine fault tolerance and is superior in security to a centralized scheme, but its performance is still limited by consensus latency—thereby achieving high throughput and low latency [23]. Hyperliquid adopts a more radical "unified-state architecture"; its self-developed HyperBFT consensus mechanism can achieve sub-second transaction-confirmation latency, and it places the trading layer and the smart-contract layer under the same consensus, eliminating cross-layer communication delay so that on-chain state can be accessed instantly, fundamentally shortening oracle latency [24]. The degree of Hyperliquid's decentralization, however, must be assessed with caution. As of the end of 2025, its validator set remained highly concentrated (the number of active validators is far smaller than on Ethereum or the mainstream chains of the Cosmos ecosystem), and its core code was not fully open-source. The JELLY token market-manipulation incident in March 2025 (which caused a peak unrealized loss of about $12 million to $13.5 million in the liquidity vault and forced validators into a controversial manual intervention, voting to force the liquidation of specific positions) exposed the fragility of such app-chains in security governance. Although the validators' manual intervention curbed the loss's expansion in the short term, it also raised fundamental questions about whether a "decentralized exchange" is worthy of the name. These security trade-offs show that in pursuing CEX-grade performance, app-chain DEXs inevitably compromise on the degree of decentralization and the transparency of governance.
These architectural innovations have brought the new generation of DEXs very close to CEXs in performance, significantly compressing the arbitrage space created by technological latency. Although the CEX-DEX efficiency gap can never disappear entirely because of the physical limits of blockchains (such as the speed of light and the global distribution of nodes), its width is being continuously compressed by technological progress and fierce arbitrage competition. A new equilibrium is forming: at this equilibrium point, the CEX-DEX spread will converge to an extremely narrow level that only covers the execution costs and risk premia of the top arbitrageurs (the Tier 1 and Tier 3 participants with the lowest latency, lowest costs, and strongest MEV-game capabilities). For ordinary participants, significant riskless arbitrage opportunities will no longer exist, marking the maturation of the "institutionalization" and "specialization" of this frontier arbitrage domain.
16.10 Arbitrage and market quality
The preceding six sections (16.4-16.9) deconstructed, one by one at the micro-mechanistic level, the operating logic, sources of return, and efficiency contributions of the six core arbitrage strategies. Each strategy performs an irreplaceable corrective function along a specific dimension of the efficiency spectrum. These micro-level analyses, however, have not yet answered a more macro question: how does the collective effect of arbitrage activity systematically reshape the overall quality of the market? This section lifts the analysis from the single strategy to the aggregate level of the arbitrage ecosystem, examining the systematic impact of arbitrageurs' collective behavior on market microstructure along four dimensions: spread compression, liquidity integration, price-discovery leadership, and rate stability.
The six arbitrage mechanisms do not operate in isolation; they form a dynamic network of mutual synergy and constraint. Along the synergy dimension, basis arbitrage (①) and funding rate arbitrage (③) are complementary: basis arbitrageurs collect the funding rate by continuously holding positions, and their behavior itself constitutes a form of rate arbitrage; while rate arbitrageurs' smoothing of cross-platform rates provides basis arbitrageurs with a more stable cost environment. Cross-exchange arbitrage (②) lays the premise for the execution of all the other strategies: only when the prices of the world's major exchanges remain highly consistent are the basis and rate signals based on a single exchange's quotes reliable. Along the substitution dimension, triangular arbitrage (⑤) and basis arbitrage (①) partly overlap in function: when the CME futures basis and the perpetual-futures funding rate converge, the profit space of triangular arbitrage is compressed, and arbitrageurs turn to pure basis strategies; and vice versa. Along the competition dimension, when Tier 0 participants such as Ethena execute basis arbitrage at scale and systematically depress the funding rate, the rate-arbitrage space of Tiers 2 and 4 narrows accordingly, reflecting the profit competition among different strategies. CEX-DEX cross-tier arbitrage (⑥) is relatively independent in strategy logic, and its profit space is mainly constrained by the evolution of technological infrastructure. Along the risk-transmission dimension, however, it is tightly interconnected with the other strategies: the FTX collapse showed that a risk event on the CEX side can be rapidly transmitted to DEXs through mechanisms such as fund freezes, oracle-price anomalies, and panicked spread widening, so that independence of strategy logic does not imply isolation of risk. Understanding these inter-strategy interaction dynamics is key to grasping the overall equilibrium state of the arbitrage ecosystem.
Arbitrage activity is often simply regarded as a zero-sum game, but this view overlooks the systemic positive externalities that arbitrage behavior generates. From the standpoint of market microstructure, arbitrageurs' collective behavior constitutes the core force reshaping market quality. As an endogenous market-regulating force, arbitrageurs' collective action, in eliminating spreads, systematically compresses transaction costs, integrates fragmented liquidity, and leads the effective transmission of price discovery. The four impacts examined below reveal its role as a core driver of market quality.
16.10.1 Spread compression
The bid-ask spread is a core indicator of market liquidity and transaction cost. A narrow spread means that buyers and sellers can trade at prices closer to fair market value, lowering the costs of all market participants. Arbitrage activity, especially high-frequency cross-exchange arbitrage, is one of the most direct and important mechanisms for compressing the bid-ask spread.
Its operating logic is rooted in competitive pressure. In a fragmented market, high-frequency arbitrageurs (Tier 1), at microsecond speed, execute "quote-picking" operations across multiple exchanges (that is, buying the sell orders of a low-price exchange and selling the buy orders of a high-price exchange), exerting continuous competitive pressure on market makers. To avoid having their quotes systematically picked off, market makers are forced to tighten their bid-ask spreads to a level close to the globally unified market price (the specific spread-compression trend was presented in detail in Section 16.5.4). This competitive mechanism ultimately benefits all end users.
Empirical research clearly displays the negative correlation between arbitrage activity and the bid-ask spread. We can quantify the intensity of arbitrage activity by constructing an "arbitrage-activity index"—for example, using indicators that more directly reflect arbitrage behavior, such as the frequency of synchronized opposing trades across exchanges and the share of identified delta-neutral positions in total open interest—rather than outcome variables such as the speed of spread convergence, so as to avoid the circular-reasoning risk of mistaking the effect of arbitrage for its cause. As the figure below shows, when the arbitrage-activity index rises, the average bid-ask spread in mainstream perpetual-futures markets shows a clear downward trend. This relationship persists across market states, indicating that arbitrage is a structural force maintaining a low-transaction-cost environment.
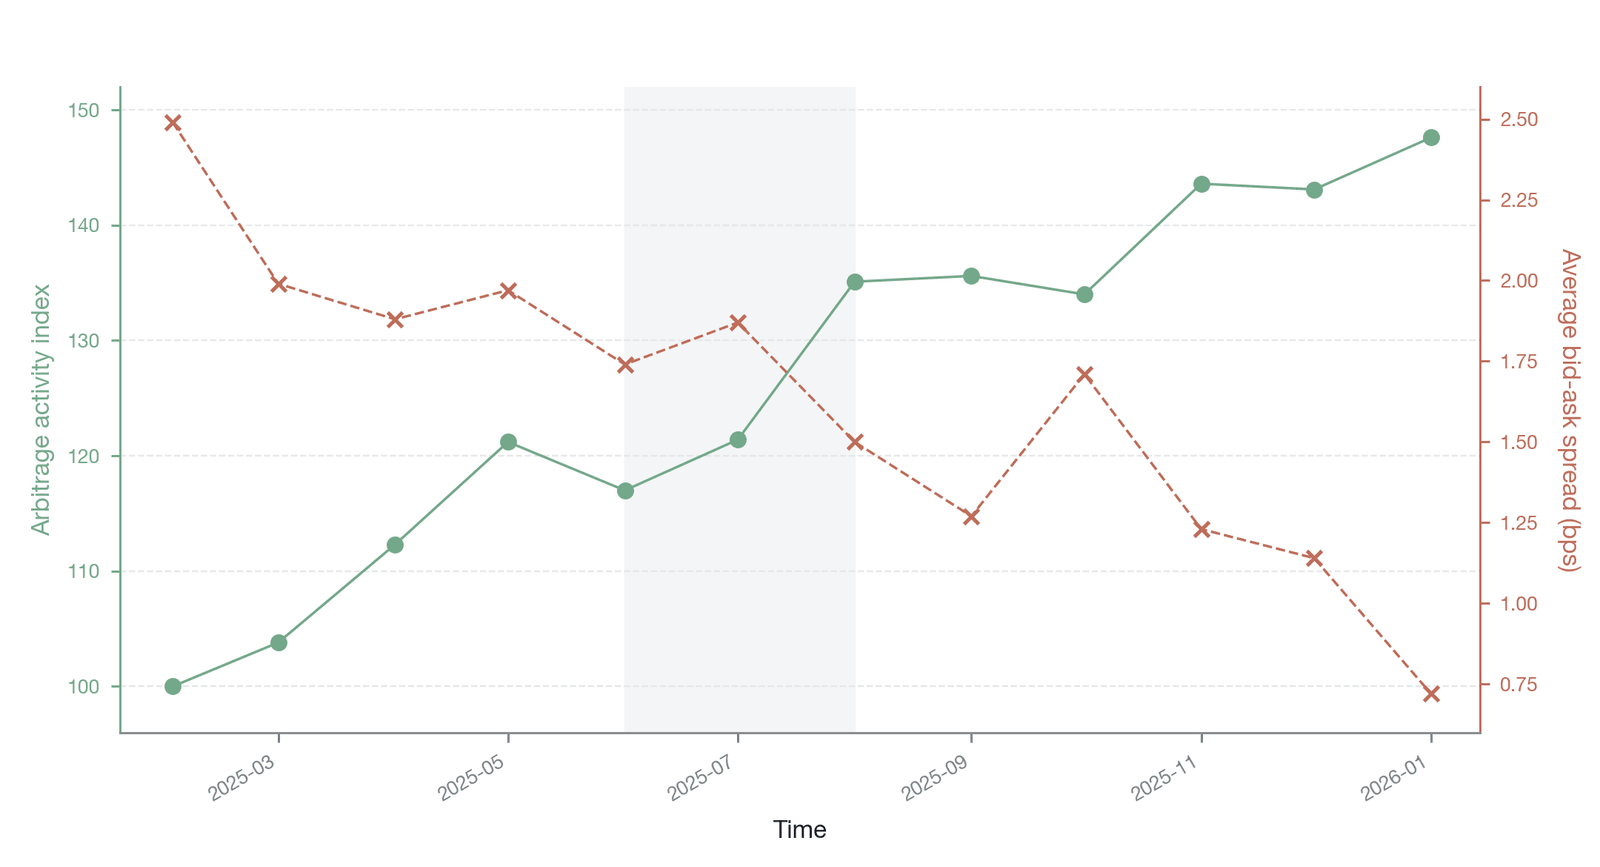
Figure 16-28. The dynamic relationship between arbitrage activity and the bid-ask spread (data source: Binance exchange API data [10]; arbitrage activity is measured by direct proxies such as the frequency of synchronized opposing trades and the share of delta-neutral positions, rather than the speed of spread convergence, to avoid circular reasoning)
Figure 16-28 shows the dynamic relationship between the arbitrage-activity index and the average bid-ask spread in mainstream perpetual-futures markets. Here arbitrage activity is measured comprehensively by direct proxies such as the frequency of synchronized opposing trades across exchanges and the share of identified delta-neutral positions, rather than the speed of spread convergence, to avoid circular reasoning. The two curves show a clear negative correlation: the spread narrows in step when activity rises and widens when activity weakens (as during the liquidity ebb triggered by a major market event), indicating that arbitrage is a structural force maintaining a low-transaction-cost environment.
Ultimately, this arbitrage-driven spread-compression mechanism passes the reduction in transaction costs to every corner of the market. Both the retail trader making small trades and the institution executing large orders benefit from a tighter, more efficient pricing environment. In pursuing their own profit, arbitrageurs in effect supply the entire market with an important public good: lower transaction friction.
16.10.2 Liquidity integration
Besides compressing spreads, arbitrage activity improves market quality along another key dimension: integrating order-book depth. In a highly fragmented environment such as the digital asset market, liquidity is dispersed across hundreds of independent exchanges. For a trader wishing to execute a large order, the order-book depth of a single exchange may be insufficient to complete the trade without significant price impact. The presence of arbitrageurs, however, connects these isolated liquidity pools into a "virtual global liquidity pool."
The core of this concept is that arbitrageurs' cross-market activity allows a change in one exchange's liquidity to be rapidly transmitted to other exchanges (Section 16.8.3 has already argued for a similar liquidity-spillover mechanism from the cross-asset perspective). When a large buy order appears on exchange A, consuming sell-side depth and pushing the price up, arbitrageurs buy on lower-priced exchanges B and C and sell on exchange A, both bringing exchange A's price back to equilibrium and replenishing the depth that was consumed. In effect, the liquidity of exchanges B and C is transmitted to exchange A, so that the "effective depth" of any single exchange is far greater than the depth visible on its order book.
Through smart order-routing systems, trade aggregators can split a large order across multiple exchanges for simultaneous execution, drawing on the virtual global liquidity network that arbitrageurs have built. An empirical comparison shows, by way of illustrative estimation, that a $10-million-scale order executed on a single exchange might cause a price impact of about 20 basis points, whereas spreading it across multiple mainstream exchanges through an aggregator might reduce the total price impact to about 5 basis points (the specific figures depend on the underlying asset, market state, and order-book depth). This effect stems from arbitrageurs serving as the transmission mechanism of liquidity, ensuring the consistency of global prices and the interconnection of liquidity.
As the figure below shows, in a market without an efficient arbitrage mechanism, the liquidity of each exchange is isolated. But when arbitrageurs actively participate, not only does the depth of each exchange itself increase because market makers participate more actively, but, more importantly, the liquidity of all exchanges is integrated into a virtual global liquidity pool far larger than the sum of its parts. In the dispersed market structure of the digital asset market, which lacks central clearing and a unified trading venue, arbitrageurs assume the core function of liquidity integration and are the key transmission mechanism connecting hundreds of independent liquidity pools.
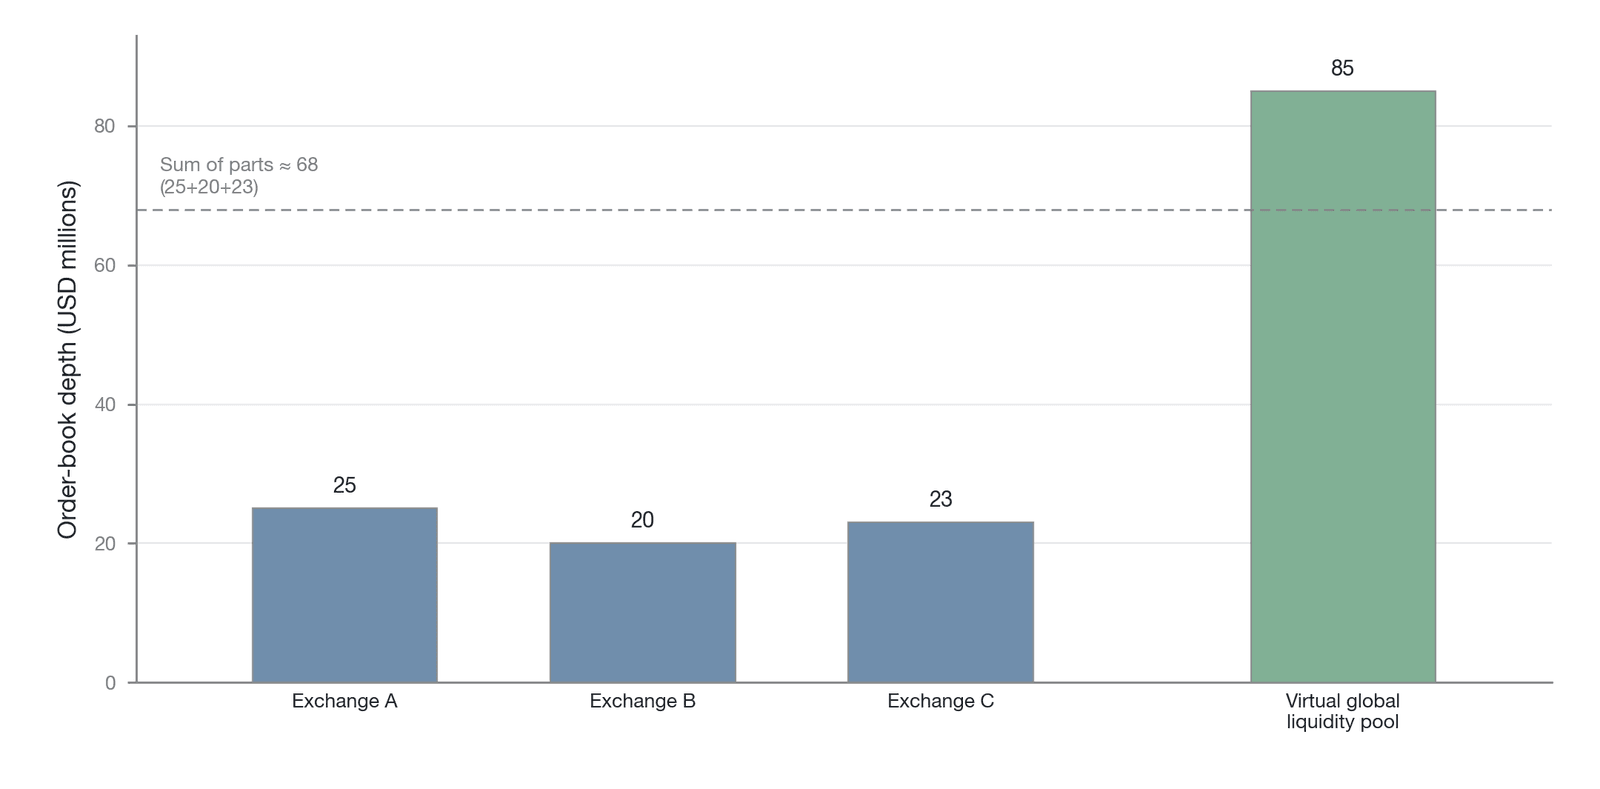
Figure 16-29. The integrating effect of arbitrage on order-book depth (Data source: constructed by the author)
Figure 16-29 uses a single panel to compare the independent order-book depth of individual exchanges with the virtual global liquidity pool after arbitrage integration: the first three bars represent the limited depth of three exchanges when they are independent of one another (the liquidity-island state), and the rightmost bar represents the virtual global liquidity pool that arbitrageurs weave together through cross-market activity, whose total depth is significantly higher than the simple sum of the individual exchanges' depths (as the reference line shows)—indicating that efficient arbitrage not only thickens each exchange's depth through market makers' more aggressive quoting but also integrates dispersed liquidity into a whole whose total depth far exceeds the sum of its parts.
16.10.3 Price-discovery leadership
As Chapter 15 showed, drawing on multiple empirical studies (including the information-share analysis of price discovery in ether spot and derivatives markets by Alexander et al. (2020) [25]), perpetual futures lead the price-discovery process most of the time (with a contribution of about 70-80%). Arbitrageurs serve as the key medium of bidirectional information transmission in this dynamic.
In a normal market environment, the perpetual-futures market, by virtue of its structural advantages (as analyzed in earlier sections), becomes the preferred venue for informed traders to express their views. When new information about an asset's fundamentals (whether macroeconomic data, project developments, or regulatory news) appears, these traders build positions first in the most liquid perpetual-futures market, causing the perpetual-futures price to move first. At this point, spot-perpetual basis arbitrageurs quickly step in. If the perpetual-futures price rises, they sell perpetual futures while buying an equivalent amount of spot to lock in the basis profit. This process "transmits" the price signal of the perpetual-futures market to the spot market, prompting the spot price to follow upward until the basis returns to a normal level. Along this typical path, arbitrageurs are the agents through which perpetual futures lead spot.
Price-discovery leadership, however, is not fixed. Under the shock of certain special events or structural capital-flow changes, leadership can flip. A typical example is the approval of and large-scale capital inflows into the U.S. spot Bitcoin ETFs in early 2024. In this case, the information source (the large-scale buying demand) acts directly on the spot market (mainly custodial exchanges such as Coinbase). The large ETF-creation demand translates into direct purchases of spot Bitcoin, driving the spot price up first. At this point, basis arbitrageurs perform the reverse operation: observing that the spot price is higher than the perpetual-futures price, they buy perpetual futures while selling spot (or, if holding spot, selling it directly). This behavior transmits the strong demand signal of the spot market to the perpetual-futures market, causing the perpetual-futures price to follow upward passively. In this scenario, the price-discovery share of the spot market rises significantly, briefly approaching that of perpetual futures, while arbitrageurs play the role of transmitting the spot signal in reverse to the derivatives market.
Viewing arbitrageurs as a bidirectional transmission mechanism for price signals is therefore key to understanding the dynamic changes in price-discovery leadership. They do not serve the dominance of perpetual futures in one direction only but mechanically respond to any spread that deviates from equilibrium. Wherever the price signal originates, arbitrageurs ensure it is propagated to every tier of the market in the shortest time. As the figure below shows, although perpetual futures dominate most of the time, the leadership share changes dynamically, reflecting shifts in the main channels of market information inflow across periods. Arbitrageurs constitute the core execution mechanism in this dynamic transmission system.
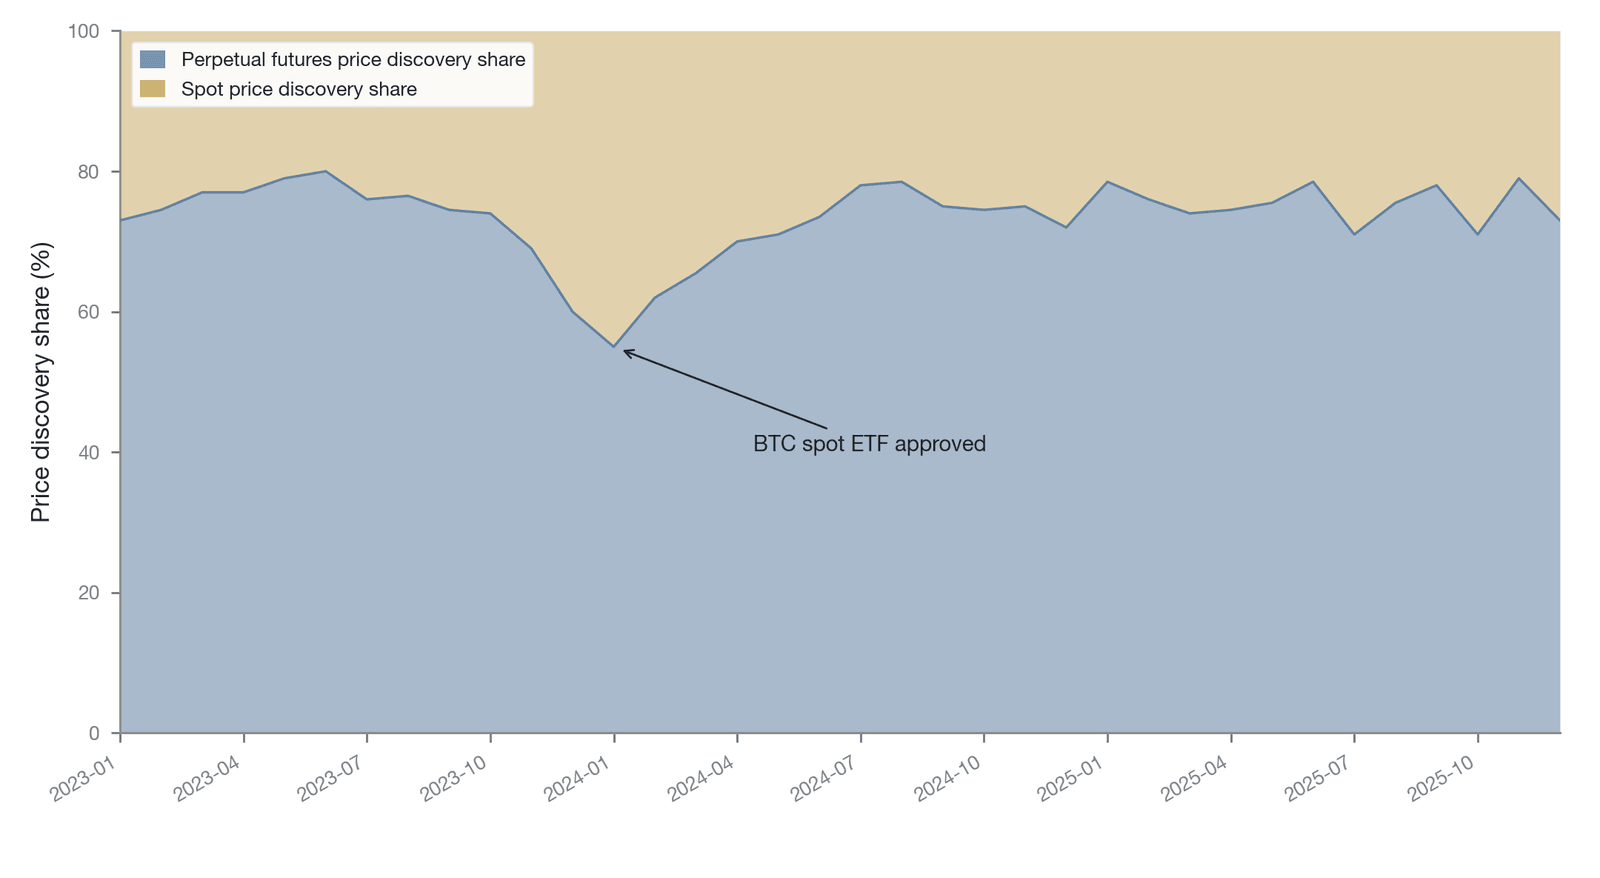
Figure 16-30. The dynamics of price-discovery leadership between perpetual futures and spot (data source: a schematic constructed by the author, synthesized from the information-share analysis of Chapter 15, including Alexander et al. 2020 [25])
Figure 16-30 tracks the evolution of the price-discovery leadership share between the perpetual-futures and spot markets (the vertical axis is the perpetual futures' share of information): during most of the observation period, the perpetual share remains above 70%, confirming its status as the dominant venue for price discovery; but at key junctures such as the approval of the spot Bitcoin ETFs and the large capital inflows into spot in early 2024, the perpetual's leadership share falls markedly and the spot share rises correspondingly, briefly approaching the perpetual's. These dynamic switches confirm the core role of arbitrageurs as a bidirectional transmission mechanism for price signals.
16.10.4 The rate-stabilization function
As the empirical analyses of Sections 16.4.4 and 16.7.4 show, the funding rate mechanism is itself merely a set of rules, and its actual effectiveness depends entirely on the presence of a group of arbitrageurs of sufficient scale, activity, and efficiency to perform price-correction operations. When the funding rate deviates substantially from equilibrium because of a shift in market sentiment, arbitrageurs collect the rate by constructing opposing delta-neutral positions, and their large-scale building of opposing positions itself constitutes corrective pressure on the perpetual-futures price, pushing the funding rate back toward the equilibrium level.
We can understand the decisive role of arbitrageurs as the "mechanism stabilizer" through a thought experiment: suppose a perpetual-futures market with no arbitrageurs. When extreme sentiment arises in the market, the funding rate might rise to an extreme level (or fall to an extremely low negative value) and stay there for a long time, because there is no strong enough counterparty force to offset the one-directional pressure of speculators. In this case, the perpetual-futures price could deviate substantially from the spot price for a long time, and its function as an effective hedging and price-discovery tool would be severely impaired. Arbitrageurs are the core participants that drive this set of rules to function effectively.
As the figure below shows, there is a nonlinear mapping between arbitrage intensity and the level of the funding rate. When the funding rate is in a relatively moderate range, arbitrage intensity stays at a certain level. But when the funding rate rises sharply because of market imbalance, arbitrage intensity grows exponentially, as the higher potential return draws in more arbitrage capital. This response mechanism ensures that the funding rate is always subject to a strong constraint toward convergence to the equilibrium level, preventing it from deviating without bound. Arbitrageurs are therefore not only the core driving force of market efficiency but a necessary condition and intrinsic component that allows the institutional design of perpetual futures to hold together and function effectively.
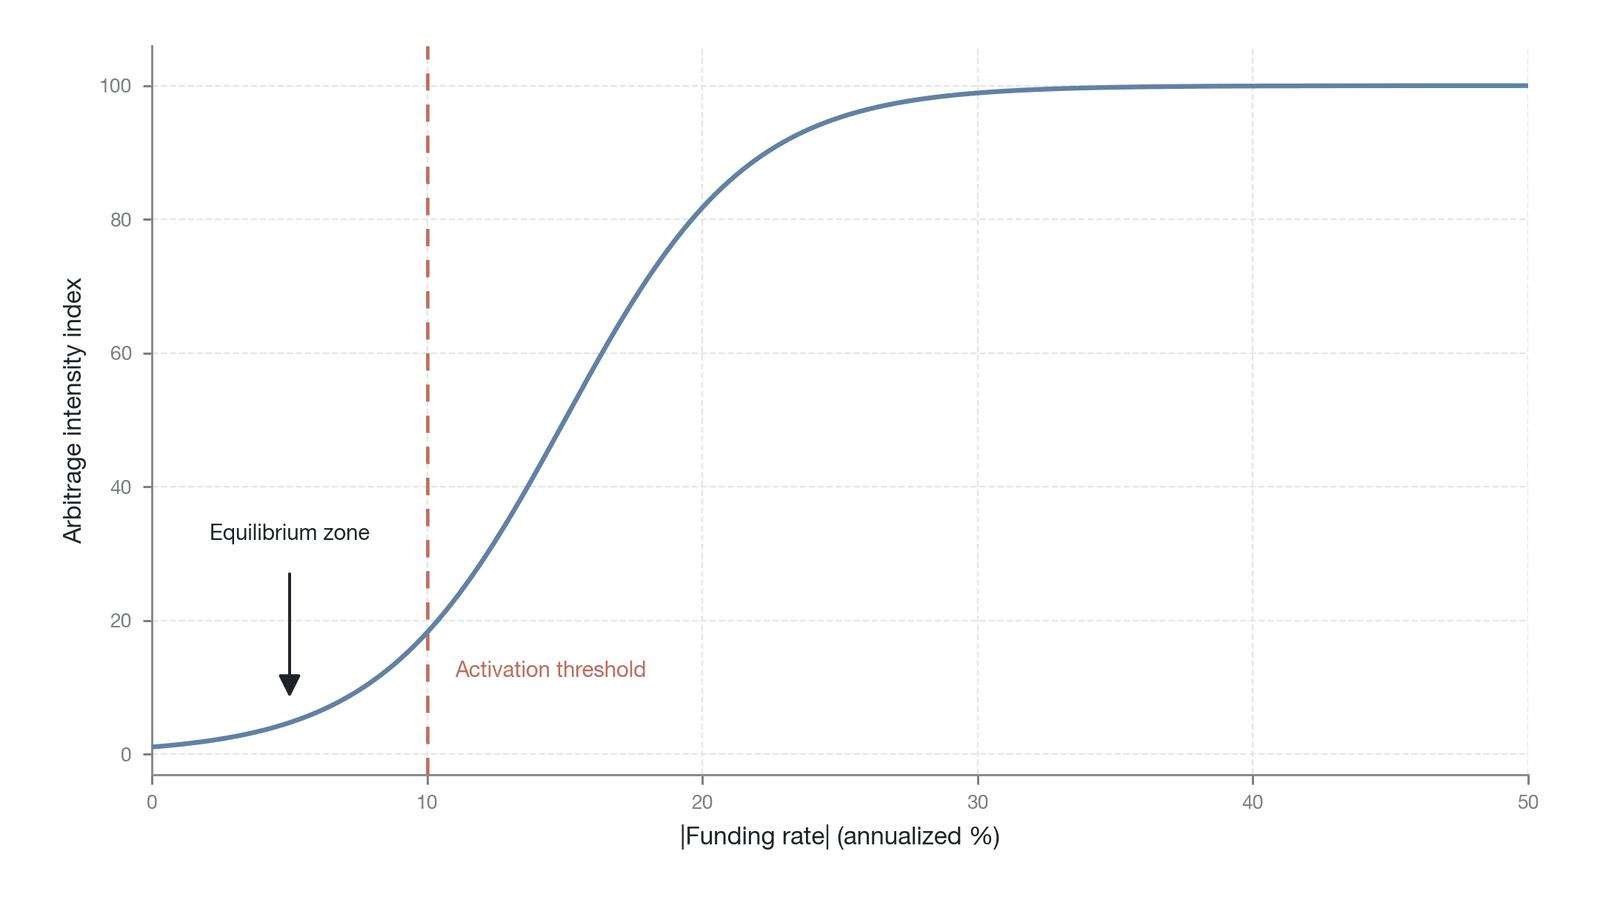
Figure 16-31. The mapping between the funding rate and arbitrage intensity (Data source: an analytical model constructed by the author)
Figure 16-31 reveals the nonlinear mapping between the funding rate (annualized) and arbitrage intensity (measured by the scale of newly added delta-neutral positions): when the rate is in a moderate range (such as 5-15% annualized), arbitrage intensity stays at a baseline level, but once the rate breaks through a certain threshold because of market imbalance, it jumps exponentially, reflecting the strong attraction of high returns for arbitrage capital. This convex response mechanism ensures that the funding rate is always subject to a constraint toward convergence to the equilibrium level, preventing it from deviating without bound in an extreme direction.
16.11 The arbitrage-efficiency transmission model
The analysis of the preceding ten sections has systematically presented a complex arbitrage ecosystem. From the theoretical framework to the stratification of participants, from the six core arbitrage strategies to their reshaping of market microstructure, we have assembled a detailed picture. In particular, Section 16.10 displayed, along four dimensions (spread compression, liquidity integration, price-discovery leadership, and rate stability), the empirical impact of arbitrage activity on market quality. If these analyses are not integrated into a unified theoretical framework, however, they still lack systematic explanatory power. This section aims to establish a "transmission model" that abstracts the empirical impacts observed in Section 16.10 into three progressive theoretical mechanisms—price calibration, information aggregation, and liquidity integration—thereby explicitly connecting micro-level arbitrage behavior with macro-level market efficiency and answering the central question of the whole chapter: how does arbitrage push the perpetual-futures market toward efficiency? These three mechanisms map clearly onto the four empirical dimensions of Section 16.10: spread compression and rate stability fall under the "price calibration" layer, price-discovery leadership falls under the "information aggregation" layer, and liquidity integration corresponds separately to the "liquidity integration" layer.
The efficiency transmission of arbitrage is not a single, linear process but a multi-tiered, multidimensional complex network. We can decompose it into three progressive, mutually reinforcing layers.
The first layer is price calibration, the most direct and most observable efficiency-transmission path of arbitrage: arbitrageurs' buying and selling act directly on the price deviation, compressing it to near zero (the specific mechanisms of the three types of calibration—basis, cross-exchange, and funding rate—are detailed in Sections 16.4, 16.5, and 16.7, respectively). Compared with the latter two layers, the transmission mechanism of the price-calibration layer is easier to observe directly and to verify quantitatively. In the efficiency-spectrum framework, the price-calibration layer operates mainly on the "market-tier" and "space" dimensions, ensuring that prices remain consistent across different markets and exchanges.
The second layer is information aggregation. In pursuing profit, arbitrageurs not only compress spreads but also integrate the information dispersed across different markets, different exchanges, and different contract types into a unified, effective price signal: when new information is first priced in one market, arbitrageurs' cross-market trading ensures it is transmitted to other markets within seconds, bringing the same asset's global prices into alignment (the bidirectional transmission path of its price discovery is detailed in Section 16.10.3). Arbitrageurs are the core accelerating mechanism of this information-transmission process. In the efficiency-spectrum framework, the information-aggregation layer operates mainly on the "information type" and "time" dimensions, ensuring that the same information is reflected across different markets at increasingly similar speeds.
The third layer is liquidity integration, the layer of the three transmission mechanisms with the broadest coverage and the most lasting impact on market structure. Arbitrageurs (especially Tier 1 high-frequency traders), while executing arbitrage, add liquidity to the market through continuous two-sided quoting, and, more importantly, integrate the "local liquidity" of individual exchanges into a "virtual global liquidity pool" through cross-market activity, so that large orders can be split across multiple exchanges for execution via smart order routing (the full discussion of this integration mechanism appears in Section 16.10.2). In the efficiency-spectrum framework, the liquidity-integration layer operates mainly on the "asset" dimension, ensuring that the liquidity of mainstream assets is far higher than that of long-tail assets, thereby forming a clear liquidity gradient.
These three transmission mechanisms do not exist independently but reinforce and promote one another. Price calibration lays the foundation for information aggregation, because only when prices can be effectively calibrated can information be accurately reflected; information aggregation in turn drives liquidity integration, because when participants believe that prices across different markets are consistent, they are more willing to trade across markets, strengthening the formation of virtual global liquidity; and liquidity integration further strengthens price calibration, because deeper liquidity means lower execution costs for arbitrage trades, allowing even smaller spreads to be eliminated by arbitrage.
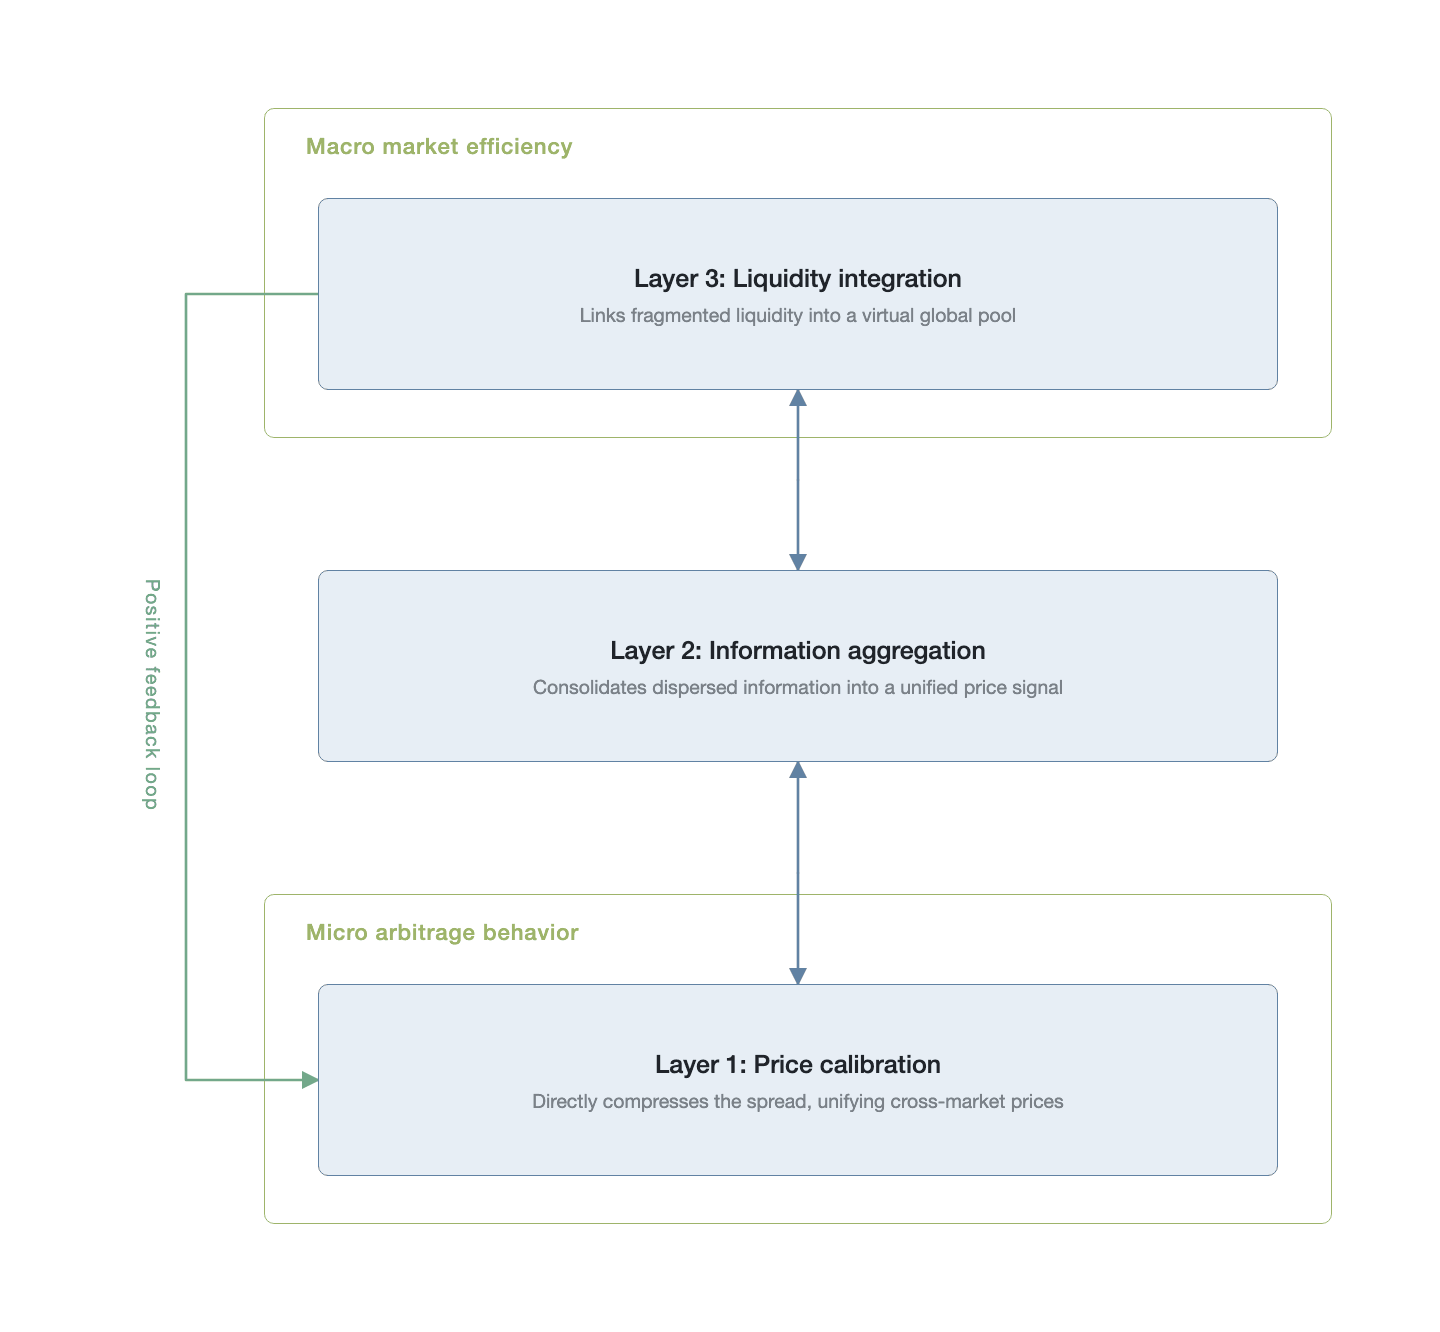
Figure 16-32. The three-layer model of arbitrage efficiency transmission (Data source: a conceptual schematic constructed by the author)
Figure 16-32 uses a tiered structure diagram to display the three-layer model of arbitrage efficiency transmission: the bottom layer is price calibration (most direct and most observable), the middle layer is information aggregation (integrating dispersed information into a unified price signal through cross-market trading), and the top layer is liquidity integration (with the broadest coverage and the most lasting impact on market structure). The three layers form a mutually reinforcing positive-feedback relationship via bidirectional arrows: price calibration lays the foundation for information aggregation, information aggregation drives liquidity integration, and liquidity integration in turn lowers the execution cost of price calibration.
Building on the three-layer transmission mechanism, we can further establish a mapping between arbitrage intensity and market efficiency. The efficiency-spectrum framework established in Chapter 15 provides a multidimensional tool for describing market efficiency, but it is itself static and descriptive. The core innovation of this section is to use arbitrage intensity as a mediating variable, transforming this static efficiency-spectrum framework into a dynamic, causal explanatory model.
We can express this mapping with the following functional relationship:
where denotes the time scale, denotes the asset, denotes the information type, and denotes the market state (here refers to the information-type dimension and has a different meaning from the used as an exchange subscript in Sections 16.5 and 16.7). This function indicates that at any specific coordinate of the efficiency spectrum (determined by the four dimensions of time, asset, information type, and market state), the level of market efficiency is determined by the arbitrage intensity at that coordinate. As noted in the discussion of circular reasoning in Section 16.10.1, the dependent variable "efficiency" here must be measured by indicators orthogonal to the spread (such as the Hasbrouck information share, the spread-convergence half-life, and market depth) rather than by the speed of spread convergence, or the mapping would degenerate into a tautology.
The mapping above implicitly assumes a stable macro-financial environment. In fact, the state of global dollar liquidity constitutes an important moderating variable: in a loose liquidity environment, arbitrage capital is abundant and financing costs are low, so the same level of arbitrage intensity can produce a higher efficiency-transmission effect; whereas during a liquidity contraction (such as a Federal Reserve balance-sheet-reduction cycle), the opportunity cost of arbitrage capital rises and its risk tolerance contracts, so that even with unchanged arbitrage strategies and technology, the transmission efficiency declines systematically. The crypto-market liquidity crisis of 2022 illustrated this vividly. A more complete mapping should therefore take the conditional form: efficiency ≈ g[arbitrage intensity | macro liquidity state], where macro liquidity moderates transmission efficiency by affecting the cost and risk appetite of arbitrage capital.
This mapping exhibits pronounced heterogeneity across different quadrants of the efficiency spectrum. Consider two extreme scenarios. The first is the quadrant of "high-frequency, mainstream coin, standardized information, normal market." In this quadrant, arbitrage intensity reaches its highest level. High-frequency arbitrageurs are most active here, all six arbitrage strategies are feasible and competition is fierce, and market participants are numerous and well-capitalized. As a result, market efficiency in this quadrant approaches the theoretical ceiling. Spreads are extremely narrow (typically on the order of 1-2 basis points for BTC perpetual futures on mainstream exchanges), price discovery is extremely fast (millisecond scale), and liquidity is extremely deep. The second extreme scenario is the quadrant of "low-frequency, small-cap coin, complex on-chain information, crisis market." Here arbitrage intensity is extremely low. The liquidity of small-cap coins is itself limited, the complexity and verification cost of on-chain information are high, and the risk premium in crisis periods is enormous, so that even simple arbitrage strategies struggle to profit. As a result, market efficiency in this quadrant is far below that of the former. Spreads are wide (up to the order of 50-100 basis points for illiquid long-tail assets), price discovery is slow (minute scale or longer), and liquidity is thin.
This mapping model has a clear policy implication: if we wish to improve market efficiency, the key lies not in "calling for a more efficient market" or "imposing stricter rules" but in reducing the friction and cost of arbitrage. This spans several levels. At the technical level, it means improving interconnection among exchanges and reducing the latency of cross-market trading. At the institutional level, it means unifying the settlement cycles and rate structures of different exchanges to lower the institutional friction of arbitrage. At the regulatory level, it means securing the legal standing of arbitrageurs, protecting their property and trading rights, and preventing policy uncertainty from raising arbitrage costs. Any improvement in these areas would directly raise arbitrage intensity and, in turn, improve market efficiency.
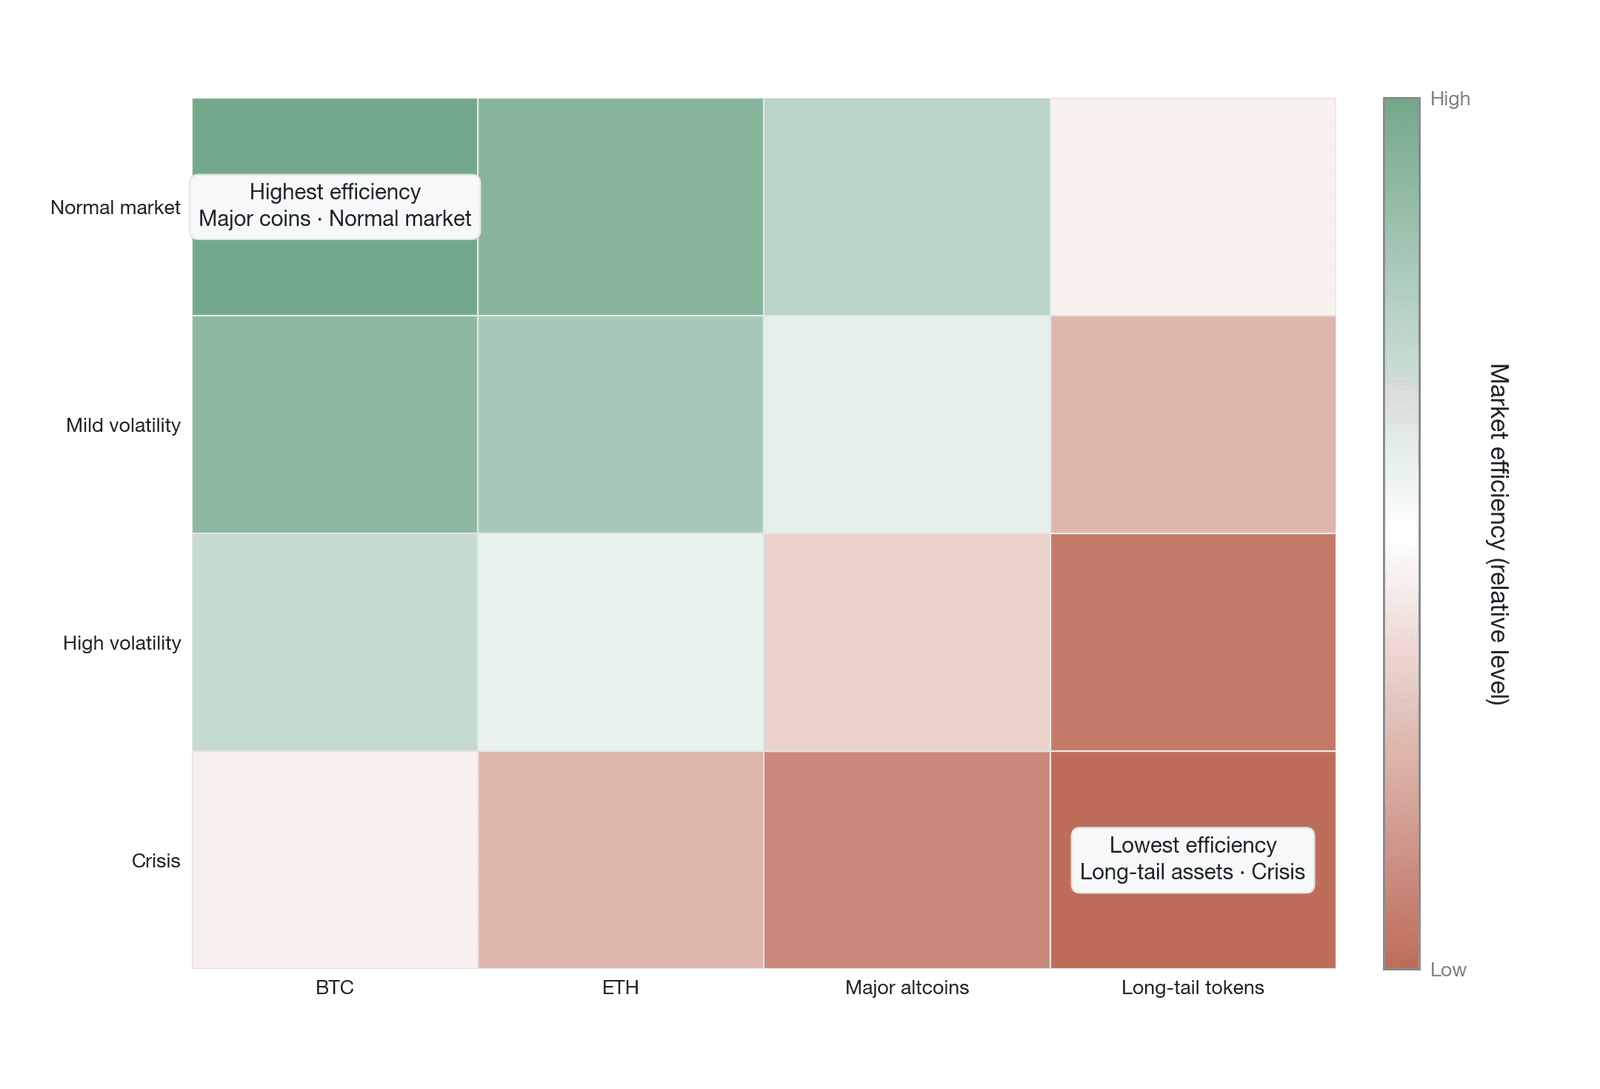
Figure 16-33. The mapping between arbitrage intensity and the efficiency spectrum (data source: a conceptual model constructed by the author; arbitrage intensity is characterized comprehensively by indicators such as the speed of cross-exchange spread convergence, the rate of change of basis-arbitrage-related open interest, and the mean-reversion half-life of the funding rate)
Figure 16-33 simplifies the multidimensional coordinate space of the efficiency spectrum into a two-dimensional projection and marks two extreme quadrants: in the "high-frequency-mainstream-coin-normal-market" quadrant (the upper-left region), arbitrage intensity and market efficiency both reach their highest, and both spreads and information latency are compressed to the limit; whereas in the "low-frequency-long-tail-asset-crisis-market" quadrant (the lower-right region), insufficient arbitrage intensity causes efficiency to fall significantly below that of the former. The gradient distribution between the two quadrants intuitively reflects the decisive influence of the arbitrage cost structure on the level of market efficiency.
This seemingly simple mapping model, however, harbors an intrinsic paradox—one that was already revealed in the classic paper of Grossman and Stiglitz (1980) but is especially pronounced in the crypto market.
The self-limiting nature of arbitrage stems from a basic economic principle: when a profit opportunity is fully exploited, the opportunity vanishes. The inflow of arbitrage capital compresses the basis and the rate, driving returns back to the equilibrium level that "just covers arbitrage costs" (the dynamic-equilibrium concept itself is presented in Section 16.1.4, and the reflexive-loop example of Ethena's large-scale shorting systematically depressing the funding rate appears in Section 16.4.3). This process can be observed in all six arbitrage types: the fall in returns prompts some capital to exit, the spread and the rate then widen again, and a new round of capital is drawn in, so that the market forms a persistent "efficiency oscillation" around some equilibrium level.
This self-limiting mechanism aligns closely with the adaptive markets hypothesis proposed by Lo (2004) [26]. The adaptive markets hypothesis holds that market efficiency is not an end state but a perpetually ongoing dynamic process. Market participants continuously adapt to the environment, discovering and exploiting new arbitrage opportunities, but this process itself eliminates those opportunities, pushing the market toward a new equilibrium. This cycle has no end point, and market efficiency has no fixed "ceiling" but fluctuates continuously under different conditions.
From this perspective, the "arbitrage failures and market anomalies" that Chapter 18 will discuss no longer seem mysterious. Those seemingly long-lasting market anomalies in fact often reflect a rise in arbitrage costs or a temporary shortage of arbitrage capital. When arbitrage costs rise for some reason (such as leverage constraints, higher risk premia, or technical failures), the spreads that arbitrage had eliminated reappear. In most cases, this is not a market "failure" but a new equilibrium under a new cost structure. Two starkly different situations must be distinguished, however: in a normal cost adjustment, the spread does re-stabilize at a new level; but in an extreme liquidity crisis, the widening of the spread may trigger self-reinforcing positive feedback: arbitrageurs are hit by margin calls or forced liquidation, and their forced unwinding further drives the spread wider, causing more arbitrageurs to be liquidated. In such a margin spiral, the system does not converge toward a "new equilibrium" but may keep diverging until external intervention or bankruptcy clearing. The equilibrium assumption of arbitrage's self-limiting nature holds only when the system has not entered the liquidity-spiral region, and because the crypto market lacks a lender-of-last-resort mechanism and a unified clearing system, its threshold for entering this dangerous region may be lower than in traditional financial markets.
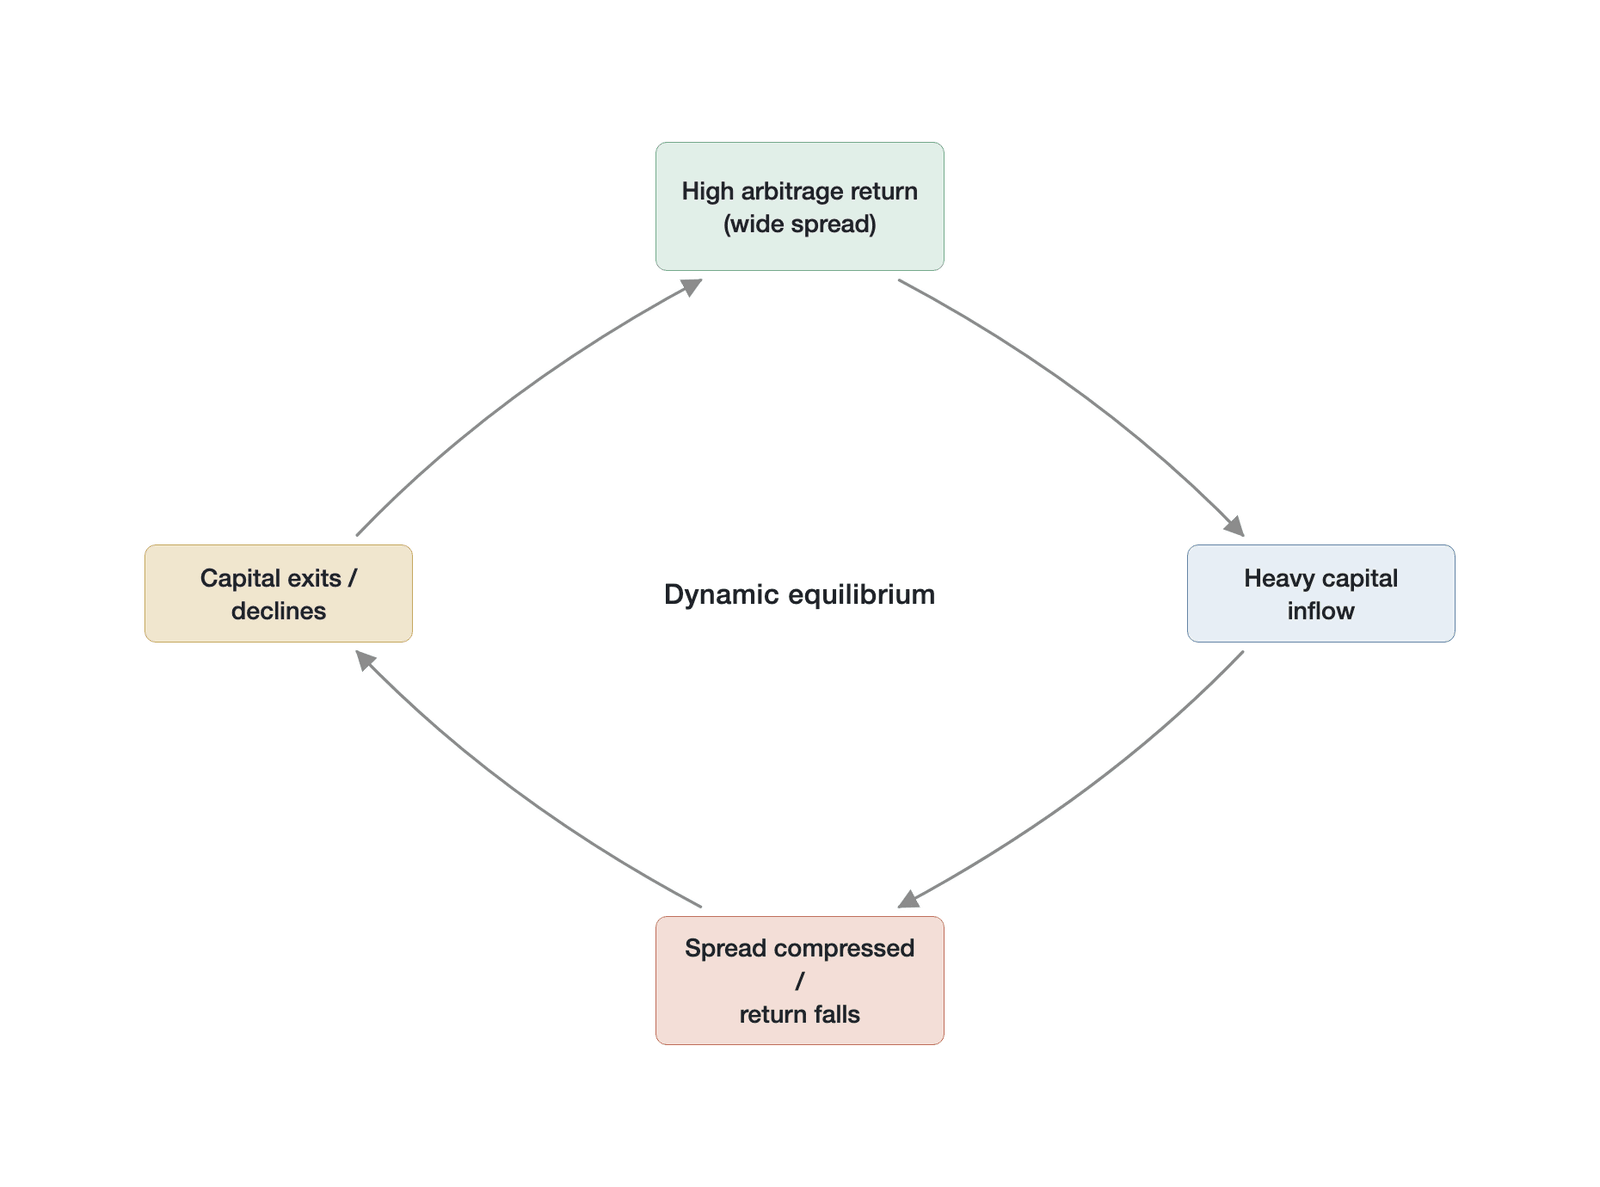
Figure 16-34. The self-limiting nature of arbitrage and adaptive equilibrium (data source: a conceptual schematic constructed by the author, with parameters referencing the adaptive markets hypothesis framework of Lo 2004 [26])
Figure 16-34 uses a cycle diagram to depict the dynamic equilibrium between arbitrage intensity and arbitrage returns: rising arbitrage returns attract new capital and drive arbitrage intensity up, higher arbitrage intensity compresses the spread and the rate and causes returns to fall, and falling returns in turn prompt some capital to exit, so the spread widens again and returns rise once more. The system ultimately oscillates around a dynamic-equilibrium point, and the spread level corresponding to that equilibrium point is the efficiency ceiling the market can maintain, as well as the minimum compensation needed to incentivize arbitrageurs to keep providing infrastructure services.
In sum, perpetual-futures arbitrage, compared with arbitrage in traditional markets, displays irreplaceable efficiency contributions along three dimensions. First, the "flow anchoring" paradigm gives the arbitrage force continuity in the time dimension, so that price-correction pressure is no longer concentrated around the maturity date of traditional futures but is distributed evenly across the entire trading cycle through the funding rate mechanism. Second, as a real-time quantitative indicator of market sentiment, the funding rate gives arbitrage behavior a sentiment-calibration function: arbitrageurs' opposing position-building against extreme rates, in correcting the price deviation, also sends the market a clear signal about excessive leverage and risk accumulation—something the traditional futures market lacks. Third, perpetual-futures arbitrageurs simultaneously cross multiple dimensions—spot and derivatives, CEX and DEX, different exchanges, and different assets—serving as a cross-dimensional intermediary for information and liquidity transmission in a highly fragmented market structure. These three contributions make perpetual-futures arbitrage an irreplaceable endogenous mechanism in the efficiency system of the crypto market.
16.12 Chapter summary
Focusing on the arbitrage mechanisms of the perpetual-futures market, this chapter has established a complete analytical framework from micro behavior to macro efficiency. At the theoretical level, we proposed the "arbitrage infrastructure hypothesis," redefining the arbitrageur's role from the "captor of riskless profit" of traditional theory to the "active provider of market infrastructure." In a crypto market that lacks a central clearinghouse and unified regulation, arbitrageurs in fact assume three key infrastructure functions: the cross-market price-transmission bus (partly substituting for a central clearing institution along the price-linkage dimension, but not assuming its concentrated management of counterparty credit risk or its default-fund functions), the anchor of the perpetual-futures price, and the integrator of global liquidity. At the same time, the "flow anchoring" paradigm of perpetual futures, compared with the "point convergence" of traditional futures, fundamentally reshapes the logic of arbitrage, transforming it from a one-off trade into an ongoing position-management activity.
At the empirical level, this chapter systematically deconstructed six core arbitrage mechanisms—spot-perpetual basis arbitrage, cross-exchange arbitrage, spot-futures-perpetual triangular arbitrage, funding rate arbitrage, cross-asset statistical arbitrage, and CEX-DEX cross-tier arbitrage—and revealed how they jointly advance market efficiency through the three-layer transmission path of price calibration, information aggregation, and liquidity integration. The multi-tiered participant structure of the arbitrage ecosystem (from protocol-level arbitrageurs to high-frequency traders, from systematic quantitative funds to on-chain MEV searchers) forms a self-regulating dynamic-equilibrium system, whose intrinsic self-limiting mechanism aligns closely with Lo's adaptive markets hypothesis.
Looking ahead, the evolution of the arbitrage ecosystem will unfold along two main lines. The first is the further protocolization of infrastructure. As on-chain derivatives protocols mature and cross-chain interoperability improves, the efficiency gap between CEXs and DEXs will be compressed further, and the "arbitrage-as-a-service" model represented by Ethena may spur more innovations that package arbitrage strategies into composable financial products. The second is the shaping effect of the regulatory framework. Different jurisdictions' regulatory policies for crypto derivatives will directly affect the friction-cost structure of arbitrage: reducing cross-market trading latency, unifying settlement cycles, and safeguarding the legal standing of arbitrageurs would all directly raise arbitrage intensity and, in turn, improve market efficiency.
The analysis in this chapter, however, also reveals that arbitrage infrastructure is not omnipotent. The self-limiting nature of arbitrage means that market efficiency will never reach the theoretical ceiling; and under extreme market stress, the arbitrage force may temporarily fail because of margin constraints, forced liquidation, or counterparty risk. These "arbitrage failure" scenarios and the market anomalies they trigger will be the central topics of Chapters 17 and 18.
References
[1] Makarov, I., & Schoar, A. (2020). Trading and arbitrage in cryptocurrency markets. Journal of Financial Economics, 135(2), 293–319. https://doi.org/10.1016/j.jfineco.2019.07.001
[2] Shleifer, A., & Vishny, R. W. (1997). The limits of arbitrage. The Journal of Finance, 52(1), 35–55. https://doi.org/10.1111/j.1540-6261.1997.tb03807.x
[3] Mitchell, M., Pulvino, T., & Stafford, E. (2002). Limited arbitrage in equity markets. The Journal of Finance, 57(2), 551–584. https://doi.org/10.1111/1540-6261.00434
[4] He, S., Manela, A., Ross, O., & von Wachter, V. (2022). Fundamentals of perpetual futures. SSRN. https://doi.org/10.2139/ssrn.4301150
[5] Gromb, D., & Vayanos, D. (2010). Limits of arbitrage: The state of the theory. Annual Review of Financial Economics, 2(1), 251–275. https://doi.org/10.1146/annurev-financial-073009-104107
[6] Grossman, S. J., & Stiglitz, J. E. (1980). On the impossibility of informationally efficient markets. American Economic Review, 70(3), 393–408. https://www.jstor.org/stable/1805228
[7] DefiLlama. (n.d.). DeFi TVL dashboard. Retrieved March 10, 2026, from https://defillama.com/
[8] The Block. (2024, February 23). Ethena captures 5% of ether perpetual futures open interest. The Block. https://www.theblock.co/post/278802
[9] Token Terminal. (n.d.). Token Terminal: Fundamentals for crypto. Retrieved March 10, 2026, from https://tokenterminal.com/
[10] Binance. (n.d.). Binance Futures market data API. Retrieved March 10, 2026, from https://www.binance.com/en/futures
[11] CME Group. (n.d.). Bitcoin futures and options on futures. Retrieved March 10, 2026, from https://www.cmegroup.com/markets/cryptocurrencies/bitcoin/bitcoin.html
[12] Zhivkov, P. (2026). The two-tiered structure of cryptocurrency funding rate markets. Mathematics, 14(2), 346. https://doi.org/10.3390/math14020346
[13] Gatev, E., Goetzmann, W. N., & Rouwenhorst, K. G. (2006). Pairs trading: Performance of a relative-value arbitrage rule. The Review of Financial Studies, 19(3), 797–827. https://doi.org/10.1093/rfs/hhj020
[14] DeLong, J. B., Shleifer, A., Summers, L. H., & Waldmann, R. J. (1990). Noise trader risk in financial markets. Journal of Political Economy, 98(4), 703–738. https://doi.org/10.1086/261703
[15] Johansen, S. (1991). Estimation and hypothesis testing of cointegration vectors in Gaussian vector autoregressive models. Econometrica, 59(6), 1551–1580. https://doi.org/10.2307/2938278
[16] Hamilton, J. D. (1989). A new approach to the economic analysis of nonstationary time series and the business cycle. Econometrica, 57(2), 357–384. https://doi.org/10.2307/1912559
[17] Bieganowski, B., & Ślepaczuk, R. (2026). Explainable patterns in cryptocurrency microstructure. arXiv. https://arxiv.org/abs/2602.00776 https://doi.org/10.2139/ssrn.6159346
[18] Pandya, P., Moser, M., & Sofia, G. (2024, August 30). An introduction to oracle extractable value (OEV). Chorus One; Superscrypt. https://chorus.one/reports-research/an-introduction-to-oracle-extractable-value-oev
[19] Daian, P., Goldfeder, S., Kell, T., Li, Y., Zhao, X., Bentov, I., Breidenbach, L., & Juels, A. (2020). Flash boys 2.0: Frontrunning in decentralized exchanges, miner extractable value, and consensus instability. In 2020 IEEE Symposium on Security and Privacy (SP) (pp. 910–927). IEEE. https://doi.org/10.1109/SP40000.2020.00040
[20] Weintraub, B., Ferreira Torres, C., Ritter, C., & Breidenbach, L. (2022). A flash(bot) in the pan: Measuring maximal extractable value in private transaction ordering. In Proceedings of the 2022 ACM SIGSAC Conference on Computer and Communications Security (pp. 3765–3776). ACM.
[21] Pyth Network. (n.d.). Pyth Developer Hub. Retrieved March 5, 2026, from https://docs.pyth.network/
[22] Greene, J., Shahid, A., Benligiray, B., & Vanttinen, H. (2022). Oracle extractable value (OEV) through order flow auctions (v1.0.1). API3 DAO. https://github.com/api3dao/oev-litepaper
[23] dYdX Foundation. (n.d.). dYdX documentation. Retrieved March 5, 2026, from https://docs.dydx.xyz/
[24] Liu, J.-H. (2025, December 13). Technical architecture comparison: Hyperliquid, dYdX, and Lighter.xyz. Medium. https://medium.com/@gwrx2005/technical-architecture-comparison-hyperliquid-dydx-and-lighter-xyz-2fd005854a7e
[25] Alexander, C., Choi, J., Massie, H. R., & Sohn, S. (2020). Price discovery and microstructure in ether spot and derivative markets. International Review of Financial Analysis, 71, 101506. https://doi.org/10.1016/j.irfa.2020.101506
[26] Lo, A. W. (2004). The adaptive markets hypothesis: Market efficiency from an evolutionary perspective. The Journal of Portfolio Management, 30(5), 15–29. https://doi.org/10.3905/jpm.2004.442611