Building on the theoretical framework established in the preceding two chapters, the internal price relationships of a market driven by rational arbitrageurs cannot remain perfectly consistent at no cost. Chapter 16 showed that many persistent spreads are not simple market failures but rather the cost compensation that arbitrageurs require when they provide the services of cross-market clearing, price anchoring, and liquidity integration. Chapter 17 further explained how constraints such as margin, liquidity, platform risk, execution risk, smart contracts, and regulation raise this compensation. This chapter therefore does not label every persistent spread an anomaly; instead, it examines the residual deviations that remain after accounting for modelable arbitrage costs, risk compensation, and institutional frictions.
The existing literature and observations of public markets together point to a more nuanced conclusion: price relationships across markets are not perfectly consistent but instead exhibit layered, persistent deviations under different constraints. The spread in Bitcoin perpetual futures between leading exchanges such as Binance and OKX has, under normal conditions, narrowed to single-digit basis points (bps); these few basis points are more likely the equilibrium price of execution costs, capital pre-positioning, and platform risk than evidence of market inefficiency. The perpetual futures spread between Binance and Korean exchanges, however, typically falls in the 30–80 bps range under non-extreme conditions (data source: Coinglass), well above transaction costs. This perpetual futures spread, however, is not a like-for-like comparison with the widely known spot "kimchi premium": the former is a spread at the derivatives (perpetual futures) level, whereas the latter is a spread at the spot level, and the two are determined by different instruments, participants, and arbitrage paths. The long-run center of the spot kimchi premium is roughly 1.2% (about 120 bps, the estimate from the threshold model of Seo et al. [1]), but it is highly state-dependent and can exceed 20% or even 50% in extreme periods (consistent with the 200–2,000 bps figure for capital-controlled jurisdictions in Table 18-6 of Section 18.4.3). Because professional arbitrageurs participate more heavily in the perpetual futures market, its spreads are typically far smaller in magnitude than the spot kimchi premium, yet they remain large enough to indicate structural barriers that limit the cross-market flow of arbitrage capital. Along the funding-rate dimension, public data show that the share of days on which the funding rate of mainstream perpetual futures is positive has consistently exceeded 50%, with a long-run mean of about 75% (data source: Coinglass; this is a long-run mean spanning bull and bear cycles, and it declines markedly in the bear-market subsample, as detailed in Section 18.3.1), pointing to a persistent "long bias" in the structure of market participants. Along the CEX–DEX dimension, cross-exchange funding-rate research shows an observable rate split between decentralized exchanges (DEXs) and centralized giants in short-sample, high-frequency data (for example, between Hyperliquid and Binance, the arbitrage spread exceeds 20 bps in about 17% of the observed periods [2]), reflecting the additional frictions of smart-contract risk, oracle latency, and the like along the arbitrage path from centralized to decentralized venues. With the advent of Bitcoin spot exchange-traded funds (ETFs), the net asset value of an ETF and the price of perpetual futures also frequently diverge markedly, revealing fundamental differences between the two products in market microstructure, participant composition, and regulatory environment. These phenomena do not imply that every residual spread is inefficient; only when a spread substantially exceeds the explicable costs described above, and displays persistence along the statistical, economic, and temporal dimensions, does this chapter call it a market anomaly. This chapter is therefore concerned with the effective boundaries of the arbitrage mechanism, not with a blanket denial of market efficiency.
Chapter 16 analyzed the operating logic of the arbitrage mechanism, and Chapter 17 systematically laid out the seven major constraints that limit arbitrage. Building on this, the present chapter turns to the observable consequences of these constraints along the price dimension. To that end, it constructs a complete analytical framework. First, it defines the market anomaly and establishes a three-part identification standard of statistical significance, economic significance, and persistence. On this basis, it proposes a "constraint–anomaly mapping" method that establishes a mechanistic correspondence between a specific anomaly and the constraint dimensions defined in Chapter 17, without claiming that each case has undergone rigorous causal identification. It then introduces an "anomaly persistence spectrum," placing anomalies on a non-exclusive continuum composed of transient, cyclical, and structural forms, so as to reveal the different causes behind them and their prospects for repair. We then examine six categories of deviations that are relatively large in magnitude and duration: basis anomalies, funding-rate anomalies, cross-exchange anomalies, cross-asset anomalies, term-structure anomalies, and CEX–DEX anomalies. After this static analysis of each category under normal conditions, we examine how they become interlinked and mutually amplifying in a crisis, ultimately erupting in synchrony to form the "crisis dynamics of anomalies." Finally, the chapter analyzes the evolutionary trends of anomalies from a broader perspective, distinguishing which anomalies can be mitigated through institutional improvement and which are fundamental costs that the market must bear under its current architecture, thereby providing a systematic understanding for designing more efficient and more robust financial markets.
18.1 An analytical framework for anomalies
In Chapter 17, we systematically analyzed the seven-dimensional constraints facing the arbitrage mechanism and explained why arbitrage forces are not omnipotent in the real world. Because these constraints exist, the market cannot eliminate every price deviation everywhere, at all times, and at no cost. The task of this chapter is to confront the direct consequences of these constraints: the price deviations that in theory "should not exist" yet persist in reality, which we call market anomalies. This section first establishes a systematic framework for analyzing these anomalies, laying the methodological foundation for the detailed treatment of each specific anomaly in later sections. The framework aims to answer three core questions. First, how should we rigorously define and identify an anomaly so as to distinguish it from random market noise? Second, how should we establish a causal connection between an observed anomaly and the specific constraints discussed in the previous chapter? Third, how should we classify anomalies according to their temporal behavior in order to reveal the different driving mechanisms and repair possibilities behind them?
18.1.1 The definition and identification of anomalies
In the context of this book, a market anomaly does not refer loosely to any price fluctuation or temporary inconsistency; it has a strict operational definition. It is price behavior that should not persist over the long run under the ideal no-arbitrage conditions described in Chapter 16 and whose degree of deviation is significant in both economic and statistical terms. This definition emphasizes that anomalies are not the market's normal state but the systematic deviations that emerge in market price behavior when arbitrage forces, constrained, cannot operate effectively. To separate genuine anomalies from the market's background noise, we establish an identification framework composed of three criteria (Table 18-1).
| Identification criterion | Definition | Test method |
|---|---|---|
| Statistical significance | The price deviation is statistically systematic rather than a chance random event | HAC-robust mean tests, the block bootstrap, regime-switching models, or extreme-value clustering tests |
| Economic significance | The potential profit implied by the deviation is large enough to cover all arbitrage costs | Deviation magnitude > trading commissions + slippage + funding costs + opportunity cost |
| Persistence | The deviation exhibits a predictable, sustained pattern along the time dimension | Autocorrelation tests are significantly positive, or half-life estimates quantify the speed of convergence |
Table 18-1. The three-criterion framework for identifying anomalies (Data source: compiled by the author)
The first criterion is statistical significance. Any price deviation must first be shown statistically to be systematic rather than a chance random event. Because high-frequency crypto data typically exhibit autocorrelation, fat tails, heteroskedasticity, regime switching, and multiple-testing problems, a simple mean t-test serves only as an initial screen; a more robust approach combines HAC standard errors, the block bootstrap, threshold or regime-switching models, and extreme-value clustering tests. This is the minimum threshold for identifying an anomaly, ensuring that the phenomena under discussion are statistically testable. Given the limits of publicly available data, the remainder of this chapter argues primarily for economic significance (whether the deviation magnitude exceeds arbitrage costs) for several anomalies, while leaving the full tests of statistical significance and persistence (reporting t-values, autocorrelation coefficients, and half-life estimates) to dedicated empirical research; a few flagship anomalies (such as the long-term positive bias in Section 18.3.1 and the asymmetric mean reversion in Section 18.2.3) are walked through all three criteria illustratively as a methodological demonstration.
The second criterion is economic significance. A deviation that is statistically significant is not necessarily profitable. If the magnitude of a spread is smaller than the total cost an arbitrageur must incur to eliminate it, then the existence of that spread is reasonable, reflecting the market's microstructure costs. A genuine anomaly, therefore, must imply a potential profit from the price deviation large enough to cover all the transaction costs involved in executing the arbitrage strategy, including but not limited to trading commissions, the bid-ask spread (slippage), funding costs, and opportunity cost. Only when the magnitude of the deviation exceeds the boundary of this "arbitrage-infeasible band" can we say that arbitrageurs have an incentive to eliminate it, and only then does its persistence constitute a phenomenon in need of explanation.
The third criterion is persistence. An anomaly is not a fleeting signal but a pattern with a temporal dimension. This means that the price deviation exhibits predictable persistence—for example, an autocorrelation test may reveal significant positive correlation in the time series, or a half-life estimate may measure the speed of convergence toward equilibrium. A price shock without persistence is more likely to be classified as the market's normal response to new information or as random fluctuation, whereas a persistent deviation points to some structural force that obstructs the market's return to equilibrium. Only phenomena that satisfy all three criteria—statistical significance, economic significance, and persistence—are admitted into the category of anomalies studied in this chapter.
When applying the criteria above to identify anomalies, it is worth further distinguishing two qualitatively different kinds of price deviation. The first is the pure anomaly, a price deviation maintained entirely by arbitrage constraints; if the relevant constraint is removed, the deviation tends to disappear. The kimchi premium created by regulatory barriers is one such case: if capital controls were lifted, the spread between the Korean market and the global market would be eliminated rapidly by arbitrageurs. The second is the equilibrium deviation, a reasonable risk compensation determined by the structure of market participants that may persist to some degree even in an idealized frictionless market but whose actual magnitude is substantially amplified by arbitrage constraints. The long-term positive bias in funding rates is the archetype: even in a fully frictionless market, a retail-heavy participant structure could still produce positive rates, but in reality the compounding of margin and liquidity constraints pushes the magnitude far beyond the equilibrium level. This chapter includes both kinds of deviation within its scope but flags the nature of each in the specific discussion, so as to avoid mistaking structural compensation for arbitrage failure, or downplaying genuine arbitrage failure as reasonable premium.
The crypto-market anomalies examined in this chapter differ significantly in cause from those discussed in the traditional finance literature (such as the value effect and the momentum effect). Anomalies in traditional finance are typically attributed to investors' behavioral biases (such as overconfidence or the disposition effect) or to systematic risk factors that have not been fully identified. Most of the anomalies we observe in the crypto perpetual futures market, however, have a more direct and more explanatory first-order cause in institutional frictions and infrastructure deficiencies. This is consistent with the logic of the Arbitrage Infrastructure Hypothesis (AIH) proposed in Chapter 16 (see Section 16.1.3): arbitrageurs, through their activity, provide the "infrastructure services" of connecting markets, transmitting prices, and supplying liquidity, and earn a return for doing so; the persistence of a market anomaly is direct evidence that this infrastructure network is still imperfect, has bottlenecks, or is entirely absent at certain nodes.
18.1.2 The constraint–anomaly mapping
If Chapter 17 answered "why arbitrage fails" by decomposing the seven-dimensional constraints, then the core task of this chapter is to answer, through the analysis of anomalies, a further question: what traces have arbitrage constraints left at the price level? This analytical path from constraint to anomaly inherits, methodologically, the classic framework established by Shleifer and Vishny in 1997 in "The Limits of Arbitrage" [3]. That study was the first to argue systematically how the capital constraints and principal-agent problems facing arbitrageurs allow price deviations that are theoretically correctable to persist in reality, thereby laying the foundation for the theory of limited arbitrage. This chapter's constraint–anomaly mapping extends that framework along three dimensions. First, it extends the constraints from capital and agency problems to a seven-dimensional system (covering technology, regulation, smart contracts, and other dimensions specific to crypto markets). Second, it shifts the object of analysis from the value anomalies of traditional equity markets to the price-relationship anomalies of the perpetual futures market. Third, it introduces the persistence spectrum to classify anomalies dynamically, moving beyond the static "exists vs. does not exist" dichotomy of the original framework. To establish a clear mechanistic mapping from constraint to anomaly, we propose a standardized analytical procedure, the constraint–anomaly mapping (Table 18-2). This procedure is designed to link each specific anomaly discussed in later sections to a testable attribution hypothesis involving its corresponding principal constraint from Chapter 17.
| Analytical step | Core task | Key question |
|---|---|---|
| Step 1: Phenomenon description | Precisely describe the anomaly's market, asset, time scale, deviation magnitude, and frequency | Where does the anomaly occur? What are its typical magnitude and frequency? |
| Step 2: Constraint attribution | Identify the binding dimension among the seven-dimensional constraints that corresponds to the anomaly | If that constraint were removed, would the anomaly disappear or weaken markedly? |
| Step 3: Persistence judgment | Based on the analysis of causes, judge whether the anomaly is transient, cyclical, or structural | Which class does the anomaly's temporal behavior pattern belong to? |
Table 18-2. The three-step analytical procedure of the constraint–anomaly mapping (Data source: compiled by the author)
The constraint–anomaly mapping comprises three basic steps. The first is phenomenon description: precisely describing how the anomaly manifests. In which market and on which class of assets does it occur? On what time scale can it be observed? What are the typical magnitude and frequency of its deviation? This step requires us to quantify and characterize the anomaly, forming a clear qualitative and quantitative description.
The second step is constraint attribution, the core of the mapping method. Here we must identify which one or more of the seven-dimensional constraints from Chapter 17 (margin constraints, rate-reversal risk, platform risk, execution constraints, liquidity constraints, smart-contract risk, and regulatory constraints) the anomaly primarily corresponds to. The key logic of attribution lies in answering a counterfactual question: "If this constraint (or these constraints) were substantially relaxed or removed, would this anomaly disappear or weaken markedly?" If the answer is yes, then we have formed a mechanistic explanation from that constraint to that anomaly; to claim rigorous causal identification further would require an independent data design, a natural experiment, or a structural model. For example, when we observe a persistent spread on a homogeneous asset between two different exchanges, we can judge which constraint is "binding" in the current setting—that is, which one actually limits arbitrageurs' behavior and thereby produces a residual departure from the law of one price—by analyzing whether factors such as capital controls (a regulatory constraint), differences in exchange credit ratings (platform risk), or excessive margin requirements for arbitrage (a margin constraint) are present.
Here it is necessary to distinguish clearly between two levels of argumentative strength: the "identification strategy" and "narrative attribution." A rigorous identification strategy requires a design that exogenously varies the strength of a constraint (such as a natural experiment or an instrumental variable), so that the difference in anomaly magnitude before and after the change in the constraint can be attributed cleanly to the constraint itself; narrative attribution, by contrast, is based on economic intuition, establishing a reasonable correspondence between an anomaly and the constraint most likely to be binding. Constrained by publicly available data, most attributions in this chapter are of the latter type, and we are honest about this, equipping each attribution with a falsifiable criterion: if the proxy for a constraint tightens markedly over some period (for example, margin rates are raised, borrowable inventory dries up, or cross-chain gas fees spike) while the magnitude of the corresponding anomaly does not widen accordingly—or even narrows in the opposite direction—then the attribution of that anomaly to that constraint does not hold. To convert the counterfactual from rhetoric into a testable empirical design, this chapter provides, for at least one anomaly, an actual measurement before and after a change in the constraint: in Section 18.3.3, we treat the settlement-timing effect of Hyperliquid (hourly settlement) versus traditional exchanges (every-8-hour settlement) as a natural experiment in the length of the settlement cycle, and we use a difference-in-differences logic to compare the price and volume anomalies within the settlement window under the two regimes, thereby grounding the counterfactual that "shortening the settlement cycle can mitigate cyclical anomalies" in an observable before-and-after comparison. The remaining attributions in this chapter are explicitly labeled "theoretical inference, pending empirical testing."
The third step is the persistence judgment. Based on our understanding of the anomaly's causes, we can classify its behavior pattern along the time dimension, judging whether it is a transient, cyclical, or structural anomaly. This classification is developed in detail in the next subsection; it not only reveals the stability of an anomaly but also provides important clues for understanding the market's evolution and predicting its future changes.
By systematically executing these three steps for each anomaly, we can integrate a series of seemingly isolated, disorderly market "anomalies" into a unified analytical framework in which "constraints" drive "anomalies." This framework allows us to move beyond a surface observation of anomalies and reach their institutional and architectural roots, so as to genuinely understand the operating logic of the crypto market as a complex adaptive system and the boundaries of its efficiency.
18.1.3 The anomaly persistence spectrum
According to their behavioral characteristics along the time dimension, anomalies can be placed on a "persistence spectrum." The two ends of this spectrum are, respectively, fleeting deviations and near-permanent structural features, while the middle ground consists of patterns that recur on a particular rhythm. Along this non-exclusive continuum we identify three characteristic forms: transient anomalies, cyclical anomalies, and structural anomalies (Table 18-3). These three are not mutually exclusive, hard bins but representative segments of the spectrum: the same broad category of anomaly may well fall at different positions on the spectrum in different market states or deviation directions. For example, the positive deviation of the basis anomaly in a bull market lies closer to the cyclical end (tied to the macro bull-bear cycle), whereas its negative deviation after a panic lies closer to the transient end (triggered by a crisis, but with a repair speed governed by structural frictions); likewise, the CEX–DEX spread in Section 18.7.1 has both cyclical properties (narrowing with technological progress) and structural properties (physical confirmation latency that cannot be eliminated). The value of this spectrum, therefore, lies not in pinning a unique label on each anomaly but in its predictive use for repair mechanisms: judging whether a deviation will be repaired spontaneously by arbitrage capital, reset automatically with the cycle, or eliminated only by architecture-level change. This taxonomy not only helps us understand the nature of different anomalies but also reveals their distinct repair mechanisms and market implications.
| Persistence type | Trigger mechanism | Mode of repair | Representative case |
|---|---|---|---|
| Transient anomaly | External shock event (crisis, black swan) | Spontaneous repair after arbitrage capital re-enters | Negative-basis stickiness after a panic |
| Cyclical anomaly | Endogenous institutional cycle of the market | Automatic repair at the end of each cycle, recurring in the next | The 8-hour funding-rate settlement pulse |
| Structural anomaly | Fundamental feature of the market's architecture | Eliminable only through systematic architecture-level change | Regulation-segmented pricing zones, the CEX–DEX residual |
Table 18-3. The anomaly persistence spectrum: transient, cyclical, and structural classification (Data source: compiled by the author)
(Note: the three types in the table are representative segments of the spectrum rather than mutually exclusive bins; they can overlap, are non-exclusive, and admit mixed and state-dependent anomalies; the same broad category of anomaly may fall at different positions depending on market state or deviation direction, as detailed in the main text.)
Transient anomalies are typically triggered by specific, discontinuous external events, such as a sudden market crisis, a black-swan event, or extreme volatility. In such moments, arbitrage activity is temporarily interrupted by liquidity evaporation, cascading reactions in the margin system, or information overload, causing prices to deviate sharply and significantly. The "transient" property of such anomalies, however, is that once the impact of the triggering event fades and market sentiment stabilizes, arbitrage capital re-enters the market, the price deviation begins to be repaired, and the market displays a capacity for price convergence. The existence of a transient anomaly and its repair process therefore delimit the stress ceiling of the transmission mechanism of arbitrage efficiency: they tell us at what degree of shock the market will temporarily fail, and how long it takes to recover normal function.
Cyclical anomalies, by contrast, are tightly bound to the market's endogenous, institutional cycles, displaying a recurring, fixed-rhythm character. The root cause of such anomalies is not an external shock but the market microstructure or institutional design itself. A typical example is the price fluctuation associated with the funding-rate settlement cycle. Because mainstream perpetual futures exchanges typically settle funding every 8 hours, many traders close positions en masse before the settlement moment to avoid paying a high fee, causing systematic, predictable "settlement-timing effects" in price, basis, and volume around the settlement window. The hallmark of this anomaly is that it "repairs" itself automatically at the end of each cycle (for example, price rebounds quickly after settlement completes) but inevitably reappears in the next cycle. The existence of cyclical anomalies reveals that certain market rules, while pursuing a particular objective (such as anchoring to the spot price), may inadvertently create new, predictable deviations.
Structural anomalies arise from fundamental features of the market's architecture and therefore display the strongest persistence. These features may include regulatory segmentation across jurisdictions (such as the kimchi premium caused by capital controls), structural imbalances among different types of market participants (such as persistently positive funding rates caused by retail investors' natural long bias), and even information-transmission latency dictated by the laws of physics. Unlike the first two types, structural anomalies cannot be fundamentally eliminated by the spontaneous behavior of arbitrageurs or by the calming of market sentiment. Their repair or elimination often requires fundamental change at the level of market architecture, such as the coordination of global regulation, the establishment of new market infrastructure, or the long-run evolution of the participant structure. Structural anomalies can therefore be regarded as part of the market's current "initial structural features," and their existence reveals the fundamental trade-offs and compromises that market designers make among the multiple objectives of efficiency, safety, decentralization, and compliance.
Through this persistence spectrum, we can form a deeper understanding of the eliminability of different anomalies and their implications for market design. Transient anomalies reflect the market's resilience boundary, cyclical anomalies reveal the limits of institutional design, and structural anomalies reflect the cost of architecture.
18.1.4 An overview of the six categories of anomalies
Having established the analytical framework, we can now conduct a systematic survey of the many and varied anomalies that exist in the perpetual futures market. To make the classification clearer, we organize it not by the dimension of efficiency or the type of constraint but by the "type of price relationship" the anomaly involves. That is, we focus on where a systematic deviation appears between "which price" and "which other price." On this basis, we can summarize the principal anomalies of the perpetual futures market into six broad categories (Table 18-4).
| Broad category | Price relationship of interest | Core manifestation | Primary associated constraints |
|---|---|---|---|
| Basis anomaly | Perpetual futures price vs. spot price | The basis deviates systematically from zero over the long run (positive basis in bull markets, negative-basis stickiness after panics) | Margin constraints, rate-reversal risk, liquidity constraints |
| Funding-rate anomaly | Statistical features of the funding-rate time series | Long-term positive bias, extreme-value clustering, settlement-cycle pulse | Margin constraints, liquidity constraints, participant structure |
| Cross-exchange anomaly | Prices of the same asset across different exchanges | Persistent spreads, a core-periphery gradient, regulation-segmented pricing zones | Platform risk, regulatory constraints, margin constraints |
| Cross-asset anomaly | Relative pricing among different but related crypto assets | Altcoin inefficiency zones, unstable correlations | Liquidity constraints, unstable inter-asset correlation |
| Term-structure anomaly | Pricing relationships among contracts of different maturities | Perpetual-vs.-dated-futures deviation, CME/ETF dual-track pricing | Participant segmentation, regulatory constraints, session mismatch |
| CEX–DEX anomaly | Pricing between centralized and decentralized exchanges | Persistent spreads, an ineliminable structural residual | Smart-contract risk, execution constraints |
Table 18-4. An overview of the six categories of anomalies in the perpetual futures market (Data source: compiled by the author)
These six can be named in turn as follows; their price relationships, core manifestations, and primary associated constraints appear in Table 18-4, while their respective mechanisms and empirics are left to the corresponding subsections, so this is only a navigational overview. The basis anomaly concerns the spread between perpetual futures and spot; the funding rate is supposed to anchor this to zero, yet it shows a persistent positive basis in bull markets and a sticky negative basis after panics (see Section 18.2). The funding-rate anomaly looks not at the spread but at the statistical features of the rate series itself—long-term positive bias, extreme-value clustering, and the settlement-cycle pulse (see Section 18.3). The cross-exchange anomaly tests the law of one price and manifests as residual spreads among leading exchanges, a core-periphery gradient, and even regulation-segmented pricing zones (see Section 18.4). The cross-asset anomaly concerns the relative pricing among related but different assets, typified by altcoin "inefficiency zones" and the instability of altcoins' relative pricing against major coins (see Section 18.5). The term-structure anomaly examines the pricing consistency of the same asset across different maturities or product forms, such as the implied-rate deviation between perpetual and dated futures and CME/ETF dual-track pricing (see Section 18.6). The CEX–DEX anomaly refers specifically to the spread and rate difference between centralized and decentralized exchanges, whose magnitude and duration are often the greatest of all the categories (see Section 18.7).
Together, these six categories form a picture of the efficiency distribution of the crypto perpetual futures market, in which each "deviation zone" marks a region where arbitrage forces are constrained. These six categories bear a heuristic, non-exclusive, weak correspondence to the six categories of arbitrage strategy discussed in Chapter 16: each category of anomaly corresponds, roughly, to the price deviation that some class of arbitrage activity "ought to eliminate but has not fully eliminated." This correspondence is merely a heuristic mapping convenient for organizing the analysis, not a strict causal or one-to-one relationship—it reminds us that where the arbitrage mechanism operates is often precisely where arbitrage failure may surface. At the same time, the six zones above are divided by "type of price relationship" and do not constitute a mutually exclusive and collectively exhaustive (MECE) classification; the categories are permitted to overlap: the CEX–DEX anomaly is essentially a special case of the cross-exchange anomaly (the spread between centralized and decentralized exchanges), and the term-structure anomaly partly subsumes the basis anomaly in its comparison of the implied rates of perpetual and spot. We adopt this partition for clarity of exposition, not to claim that it is logically non-overlapping. In the sections that follow, we examine each of these six categories, applying the analytical framework built in this section to describe, attribute, and analyze them in detail.
18.2 Basis anomalies
In the mechanism design of perpetual futures, the basis (the difference between the perpetual futures price and the underlying spot price) is the reference benchmark for the entire mechanism. The sole purpose of the funding rate, the core mechanism, is to pull a deviating basis back toward zero through the periodic exchange of fees between longs and shorts. In theory, in an ideally efficient market the presence of basis arbitrageurs would ensure that any significant deviation is quickly smoothed away, so that the perpetual futures price tracks spot closely and serves as its direct reflection in the derivatives market. Reality, however, is far more complex than theoretical models predict. Empirical data reveal that the basis cannot always be fully anchored; instead, in specific market cycles and stress scenarios, it exhibits systematic, state-dependent patterns of deviation. These deviations are not random noise but a deep reflection of the real constraints facing arbitrage activity. Basis anomalies delimit the effective boundary of basis arbitrage (see Section 16.4).
This section analyzes four core manifestations of the basis anomaly. We will see how the persistent positive basis of bull markets reveals an imbalance of force between speculative demand and arbitrage capital; how the sticky negative basis of panic selling exposes the difference in frictional resistance that the arbitrage mechanism faces in different directions; how the asymmetric speed of the basis's mean reversion provides quantitative evidence for this difference in friction; and, finally, how the rise of protocolized arbitrage forces, represented by Ethena, is reshaping the long-short contest that plays out continuously over the basis. Through a careful analysis of these anomalies, we can understand not only the true picture of perpetual futures pricing but also how the arbitrage constraints systematically laid out in Chapter 17 leave a persistent imprint on the dynamic evolution of market prices.
18.2.1 The persistence of positive basis in bull markets
When the market enters a bull-market cycle, a recurring phenomenon is that the perpetual futures price is systematically higher than the spot price, forming a persistent positive basis. In the crypto bull markets of late 2020 to early 2021 and of late 2023 to early 2024, this significant anomaly was observed in the perpetual futures markets of both Bitcoin and Ethereum. In these periods the basis is no longer noise fluctuating briefly around zero but has turned into a "perpetual premium" lasting weeks or even months. In this state, the funding rate stays high and positive over the long run, meaning that long traders are willing to pay high fees continuously to shorts in order to maintain their leveraged bullish positions. Accumulated, these fees can at times reach an annualized 30%–80% (the native cadence of the funding rate is settlement every 8 hours; here "annualized" is uniformly converted on a simple-interest basis of every 8 hours × 3 × 365, and likewise below; this range is the typical annualized fluctuation band of the BTC/ETH perpetual futures funding rate during the 2020–2021 bull market, data source: Coinglass), which poses a clear empirical challenge to the naive assumption of an efficient market.
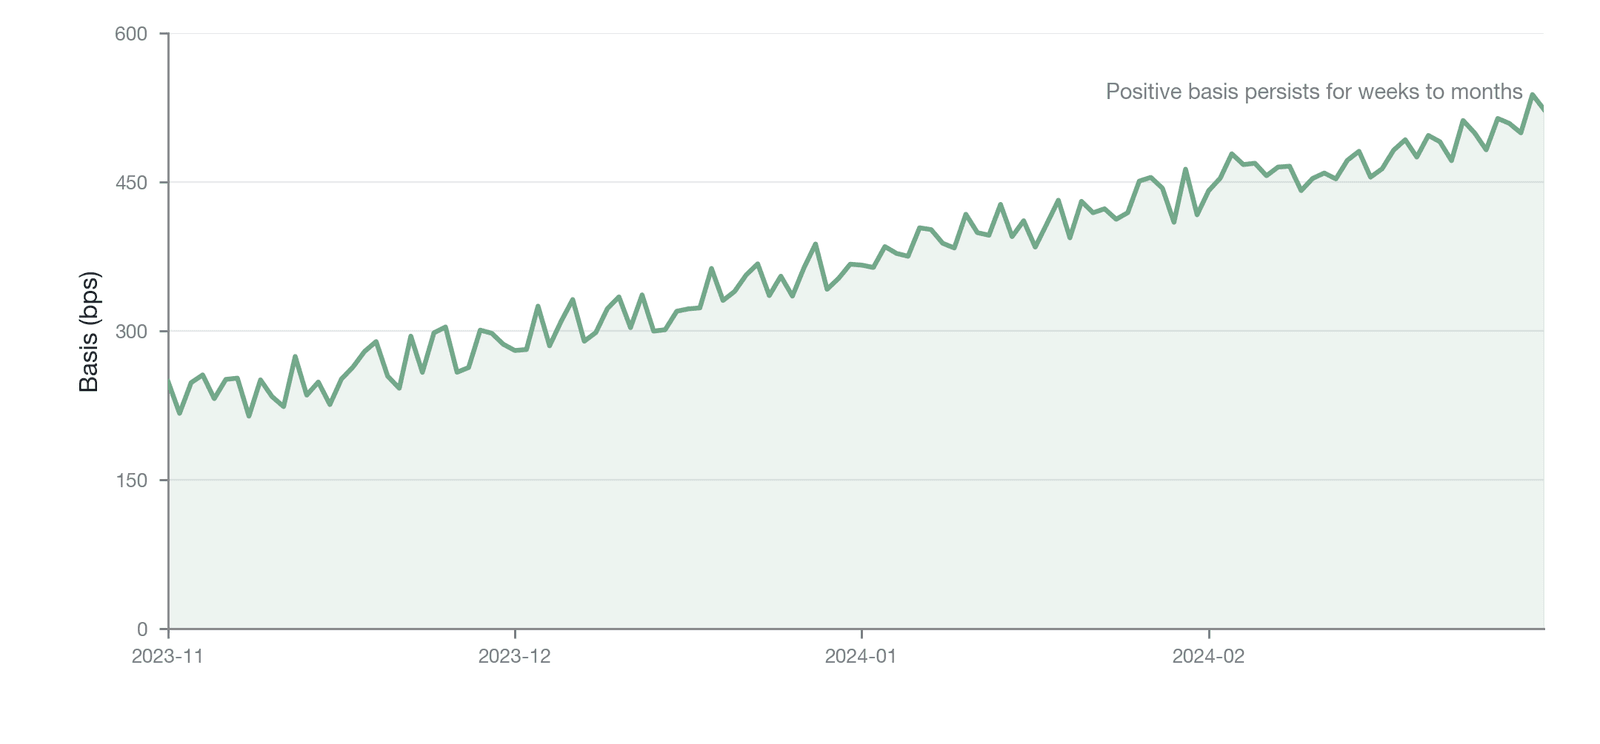
Figure 18-1. Persistent positive basis in BTC perpetual futures during a bull-market cycle (illustrative/simulated; the curve shape is reconstructed from historical Binance basis characteristics and is not a snapshot of measured basis)
Figure 18-1 shows the time-series path of the BTC perpetual futures basis over a typical bull-market cycle: the basis climbs systematically in the positive direction and remains at a high level of several hundred basis points; it does not appear intermittently but stays within a significantly positive band over a span of weeks or even months. This persistence far exceeds what transaction costs can explain and constitutes the core anomaly analyzed in this section.
This phenomenon poses a puzzle. According to the logic of basis arbitrage described in Section 16.4, when a significant positive basis appears, arbitrageurs have a strong incentive to "sell the perpetual futures while buying an equal amount of spot." This action, while earning the profit from basis convergence, exerts selling pressure on the perpetual futures market and buying pressure on the spot market, which together compress the positive basis back toward zero. In reality, however, despite the obvious arbitrage opportunity, a large positive basis stubbornly persists. This is not because arbitrageurs fail to see the opportunity but because their arbitrage capacity is constrained by reality.
The constraint attribution for this phenomenon points primarily to two levels. The first is the margin constraint (Constraint I). Driven by the excessive optimism of a bull market, a large number of speculators, especially retail investors, pour into the market to build leveraged long positions. This vast, one-directional leverage demand is the main force pushing the basis higher. Yet for a basis arbitrageur to play the role of a "market-stabilizing function" by shorting the perpetual futures also requires posting substantial margin. As the market price rises, the maintenance margin requirement on the short position grows ever higher, sharply limiting the scale of capital the arbitrageur can deploy. As Zhivkov's (2026) research shows, many theoretically available arbitrage opportunities cannot be executed in full because of margin limits [2]. This constraint is further amplified by exchanges' tiered margin regimes: on Binance, for example, the maintenance margin rate increases with position size, so large-scale basis arbitrageurs face margin requirements disproportionately higher than those of small-scale speculators, worsening the arbitrageurs' effective capital efficiency and thereby aggravating the asymmetry between arbitrage capital and speculative demand. Relative to speculative demand, arbitrage capital appears markedly insufficient.
The second, deeper reason is that directional speculative demand overwhelms arbitrage supply by an order of magnitude. During a bull market, the dominant market narrative is governed by bullish sentiment, and newly entering capital naturally tends to go long. The scale of these inflows far exceeds anything that market-neutral arbitrage funds can match. The market thus reaches a new "equilibrium": the basis is pushed to a level wide enough that arbitrageurs judge it worthwhile to bear the various risks and costs of managing a short position (such as margin pressure and the risk of forced liquidation) in order to earn the premium. This premium is essentially a risk premium that directional longs pay to shorts in exchange for leverage, and its price is set by the supply and demand of both sides. This confirms precisely the core prediction of the AIH proposed in Chapter 16: arbitrage returns are the infrastructure risk premium earned for providing the market with scarce risk-hedging capacity. The persistence of a positive basis is not a simple static supply-demand imbalance but a dynamic process with reflexive characteristics. A positive basis produces a positive funding rate; the positive funding rate attracts more short arbitrage capital through the "earn-the-rate" narrative; the increase in short supply depresses the basis in the short run but also provides longs with more abundant leverage counterparties, which may further stimulate long demand. This positive feedback loop gives the bull-market positive basis a self-reinforcing character, until an external shock (such as a macro turn or a leverage liquidation cascade) breaks the loop. A persistent positive basis can therefore be understood as a cyclical anomaly, tightly bound to the macro bull-bear cycle, that converges of its own accord once market sentiment cools and leverage demand declines.
18.2.2 The stickiness of negative basis after panics
Corresponding to the persistent positive basis of bull markets, the market displays another form of basis anomaly when it encounters an extreme panic event: the emergence of a deep negative basis and its slow, "sticky" repair. In several landmark crashes in crypto-market history—such as the LUNA/UST collapse of May 2022 [4] and the bankruptcy of the FTX exchange in November 2022—we observed the perpetual futures price fall sharply within a short time to far below the spot price, forming a negative basis of more than −500 bps or even deeper. The most notable feature of this anomaly, however, is not its depth but the length and difficulty of its repair. The collapse of the basis may be completed within a few hours, but its return from a deeply negative value to near zero often takes weeks or longer.
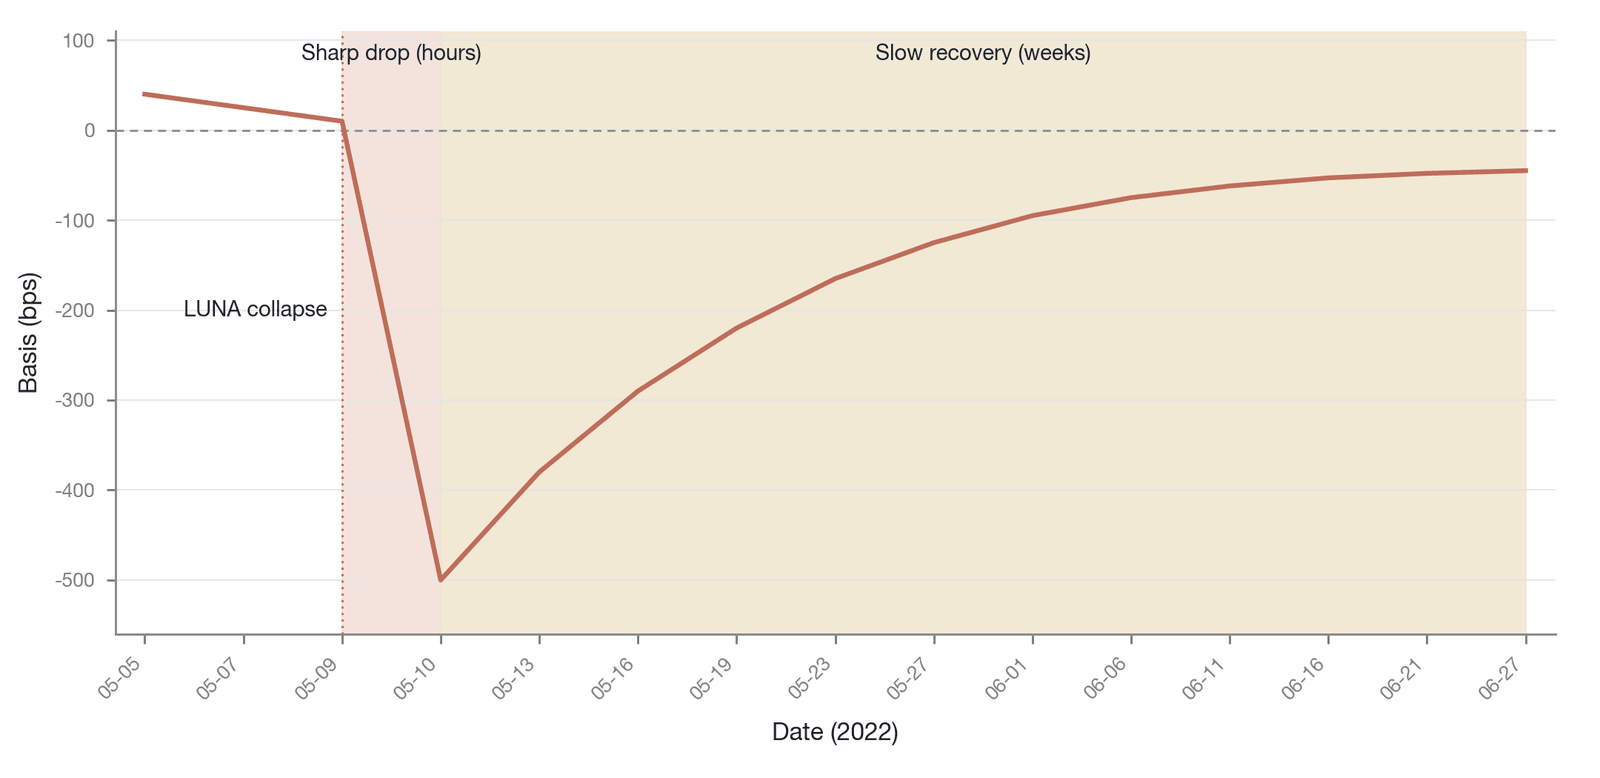
Figure 18-2. The formation and repair curve of the negative basis after a panic event (the LUNA/UST crisis of May 2022; illustrative/simulated, with the curve shape reconstructed from historical basis characteristics and not a measured snapshot; the trough of about −500 bps occurs on May 10, consistent with the reading in Figure 18-16)
Figure 18-2 depicts the complete process of the negative basis from formation to repair: the left half of the curve descends steeply, with the basis plunging from near zero to −500 bps or deeper within a few hours; the right half rises slowly and concavely, taking weeks to return to near zero. This asymmetric "sharp fall, slow repair" shape reveals the stark difference in the operating efficiency of the arbitrage mechanism in the positive versus the negative direction.
This pronounced asymmetry in repair speed reveals the difference in frictional resistance the arbitrage mechanism faces when responding to positive versus negative basis. When the market shows a positive basis, arbitrageurs execute a "short perpetual + buy spot" strategy. This is relatively simple, because buying a spot asset (such as BTC or ETH) has low execution friction and liquidity is usually ample. When the market turns to a negative basis, however, arbitrageurs must execute the opposite: "long perpetual + short spot." The key bottleneck here is "shorting spot." In crypto markets, shorting spot at scale generally requires borrowing the relevant asset through a lending platform and then selling it. This process faces markedly higher friction. First, borrowing the coin carries an interest cost. Second, during a market panic when liquidity evaporates, the quantity of assets available to borrow (the available inventory) shrinks sharply and borrowing costs may spike. Finally, the spot-shorting function of some centralized exchanges is itself limited or underdeveloped. Together, these factors make the feasible scale and execution efficiency of negative-basis arbitrage far lower than those of positive-basis arbitrage.
It is precisely this asymmetry in arbitrage friction that makes a positive basis easier for arbitrage forces to compress than a negative basis, so that a negative basis, once formed, exhibits stronger "stickiness." The path to price repair thus becomes exceptionally slow. Beyond the asymmetry of arbitrage friction on the supply side, behavioral factors on the demand side are also an important cause of negative-basis stickiness. After a panic event that inflicts extreme losses, retail investors' loss aversion and recency bias lead them to refuse to re-enter and build long positions for a considerable time, producing a "long vacuum" in the market: even if the cost of shorting spot falls, there are not enough long counterparties to drive the basis back. This demand-side stickiness may be even more important than supply-side shorting friction in the early stage after a crisis. Moreover, this phenomenon overlaps with the mechanism of "the asymmetry of recovery after risk resonance" described in Section 17.9.4. During an extreme market panic, many arbitrageurs may themselves suffer losses from violent price swings and have their positions forcibly liquidated, eroding their capital base. At the same time, extreme market uncertainty lowers their risk appetite, making them more hesitant and cautious about redeploying capital into arbitrage. The erosion of capital and the blow to confidence further intensify the already friction-limited arbitrage forces, prolonging the repair of the negative basis still further.
The deep negative basis therefore belongs, on the persistence spectrum, to a mixed / state-dependent anomaly: it is triggered by a specific crisis event (giving it the origin of a transient anomaly), but its repair speed is governed by structural frictions (the asymmetry of the spot-shorting mechanism, the long vacuum, and the erosion of arbitrage capital), so that it displays a repair duration far exceeding that of an ordinary transient shock. This is consistent with the note in Section 18.1.3 that "transient refers to the trigger mechanism, not the repair duration"—simply classifying it as a purely transient anomaly would obscure the structural component of its repair. Its core feature lies not merely in the instantaneous price deviation but in the long repair process that follows. This long tail reflects not only the lasting impact of the market shock but also, clearly, the limitations that the arbitrage mechanism displays under stress because of its inherent structural asymmetry of friction.
18.2.3 The asymmetric mean reversion of the basis
The differing behavior of the bull-market positive basis and the bear-market negative basis described above intuitively suggests that the basis's return toward its equilibrium level (zero) may be asymmetric. To verify and quantify this feature more rigorously, we can use econometric models—such as the threshold autoregressive model or the Markov regime-switching model—to analyze the perpetual futures basis time series of major assets such as BTC and ETH. The core idea of such models is to allow the speed of mean reversion to differ when the basis is in different states (for example, a positive or a negative deviation). By separately estimating the autoregressive coefficients of the basis in the positive and negative regimes, we can compute their respective "half-lives," the time required for a deviation to be reduced by half.
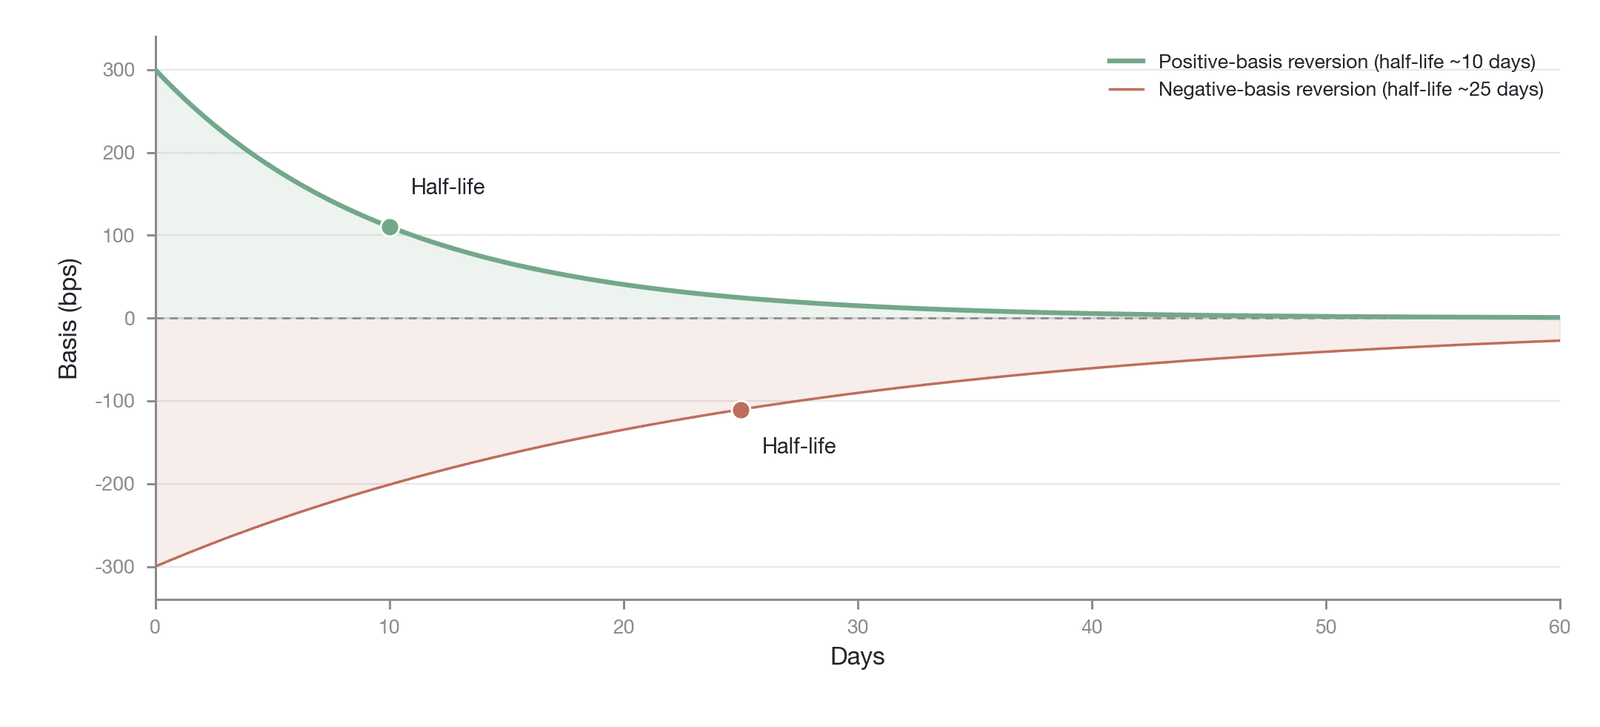
Figure 18-3. The asymmetric mean-reversion feature of the BTC perpetual futures basis (Data source: illustrative analysis constructed by the author)
Figure 18-3 visualizes the asymmetric feature of the basis's mean reversion from an econometric perspective: in the positive-basis regime the autoregressive coefficient is smaller, corresponding to a shorter half-life (faster repair), whereas in the negative-basis regime the coefficient is markedly larger and the half-life longer (slower repair). Figure 18-3 is an illustrative analysis (constructed by the author): its purpose is to illustrate conceptually the systematic difference that may exist between the two regimes in the speed of reversion and to point to a testable hypothesis direction for the qualitative analysis of the asymmetry of arbitrage friction in the previous subsection, rather than to serve as a completed empirical measurement; a rigorous test of this hypothesis awaits the fitting of a threshold autoregressive or regime-switching model to a real basis series.
To illustrate the magnitude of this asymmetry intuitively, we construct an illustrative numerical scenario. The half-life of a positive basis is markedly shorter than that of a negative basis. In other words, when the perpetual futures price is above the spot price, the deviation is corrected faster than when the perpetual futures price is below the spot price. For example, a positive basis of +300 bps might on average take only 10 days to return to +150 bps, whereas a negative basis of −300 bps might take 25 days or longer to repair to −150 bps (the figures above are illustrative order-of-magnitude estimates, intended to convey the directional difference rather than a precise empirical measurement; the specific half-life estimates depend on the sample period, the asset class, and the model specification). This difference is significant not only statistically but also economically, because it directly reflects the difference in the efficiency of arbitrage activity.
This asymmetry of mean reversion provides strong quantitative evidence for the "asymmetry of arbitrage constraints" discussed in the previous subsection. It arises not from traders' irrationality or behavioral biases but directly from the asymmetry of the arbitrage infrastructure and market microstructure. As we have analyzed, the execution friction and cost of the arbitrage operation that eliminates a positive basis (short perpetual, long spot) are systematically lower than those of the operation that eliminates a negative basis (long perpetual, short spot). The former requires only buying and selling in the liquid perpetual and spot markets, whereas the latter is additionally subject to the availability, cost, and risk of the spot lending market. Lower friction means faster arbitrage execution and greater arbitrage capacity, and hence a faster speed of price convergence.
The asymmetric mean reversion of the basis can therefore be regarded as a direct manifestation, in time-series dynamics, of market-microstructure constraints. It tells us that the market's repair capacity is not balanced across directions. Understanding this directly affects risk management and the design of trading strategies. For example, a strategy that relies on basis reversion needs a longer holding period and greater risk tolerance when facing a negative basis. It also offers a lesson for market designers: improving the spot market's shorting mechanism and lowering the cost and friction of shorting play a key role in raising the market's overall efficiency and resilience.
18.2.4 The Ethena effect and protocolized arbitrage
In 2024, a protocol called Ethena rose at remarkable speed, introducing a new variable into the evolution of the basis anomaly. Ethena's core mechanism is essentially the protocolization and scaling of the traditional basis-arbitrage strategy. By absorbing the stablecoins or liquid staking tokens (such as the stETH issued by the Lido protocol) that users deposit, it builds large-scale short perpetual futures positions on centralized exchanges while holding an equal amount of spot long positions (or equivalent staking derivatives), thereby systematically capturing the persistent positive basis and high funding rates of bull markets. This model was explored preliminarily in Section 16.4.3; here we are more concerned with the effect on the market-wide basis anomaly when this arbitrage behavior evolves from the operation of a few professional trading firms into a decentralized protocol managing assets worth billions of dollars.
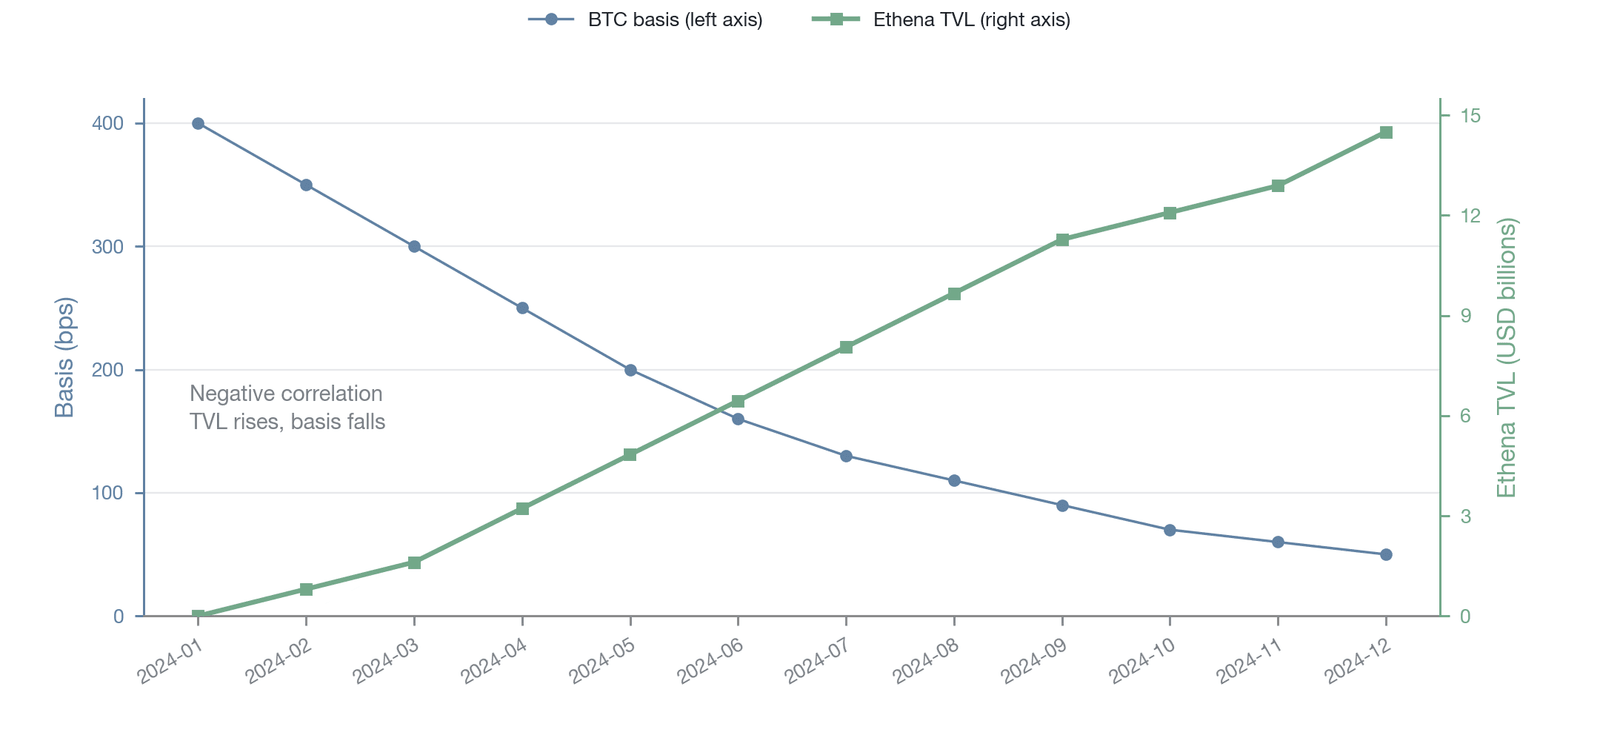
Figure 18-4. The relationship between the growth of Ethena protocol TVL and the BTC perpetual futures basis (Data source: Ethena protocol public TVL data and Binance BTCUSDT perpetual futures basis data)
Figure 18-4 places the growth path of the Ethena protocol's total value locked (TVL) alongside the level of the BTC perpetual futures basis over the same period on a single time axis: the two series are negatively correlated to some degree—as Ethena's TVL grew rapidly in 2024, both the mean and the peak of the BTC perpetual futures positive basis showed observable declines. This co-movement provides preliminary time-series evidence for the hypothesis that "protocolized arbitrage compresses the basis," although correlation does not equal causation, and more rigorous econometric testing is still needed to rule out the influence of confounding factors.
The most direct hypothesis is that Ethena's emergence, by providing an unprecedented, sustained, large-scale supply of short positions, is systematically compressing the positive basis of bull markets. Before Ethena, as described in Section 18.2.1, the persistence of a positive basis was largely due to a severe shortfall in arbitrageurs' short supply relative to speculative long demand. Through its protocolized approach, Ethena greatly pools and amplifies the market's arbitrage capital, becoming a "large-scale short supplier" that cannot be ignored in the perpetual futures market. We can test this hypothesis preliminarily by comparing Ethena's 2024 TVL growth curve with the contemporaneous levels of the BTC and ETH perpetual futures basis in a time-series analysis. If the data show that, as Ethena's TVL grew rapidly, the average level of the perpetual futures basis and funding rate on mainstream exchanges declined observably and statistically significantly, or that their volatility was effectively suppressed, this would be strong evidence that "the anomaly is being eliminated by technological innovation."
The Ethena effect, however, cuts both ways. While it may weaken the "cyclical anomaly" of the bull-market positive basis, its sheer size also introduces new, potential risks into the market. Ethena's stable operation depends heavily on a macro environment of persistently positive funding rates. Should the market turn bearish sharply and produce sustained, deep negative funding rates, Ethena's return model would face a severe test. If the protocol were to suffer large-scale user redemptions as a result, it would be forced to close out its enormous short perpetual futures positions in the market. Such large-scale unwinding would itself deliver a severe shock to the market, potentially pushing the basis to an unprecedented extreme negative value within a short time and thereby creating a new type of "transient anomaly" ignited by the ebbing of protocolized arbitrage.
This potential new risk deserves attention. Ethena's positions are spread across multiple centralized exchanges such as Binance, OKX, Bybit, and Deribit, but the risk-mitigating effect of this diversification depends on the share of its positions at each host exchange: if Ethena's BTC short perpetual position accounts for a significant fraction of an exchange's total open interest, then even "diversification" could cause a destructive order-book shock at the level of a single exchange. Moreover, whether the Ethena protocol's redemption mechanism includes redemption gating or a circuit breaker under stress will directly affect the temporal distribution of forced liquidations: orderly, gated redemptions can spread the shock over several days, whereas ungated, run-like redemptions could release all the unwinding pressure within a few hours. The broader significance of the Ethena effect for the evolution of the basis anomaly is discussed further in Section 18.9.
18.3 Funding-rate anomalies
The funding-rate mechanism is the core institutional innovation that allows the perpetual futures instrument to differ from traditional dated futures and to remain tightly anchored to the spot price. In theory, by transferring payments between longs and shorts, it dynamically adjusts the relative attractiveness of the perpetual futures and thereby drives the basis (the difference between the perpetual futures price and the spot price) toward zero. In a fully efficient market with fully rational participants, the funding rate should reflect only the instantaneous imbalance of long and short forces at a given moment; its time series should fluctuate randomly around zero and contain no predictable systematic pattern or persistent bias. When we analyze real-world funding-rate data closely, however, a far more complex pattern emerges. The data reveal at least four significant systematic anomalies that, far from being eliminated by arbitrage activity, persist. These anomalies reflect the constraint boundaries that arbitrage activity faces in the real world and reveal the flaws endogenous to the perpetual futures market at the level of institutional design, as well as the deep asymmetries in its participant structure.
18.3.1 Long-term positive bias and structural risk compensation
The funding-rate anomaly with the largest statistical deviation is its long-run positive bias. A long-horizon observation (for example, over several years) of the perpetual futures funding rate of major crypto assets such as Bitcoin and Ethereum reveals a significantly positive mean. This means that, for the overwhelming majority of the time, it is holders of long positions who pay fees to shorts, not the reverse. This systematic direction of payment makes shorting the perpetual futures and collecting the funding rate an attractive "arbitrage" strategy. In economic substance, this strategy is the crypto-market version of the carry trade: an arbitrageur earns the "carry" return of the funding rate by holding a short perpetual futures position, a strategy highly analogous to carry trades in foreign-exchange and commodity markets [5]. As some academic studies have noted, the strategy can generate substantial returns with high Sharpe ratios over particular sample periods. He et al. [6] report annualized Sharpe ratios of about 1.8 (under retail fee conditions) to 3.5 (under market-maker zero-fee conditions) in their 2020–2022 sample, but these figures are upper-bound estimates based on idealized assumptions and do not deduct the capital-occupancy cost of cross-exchange margin or the inventory risk during periods when the rate sign reverses. In terms of the statistical distribution, positive rates occur far more frequently than negative rates, the center of mass of the entire rate distribution is clearly offset from zero, and a distinct positive shift is evident. Public data (data source: Coinglass) show that, in an observation sample dominated by 2020–2024, the long-run mean share of positive-rate days is about 75%, far above the 50% that would obtain in the ideal case. This statistic is markedly cycle-dependent, however: in the bull-market-dominated subsample of 2020–2021 the share of positive rates is higher, whereas in the bear-market phase from 2022 to early 2023 the frequency of negative rates rises significantly and the share of positive rates can fall below 60%. The figure of 75% should therefore be understood as a long-run mean across cycles, not a steady-state constant that holds within any given time window.
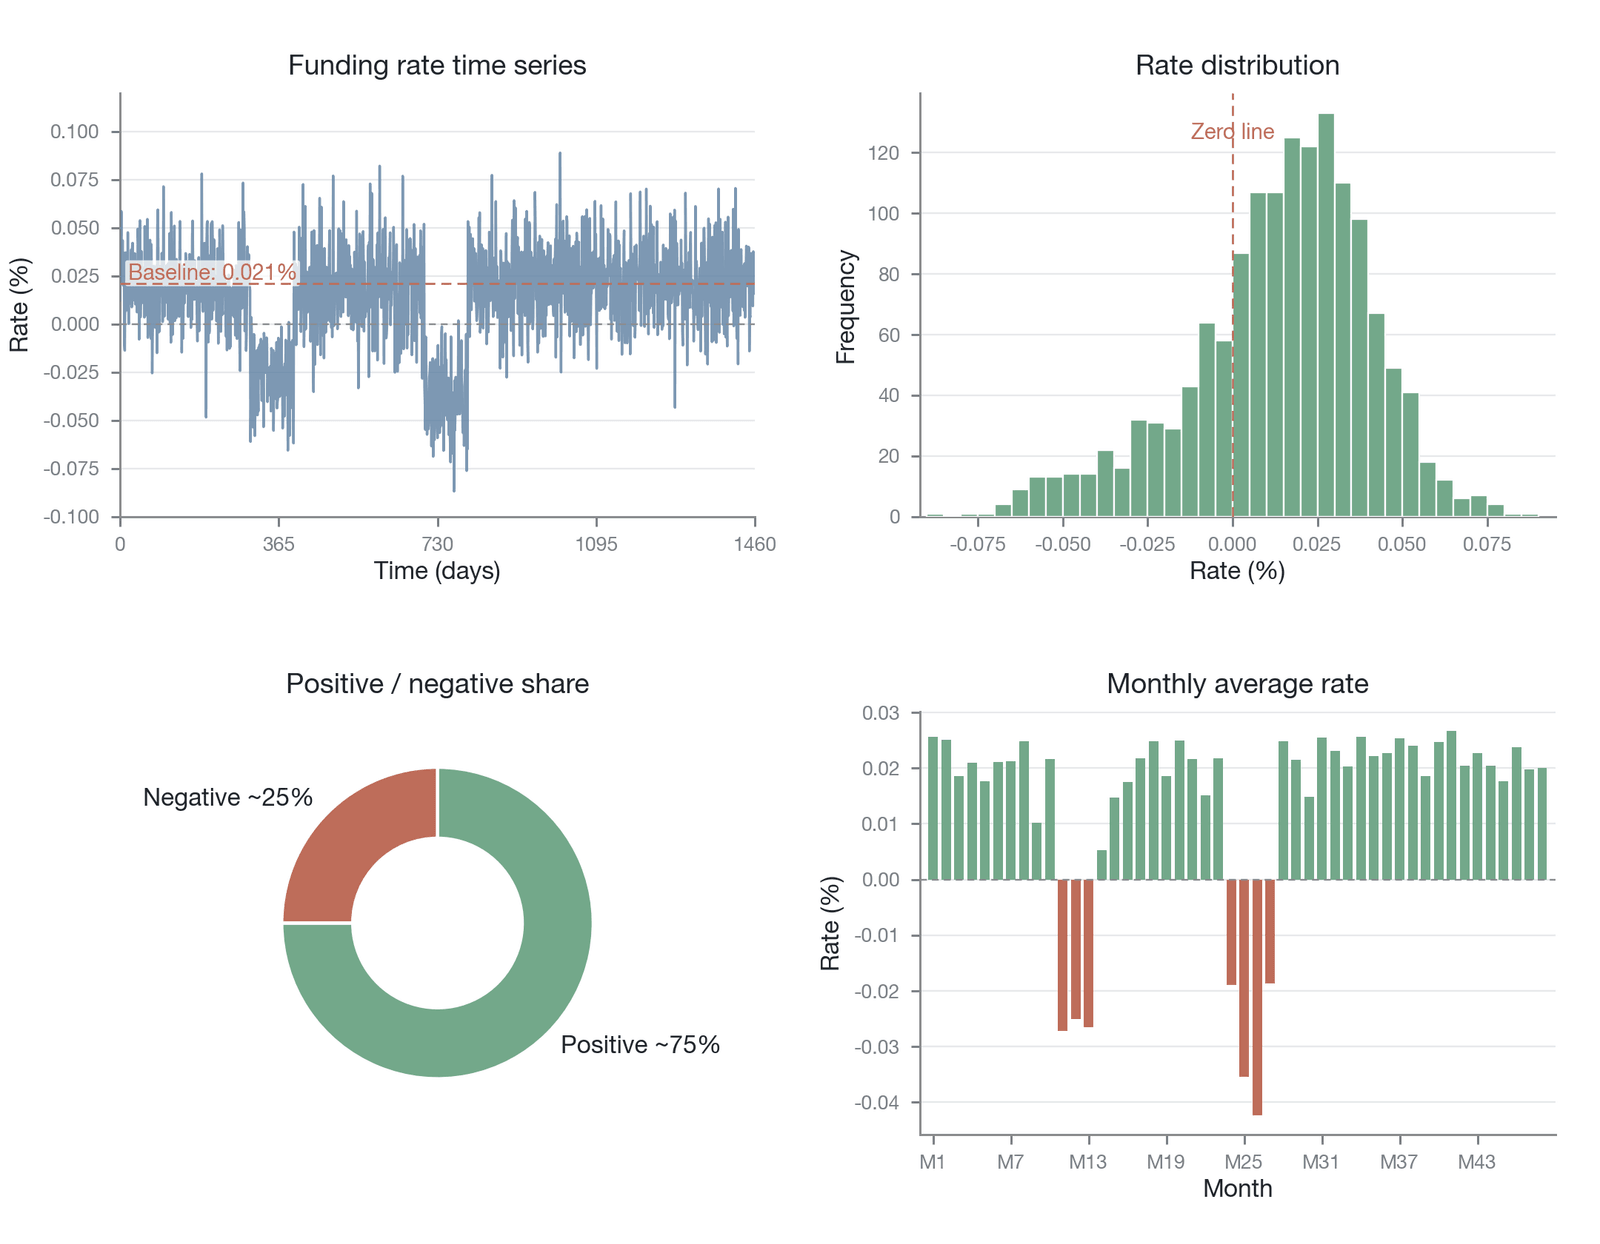
Figure 18-5. The long-term positive-bias distribution of the BTC perpetual futures funding rate (illustrative/simulated, with synthetic-sample data whose shape is based on historical characteristics; the mean line of 0.021% in the figure is a positive-normal benchmark rather than an empirical mean, and the positive/negative rate shares are statistics from this synthetic sample—empirically, per Coinglass, the funding rate is positive about 75% of the time over the long run)
Figure 18-5 shows the statistical distribution and time-series features of the BTC perpetual futures funding rate over a long horizon: the center of mass of the distribution is clearly offset from zero, the probability density in the positive-rate region is far greater than in the negative-rate region, and over time the rate stays in positive territory for long stretches, turning negative only briefly during a few extreme events. This systematic asymmetry in the distribution confirms that the funding rate does not fluctuate randomly and symmetrically around zero but exhibits a positive shift maintained by structural forces.
The root of this phenomenon can be traced to a deep asymmetry in the structure of crypto-market participants. Unlike traditional financial markets, the crypto market's participant base is composed to a considerable extent of retail investors and long-term holders. This group is naturally inclined to hold or go long on crypto assets, whether because they view buying crypto as a long-term value investment or because they are driven by the market's dominant bullish narrative. At the same time, for many non-professional participants, shorting carries a higher barrier both cognitively and in terms of tool availability. This natural long bias means that demand for leveraged longs systematically and structurally exceeds demand for shorts. To balance the market, there must be a profitable supply of shorts to match this excess long demand. A persistently positive funding rate is precisely the market mechanism that attracts and compensates these short suppliers. Short holders bear the risk of moving against the market's long-run upward trend; in a bull market especially, shorting the perpetual futures may entail unrealized losses and margin pressure from rising prices. The positive funding rate can therefore be regarded as the structural risk compensation the market pays to shorts for the scarce short liquidity they provide and the contrarian risk they bear.
From the perspective of Chapter 17's constraint dimensions, the formation of the long-term positive bias originates in a causal chain from participant structure to capital constraints. The retail-dominated participant structure is the starting point of this chain: the naturally long-biased retail base of the crypto market gives long demand extremely high "stickiness," so that even as the funding rate rises, longs are less willing to exit than shorts are to enter. This structural demand asymmetry transmits to the margin constraint (Dimension I): in a bull market, for arbitrageurs to expand their short scale and depress the funding rate requires posting more margin, but the total capital in the market is relatively limited, so arbitrageurs cannot increase their short scale without bound. The binding of the margin constraint is in turn amplified by the liquidity constraint (Dimension V): on some assets, short liquidity is itself relatively scarce, limiting arbitrageurs' ability to supply shorts and making the rate deviation harder to repair.
Applying the classification framework established in Section 18.1.1, the long-term positive bias of the funding rate should be characterized as an equilibrium deviation rather than a pure anomaly. The core logic is that, even in a hypothetical frictionless market, as long as the participant structure remains retail-heavy, the risk compensation that longs pay to shorts in exchange for leverage exposure will still exist in the form of a positive rate. This bears a structural analogy to the "convenience yield" of traditional commodity futures markets: shorts bear the contrarian risk of moving against the market's long-run upward trend, and a positive funding rate is the reasonable economic compensation for this scarce supply of short liquidity. In reality, however, the compounding of margin and liquidity constraints amplifies the magnitude of this equilibrium deviation far beyond its "fair" level. The existence of the long-term positive bias therefore proves two things at once: the fundamental asymmetry of the market's participant structure, and the significant amplifying effect of arbitrage constraints on that asymmetry. Further analysis shows that the long-term positive bias can be decomposed into two components: a structural baseline determined by the asymmetry of the participant structure (tending to be positive in any macro environment), and a cyclical overlay component tightly linked to the global dollar-liquidity cycle. During periods of Fed balance-sheet expansion and rising global risk appetite, speculative long demand is amplified and the positive bias widens significantly; during tightening cycles (such as 2022–2023), the cyclical component turns negative and partly offsets the structural baseline, causing the positive bias to narrow or even briefly turn negative. Understanding this two-factor structure is essential for judging how much of the funding-rate level in any given period is "equilibrium compensation" and how much is "constraint amplification."
18.3.2 The clustering effect of extreme values
The second significant funding-rate anomaly lies in the distribution pattern of its extreme values. In standard financial models, extreme events (or "tail events") are typically assumed to be independently and identically distributed (i.i.d.), meaning that the occurrence of one extreme rate should not affect the probability of the next. Empirical data present a starkly different result, however: the extreme values of the funding rate (whether extremely high positive values or extremely low negative values, for example an absolute value exceeding 0.1% per 8 hours) are not uniformly and randomly distributed along the time axis but display a pronounced "clustering effect." This means that the occurrence of one extreme-rate event often signals a high probability that one or more extreme values will appear again in the near term, forming a period of violent rate fluctuation. This phenomenon closely resembles the well-known "volatility clustering" feature of financial markets, in which high-volatility periods and low-volatility periods each appear in clusters. In principle, this clustering effect can be characterized and quantified by conducting a formal conditional-heteroskedasticity test on the funding-rate time series using the GARCH family of models (such as EGARCH or GJR-GARCH), but this chapter does not formally estimate it; systematic GARCH analysis of the special series that is the funding rate remains insufficient in the existing literature, and the relevant conditional-variance significance tests are left to dedicated empirical research. Here it is necessary to distinguish two related but different forms of clustering: clustering of the rate level (a persistent deviation of the mean after an extreme value appears) and clustering of the rate's volatility (a persistent amplification of the variance after an extreme value appears); the former points to a persistent shift in the mean, the latter to a persistent amplification of uncertainty, and the two have different policy implications.
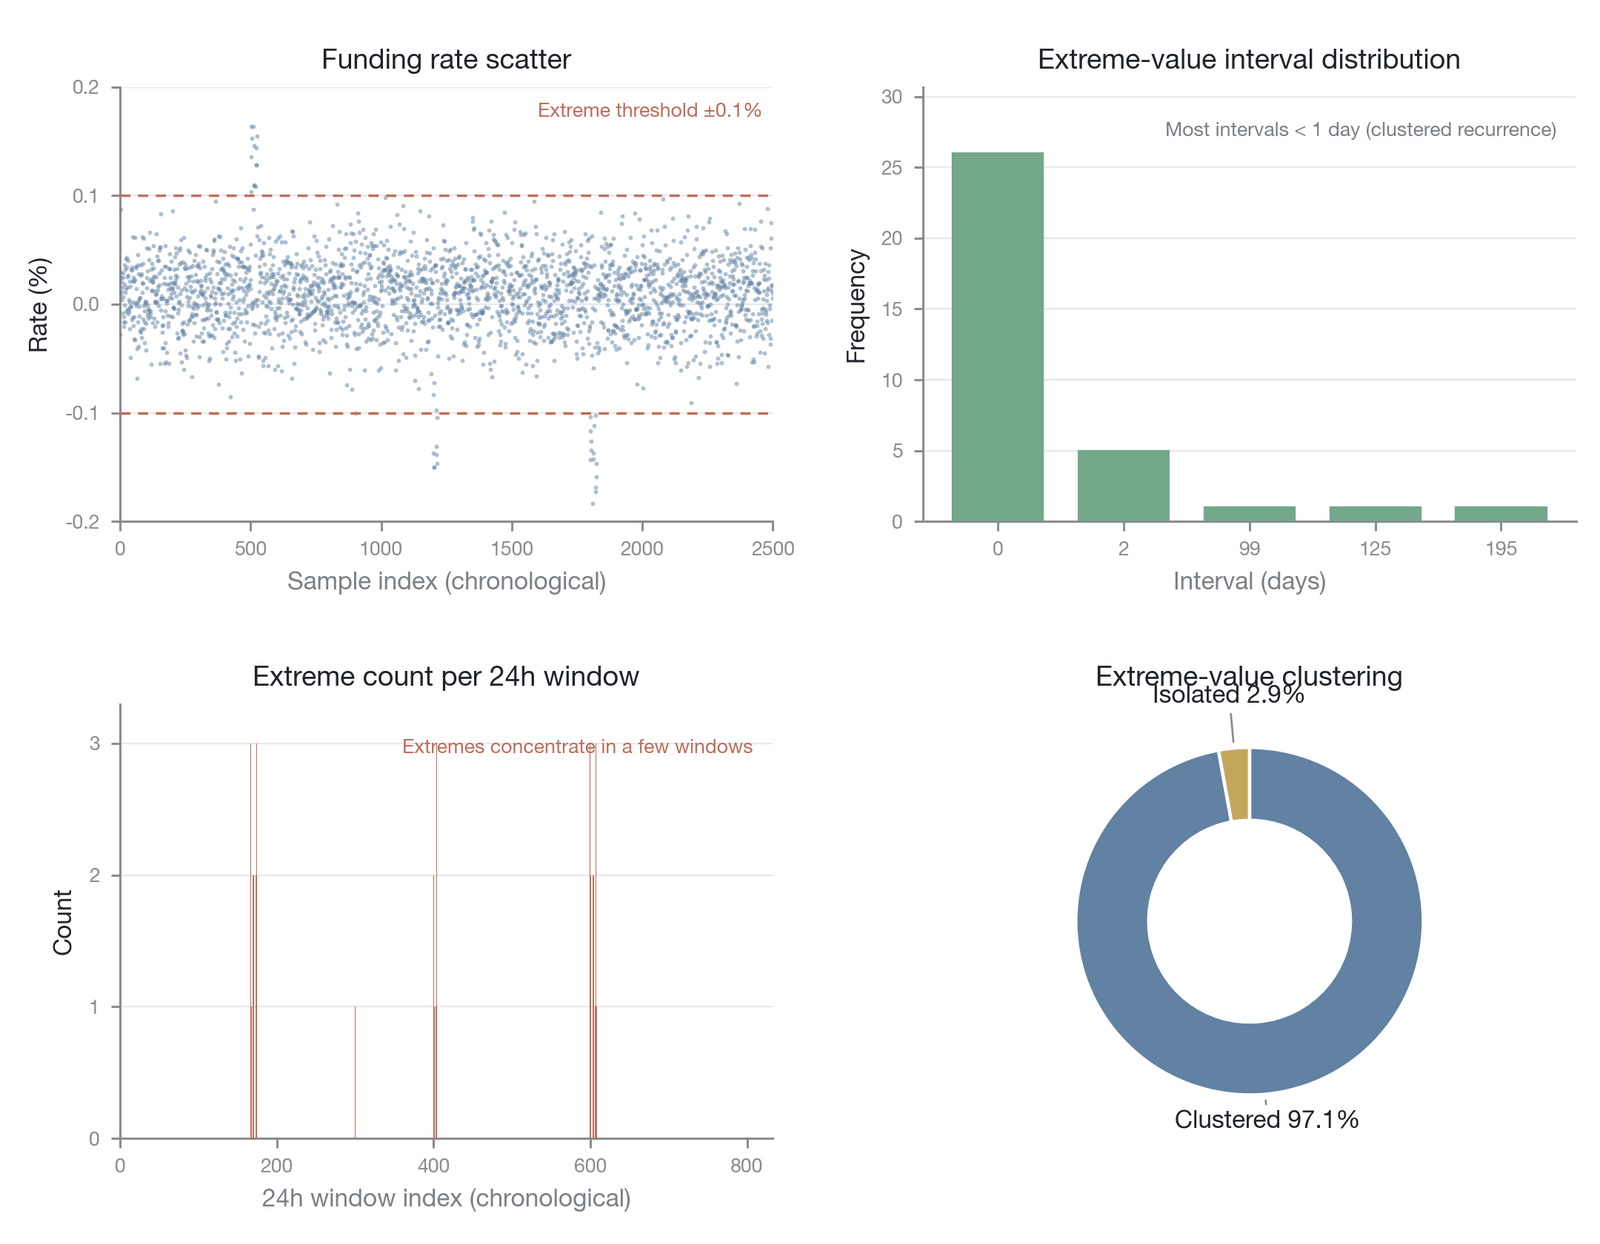
Figure 18-6. The temporal clustering effect of extreme funding-rate values (illustrative/simulated, with a synthetic-sample series whose clustering shares are actually computed from that sample rather than measured point values; an extreme value is defined as an absolute value exceeding 0.1%/8h)
By marking the extreme-value events in the funding-rate time series, Figure 18-6 shows their non-uniform distribution along the time axis: extreme values (whether positive or negative) are not scattered randomly but concentrate within several dense "burst windows," between which lie long periods of calm. This "clustered" pattern manifests statistically as significant positive autocorrelation among the extreme values, bearing a strong structural resemblance to the well-known volatility-clustering phenomenon of financial markets.
This clustering of extreme values is not a chance statistical coincidence but a direct manifestation, in the funding rate, of the market's internal risk-transmission mechanism. It maps onto the risk-resonance mechanism examined in Chapter 17. When the market encounters an external shock (for example, major macro news, an exploit of a protocol, or an abrupt change in regulatory policy) that drives a violent one-directional price move, the basis widens rapidly and produces an extreme funding rate. In a price crash, for example, mass selling drives the perpetual futures price far below spot, turning the funding rate extremely negative. At this point, basis arbitrageurs ought to enter to correct the spread by going long perpetual and short spot. In an extreme market environment, however, these arbitrageurs themselves face substantial risk. On one hand, violent price swings may directly trigger the forced liquidation of their positions, eroding their capital and weakening the market's overall arbitrage capacity. On the other hand, even if not liquidated, arbitrageurs may voluntarily reduce their positions and temporarily exit the market because their risk exposure expands sharply or their perception of counterparty risk rises. This "temporary decline" in arbitrage forces leaves the initial extreme rate uncorrected and may even amplify it further in a positive feedback loop.
The appearance of an extreme rate is itself a signal that the market's arbitrage capacity has reached a critical point under stress. Once the arbitrage mechanism is constrained, the market enters an unstable state in which any subsequent minor disturbance can easily push the rate to an extreme again. This "positive feedback of risk" mechanism explains why extreme values cluster. During a highly unstable period, several small shocks may arrive in succession within a short time, and each is amplified by the weakened arbitrage capacity, producing a chain of extreme-rate events. In terms of constraint dimensions, extreme-value clustering primarily maps onto the risk-resonance mechanism of Chapter 17 (especially the resonance involving margin, execution, and liquidity constraints). In a crisis, these constraints tighten simultaneously, the space for arbitrageurs to act is severely compressed, and the market loses its main stabilizing force. Extreme-value clustering is therefore, in essence, observable evidence that the arbitrage infrastructure temporarily fails under great stress and that the anomaly self-reinforces during the failure. This anomaly is a typical transient anomaly: triggered by a specific crisis event, it gradually dissipates once arbitrage capital recovers and market sentiment stabilizes, and its degree of clustering and duration become an important gauge of market resilience.
18.3.3 The settlement-cycle effect
Unlike the anomalies driven by market structure or crisis described above, the third category arises from the most central institutional design of perpetual futures itself: the discrete settlement cycle of the funding rate. On most mainstream centralized exchanges (such as Binance and OKX), funding is not paid continuously but is settled at fixed points in time, most commonly every 8 hours (for example, at 00:00, 08:00, and 16:00 UTC). This discrete settlement mechanism creates an artificial, predictable settlement-cycle effect in the market. Specifically, within the calculation window before funding settlement (on Binance, for example, the premium index is computed from the time-weighted average price over the 30 minutes before settlement, sampling the difference between the mark price and the index price each minute), the price, basis, volume, and even the funding rate of the perpetual futures all display systematic, regular fluctuation patterns.
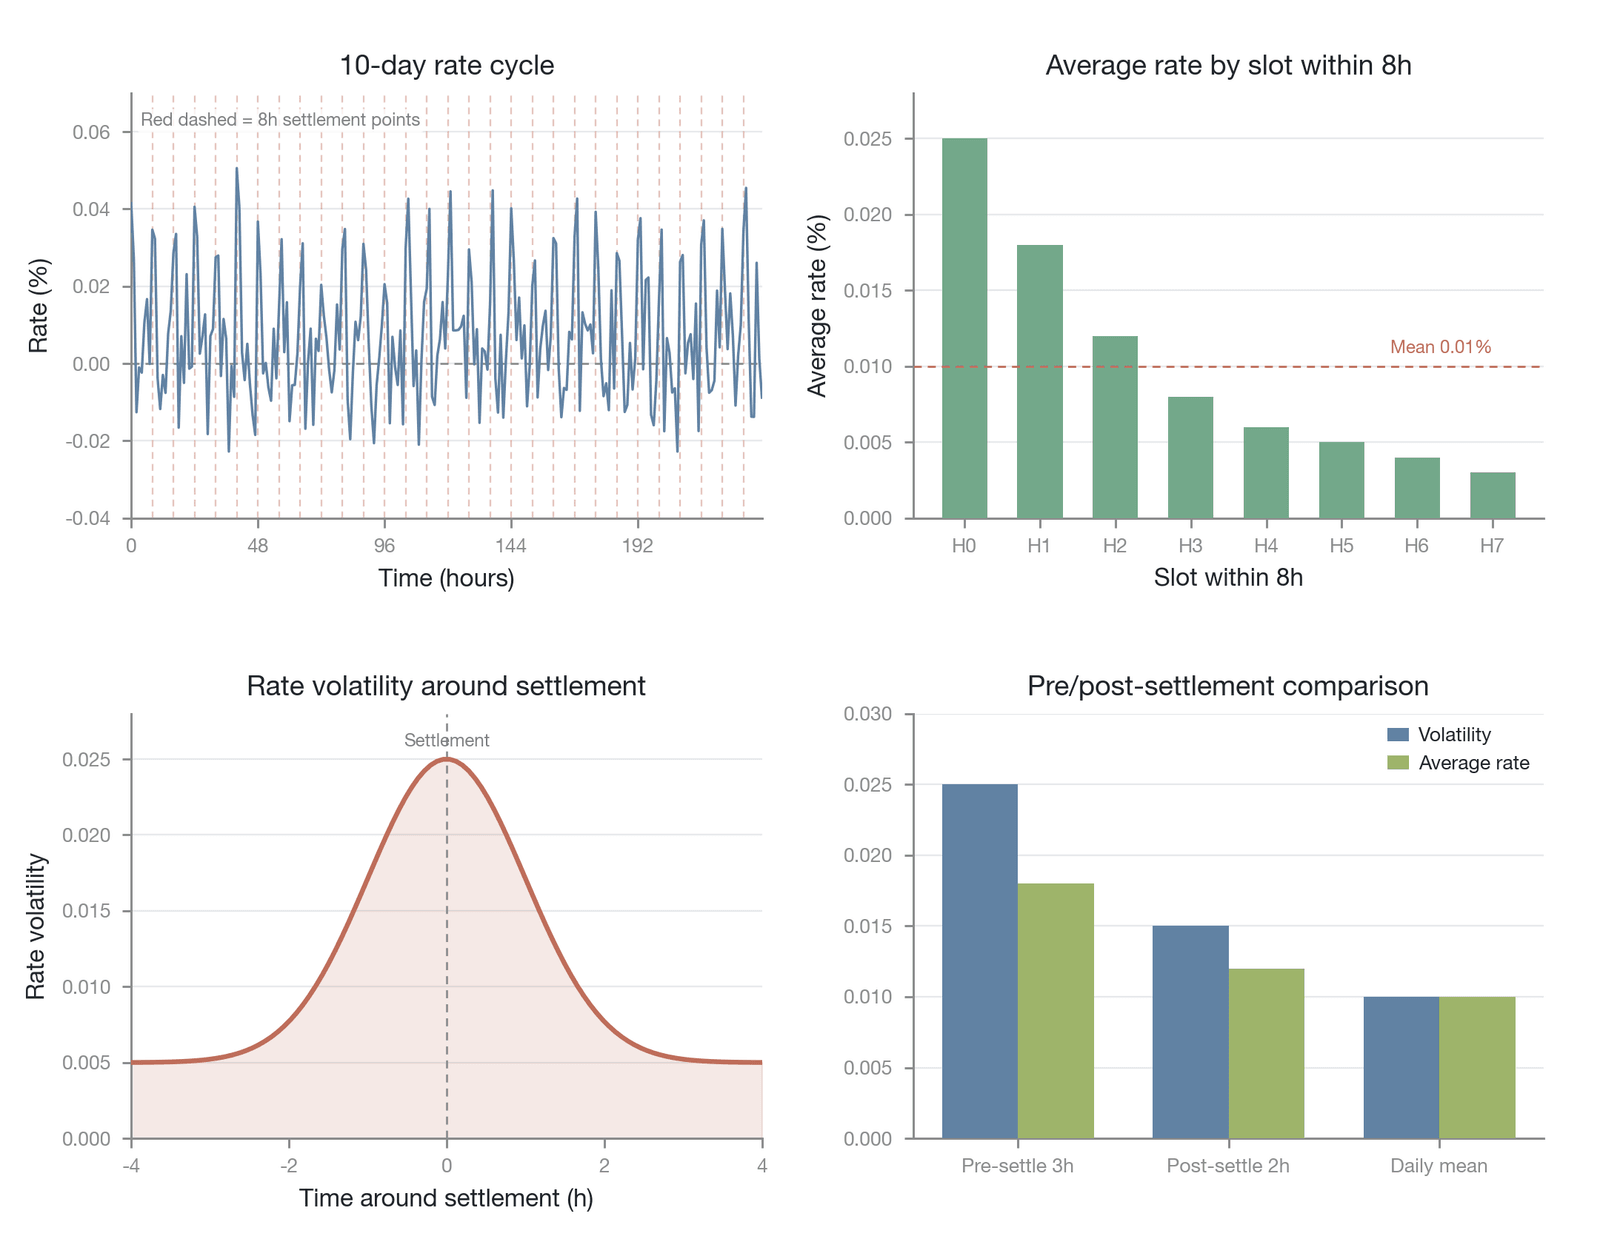
Figure 18-7. The settlement-timing effect of the funding rate around the 8-hour settlement cycle (illustrative/simulated, with synthetic-sample data rather than measured point values; the shape of the average rate in each interval is a synthetic illustration and does not represent a measured regularity; settlement points are 00:00/08:00/16:00 UTC)
Using high-frequency data, Figure 18-7 characterizes the systematic fluctuation of the perpetual futures funding rate around the 8-hour settlement cycle: the rate fluctuates cyclically with the every-8-hour settlement point as its rhythm; within a single 8-hour window the average rate decays interval by interval after the settlement point (H0); the rate's volatility around the settlement moment forms a bell-shaped peak centered on the settlement point; and both the volatility and the average rate in the pre-settlement window are significantly higher than the all-day average. This systematic pattern, driven by the rhythm of rate settlement, transmits further to the price level—the perpetual futures price shows a predictable brief shift before settlement (downward when the expected rate is positive, upward when it is negative) and reverts quickly after the settlement moment (its microstructural mechanism is detailed below), constituting a micro-scale predictable pattern created endogenously by institutional design.
The logic behind this settlement-timing effect is straightforward. When the market expects the funding rate to be settled at a high positive value, traders holding large long positions have a strong incentive to close out before the settlement moment to avoid paying the fee. This concentrated closing forms significant selling pressure over a short time, causing the perpetual futures price to fall briefly before settlement. Once the settlement moment passes, this selling pressure vanishes instantly, some traders may rebuild long positions, and the price rebounds quickly. Conversely, when the funding rate is expected to be negative, short holders try to close out before settlement to avoid paying the fee, forming brief buying pressure and a price rise. This cyclical supply-demand imbalance around the settlement point is determined entirely endogenously by institutional design. It creates a micro-scale predictable price pattern that in theory offers arbitrage opportunities to high-frequency traders. The target of traders' strategic behavior is not the settlement moment in the narrow sense but the 30-minute window that affects the computed time-weighted average price (TWAP). Within that window, large traders can even move the TWAP through deliberate order-flow manipulation, so that the settlement-cycle effect contains not only passive fee-avoidance behavior but also an active mark-price-manipulation component.
The persistence of this anomaly, however, reflects precisely the limits of the execution constraint (Constraint Dimension IV of Chapter 17). Capturing this brief price fluctuation within a precise settlement window (usually only a few minutes or less) requires ultra-low latency, an efficient execution system, and complex trading algorithms. This is unattainable for the vast majority of ordinary market participants, so arbitrage forces are insufficient to smooth away entirely this spread driven by an institutional cycle. Moreover, even participants with high-frequency trading capability face slippage, fees, and risk-management costs, which may render the arbitrage opportunity of the settlement-timing effect economically insufficient to attract enough capital. This anomaly is a typical cyclical anomaly, and its vitality depends entirely on the exchange's settlement regime. This provides a workable natural experiment for the "actual measurement before and after a change in the constraint" promised in Section 18.1.2: different exchanges adopt different settlement-cycle lengths—most mainstream centralized exchanges settle every 8 hours, whereas emerging decentralized derivatives exchanges (such as Hyperliquid) adopt a shorter, hourly cycle. This constitutes an approximate difference-in-differences design in which "settlement-cycle length" is the exogenously varied treatment variable: we can compare the price shift and volume-pulse magnitude within the respective settlement windows of short-cycle and long-cycle exchanges (the between-group difference) against the normal fluctuation in their respective non-settlement periods (the within-group difference). The falsifiable criterion is clear: if the settlement-cycle effect is indeed driven by the institutional constraint of discrete settlement, then Hyperliquid, with hourly settlement, should show a markedly weaker anomaly magnitude within its settlement window than exchanges with 8-hour settlement; conversely, if the settlement-window anomaly magnitudes of the two types of exchange show no systematic difference, then the attribution that "discrete settlement cycles drive the settlement-timing effect" is falsified. Empirical observation is consistent with the former hypothesis: the settlement-timing effect at Hyperliquid's settlement moments is indeed markedly weaker than at exchanges with an 8-hour settlement cycle, thereby converting the counterfactual that "shortening the settlement cycle can mitigate cyclical anomalies" from rhetoric into an observable before-and-after comparison (a rigorous statistical test still awaits a paired estimation on the high-frequency data of the two types of exchange). This clearly shows that, by optimizing institutional design (for example, shortening the settlement cycle or even achieving continuous settlement), this class of cyclical anomaly can be effectively mitigated or even eliminated. Shortening the settlement cycle is not without cost, however. A higher settlement frequency means that margin recomputation and the liquidation engine run more often, which raises the probability that a network-latency event coincides exactly with a settlement point. For a closed-loop appchain such as Hyperliquid, if a validator node experiences a momentary delay at a given settlement, all the margin computations and liquidation operations due at that point are delayed in synchrony, which may cause the time window of cascading liquidations to become abnormally concentrated. This offers market designers a clear lesson: the fine details of institutional design directly affect the market's efficiency characteristics, and a seemingly "technical" parameter choice (such as settlement-cycle length) may in fact become the root of a systematic anomaly.
18.3.4 The persistent splitting of cross-exchange rates
If the law of one price is the cornerstone of financial markets, then in an ideal perpetual futures market the funding rate of the same asset across different exchanges should also converge. This is because, if rates differed significantly, arbitrageurs could build a relatively low-risk position by shorting on the high-rate exchange and going long on the low-rate exchange, earning the rate difference steadily. The rate-arbitrage strategy described in Chapter 16 plays precisely the role of "smoothing" the entire market's rate surface. Once again, however, reality reveals its complexity. Empirical research (for example, Zhivkov, 2026 [2]) finds that funding-rate differences across exchanges are not only pervasive but also reach economically significant magnitudes for a considerable share of the time. Specifically, that study observes in its sample that economically significant arbitrage spreads (arbitrage spreads ≥ 20 bps; the 20 bps threshold is set by the author) exist in about 17% of the observed periods. The sample in [2] covers only 8 days (about 37.5 million minute-level observations across 26 exchanges), so the "roughly 17% share of observations" should be understood as a statistic within that short-sample, high-frequency panel rather than a steady-state proportion of a long-run panel, and readers should not extrapolate it into a general regularity over long horizons. This "persistent splitting" of rates constitutes the fourth important funding-rate anomaly.
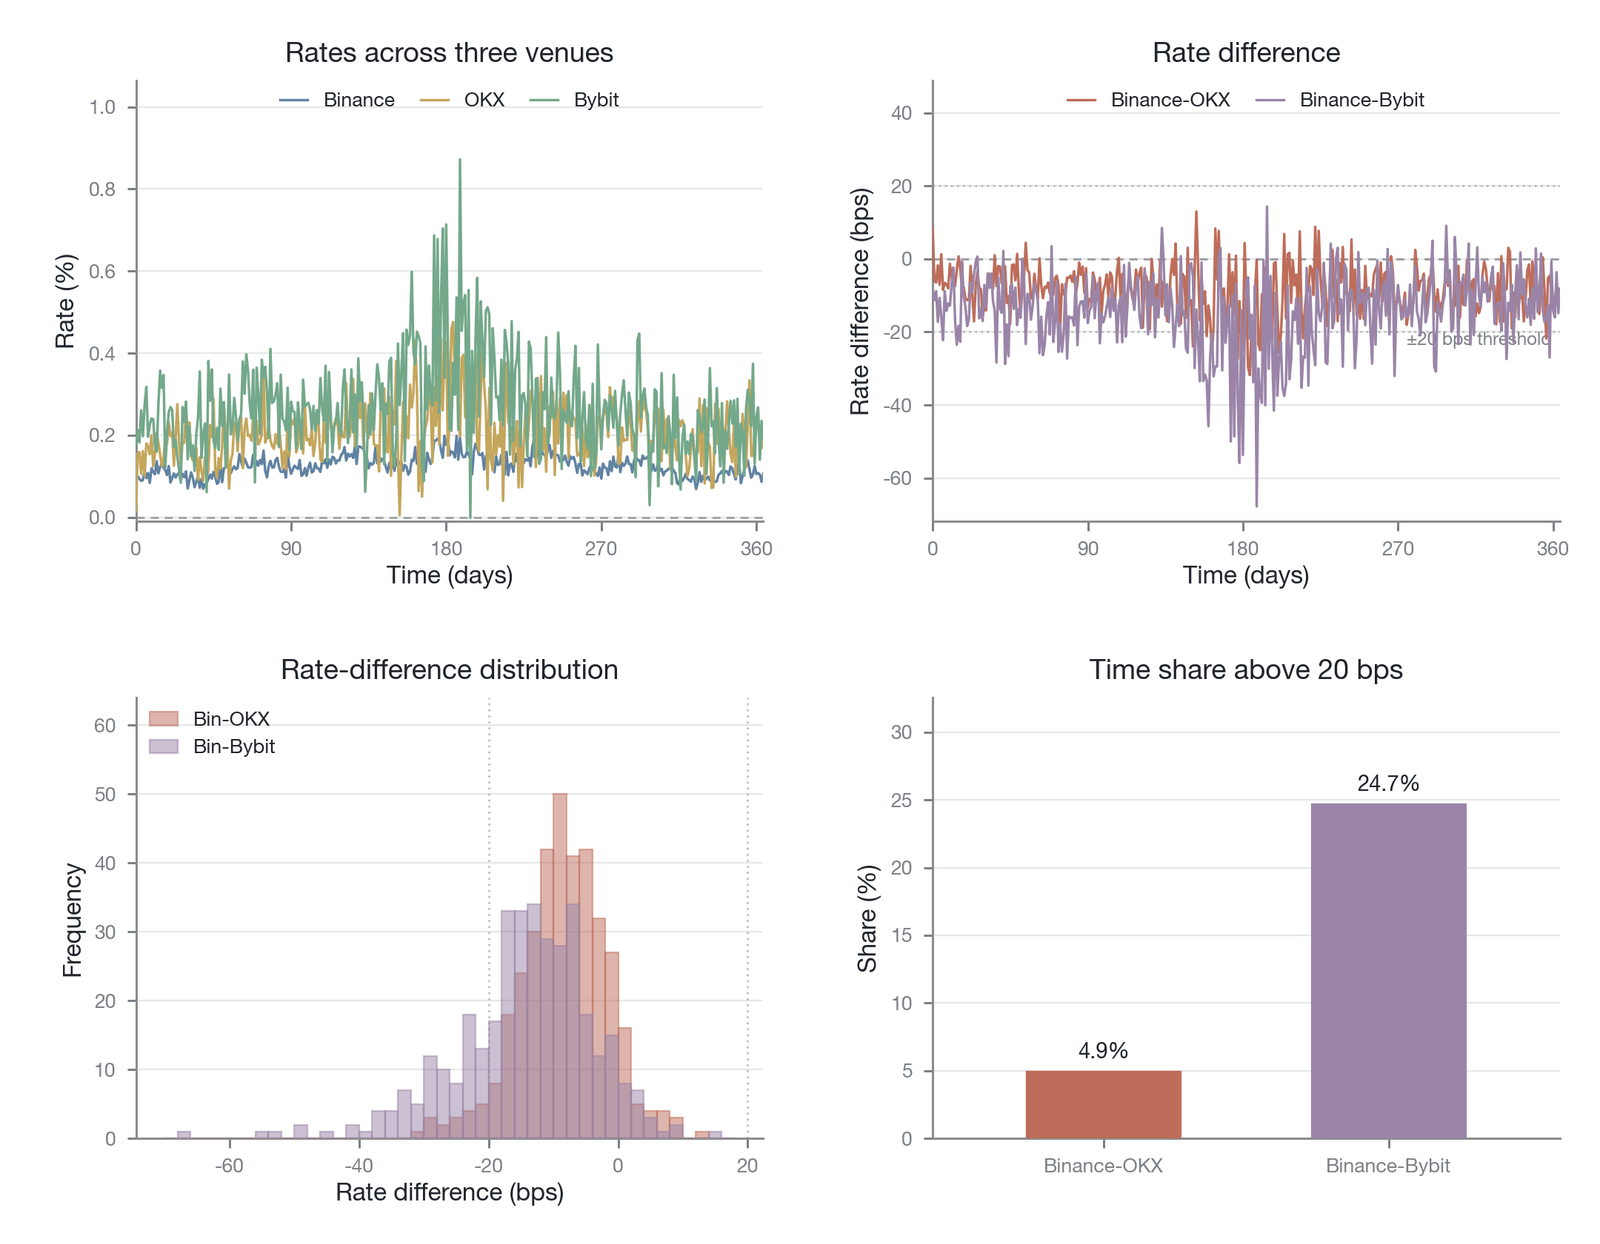
Figure 18-8. The persistent splitting of the BTC perpetual futures funding rate across mainstream exchanges (illustrative/simulated, with synthetic-sample data rather than measured point values; the share with spreads exceeding 20 bps is an illustrative order of magnitude, while the original sample in [2] yields about 17% for Hyperliquid)
Figure 18-8 overlays and compares the BTC perpetual futures funding-rate time series of several mainstream exchanges: although the rates are broadly aligned in trend direction (rising and falling together), a significant split always exists in their specific values, with differences of tens of basis points appearing frequently at the same moment; and this difference is not brief random noise but persists over a fairly long time window. In periods of heightened market volatility, the rate curves display a more pronounced "divergent" shape, revealing the inefficiency of cross-exchange arbitrage under stress.
The roots of this cross-exchange rate splitting are manifold. First, exchanges differ at the micro level in the specific formula for computing the funding rate. For example, they may use different price-index sources, different basis-calculation methods, or different interest-rate components, and these subtle differences can be amplified during market volatility, producing systematic rate deviations. Second, and more fundamentally, there is the powerful limitation of the margin constraint (Constraint Dimension I of Chapter 17). Executing cross-exchange rate arbitrage requires holding positions on two (or more) exchanges simultaneously, which means the arbitrageur's capital is split across separate, non-fungible margin accounts. This greatly reduces capital efficiency and significantly raises the total capital required for arbitrage. Research shows that in many cases, despite a theoretical arbitrage opportunity, arbitrageurs cannot in practice deploy positions of sufficient scale to eliminate the rate difference entirely, because margin requirements are too high. Zhivkov's (2026) research finds that, under its model assumptions (based on a single arbitrageur's capital constraint and bilateral cross-exchange margin lockup), about 95% of arbitrage opportunities ultimately cannot be executed in full because of forced exits driven by spread-reversal risk [2]. The 95% in the original mainly characterizes the share of opportunities forced to close during the holding period because the spread moved adversely. This chapter re-summarizes it as a composite constraint effect that can be roughly decomposed into three related mechanisms: cases in which margin requirements make the strategy's net present value negative; hard caps on position size imposed by exchange position limits; and cases in which an operational-overhead threshold makes small spreads not worth capturing (this decomposition is the author's re-summary, not the original's item-by-item classification). This figure is sensitive to the assumed scale of arbitrageur capital (better-capitalized institutions may face a constraint share well below 95%) and is also limited by the aforementioned 8-day short sample, but it clearly reveals how severe the constraints on cross-exchange rate arbitrage are.
Finally, exchanges differ in participant composition and market microstructure. For example, one exchange may have more retail speculators, giving it stronger long sentiment and a systematically higher funding rate over the long run, whereas another may have more institutional participants and more neutral market behavior. This "demand-side" split fundamentally causes different markets to form their own local rate equilibria. In addition, differences in counterparty risk (Constraint Dimension III of Chapter 17) also affect arbitrageurs' decisions. If an exchange's credit risk is perceived to be higher, arbitrageurs may demand greater compensation for its rate difference and be unwilling to build positions there. The persistent splitting of cross-exchange rates is therefore the product of the combined action of market segmentation, differences in institutional detail, arbitrage constraints, and differences in participant structure. It is a structural anomaly: as long as exchanges remain isolated in capital, users, and institutions, this rate split will persist, and the magnitude of the difference dynamically reflects the composite cost and risk of cross-market arbitrage. The existence of this anomaly further confirms the view of Chapter 16's AIH: when the infrastructure on which arbitrage relies (such as the ease of cross-exchange capital flow) is imperfect, the effectiveness of arbitrage is limited.
18.4 Cross-exchange anomalies
The law of one price is a cornerstone of financial theory. It asserts that, in a perfect market free of trading frictions and barriers, any assets with identical risk and future cash flows should trade at a single price, and any deviation should be eliminated instantly by arbitrageurs. In the crypto domain, celebrated as "natively digital" and possessed of "global liquidity," the law of one price was once expected to find its purest expression. The evolution of the perpetual futures market has indeed largely borne out this trend. Through complex cross-exchange arbitrage strategies (as described in Section 16.5), market participants "level" prices across different trading venues, bringing the entire market's pricing into alignment.
When we examine this seemingly smooth pricing system at higher resolution, however, we find that it is not perfectly consistent. As arbitrage forces approach their theoretical limit, they encounter a series of insurmountable obstacles—precisely the constraints analyzed in Chapter 17. Because these constraints exist, the law of one price is not fully realized in reality but leaves behind a series of persistent, observable "residual deviations." These residual spreads are not random noise; they constitute information-rich anomalies that delimit the boundaries reachable by cross-exchange arbitrage forces. This section analyzes three core cross-exchange anomalies, revealing how they map the deep features of market microstructure, participant behavior, and the macro regulatory environment.
18.4.1 The residual spread among leading exchanges
As the perpetual futures market has matured, leading exchanges (such as Binance, OKX, and Bybit), by virtue of their enormous liquidity, vast user bases, and relatively complete infrastructure, constitute the "core trading platforms" of global crypto derivatives trading. Among these hubs, the perpetual futures spread on major assets such as Bitcoin has converged to an extremely low level. Under the normal conditions of a smoothly functioning market, this spread typically holds within a narrow band of 1–3 bps. Yet although this spread is extremely small, it never truly vanishes to zero.
This ever-present "last basis point" of spread is itself an informative economic signal. It is not market inefficiency; on the contrary, it precisely measures the cost of achieving market efficiency. The essence of this "residual spread" is the minimum composite execution cost that cross-exchange arbitrage must bear. This composite cost can be decomposed into at least four layers. The first is the mechanical execution cost, including bilateral fees, order slippage, and latency risk. The second is the adverse-selection premium, the protective spread that cross-exchange market makers embed in their quotes to compensate for adverse order flow from informed parties. The third is the capital-readiness cost: maintaining cross-exchange arbitrage capacity requires pre-positioning idle margin on multiple platforms, and the annualized opportunity cost of this float capital is about 50–150 bps. The fourth is the withdrawal-rebalancing latency risk: after closing a cross-exchange spread, margin must be rebalanced across platforms by withdrawing on-chain, and the spread may reverse during the 10–60 minute on-chain confirmation period. As Chapter 16's "Arbitrage Infrastructure Hypothesis" points out, arbitrage returns are essentially the reward for providing the market with liquidity and price-discovery services. This residual spread can therefore be understood as the minimum operating fee for keeping the "cross-exchange price-transmission mechanism" functioning normally. When the spread narrows below this threshold, the returns generated by arbitrage trades no longer cover their costs and risks, and the incentive to arbitrage disappears. This seemingly negligible residual spread therefore delimits the true lower bound of market efficiency achievable under current technological and institutional conditions.
Moreover, this residual spread is not a static constant but displays pronounced state dependence. In calm periods it is 1–3 bps; when market volatility intensifies it widens systematically to 5–15 bps; and in extreme crisis events (such as an exchange collapse or a market-wide flash crash) it can burst instantly to more than 50–200 bps. This dynamic variation shows that the carrying capacity of the arbitrage infrastructure is finite. Under market stress, liquidity providers and arbitrageurs actively withdraw or reduce their risk exposure, intensifying capital fragmentation and causing execution risk to surge, thereby raising the cost of maintaining price consistency. The fluctuation of this residual spread can therefore serve as an effective indicator of the health and robustness of the market's entire arbitrage infrastructure.
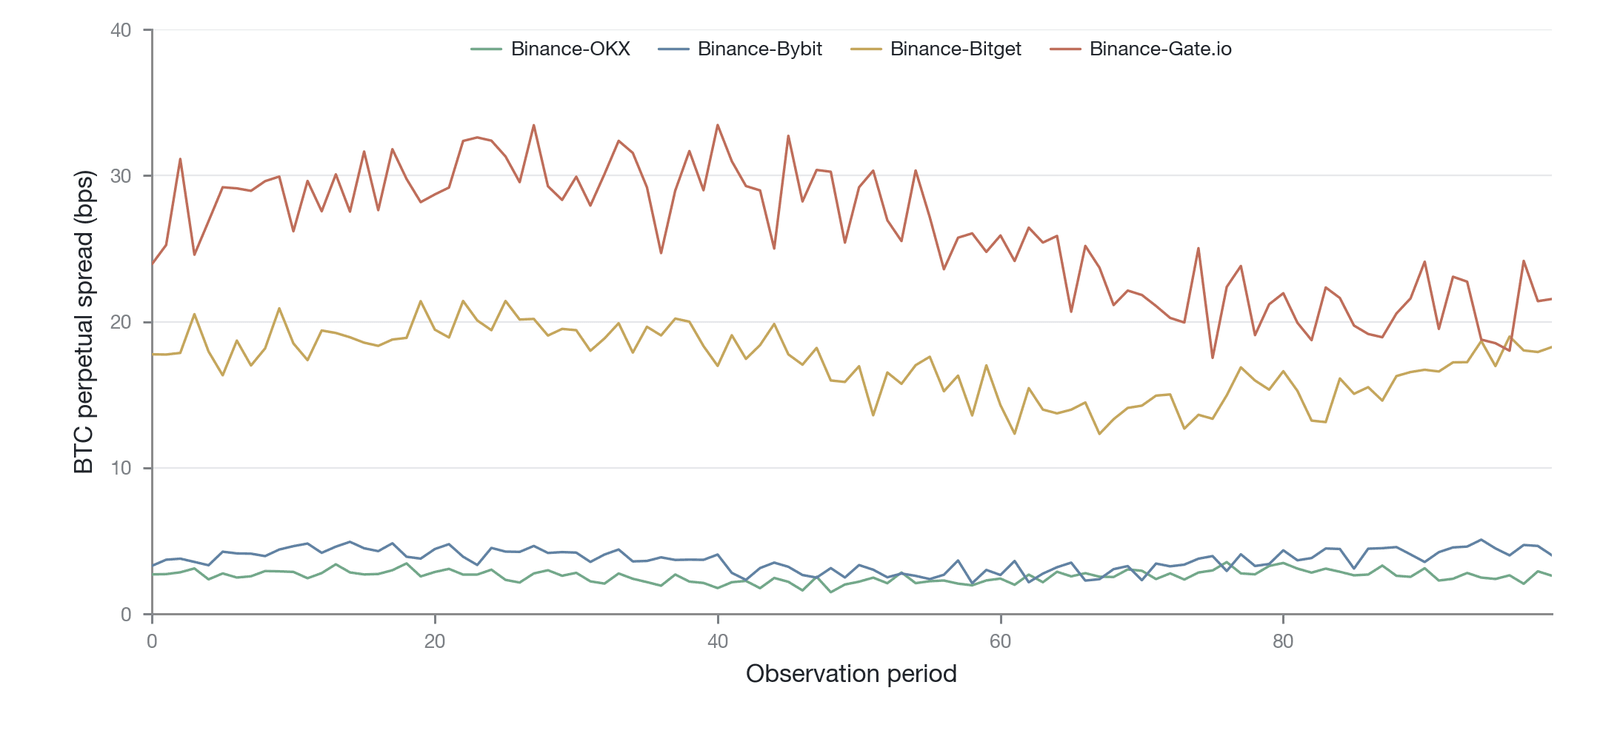
Figure 18-9. Time series of the BTC perpetual futures spread across different exchange pairs (simulated data, constructed from the historical spread characteristics of pairs such as Binance-OKX, Binance-Bybit, and Binance-second-tier-exchange)
Using simulated data, Figure 18-9 shows the dynamic features of the spread across different exchange pairs: the spread of leading-exchange pairs (such as Binance-OKX) fluctuates in a narrow band at a low level, whereas the spread against second-tier exchanges is systematically higher and more volatile, clearly displaying the tiered structure of the spread.
18.4.2 The core-periphery pricing gradient
Pulling back from the view among leading exchanges to survey the broader exchange ecosystem, a clear "core-periphery" pricing-gradient structure emerges. Cross-exchange spreads are not uniformly distributed but differentiate in tiers strictly according to an exchange's market standing, liquidity, and credit grade. The core tier comprises top exchanges such as Binance, OKX, and Bybit, among which the spread is smallest—typically 1–3 bps, as noted above. The near-periphery tier includes second-tier exchanges of a lower rank in volume and market influence, such as Bitget and Gate.io; their spread against core-tier exchanges widens significantly, usually to between 5 and 20 bps. The far-periphery tier covers many smaller, less liquid regional or emerging exchanges, whose spread against the core platforms can reach as much as 50–200 bps, and even higher in some extreme cases.
This pronounced gradient structure is a direct manifestation of the market pricing, through price signals, the intrinsic risk of different exchanges. Attributing it with Chapter 17's "constraint–anomaly mapping" framework, we find that the counterparty-risk constraint is the first-order cause of this anomaly: depositing funds on an exchange means bearing that exchange's credit risk (the FTX episode is a far-reaching case), and the credit risk of second-tier and peripheral exchanges is clearly higher than that of leading exchanges, so rational arbitrageurs demand higher expected returns to compensate for the additional credit-risk exposure, which manifests directly as a systematic spread premium. Differences in counterparty risk then intensify capital fragmentation: cross-exchange arbitrage requires pre-depositing margin on each platform, and with limited capital, arbitrageurs prioritize deploying it on the deepest, lowest-credit-risk core-tier exchanges, while pre-positioning capital on peripheral exchanges is economically unattractive. This leaves insufficient arbitrage-capital bandwidth connecting the core to the periphery, weakens the transmission chain of price discovery, and permits larger spreads to persist.
| Exchange tier | Representative exchanges | Median BTC perpetual futures spread | Primary risk characteristics |
|---|---|---|---|
| Core tier (first tier) | Binance, OKX, Bybit | 1–3 bps | Deepest liquidity, lowest credit risk |
| Near-periphery tier (second tier) | Bitget, Gate.io | 5–20 bps | Next-deepest liquidity, rising counterparty risk |
| Far-periphery tier (third tier and below) | Regional or emerging exchanges | 50–200 bps | Thin liquidity, significant counterparty risk |
Table 18-5. Exchange tiers and the BTC perpetual futures spread gradient (Data source: constructed by the author based on the Kaiko exchange ranking [7] and public industry data)
Table 18-5 shows the negative correlation between an exchange's relative credit rating and its median BTC perpetual futures spread. The higher-credit-grade exchange group (leading exchanges) has the smaller spread; as the credit grade declines, the spread widens nonlinearly, clearly displaying the "core-periphery" gradient. Two clarifications about the data are needed here. First, the median perpetual futures spreads in the table are typical order-of-magnitude estimates constructed by the author from public market data, not a measured panel from any single unified database. Second, the Kaiko exchange ranking [7] targets spot exchanges and scores them comprehensively along dimensions such as governance, security, and liquidity; it does not itself directly provide perpetual futures spreads or a formal credit rating, so here it serves only as a weak supporting reference for "exchange quality tiering." For a metric closer to a "credit-risk gradient," a more appropriate basis is Agio Ratings' counterparty probability-of-default (PD) score [8] (see the discussion of third-party rating systems at the end of Section 18.4.2).
In terms of persistence, the core-periphery gradient is a typical structural anomaly. As long as the crypto exchange market remains fragmented and heterogeneous, and as long as the credit risk of different platforms cannot be fully eliminated or perfectly hedged, this spread gradient will persist as a durable feature of market structure. The collapse of FTX provides an important counterexample for this framework: before its collapse, FTX, as one of the world's top three exchanges by volume, had a perpetual futures spread at the core-tier level (1–3 bps), and the market's ex ante risk pricing entirely failed to reflect its actual, fatal-level counterparty risk. This means that the spread, as a credit-risk signal, is inherently backward-looking: it can effectively price known, gradually changing risk differences but has almost no early-warning capacity for undisclosed, discontinuous risk events (such as the misappropriation of client assets). Of course, as the industry gradually consolidates, regulation matures, and the exchange-rating systems provided by third-party institutions such as Kaiko improve [8][7], counterparty risk becomes more transparent, and we may see this gradient ease in the future. From a systemic-risk perspective, the core-periphery gradient is not merely a passive reflection of risk differences but also an active contagion-amplification mechanism: peripheral exchanges, unable to attract arbitrage capital under normal conditions, continuously accumulate mispricing, and these accumulated deviations are released in synchrony during periods of market stress; when informed traders urgently exit all peripheral positions, their selling pressure further intensifies volatility in the core market, bearing a structural resemblance to the run pattern in the tri-party repo market of 2008. Even so, the possibility of its complete disappearance is minuscule.
18.4.3 Regulatory barriers and segmented pricing zones
If the two anomaly types above arise from the market's intrinsic frictions and risk pricing, the third arises from a powerful intervention external to the market: the law and regulation of sovereign states. When regulatory force directly severs or severely obstructs the free flow of capital across jurisdictions, the law of one price is violated in the most extreme way, forming discrete "segmented pricing zones." This is the case with the shortest causal chain in this chapter's "constraint–anomaly mapping": a regulatory constraint directly blocks the arbitrage path.
The most famous case is the "kimchi premium" of the Korean market. Because of the Korean government's strict capital controls and foreign-exchange regulations, the channels through which Korean citizens can convert won into foreign currency and transfer it to overseas crypto exchanges are heavily restricted. Conversely, selling overseas crypto assets on the Korean market, converting the proceeds into won, and remitting them abroad is equally difficult. This two-way barrier to capital flow largely isolates the Korean crypto market from the global market. When domestic Korean demand for crypto assets (especially speculative demand) exceeds the global average, cheaper external assets cannot flow in freely to meet it, so crypto prices on domestic Korean exchanges are systematically higher than in the global market, forming a significant "kimchi premium." Historically, this premium has repeatedly exceeded 20% and, in some extreme periods, reached more than 50% [1]. The same effect exists in the perpetual futures market, causing the perpetual futures prices of Korean exchanges to deviate from the global pricing center over the long run.
A broader and more far-reaching case arises from U.S. regulatory policy toward the crypto derivatives market. The U.S. regulatory framework imposes strict market-access restrictions on crypto derivatives. Under the Commodity Exchange Act, the U.S. Commodity Futures Trading Commission (CFTC) [9] prohibits unregistered platforms from soliciting and accepting orders from U.S. customers. The enforcement boundary of this rule is not entirely clear (for example, the legal consequences of a U.S. individual accessing an offshore exchange by technical means have not been clearly adjudicated in current case law), but its effect is to make the overwhelming majority of regulated U.S. institutional investors unable, in practice, to participate directly in the offshore perpetual futures market. As a result, the vast majority of U.S. investors, especially institutional investors, can trade only on U.S.-regulated platforms such as the Chicago Mercantile Exchange (CME) and Coinbase, and cannot participate directly in the world's deepest offshore markets (such as Binance and OKX). This regulatory isolation creates two parallel pricing systems: an onshore dollar pricing system benchmarked to CME Bitcoin futures and Coinbase spot prices, and an offshore-dollar (usually USDT or USDC) pricing system dominated by the perpetual futures of offshore exchanges such as Binance and OKX. Although both are denominated in dollars and share the same underlying asset, systematic pricing deviations arise between them because of differences in participant groups, leverage rules, trading hours, regulatory expectations, and funding costs. For example, CME futures prices reflect more the trading behavior of regulated institutions, whereas offshore perpetual futures reflect more the sentiment and demand of global retail investors and professional traders not subject to U.S. regulation. This regulation-created fissure is structural, and its evolution depends directly on the future direction of global—and especially U.S.—regulatory policy.
| Regulatory environment | Representative market | Average spread level | Driving factor |
|---|---|---|---|
| Global leading exchanges (low regulatory friction) | Among Binance, OKX, Bybit | 1–3 bps | Free capital flow, unobstructed arbitrage |
| Jurisdictions with a clear compliance framework | The EU's MiCA framework, U.S. CME | 10–50 bps | Differences in compliance cost and market access |
| Capital-controlled jurisdictions | South Korea (kimchi premium) | 200–2,000 bps | Capital-flow barriers block the arbitrage path |
Table 18-6. Crypto derivatives spread levels under different regulatory environments (Data source: constructed by the author based on Seo et al. [1], Kaiko [7], and public industry data)
Table 18-6 shows the average spread level under different regulatory environments. Among global leading exchanges, the spread remains extremely low. In jurisdictions with specific regulatory restrictions (such as capital controls), however, the average spread widens sharply, forming a significant "segmented pricing zone." In jurisdictions with an increasingly clear regulatory framework (such as the EU's MiCA and the U.S. stablecoin regulatory proposal, the GENIUS Act, still under legislative review), the spread also takes on different levels because of differences in compliance cost and market access. A note on the data is needed: the 200–2,000 bps range for capital-controlled jurisdictions in the table connects with the reading in the introduction that the spot kimchi premium has "a long-run center of about 120 bps (the estimate from the threshold model of Seo et al. [1]) and can exceed 20% or even 50% in extreme periods"—120 bps is the long-run steady-state center, whereas 200–2,000 bps reflects the wider upper bound of the distribution including extreme periods; Kaiko [7] serves here only as an auxiliary reference for exchange quality tiering (it is itself a comprehensive spot-exchange ranking), and the perpetual spread figures for each tier are typical order-of-magnitude values constructed by the author from public market data.
The persistence of anomalies driven by regulatory barriers depends entirely on macro legal and political processes. As long as crypto regulation worldwide fails to achieve unification and coordination, these "segmented pricing zones" produced by jurisdictional division will persist, serving as vivid proof that the law of one price still faces powerful resistance in the age of globalization.
18.5 Cross-asset anomalies
Having examined the basis, funding-rate, and cross-exchange anomalies that revolve around a single asset in the perpetual futures market, our analysis now enters the dimension that spans different assets. Unlike the spreads above—"the same asset in different places or different forms"—cross-asset anomalies concern the relative-pricing deviation between "related but different assets." Such anomalies cannot be corrected by a simple two-leg spot-derivative arbitrage but require more complex multi-leg strategies such as statistical arbitrage. As Chapter 17 revealed, every increment in a strategy's complexity multiplies the constraint dimensions and execution frictions it faces. The persistence of cross-asset anomalies therefore offers us an effective analytical vantage point from which to observe what form of harder-to-eliminate price deviation the market takes on when model risk and correlation-breakdown risk are compounded. From the broad "inefficiency zone" of the altcoin market to the "long-cycle drift" in the relative pricing of Bitcoin and Ethereum, these anomalies delimit the boundaries that advanced arbitrage strategies face in the real world.
18.5.1 The "inefficiency zone" of altcoin perpetual futures
The crypto asset market is not a homogeneous whole but an ecosystem highly stratified in liquidity and efficiency. If the perpetual futures markets of Bitcoin and Ethereum are the high-efficiency market of the whole ecosystem, then the perpetual futures markets of the overwhelming majority of small- and mid-cap altcoins constitute a broad low-efficiency market. Here the various anomalies discussed in earlier sections are systematically amplified, far exceeding major assets in both magnitude and duration. This pronounced difference in efficiency does not stem from altcoin-market participants being "more irrational" but is a direct mapping of the tighter arbitrage constraints in these low-efficiency markets.
The most intuitive evidence lies in the efficiency of price discovery. For Bitcoin or Ethereum, the basis between perpetual futures and spot is usually anchored tightly within tens of basis points. For a small coin ranked beyond the top 100 by market cap, however, it is the norm for the perpetual futures basis to reach hundreds or even thousands of basis points during periods of market volatility. The same holds for the funding rate: extreme-rate events are relatively rare for major coins, whereas the perpetual futures of many altcoins are perennially shrouded in extreme positive or negative rates, with annualized rate costs repeatedly exceeding 100%. Cross-exchange spreads are widened even more markedly: a spread nearly eliminated among mainstream exchanges can persist above 1% over the long run across the different trading venues of an altcoin.
Figure 18-10 presents this structural stratification of efficiency visually: it shows the negative correlation between an asset's market cap and its derivatives market's pricing efficiency (proxied by average basis magnitude). As market cap declines, the average perpetual futures basis widens superlinearly (convexly), forming a steep curve that transitions from the high-efficiency market to the low-efficiency market; for the small-cap tokens at the far left of the curve, the very large basis means the arbitrage mechanism is only half-functional here.
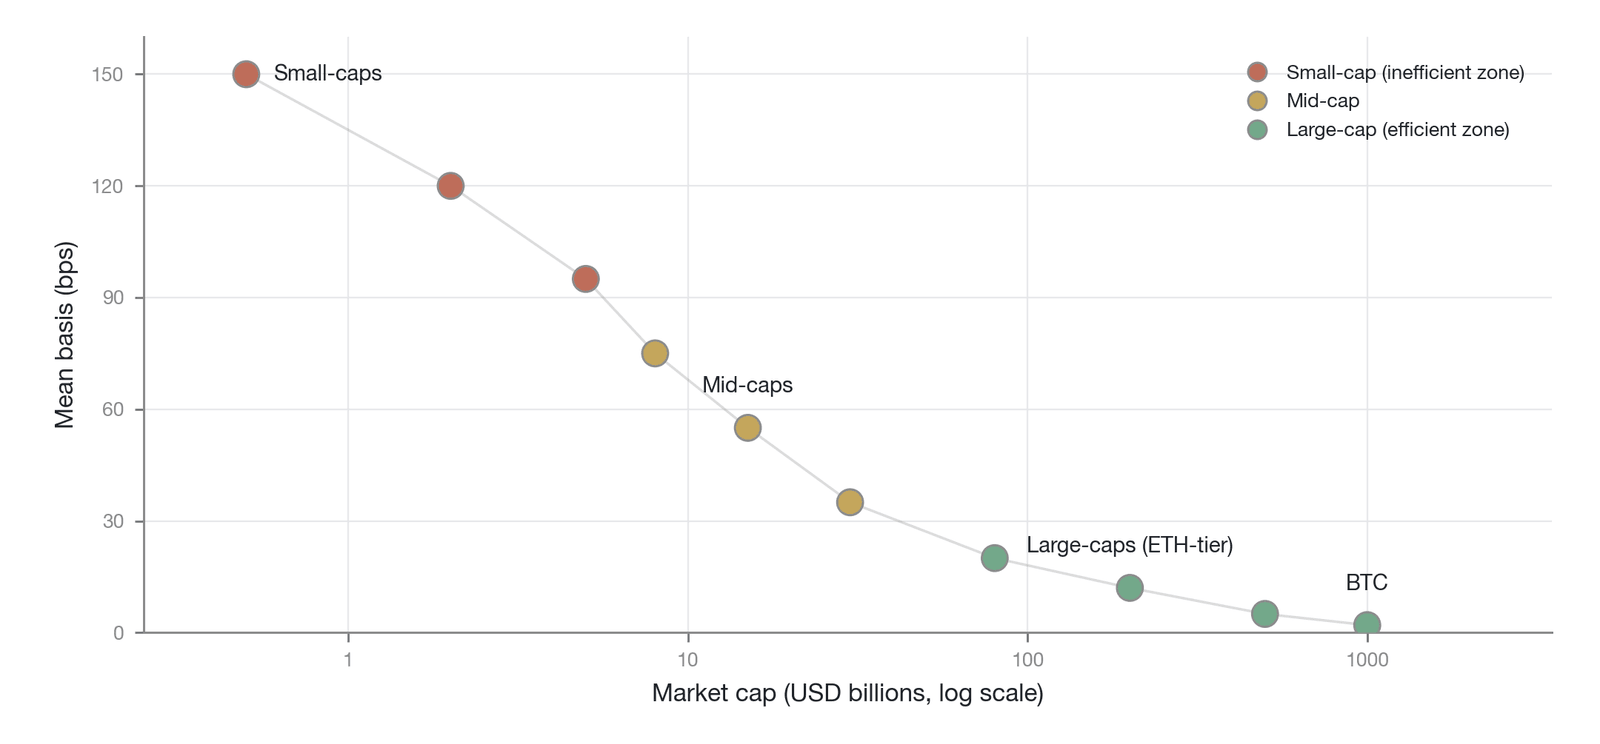
Figure 18-10. The relationship between asset market cap and the magnitude of the perpetual futures basis (illustrative/simulated: the inverse relationship is the empirical direction, while the specific basis curve is an illustrative order of magnitude rather than measured point values; stratified by market-cap rank)
The causes of this "inefficiency zone" can be traced precisely to several of the constraint dimensions discussed in Chapter 17, among which the liquidity constraint (the fifth dimension) is the first-order explanation. First, altcoin order books are extremely thin. For an arbitrageur, executing a trade meant to correct a price deviation may incur a market-impact cost that exceeds the spread itself. More critically, on an extremely thin altcoin order book the price-impact function is convex rather than linear: even a medium-sized order may cross multiple price levels, so the impact cost grows superlinearly (convexly) with trade size. This means there is no "partial arbitrage" equilibrium: arbitrageurs cannot make the strategy feasible by shrinking position size, because even the smallest economically viable position may exhaust one side of the entire order book. This threshold effect provides a stronger theoretical foundation for the structural persistence of altcoin anomalies than mere "excessive cost," rendering arbitrage economically infeasible. Second, effectively hedging the risk of altcoins is extremely difficult. The spot-shorting mechanism necessary for negative-basis arbitrage is, in the altcoin world, either entirely absent or prohibitively expensive to borrow. Many altcoins' perpetual futures are even listed on only a few exchanges, so the basis for cross-exchange arbitrage ceases to exist. Finally, the opacity of the information environment amplifies arbitrageurs' adverse-selection risk. Facing an altcoin with murky fundamentals and severe information asymmetry, an arbitrageur struggles to judge whether a large spread is a genuine arbitrage opportunity or a counterparty position on which they are about to become the loser to an informed party. In such an environment, rational arbitrageurs choose to stay away, allowing the price deviation to persist.
The "inefficiency zone" of altcoin perpetual futures is therefore not a temporary, easily repaired market defect but a structural anomaly determined by the long-tail distribution of liquidity, an endogenous feature of the crypto market. As long as the crypto world continues to contain tens of thousands of highly liquidity-dispersed "long-tail assets," these low-efficiency markets will persist as domains that arbitrage forces cannot effectively cover, serving as a lasting emblem of the stratification of market efficiency.
18.5.2 The long-cycle drift in BTC-ETH relative pricing
Moving up from the inefficiency zone, we arrive at the market's most liquid core: Bitcoin and Ethereum. Here, simple arbitrage opportunities are nearly eliminated. A subtler, larger-scale anomaly appears, however: the relative-pricing relationship between the two major assets exhibits a cyclical drift lasting months or even spanning years. The ETH/BTC price ratio, the core metric of the two assets' relative value, does not revert stably around a mean as statistical-arbitrage models expect but displays persistent, trending deviations across different market cycles.
This long-cycle drift is often tightly linked to the market's dominant logic and the evolution of fundamentals. For example, in periods when Ethereum is about to undergo a major upgrade (such as the Merge upgrade) or when its ecosystem (such as Layer 2) makes a breakthrough, the ETH/BTC ratio typically rises for several months. Conversely, when Bitcoin becomes the market's focus (such as the approval of a spot ETF), the ratio may experience prolonged downward pressure. Figure 18-11 shows the time-series variation of the ETH/BTC rolling correlation coefficient, in which it is clear that, although the long-run mean stays at a relatively high level, the correlation undergoes significant, sustained drift during specific event windows, reflecting phased changes in the two assets' relative-pricing logic.
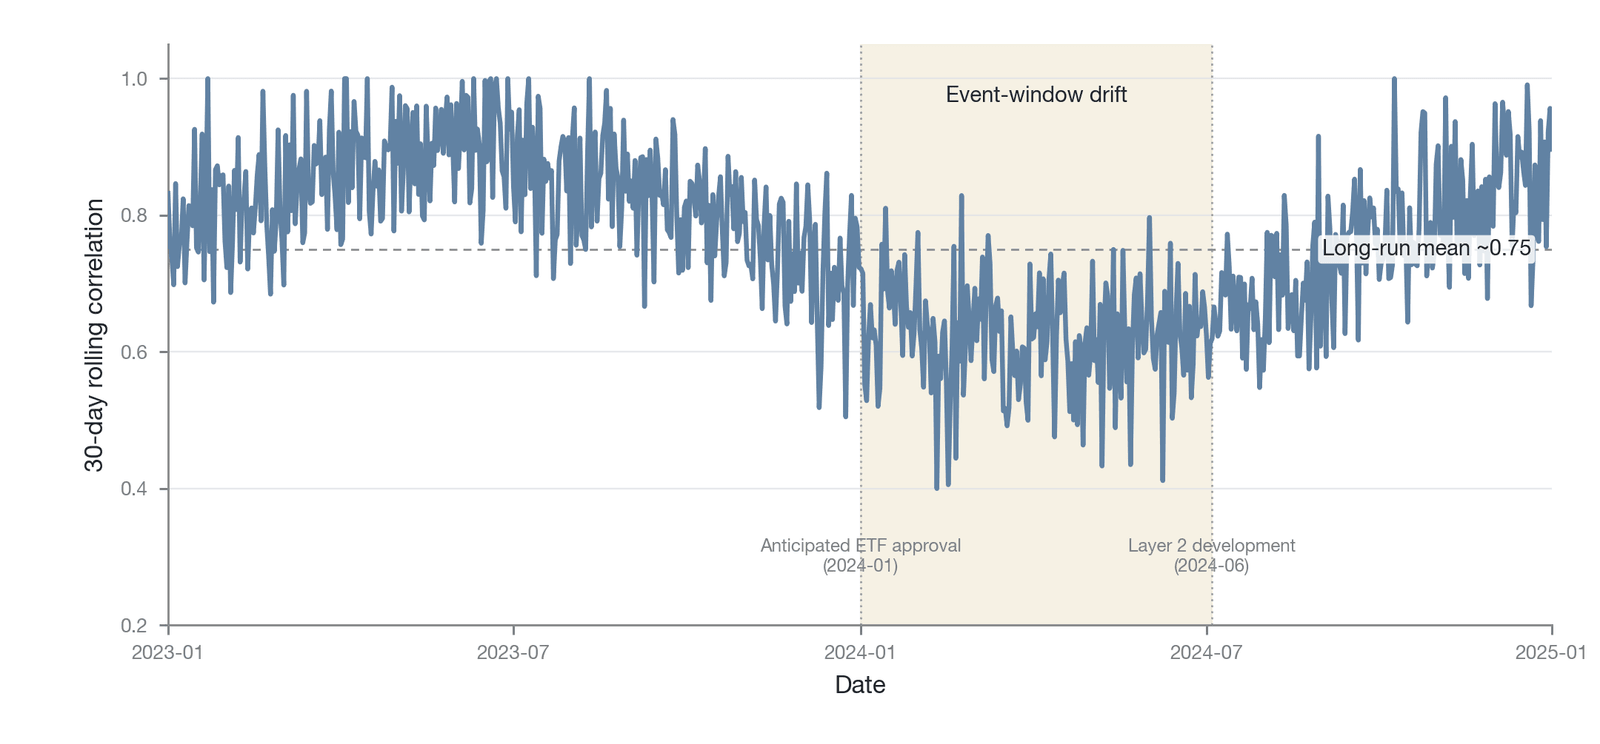
Figure 18-11. The long-cycle drift of the BTC-ETH rolling correlation coefficient (constructed by the author from public market data)
Figure 18-11 shows the trajectory of the BTC-ETH rolling correlation coefficient over a fairly long time span: the long-run mean stays at a relatively high level (usually between 0.7 and 0.9), but during specific event windows (major Ethereum upgrades and the period around the approval of a Bitcoin ETF) it undergoes a significant downward drift lasting weeks or even months, and this instability of correlation directly constitutes the core risk facing statistical-arbitrage strategies. The rolling correlation coefficient in the figure is only an illustrative measure, however; to characterize this time-varying correlation rigorously, a more robust approach is the DCC-GARCH dynamic conditional correlation model proposed by Engle (2002) [10], which avoids the estimation bias of a rolling window during periods of drastic volatility change.
From the perspective of the constraint–anomaly mapping, the existence of this long-cycle drift directly challenges the core assumption of statistical arbitrage (Section 16.8 of Chapter 16). The strategy rests on the belief that the spread or ratio between two highly correlated assets will "revert to the mean." When the "mean" itself becomes a non-stationary parameter, however, the premise of the arbitrage is shaken. For assets like BTC and ETH, whose fundamentals are still evolving rapidly, their long-run fair ratio is itself a highly uncertain question. Is today's deviation a "mispricing" to be corrected tomorrow, or a "reasonable revaluation" reflecting future changes in fundamentals? The arbitrageur faces substantial model risk.
More important, the correlation-breakdown risk discussed in Chapter 17 is fully evident here. If an arbitrageur builds a position based on historical data (for example, going long on the reversion of the ETH/BTC ratio), then once an unforeseen change in market structure breaks the correlation between the two entirely, the arbitrageur faces unlimited losses. This deep, hard-to-hedge risk greatly suppresses the scale of capital arbitrageurs are willing to commit. They may trade in small size over short horizons, but few dare to bet in large size and over the long run on the reversion of a large, fundamentals-driven relative-price ratio. The insufficiency of arbitrage forces leaves ample room for this long-cycle drift.
Here we touch on a blurry boundary in the definition of an anomaly. Is a months-long rise in the ETH/BTC ratio an "anomaly" caused by arbitrage failure, or a "reasonable repricing" by the market of an improvement in ETH's fundamentals? The answer is perhaps both. Part of the deviation may indeed reflect a change in fundamentals, while another part may be market overreaction or underreaction caused by the constraints described above. A workable criterion is this: does the magnitude of the price deviation far exceed what fundamental information can reasonably explain? After the driving event (such as the completion of an upgrade) ends, does the abnormal drift in the price ratio still persist? If the answer is yes, then we have stronger grounds to characterize it as a structural cross-asset anomaly sustained by arbitrage constraints. In terms of the "pure-anomaly–equilibrium-deviation" continuum proposed in Section 18.1.1, the BTC-ETH long-cycle drift is precisely an intermediate state lying between the two: the part driven by changes in fundamentals approaches equilibrium repricing, whereas the part amplified by model risk and correlation-breakdown risk approaches a pure anomaly; the two criteria above—whether the deviation exceeds what fundamentals can explain, and whether it persists after the event ends—are precisely the testable standards that operationalize this dichotomy's borderline cases.
18.6 Term-structure anomalies
When we turn from the cross-asset dimension to the dimension that unfolds along the time axis, another set of deep pricing distortions comes into view. Term-structure anomalies concern the pricing consistency of the same underlying asset across different maturities or product forms. Their core feature is that they involve rate deviations between instruments in different "time slices"—perpetual futures and dated futures, onshore ETFs and offshore perpetuals. The triangular arbitrage or cross-system arbitrage needed to eliminate such deviations faces the combined action of multiple constraints—participant segmentation, regulatory isolation, and session mismatch—which makes these anomalies highly persistent.
18.6.1 The implied-rate deviation between perpetual funding and dated-futures basis
In traditional financial markets, the derivative prices of the same asset across different maturities together form a smooth, internally consistent term-structure curve that reflects the market's expectations of future prices and the financing cost over different time intervals. In the crypto derivatives market, however, we observe two core instruments—perpetual futures and dated futures—giving frequently contradictory signals about "financing cost." This produces a persistent deviation of "two implied-rate curves."
The first curve derives from the funding rate of perpetual futures. The funding rate is essentially the interest that longs and shorts pay each other to anchor the perpetual futures price to spot. Annualizing this rate, settled every 8 hours, yields an ultra-short-term "implied financing rate" driven directly by market sentiment and leverage demand. The second curve derives from traditional dated futures, such as the BTC quarterly futures traded on the Chicago Mercantile Exchange. The basis of such futures (the difference between the futures price and the spot price) likewise implies the financing cost from now to the delivery date. In theory, through triangular arbitrage (Section 16.6 of Chapter 16), the rate levels the two curves reflect at the same maturity should converge. This implied-rate perspective aligns with the core concern of the crypto carry-trade literature: the perpetual futures funding rate and the dated-futures basis essentially give two sets of implied-rate signals about the cost of carry, and their persistent deviation is precisely a sign that the carry structure has not yet been fully arbitraged away in the crypto market [5].
The reality revealed by empirical data, however, is otherwise. Most of the time, the short-term rate annualized from the perpetual futures funding rate deviates significantly and persistently from the forward rate computed from the dated-futures basis. Figure 18-12 simulates this typical shape of deviation: the curve representing perpetual futures is systematically higher across maturities and has a steeper term structure, whereas the curve representing dated futures is relatively flat and reflects more the institutional-level, medium- to long-term funding cost and expectations. The rate spread between the two curves constitutes a term-structure anomaly unique to the crypto market.
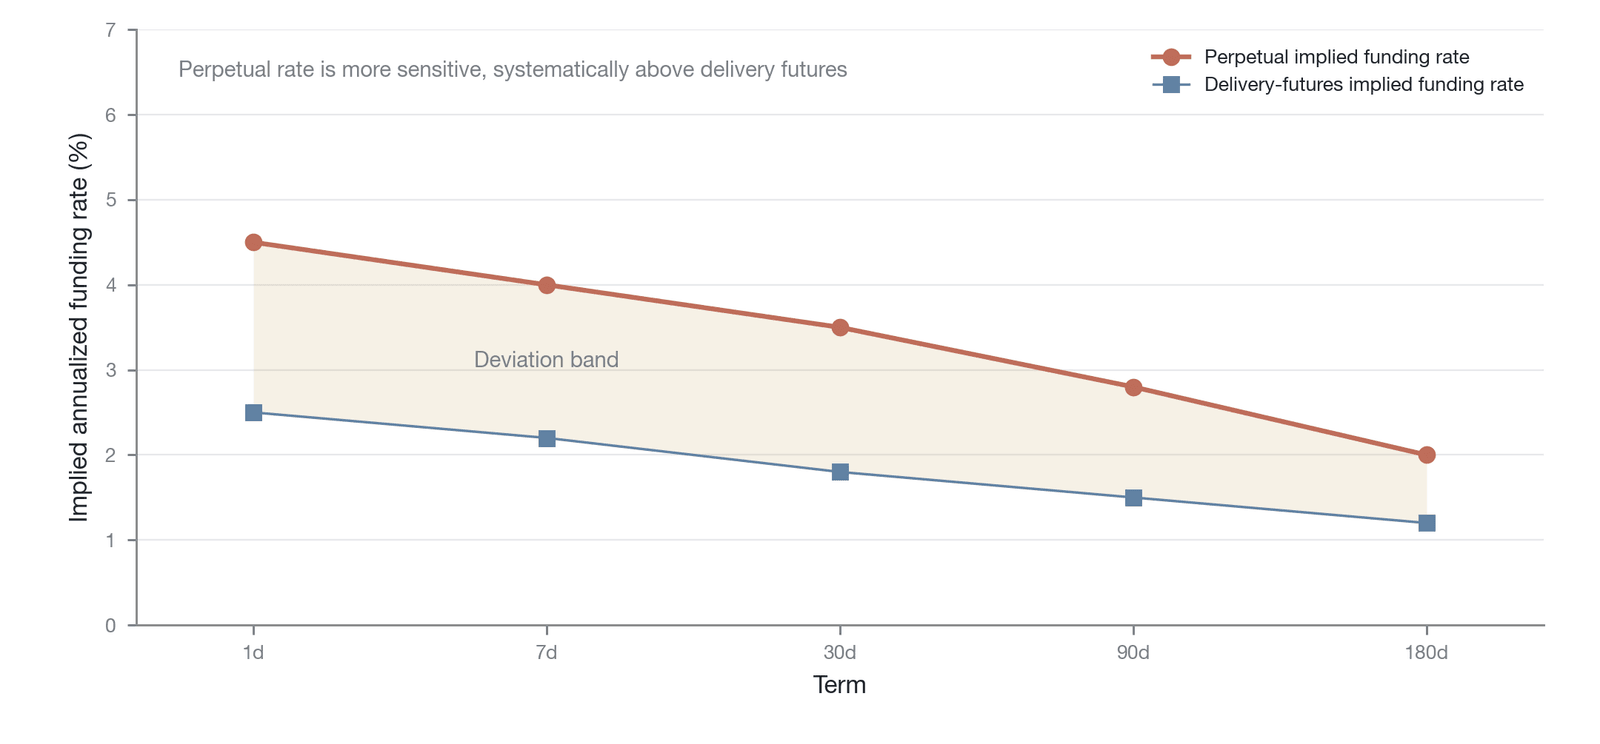
Figure 18-12. A comparison of the implied-rate curves of perpetual futures and dated futures (Data source: simulated data constructed by the author)
Figure 18-12 presents side by side the implied-rate curve derived by annualizing the perpetual futures funding rate and the implied-rate curve computed from the dated-futures basis: the perpetual futures implied rate is systematically higher across all maturities with a steeper curve, exceeding dated futures especially clearly at the short end; the dated-futures curve is flatter, reflecting the more stable funding-cost expectations of institutional participants. The rate spread between the two curves is persistently positive across maturities, a systematic rather than random pattern of deviation, confirming a structural split in the two markets' pricing logic.
The most central explanation for the root of this deviation is "participant segmentation." The dominant forces in the perpetual futures market are crypto-native retail investors, traders, and quantitative funds, whose trading is driven more by short-term narratives, market sentiment, and high-leverage speculative demand. The main participants in the CME futures market, by contrast, are traditional financial institutions, hedge funds, and professional investors seeking compliant risk exposure, who have different information sources, risk appetites, capital costs, and regulatory constraints. This fundamental difference in participant structure produces a systematic split in the two markets' pricing logic. The perpetual futures implied rate is more like the "unsecured overnight lending rate" of the crypto-native world, whereas the CME futures implied rate is closer to the "collateralized funding rate" of the traditional financial system.
In theory, triangular arbitrageurs could eliminate this rate deviation by "going long spot in one market, short futures in another, and taking opposite positions in the two derivatives markets simultaneously." As analyzed in Section 17.5.2 of Chapter 17, however, this multi-leg, cross-platform arbitrage strategy faces severe execution constraints. It requires not only holding sufficient margin and trading limits in multiple markets simultaneously but also coping with the settlement risk, margin-call risk, and potential regulatory obstacles of different platforms. More fundamentally, this three-leg arbitrage strategy carries an ineliminable basis risk: the funding rate of the perpetual futures leg changes every 8 hours, whereas the basis-implied rate of the CME quarterly futures is locked until expiry. This means that even if the three-leg position perfectly hedges the rate deviation at inception, a subsequent sign reversal in the funding rate will directly erode the strategy's expected return, while the CME leg cannot be adjusted flexibly to cope with this daily-frequency movement. A considerable part of the perpetual-vs.-dated rate deviation is therefore reasonable compensation for this roll/basis risk, not pure arbitrage failure. Because of these constraints, the scale of capital able to execute such arbitrage effectively is relatively limited and insufficient to close the gap between the two rate curves entirely.
The deviation of the "two implied-rate curves" is therefore a deep structural anomaly. It is not merely a technical pricing failure but a manifestation of two different market systems—the crypto market and the traditional financial market—interacting, in institutions, culture, and participant composition, without having fully merged. As Bitcoin spot ETFs are approved and more traditional institutions enter, this participant segmentation may slowly close and the two curves may gradually converge. In the foreseeable future, however, this term-structure anomaly, sustained by structural segmentation, will remain an important feature of the crypto market.
18.6.2 CME/ETF and offshore-perpetual dual-track pricing
The approval of Bitcoin spot ETFs in the United States in early 2024 was an important institutional event in the integration of crypto assets into the mainstream financial system. Yet this institutional integration, far from eliminating pricing anomalies entirely, gave rise to a wholly new, more institutionalized structural fissure: a significant "dual-track pricing" pattern between the onshore, strictly regulated ETF/CME pricing system and the offshore, freely flexible perpetual futures pricing system.
These two systems differ fundamentally along almost every dimension, and these differences form successively compounding arbitrage barriers. The segmentation of the regulatory environment is the most fundamental barrier: ETFs operate under the close supervision of the U.S. Securities and Exchange Commission (SEC), whereas mainstream perpetual futures are located in offshore, relatively lightly regulated jurisdictions, and this segmentation directly dictates that the participant groups of the two systems cannot freely intersect. Regulatory segmentation in turn gives rise to a mismatch in trading hours: ETFs follow the New York Stock Exchange (NYSE) session (9:30 a.m. to 4:00 p.m. ET), whereas perpetual futures trade 24/7 without interruption, which means arbitrageurs cannot complete a hedge through the ETF side while the U.S. equity market is closed. The time mismatch is further compounded by a difference in settlement mechanisms: ETFs settle in U.S. dollar cash and follow a T+1 redemption mechanism, whereas perpetual futures settle instantly in stablecoins, and this lag means that even during hours when both markets are open, arbitrageurs still face at least one trading day of capital occupancy and risk exposure. These three layers of institutional gap compound upon one another to form an institutional barrier obstructing the free flow of arbitrage capital between the two systems.
The most typical manifestation of this dual-track pricing pattern is the "intraday cyclical fluctuation" of the spread. As shown in Figure 18-13, the spread between the ETF and offshore perpetual futures exhibits cyclical fluctuation highly correlated with global trading sessions. During the U.S. session, because both markets are open, arbitrage activity is relatively active and the spread is compressed to a low level. Once the U.S. market closes and the Asian and European sessions begin, however, the offshore perpetual futures market enters a "period lacking a price reference." At this point, most global Bitcoin trading and price discovery is concentrated in the perpetual futures, and lacking the strong price "anchor" of the ETF/CME, the perpetual futures price is more susceptible to drift under the influence of regional news, capital flows, or market sentiment, causing the spread against the previous U.S. equity close to widen significantly. Only when the next U.S. session opens is the overnight-accumulated spread corrected again by returning arbitrageurs.
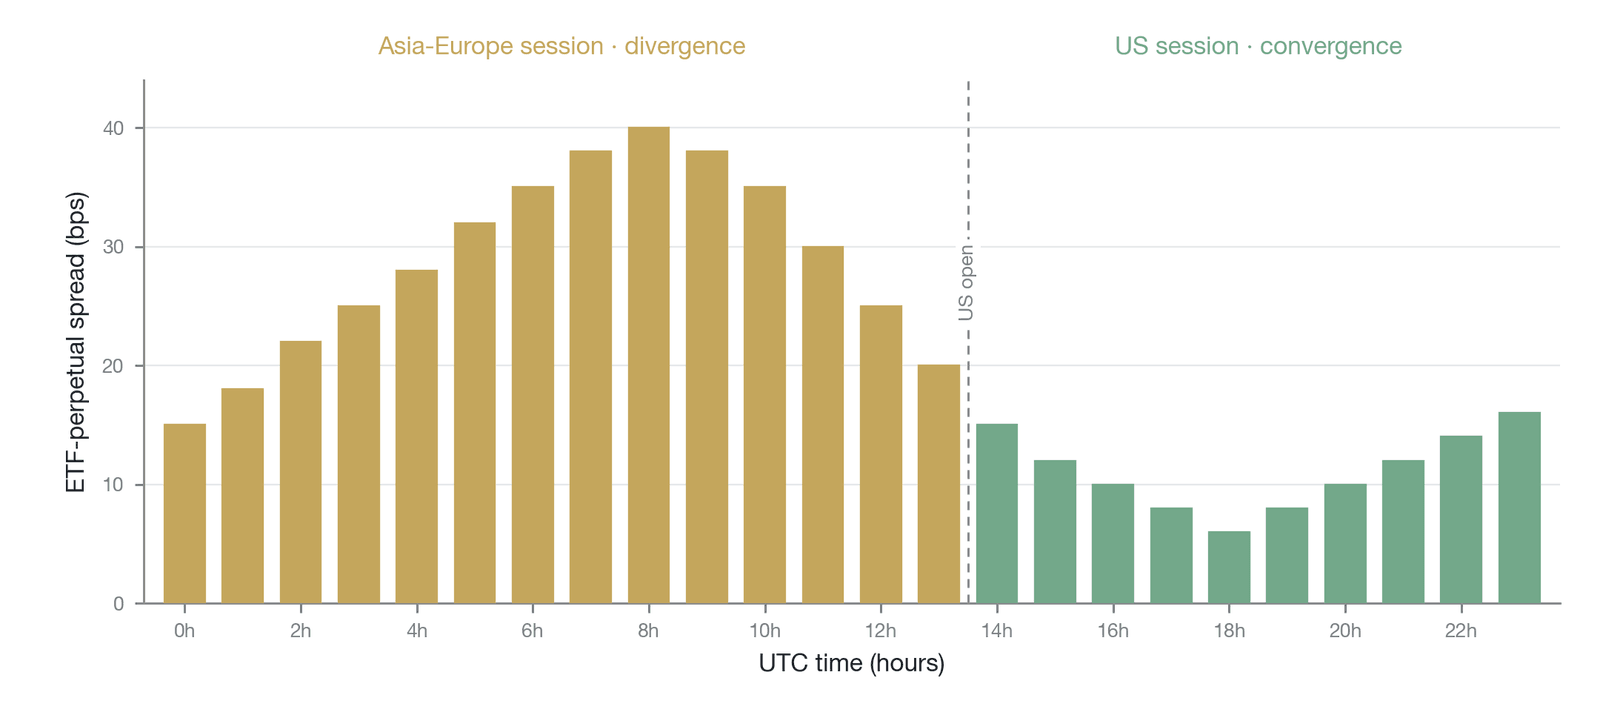
Figure 18-13. The intraday cyclicality of the spread between the ETF and offshore perpetual futures (historical period 2024–2025; illustrative/simulated, with the shape based on historical characteristics; note: CME crypto futures switched to 24/7 round-the-clock trading in late May 2026, and the weekend and overnight gap structure is being eroded, but the session mismatch caused by the spot ETF trading only during U.S. equity hours still exists)
With intraday time on the horizontal axis, Figure 18-13 shows the cyclical fluctuation of the spread between the ETF's net asset value and the offshore perpetual futures price: during the U.S. session (roughly 14:30 to 21:00 UTC), both markets are open and arbitrage is active, so the spread narrows to a low level; after the Asian and European sessions begin, because the ETF market is closed while perpetual futures continue trading, the spread widens to its intraday peak (about 40 bps) in the middle of the Asia-Europe session and then gradually converges as the U.S. equity open approaches. This clear "converge by day, diverge by night" pattern is a direct mapping, along the spread dimension, of the institutional factor of the two markets' session mismatch.
Examined through the constraint–anomaly framework, this "dual-track pricing" is a typical case of multiple structural constraints acting together. Regulatory segmentation (the seventh dimension) is its most fundamental cause, directly dictating that the two systems cannot simply be treated as "the same market." The session mismatch and the delay in the settlement mechanism constitute the enormous execution risk and time cost that arbitrageurs face. Even if an arbitrageur sees a significant discount of the perpetual futures relative to the ETF price during the Asian session, they cannot immediately buy the perpetual futures and lock in a profit by selling the ETF, because the ETF market is not yet open. They must bear hours of overnight risk and wait until the U.S. market opens to complete the hedge. Here we must distinguish the differing constraints faced by different types of arbitrage participant and make an important correction to the related session arithmetic. For ordinary investors and non-authorized participants, the constraint is as described above: they must wait for the ETF secondary market (on the NYSE, with a session of 9:30 a.m. to 4:00 p.m. ET, about 6.5 hours) to open before completing the hedge. For ETF authorized participants (APs), however, arbitrage can be executed through the primary market's creation/redemption mechanism and hedged in the CME futures market. CME Bitcoin futures historically traded about 23 hours per day (Sunday 17:00 to Friday 16:00 CT, with an approximately 60-minute maintenance window each trading day), not the "about 18 hours" often cited previously; therefore, for APs, the true structural session gap against the 24-hour continuous trading of perpetual futures was about 1 hour, not about 6 hours. More important is the timeliness update: as of May 2026, CME has shifted to near-24/7 continuous trading (with only about 2 hours of maintenance on Saturday), the session mismatch between CME and perpetual futures has been essentially eliminated, and this channel no longer constitutes a substantive constraint for APs. On balance, the main body of this section's "session mismatch" argument should rest on the mismatch between the ETF secondary market for ordinary investors and non-authorized participants (the NYSE's 6.5-hour cash session) and the 24-hour continuous trading of perpetual futures—this "overnight void" outside the roughly 6.5-hour window is the true source of the current structural gap. It is precisely the existence of this risk exposure that makes arbitrage trades for secondary-market participants attractive only when the spread is large enough to compensate for the overnight risk.
The new fissure of the ETF era is therefore a structural anomaly still taking shape. It is not a temporary market failure but the inevitable product of institutional friction among different jurisdictions and market architectures as the global financial system takes in a wholly new, borderless digital asset. Unless a major institutional change occurs in the future—such as a 24-hour-trading ETF or the establishment of a globally unified clearing system for crypto assets—this onshore-offshore "dual-track pricing" pattern will persist over the long run. It will become a new arena of contest for macro traders and cross-market arbitrageurs and offers us a continually evolving, information-rich case for observing how two financial paradigms interact, compete, and merge.
18.7 CEX–DEX anomalies
Among the six major anomalies of the perpetual futures market, the efficiency gap between centralized exchanges (CEXs) and decentralized exchanges is perhaps the most structural. It reveals not only the vast microstructural difference between two different market architectures but also a fundamental question: does decentralization necessarily entail a loss of efficiency? This section analyzes the systematic deviations between CEXs and DEXs in price discovery, funding rates, and arbitrage opportunities. We argue that these anomalies stem partly from the limitations of the current DEX technology stack—such as oracle latency and high gas costs—which are "early-stage technical limitations" that can be gradually mitigated through technological iteration. Another part of the anomalies, however, is rooted in the intrinsic properties of decentralized architecture, such as the unavoidable physical latency of on-chain transactions. This constitutes what we call the "structural arbitrage residual," an efficiency lower bound that seems impossible to eliminate entirely under the current technological paradigm. The distinctiveness of the CEX–DEX anomaly therefore lies in the fact that it displays, at once, the market's room for improvement and the fundamental efficiency cost that decentralization must pay.
18.7.1 Oracle latency and persistent spreads
The most intuitive anomaly between CEXs and DEXs is the price difference that persists for the same asset across the two markets. Academic research has quantified the significance of this gap. For example, Barbon and Ranaldo (2021) find that high and unstable on-chain gas fees impose significant costs on DEXs, especially for small trades, directly producing persistent arbitrage deviations [11]. This spread is not random noise but has a clear "information lag" feature: when the CEX price, the primary source of information, fluctuates violently, the CEX–DEX spread widens significantly, whereas in calm markets the spread converges. Empirical research on crypto markets shows that CEXs dominate in price discovery and that information flows in one direction from CEXs to DEXs [2], clearly indicating that the DEX price-discovery process is to some extent "anchored" to CEXs but with a pronounced lag.
The core source of this latency is the sixth-dimension constraint discussed in Chapter 17—smart-contract risk—which here takes the concrete form of the physical latency of oracles. Most DEX perpetual futures protocols, such as GMX, rely on oracles to fetch prices from CEXs or other off-chain data sources. This "fetch-broadcast-confirm" process inherently involves a time lag. As related research points out, even a 1-second delay can have large economic consequences in a violently fluctuating market [12]. For example, during an extreme market crash, the price of a major asset may move by more than 0.1% per second. For a $1 million position, a 1-second delay means more than $1,000 of potential risk exposure. This latency creates nearly risk-free profit opportunities for arbitrageurs, who monitor the spread between CEXs and DEXs and trade on stale price information on the DEX, systematically extracting returns from the protocol or ordinary users.
Figure 18-14 lays out several key dimensions of oracle latency: the top-left panel compares the typical oracle latency of different blockchains (ranging from Solana's sub-second level to the Ethereum mainnet's dozen-plus seconds); the top-right panel shows the magnitude of price deviation caused by oracle latency under different market environments, highlighting the severity of latency in high-volatility periods; the bottom-left panel characterizes the relationship between slippage and trade size, showing that slippage cost grows convexly with trade size (about a hundred-odd dollars for a $1 million trade, rising to about $2,000 at the $10 million level); and the bottom-right panel compares the vast difference in execution latency between DEXs of different architectures and CEXs, revealing the source of the efficiency gap.
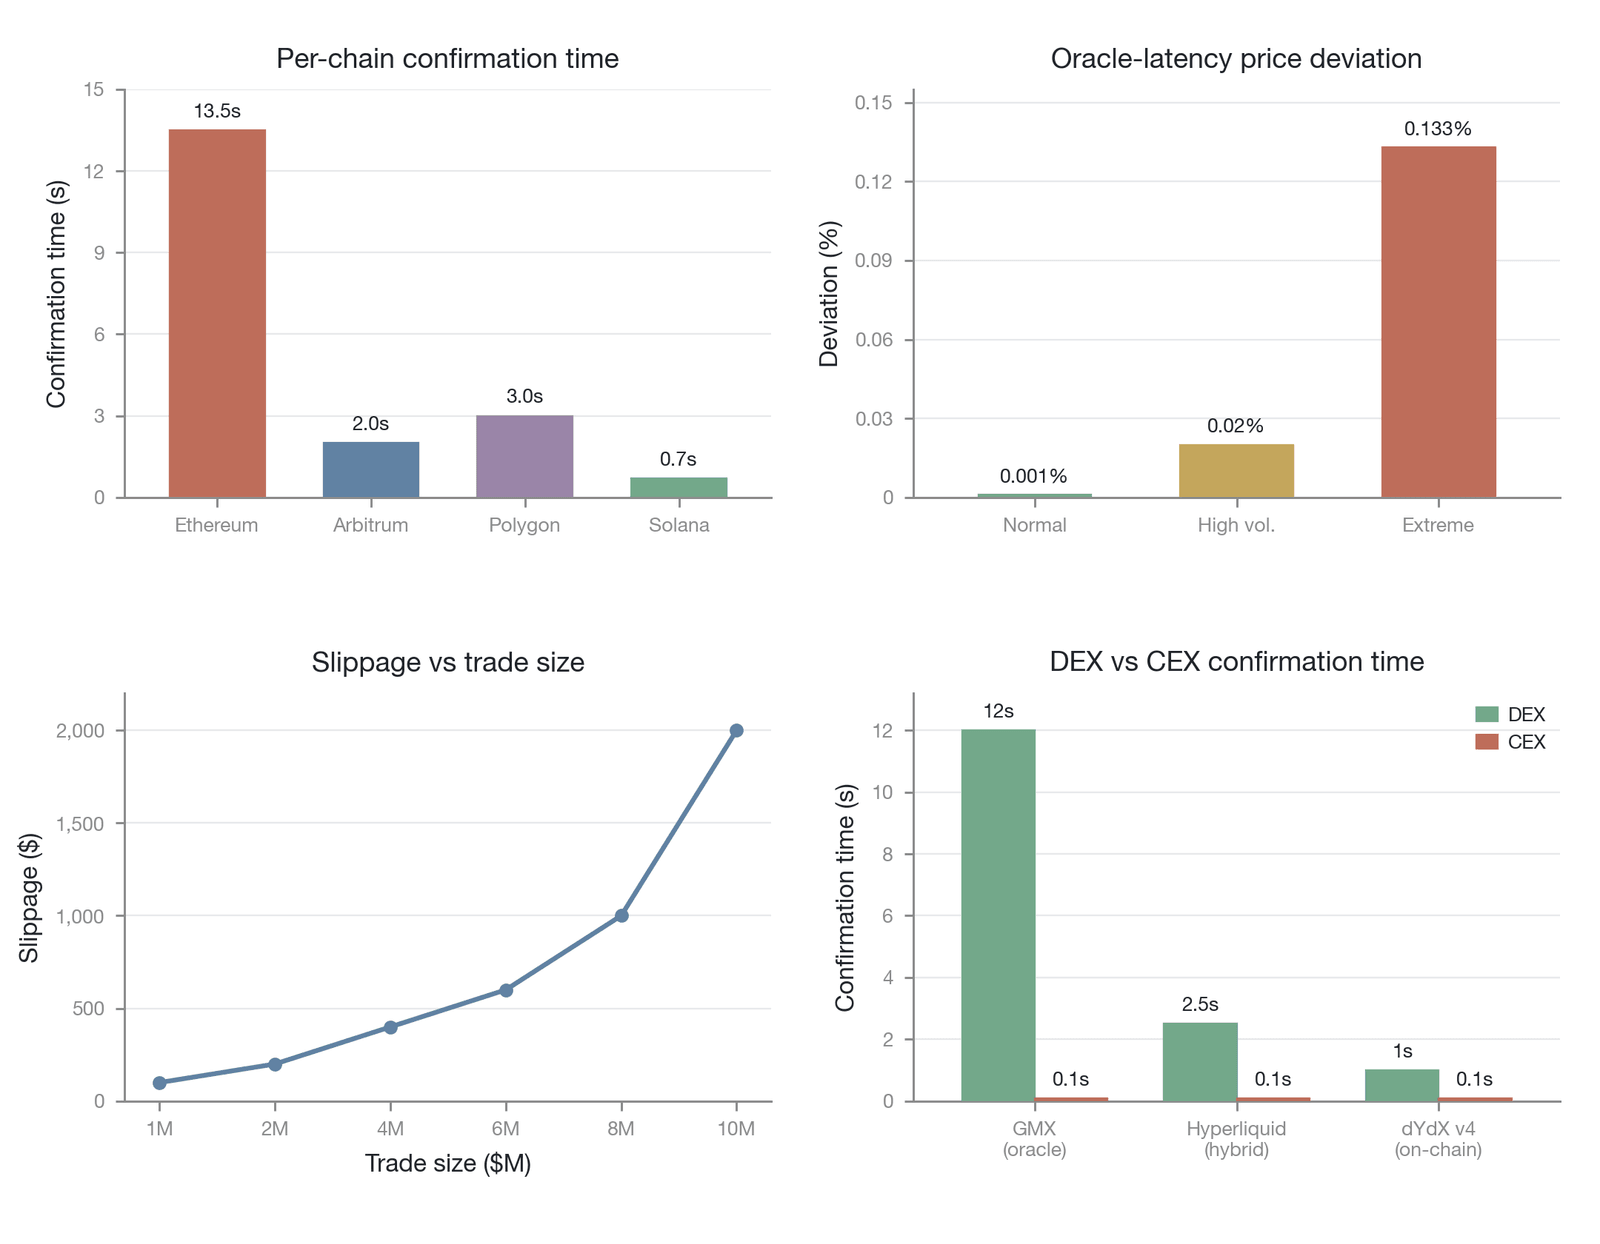
Figure 18-14. The multidimensional impact of oracle latency on DEX price discovery (Data source: constructed by the author; the per-chain latency and other values in the figure are representative orders of magnitude and, because of differing conventions—push/heartbeat versus pull/on-demand—are not measurements against a unified benchmark)
In analyzing oracle latency, it is necessary to distinguish two oracle-failure modes with starkly different economic consequences. The first is a passive stale price, in which the oracle has not yet updated to the latest price, creating a predictable, symmetric arbitrage window—the typical problem faced by protocols using Chainlink quotes, such as GMX. The second is active oracle manipulation, in which an attacker deliberately moves the index price by trading in a low-liquidity reference market and then extracts value on the DEX using the distorted oracle quote. The Mango Markets incident of October 2022 (a loss of about $116 million per the SEC's charging figure; different sources place it in the $110 million–$117 million range) is a typical case of the latter. Passive latency produces symmetric arbitrage opportunities, whereas active manipulation causes one-directional protocol losses, and the two contribute to the "structural arbitrage residual" through different mechanisms.
Oracle latency is not the only structural constraint DEXs face. Maximal extractable value (MEV) is another important factor that amplifies the CEX–DEX spread [13], and subsequent research has systematically quantified the scale of on-chain extractable value [14]. In the DEX environment, there is a "pending" window between a transaction's submission and its final confirmation, during which validators or searchers can extract value by reordering, inserting, or censoring transactions. Sandwich attacks (inserting buy and sell orders before and after a user's trade to capture the spread) and front-running (racing to execute a same-direction trade after observing a large order) are the most common forms of MEV. These behaviors have a dual effect: on one hand, they directly increase the implicit trading cost for DEX users; on the other hand, they compound with oracle latency: when the oracle price lags the CEX price, MEV searchers exploit this information gap to conduct toxic arbitrage on the DEX, and this toxic arbitrage in turn indirectly weakens the DEX's market-making depth by depleting liquidity providers' funds. This vicious cycle makes MEV an important component of the structural arbitrage residual, and especially during on-chain congestion and high volatility, its impact may be comparable to or even greater than that of oracle latency.
The persistent spread between CEXs and DEXs can therefore be regarded as a direct, observable economic consequence of technical constraints such as oracle latency and MEV. It fully embodies the "constraint–anomaly mapping" framework: how a definite technical bottleneck (a constraint) translates directly into a persistent market anomaly. In terms of persistence, this is an anomaly with both cyclical and structural properties, and it is precisely a clear demonstration of the point stressed in Section 18.1.3 that "the spectrum is non-exclusive and the same broad category of anomaly can possess multiple properties." On one hand, as Layer 2 solutions and dedicated appchains rise, oracle latency is being compressed significantly, meaning that the "average level" of the spread will narrow with technological progress (the improvable component of the structural property); on the other hand, as long as DEXs rely on external information inputs or are subject to the physical time of on-chain confirmation, this latency cannot be eliminated entirely, forming an ineliminable structural efficiency lower bound.
18.7.2 The systematic deviation of DEX funding rates
Beyond price itself, CEXs and DEXs also show systematic deviation in the core mechanism of perpetual futures—the funding rate. As noted above, funding-rate arbitrage is supposed to "level" the rate across different markets. Between CEXs and DEXs, however, the efficiency of this arbitrage mechanism is markedly reduced. Empirical data show that the funding rate of DEX perpetual futures is not only far more volatile than that of CEXs but also often differs significantly from CEXs in its mean. Some studies even find that a simple funding-rate arbitrage strategy on a DEX (for example, shorting on a DEX with a persistently positive rate while going long on a CEX to hedge the risk) can earn an annualized return as high as 30%–40% (this figure comes mainly from the high-volatility period of DEX funding rates in 2022–2023 and had compressed significantly by 2024–2025). It is inaccurate, however, to treat this return as a signal of a "risk-free arbitrage opportunity." Applying the analytical framework established in Section 18.1.1, a considerable part of the CEX–DEX rate spread is in fact reasonable compensation for a basket of DEX-specific risks: the unhedgeable risk of smart contracts, the possibility of oracle manipulation, the security hazards of cross-chain bridges, and the regulatory-classification uncertainty that DEX protocols face. The 30%–40% return should therefore be understood, more accurately, as the composite risk premium for these risks, not as a signal of pure arbitrage failure. Only when the return significantly exceeds the reasonable compensation level for these risks does the excess portion constitute a genuine anomaly driven by arbitrage constraints.
The roots of this rate deviation are manifold. First, there are differences in the rate-calculation mechanism. Different DEX protocols adopt different funding-rate formulas and parameters (such as the interest-rate composition and the way the premium index is computed) and different settlement cycles (for example, Hyperliquid's hourly settlement versus most CEXs' 8-hour settlement), which provides an "institutional basis" for rate differences. Second, there are differences in participant composition. CEXs have a vast retail base and mature institutional market makers, whereas the early users of DEXs are more often high-risk-seeking "DeFi yield-strategy participants" and professional arbitrageurs, and this difference in participant structure produces a systematic difference in the balance of long and short forces. Finally, and most critically, there is the substantial friction of cross-chain execution. Effective funding-rate arbitrage between a CEX and a DEX requires deploying funds, monitoring positions, and executing trades in two entirely different systems. This entails not only higher operational complexity, smart-contract risk, and potential cross-chain-bridge risk but also far lower margin utilization efficiency than arbitrage within a single CEX. Acting together, these constraints greatly limit the scale and efficiency of arbitrage capital, allowing the rate gap between CEXs and DEXs to persist over the long run.
Figure 18-15 shows the concrete manifestations of the CEX–DEX anomaly in spreads and funding rates: the top-left panel presents the typical level of the CEX–DEX spread under different market states (from 10 bps in a normal market to more than 100 bps in a crisis); the top-right panel simulates the paths of CEX and DEX funding rates over a period, between which a clear and persistent deviation exists; the bottom-left panel compares the "efficiency lower bound" of different DEX architectures—the minimum arbitrage residual determined by their architecture; and the bottom-right panel quantifies how arbitrage profit scales with trade size.
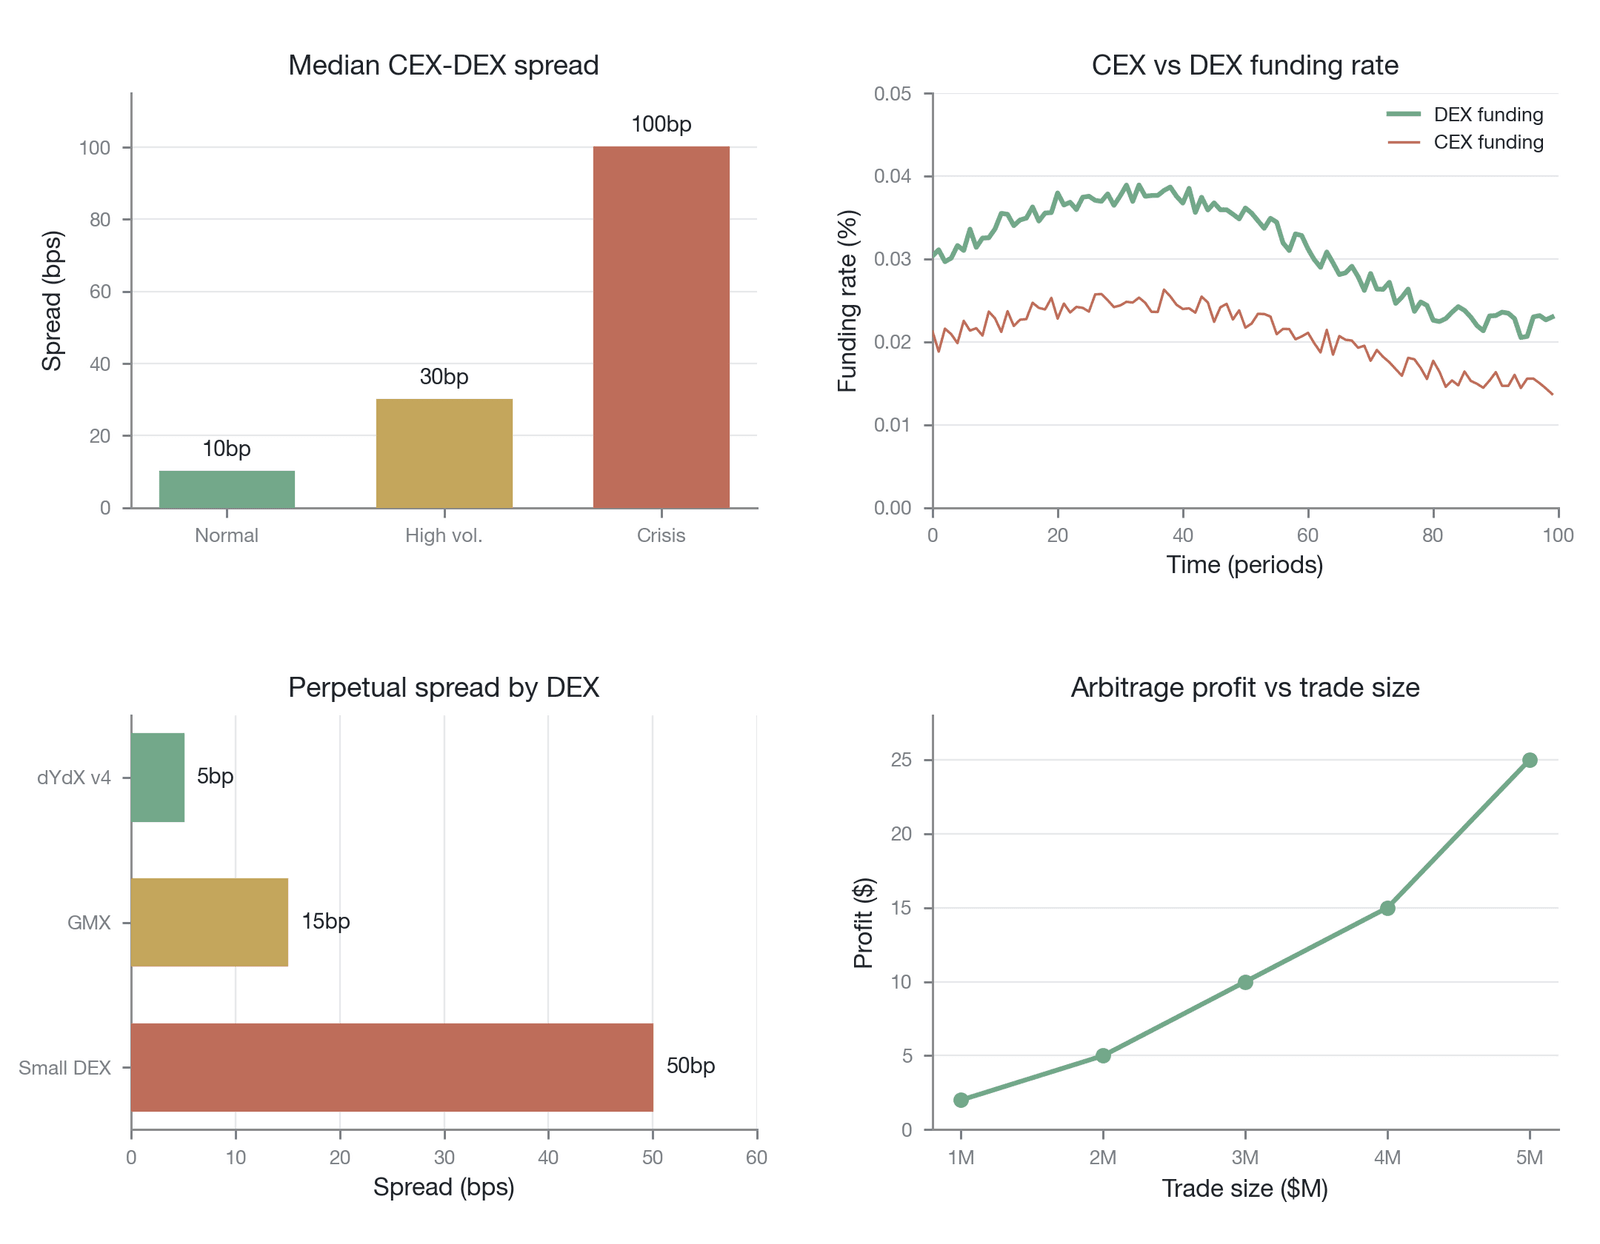
Figure 18-15. The systematic deviation of the CEX–DEX spread and funding rate (Data source: simulated data constructed by the author)
Compared with the rate splitting among CEXs (Section 18.3.4), the rate splitting between CEXs and DEXs is larger in magnitude and more fundamental in its constraint sources. The former stems mainly from institutional constraints such as margin and platform risk, whereas the latter is compounded by deeper technical constraints such as oracles, smart contracts, and cross-chain execution. The systematic deviation of DEX funding rates can therefore be regarded as a highly sticky structural anomaly produced by the combined action of multiple constraints.
18.7.3 The structural arbitrage residual
If oracle latency is a technical problem that "can be optimized," is there an unoptimizable, fundamental efficiency lower bound of decentralized architecture? The answer seems to be yes. This brings us to the core concept of this section, the "structural arbitrage residual." Its core idea is that even under the most ideal DEX design, the final confirmation of a transaction takes time. Whether relying on oracle updates or matching directly on an on-chain order book, there is a physical minimum time interval from the generation of a trading intention to its becoming irreversible on the blockchain. This interval, however brief, creates a "minimum arbitrageable window" for arbitrageurs.
Within this window, the price in the external world may already have changed while the on-chain state has not yet updated. Any arbitrage attempting to exploit this instantaneous spread must itself go through a "submit-package-confirm" on-chain process. This means that arbitrageurs are forever chasing a price change that has already occurred, and this chase itself involves a delay. There will therefore always be a spread small enough that the expected return of the arbitrage trade is insufficient to cover its execution costs (gas fees, time cost, failure risk, and so on). This spread, which cannot be eliminated entirely by arbitrage, is the "structural arbitrage residual."
Different DEX architectures have different "efficiency lower bounds" or "structural arbitrage residuals." As shown in Table 18-7, we can construct a clear hierarchy. The latency of an oracle-dependent DEX (such as GMX) is the sum of the oracle update frequency and the underlying chain's confirmation time; its latency is the longest, so its efficiency lower bound is the highest and its residual the largest. An on-chain order-book DEX (such as Hyperliquid), by placing the order book on a high-performance dedicated blockchain, frees itself from reliance on external oracles, and its latency comes mainly from the block time of its own network, giving it a middling efficiency lower bound. An appchain DEX (such as dYdX v4), by building a dedicated blockchain for a single application, can compress latency to the extreme, approaching the level of a centralized server; even so, however, its transaction confirmation must still be completed through distributed consensus, which means the latency remains nonzero. Its efficiency lower bound is the lowest of all DEXs, but it still exists.
| DEX type | Representative project | Source of latency | Degree of decentralization | Efficiency lower bound |
|---|---|---|---|---|
| Oracle-dependent DEX | GMX | Oracle update frequency + underlying-chain confirmation time | High (relies on Ethereum/Arbitrum consensus) | Highest (largest residual) |
| High-performance order-book DEX | Hyperliquid | Block time of its own network | Medium-low (HyperBFT, small validator set) | Lower |
| Appchain DEX | dYdX v4 | Distributed-consensus confirmation time | Medium (Cosmos SDK validator set, off-chain matching + on-chain settlement) | Low (but still nonzero) |
| Centralized exchange (reference) | Binance, OKX | Centralized-server matching | None | Approaching zero (sub-millisecond) |
Table 18-7. Sources of latency and efficiency lower bounds for different DEX architecture types (Data source: constructed by the author from public market data and the literature)
Table 18-7 systematically compares the current mainstream DEX architecture types by source of latency and efficiency lower bound, using centralized exchanges as a baseline reference. From oracle-dependent DEXs (such as GMX) to on-chain order-book DEXs (such as Hyperliquid) to appchain DEXs (such as dYdX v4), the source of latency gradually narrows from the dual bottleneck of "oracle update + chain confirmation" to the single bottleneck of "distributed-consensus confirmation" alone, and the efficiency lower bound decreases accordingly. Even the appchain architecture with the lowest efficiency lower bound, however, still has latency significantly higher than the sub-millisecond matching speed of centralized exchanges, indicating that an ineliminable structural residual always exists. The "degree of decentralization" column newly added to Table 18-7 reveals an important finding: the DEX with the lowest efficiency lower bound at present (such as Hyperliquid) is precisely a DEX with a relatively low degree of decentralization, one that, through a small validator set under HyperBFT consensus (with a relatively concentrated number of validators and staking distribution), substantially approaches the speed of centralized matching. This observation in fact strengthens the argument for the efficiency-decentralization trade-off: under current technological conditions, approaching CEX execution efficiency on a DEX architecture seems to require a significant compromise in the degree of decentralization.
This "nonzero" residual has important theoretical implications. It clearly shows that decentralization has a cost. Here we must distinguish two related but different trade-offs. The blockchain trilemma proposed by Buterin (decentralization, security, scalability) describes a design constraint at the level of underlying infrastructure. This chapter's analysis reveals an independent trade-off along the dimension of financial-market pricing efficiency: the fundamental tension between efficiency and decentralization. The latter is not a mere restatement of the former but shifts the perspective from the design space of technical architecture to the efficiency boundary of market microstructure. In this efficiency-decentralization trade-off, a CEX, by sacrificing decentralization and concentrating trust in a single entity, achieves sub-millisecond execution speed; a DEX, in order to achieve trustless, censorship-resistant trading, must accept the physical latency imposed by distributed consensus. The ineliminable "structural arbitrage residual" between CEXs and DEXs is precisely the quantifiable expression of this fundamental trade-off in market prices.
From the perspective of the persistence spectrum, therefore, this residual is a highly persistent structural anomaly under the current technological paradigm. It cannot be eliminated by simple technical upgrades unless the core value proposition of decentralization is abandoned. Understanding this is essential for viewing the development of DEXs objectively, assessing their competitive relationship with CEXs, and designing more effective market mechanisms. It tells us that pursuing complete DEX superiority over CEXs along every dimension may be an unrealistic goal; instead, genuine innovation lies in how to maximize the unique value that decentralization brings—such as self-custody of assets, transparent rules, and censorship resistance—while acknowledging and quantifying this efficiency cost. The qualifier "current technological paradigm" is essential, however. Emerging technical paths such as integrating trusted execution environments (TEEs) into validator nodes, encrypted mempools (such as Flashbots' SUAVE architecture), and commit-reveal schemes could in theory narrow this residual without abandoning decentralization, but these schemes themselves introduce new security assumptions and trust models whose effectiveness and safety have not yet been tested at scale in real-world conditions.
18.8 The crisis dynamics of anomalies
In the preceding sections, we have systematically examined the six categories of anomalies in the perpetual futures market. Under normal market conditions, these anomalies exist in relatively independent forms, their magnitude usually held within a controllable range by the force of arbitrageurs. The basis anomaly, the funding-rate anomaly, the cross-exchange anomaly, the cross-asset anomaly, the term-structure anomaly, and the CEX–DEX anomaly each reveal, along their own dimension, the boundary of market efficiency and the contours of arbitrage constraints. This relatively calm state, however, is not the whole truth of the market. When extreme stress arrives, the interaction among these seemingly independent anomalies intensifies, triggering a systematic pricing deviation that sweeps across the entire market.
The core argument of this section is that these anomalies do not amplify linearly in a crisis but display highly nonlinear, synchronously erupting dynamics. This is precisely the observable consequence, at the level of market price deviations, of the "risk resonance" model proposed in Chapter 17. When systemic risk is triggered and the seven-dimensional arbitrage constraints are activated simultaneously within a short time, arbitrageurs' capital and capacity are sharply weakened, and the market's arbitrage forces temporarily fail. As a result, all latent price deviations worsen sharply within the same time window and amplify one another, forming a synchronous eruption of anomalies that sweeps across all assets and platforms. This section examines this crisis dynamic, revealing—from the theoretical, empirical, and case levels—what unstable characteristics the market takes on when all deviations erupt simultaneously.
Before proceeding, an important methodological statement is needed up front to delimit the nature and boundaries of this section's argument. The crisis-contagion path presented in this section (the six-stage table in Section 18.8.2) and the single crisis case (the LUNA/UST episode of May 2022 in Section 18.8.3) are a theoretical-inference framework and a single-case illustration, constructed from market-microstructure theory and observed crisis patterns, and not a rigorous hypothesis test: the step-by-step causal relationships among the stages of the contagion path have not been verified one by one by independent empirical research, and the LUNA/UST case only illustrates the observable manifestation of the risk-resonance mechanism in one real crisis rather than constituting a statistical proof of the mechanism. In reading the contagion table (Table 18-8) and the case analysis that follow, therefore, readers should understand them as "a representative narrative consistent with the risk-resonance model" rather than "an established general regularity." The falsifiability condition of the risk-resonance mechanism can be stated as follows: if, in a class of crises satisfying the model's premises (a systemic shock is triggered and multiple constraint dimensions tighten simultaneously), the anomalies of the various dimensions do not worsen in synchrony and cross-asset correlation does not break down, then the model does not hold for that class of cases. The goal of this section is to make this mechanism concrete as observable changes in indicators and to state clearly that it awaits testing through multi-case comparison.
18.8.1 The nonlinear amplification of anomalies
In theory, the nonlinear amplification of anomalies in a crisis is a direct consequence of the collapse of arbitrage capacity. In a normal market, arbitrage capital is ample, and the various arbitrage strategies (such as basis arbitrage, rate arbitrage, and cross-exchange arbitrage) serve as effective regulating mechanisms that keep price deviations within a narrow channel composed of transaction costs and risk premiums. When a systemic shock occurs (for example, a major macro event or the collapse of a core protocol), however, the risk-resonance mechanism described in Chapter 17 is activated. Here it is necessary to distinguish two types of shock that differ in their contagion dynamics. Endogenous crypto-native shocks (such as the LUNA collapse and the FTX bankruptcy) transmit primarily through the intra-chain contagion path described above, characterized by outward spread from a specific asset or platform. Exogenous macro shocks (such as a Fed rate surprise or the SVB bank run) strike the entire market simultaneously through the dollar-liquidity channel and often cause CEX and DEX pricing to deviate in synchrony before any intra-chain contagion even occurs. The six-stage path modeled in Section 18.8.2 is more applicable to the former; for the latter, the shock's entry point and propagation sequence may differ significantly. Constraints across multiple dimensions—liquidity, margin, platform risk, and smart-contract risk—tighten simultaneously, arbitrageurs' capital is depleted by losses, their risk exposure expands as hedges fail, and their capacity for market repair declines sharply (superlinearly) within a short time.
This nonlinear collapse of arbitrage capacity directly causes the nonlinear amplification of anomalies. Once a price deviation exceeds a certain critical point, it is no longer effectively suppressed and may instead trigger a positive feedback loop. For example, a widening basis may trigger the liquidation of more leveraged positions, and the liquidations themselves widen the basis further. To capture this regime transition from calm to storm conceptually, one can envisage constructing a "composite anomaly index" as a diagnostic tool. The idea of the index is this: standardize the proxy indicators of the six categories of anomaly described above (for example, the absolute value of the basis, the absolute value of the funding rate, and the spread among leading exchanges) and then take a weighted average, yielding a single indicator that measures the market's overall "degree of deviation." This chapter does not actually construct and estimate this index, however: the precise definition of each proxy indicator, the standardization method, the source of the weights, the sample period, and the actual values in crisis periods all await determination by dedicated research, so it is here only a constructible diagnostic-indicator concept, not a completed empirical measurement. Under this concept, the risk-resonance model predicts that the index should fluctuate within a narrow band around a low mean under normal conditions but may experience a nonlinear "jump" during a crisis, with a magnitude far exceeding the standard deviation of normal fluctuation; if this jump were actually observed, it could serve as a candidate signal of the market's transition from a "normal state" to a "crisis state."
18.8.2 The contagion path among anomalies
The eruption of anomalies in a crisis does not occur independently but spreads through complex paths, forming a self-reinforcing network. A crisis usually begins with the sharp worsening of an anomaly in one dimension, but its impact transmits rapidly, within minutes, to all other dimensions through arbitrageurs' linked positions and the market's intrinsic connections. Understanding these contagion paths is the key to understanding crisis dynamics. The contagion path presented in the table below is a theoretical-inference framework constructed from market-microstructure theory and observed crisis patterns; the step-by-step causal relationships among its stages have not been verified one by one by rigorous empirical research, but the overall logic is highly consistent with the observations of historical cases such as LUNA/UST.
| Contagion stage | Trigger mechanism | Direction of contagion | Concrete manifestation |
|---|---|---|---|
| Stage 1 | External shock triggers mass selling | Shock → basis | Perpetual futures price plunges, producing a large negative basis |
| Stage 2 | Negative basis causes losses on basis-arbitrage trades | Basis → closing of basis-arbitrage trades | Arbitrageurs are forced to sell spot and buy perpetual to stop losses |
| Stage 3 | Large-scale closing depletes liquidity | Basis-arbitrage closing → liquidity | Bid-side depth plunges, slippage costs surge |
| Stage 4 | Liquidity evaporation obstructs cross-exchange arbitrage | Liquidity → cross-exchange spread | Prices on different exchanges run independently, the law of one price breaks down |
| Stage 5 | Extreme long-short imbalance | Liquidity → funding rate | The funding rate is pushed to an extreme negative value, intensifying long liquidations |
| Stage 6 | Indiscriminate selling pressure | Deleveraging → cross-asset correlation | All assets are sold off, and correlation shifts from highly positive to disordered |
| Feedback loop | Hedge failure amplifies overall risk | Cross-asset → basis | Altcoin crashes force the liquidation of BTC hedge positions, intensifying basis deviation |
Table 18-8. The contagion stages and paths of anomalies in a crisis (Data source: compiled by the author)
Table 18-8 presents how anomalies spread through a positive-feedback-loop network in a crisis: an external shock first tears open a gap in the basis dimension (the perpetual futures price plunges and the negative basis widens sharply), then transmits stage by stage within minutes along the chain "basis arbitrage forced to close → liquidity evaporation → cross-exchange spread breaks down → funding rate goes to extremes → cross-asset correlation collapses," with the worsening of each link in turn aggravating the previous one, finally closing into a self-reinforcing positive feedback loop (the trigger mechanism, direction of contagion, and concrete manifestation of each stage are detailed in Table 18-8). The key to this loop is its self-amplification: the collapse of correlation further increases the difficulty of portfolio hedging, amplifies overall market risk, and feeds back to the basis once more—for example, a fund may be forced to liquidate its BTC hedge position because its altcoin positions have crashed, thereby intensifying volatility and basis deviation in the BTC market.
The six-stage path above presents an idealized linear cascade; contagion in a real crisis often proceeds through multiple channels simultaneously. In the LUNA/UST episode, the stablecoin depegging simultaneously struck DEX liquidity pools (such as the violent rebalancing of the Curve 3pool) and the liquidation engine of the perpetual futures market, and these two channels did not transmit in stage order. Moreover, the table above omits an independent contagion channel that was dominant in the FTX and Celsius/Voyager crises: an exchange freeze or bankruptcy that locks up user funds forces arbitrageurs to close cross-exchange hedge positions urgently at distorted prices on other platforms, and this "capital-freeze channel" can be triggered before or simultaneously with Stage 1, independently of organic market selling.
The contagion in this process is extremely fast, often completed within minutes. It reveals an important conclusion: market anomalies are not isolated events but an interconnected system. The collapse of one link can, through arbitrageurs' balance sheets and the market's microstructure, quickly escalate into a full-blown systemic crisis.
18.8.3 Case: the LUNA/UST crisis of May 2022
The exposition of theory and models needs to be illustrated with real-world cases. The LUNA/UST collapse of May 2022 [4][15] offers us a single-case illustration for observing the crisis dynamics of anomalies. The methodological statement at the head of this section bears repeating: the following analysis is a descriptive examination of one real crisis, used to illustrate the observable manifestation of the risk-resonance mechanism in that event, and is not a hypothesis test of the mechanism; a single case cannot rule out competing explanations, and establishing "the synchronous eruption of the six categories of anomalies in a crisis" as a general regularity still requires a systematic cross-sectional comparison of multiple crises (such as the FTX bankruptcy and the SVB shock). The following analysis is based on the public market data of major exchanges such as Binance, OKX, Bybit, and CME during May 5 to 13, 2022, and the indicators examined include the perpetual futures basis, the funding rate, the cross-exchange spread, the rolling correlation coefficient, and the CEX–DEX spread. Within just a few days, this algorithmic stablecoin ecosystem—once worth tens of billions of dollars—collapsed completely, triggering one of the most violent market upheavals in crypto history. The event demonstrated how the six categories of anomalies discussed above worsen in synchrony within the same time window.
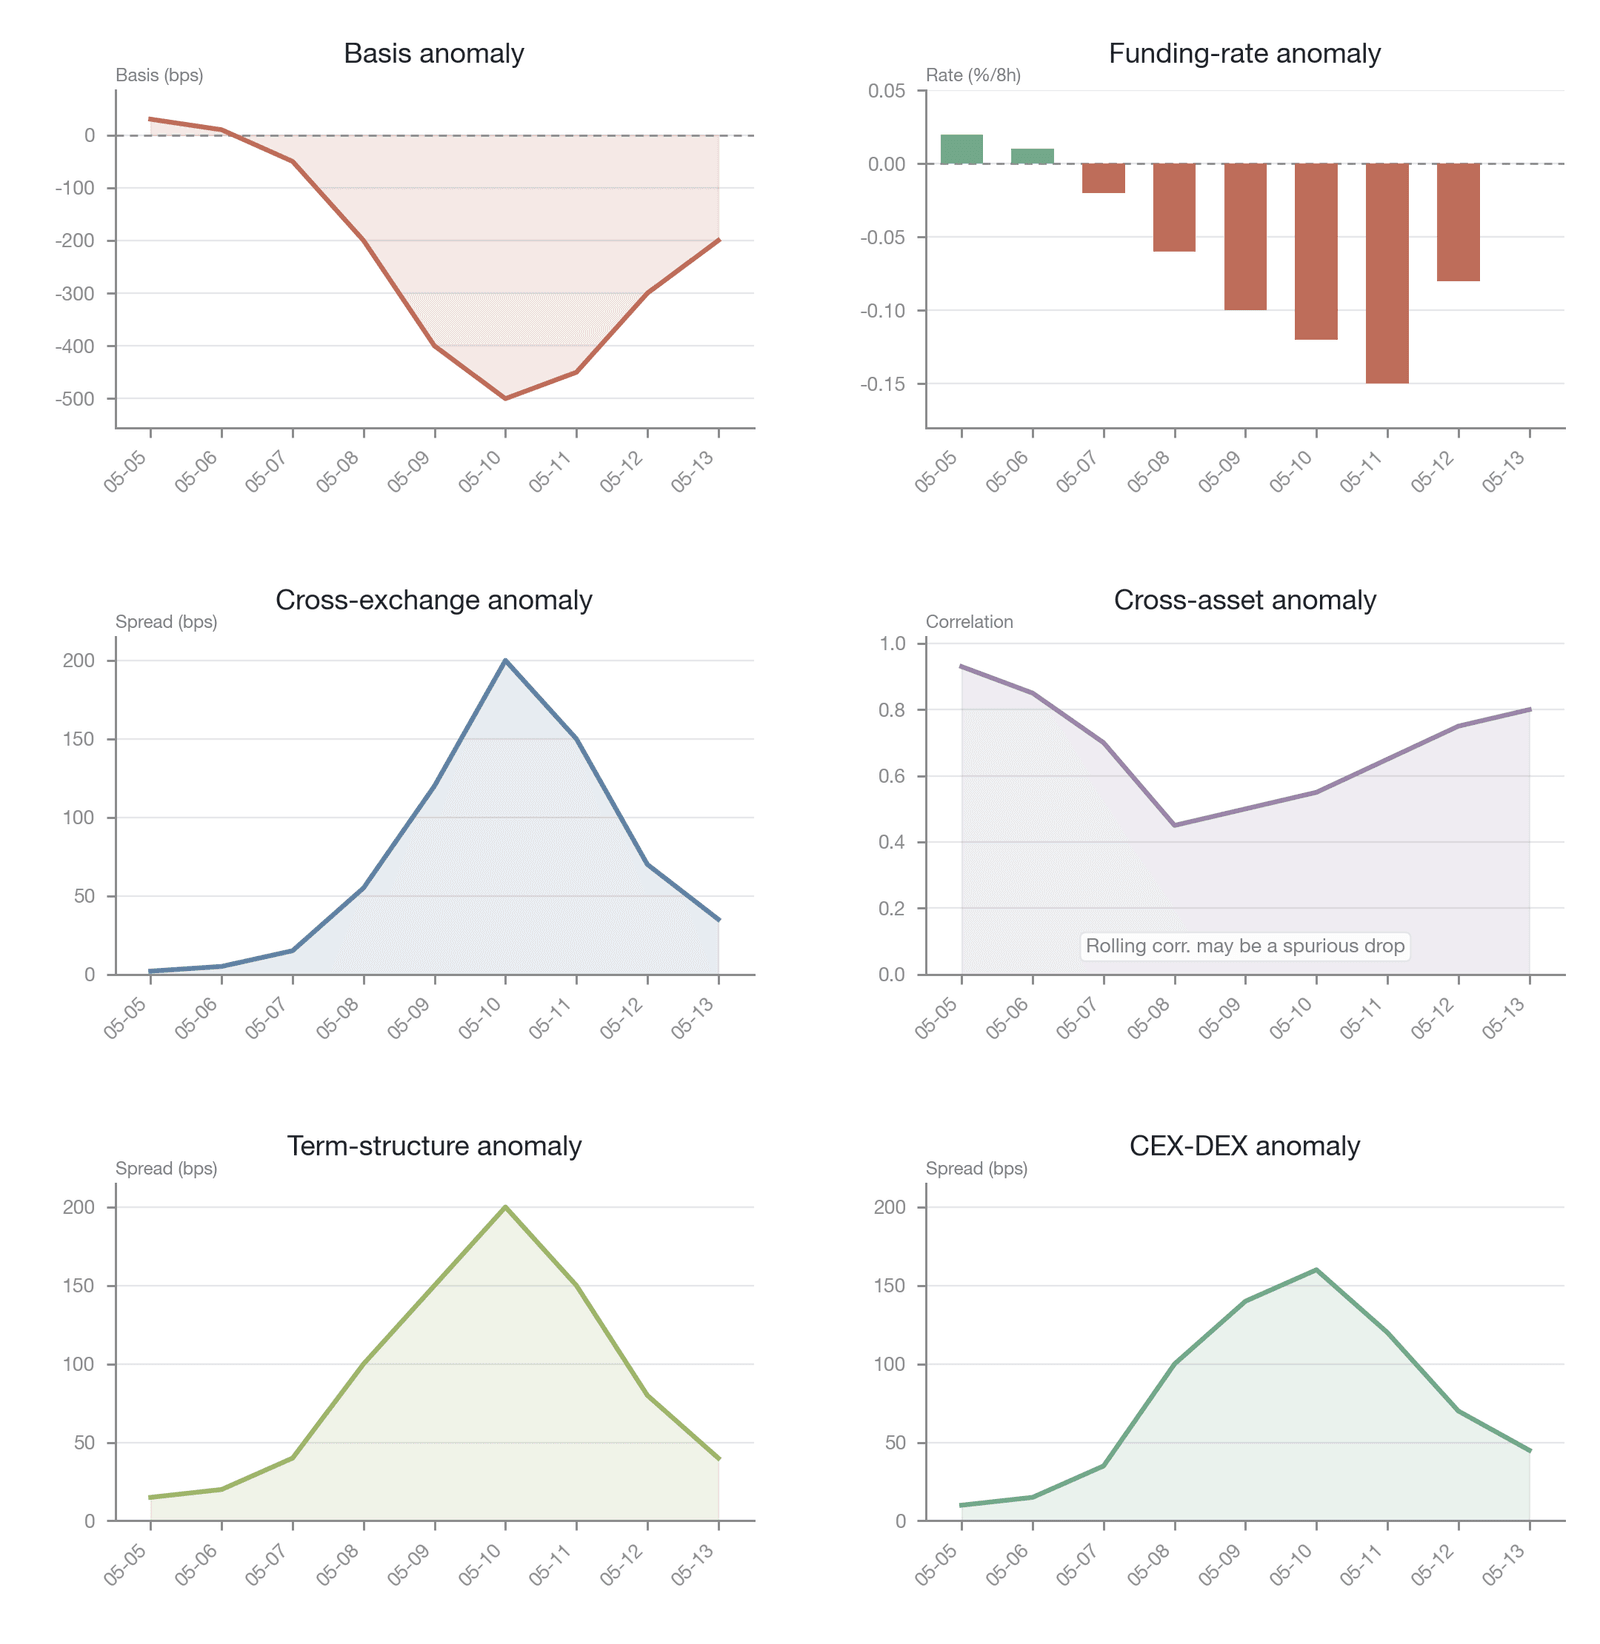
Figure 18-16. The synchronous eruption of the six categories of anomalies in May 2022 (illustrative/simulated: the data source is readings from historical Coinglass charts, and the specific basis-point values are reconstructed illustrative values rather than verifiable precise measurements; the cross-asset correlation panel may reflect a spurious decline under asynchronous price discovery and is illustrative only)
Figure 18-16 uses a multi-panel timeline to display the synchronous, drastic changes in the key indicators of the six anomalies during May 5 to 13, 2022. On the basis anomaly: before the crisis erupted, BTC perpetual futures maintained a positive basis of about 30 bps against spot; after the news of the UST depegging spread from May 8, it turned sharply negative, falling to a historic low of −500 bps on May 10 (data source: Coinglass). On the funding-rate anomaly: highly synchronized with the basis, it turned rapidly from about +0.02%/8h before the crisis to deeply negative, hitting an extreme level of −0.15%/8h on May 11, with the clustering effect of extreme negative rates emerging. On the cross-exchange anomaly: the BTC perpetual spread among leading exchanges widened from a normal 2–3 bps to more than 100 bps, peaking at 200 bps (tens of times the normal level), during the deepest phase of the crisis on May 10–11, and the market was split into relatively independent pricing zones. On the cross-asset anomaly: the correlation between BTC and ETH plunged from above 0.9 before the crisis to below 0.5 at the selling climax on May 10. (This correlation is estimated as the Pearson coefficient over a 24-hour rolling window, without bias correction and for illustration only: a rolling correlation coefficient may produce a spurious downward signal in a high-volatility environment because of asynchronous price discovery, changes in the volatility level, and the like, so the "plunge in correlation" above should be interpreted with caution; a more rigorous contagion test should use the bias-correction method proposed by Forbes and Rigobon (2002) [16] or the DCC-GARCH dynamic conditional correlation model of Engle (2002) [10]—this is a suggested direction for robust testing rather than a method already adopted in this section.) On the term-structure anomaly: the two curves that should converge—the CME dated-futures basis and the offshore perpetual futures implied rate (funding rate)—diverged enormously, with the spread surging from a normal dozen or so basis points to nearly 200 bps. On the CEX–DEX anomaly: the spread widened sharply from a normal 10–15 bps to more than 150 bps, exposing the cost of the DEX's oracle latency, on-chain congestion, and lower liquidity depth, which leave it unable to keep up with CEX pricing efficiency in extreme conditions.
In this single case, the six panels together sketch a consistent picture: in the second week of May 2022, multiple efficiency dimensions of the market came under severe stress almost simultaneously. All deviations were no longer small, controllable noise but a manifestation of systemic risk that worsened in synchrony and reinforced one another. The collapse of LUNA/UST, as a major shock event, saw its local impact ultimately escalate into a market-wide crisis. The observations above are consistent with the predictions of the risk-resonance model; but as a single-case illustration they can only support, not prove, its generality; whether their consistency with the model recurs robustly in other crises is an open question awaiting further empirical testing.
18.8.4 The asymmetry of eruption and repair
The final, and highly practical, feature of crisis dynamics is the pronounced asymmetry between the eruption and the repair process. As we saw in the May 2022 case, the full eruption of anomalies can be completed within a few hours, whereas the market's repair process takes weeks or even months. This asymmetry—"the eruption completes within hours, while the repair often takes weeks"—reveals how slowly market confidence recovers and how gradually capital is rebuilt.
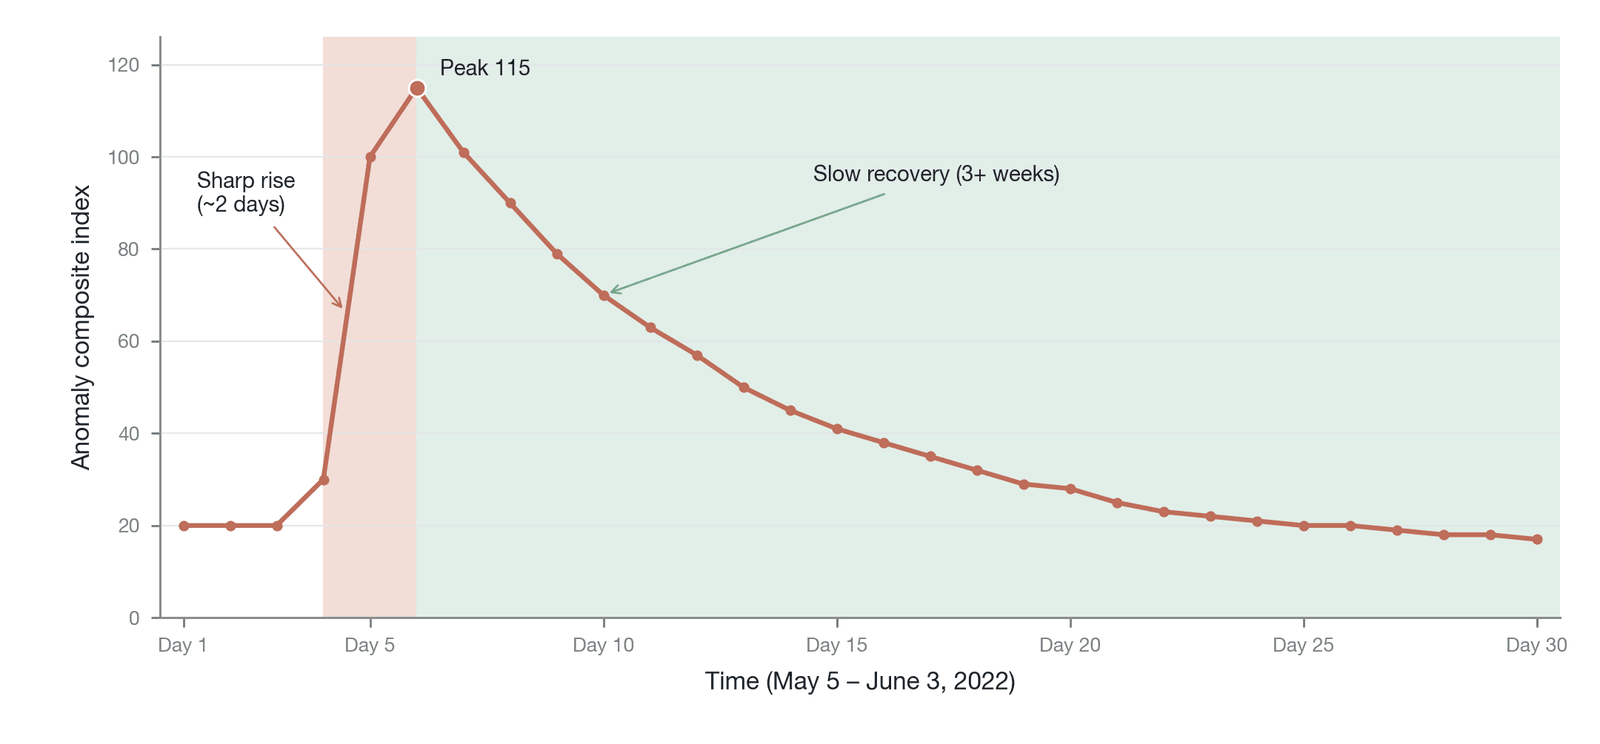
Figure 18-17. The eruption-repair asymmetry of the composite anomaly index (Data source: simulated data constructed by the author)
Through a simulated "composite anomaly index" time series, Figure 18-17 captures this asymmetry: the eruption phase of the crisis is steep and abrupt, with the index surging from a low level to its peak in a very short time. Behind this lies the positive feedback loop of risk resonance—liquidations trigger price declines, price declines trigger more liquidations, margin is depleted, and positions are forcibly liquidated, all completed in a very short time.
By contrast, the curve of the repair phase is gradual and drawn out. The market falls back from its peak far more slowly than it rose. This slow repair stems from its "rebuilding" nature, involving a gradual process at multiple levels. First is the rebuilding of capital: in a crisis, a large amount of arbitrage capital and market-maker capital is destroyed, and the remaining capital becomes extremely risk-averse because of severe losses, so new capital entering the market needs time to assess risk, raise funds, and build positions gradually. Second is the rebuilding of confidence: financial markets are built largely on confidence, and a violent crash severely damages investors' confidence in market stability, platform reliability, and even asset value itself; the recovery of confidence requires the market to display sustained stability over a period before participants restore their risk appetite. In addition, the repair speed of different anomalies diverges: anomalies that usually depend on high-frequency trading capability (such as the cross-exchange spread) repair first, because high-frequency trading firms can quickly redeploy their algorithms once the market stabilizes even slightly, whereas anomalies that depend on large-scale capital and lower risk tolerance (such as the basis and term-structure anomalies) take longer, and the capital-rebuilding and risk-assessment process of basis arbitrageurs and structural arbitrageurs is far more protracted after they suffer heavy losses.
This recovery ordering is not a universal rule, however; it depends on the nature of the crisis. In an organic market decline (such as deleveraging triggered by a macro shock), the cross-exchange spread does indeed repair first, thanks to the rapid redeployment of high-frequency arbitrageurs. In an exchange-bankruptcy crisis (such as the FTX episode), however, a large amount of arbitrage and market-making capital is locked on the bankrupt platform and cannot be withdrawn, and the recovery ordering may reverse entirely: the cross-exchange spread persists for weeks because arbitrage capital is frozen, while the basis anomaly instead recovers relatively quickly once liquidity normalizes on surviving exchanges such as CME and Binance. The more precise causal mechanism is the funding-liquidity constraint: high-frequency strategies need only intraday margin, so their funding constraint is loose, whereas basis arbitrage must lock up two-leg margin, so its funding constraint is tight; but when the capital of a specific platform is physically frozen, the distribution of the funding-liquidity constraint is fundamentally altered.
This asymmetry between eruption and repair has an important statistical implication: it systematically raises the long-run average level of market anomalies. Even if the market is in an efficient "normal state" for the overwhelming majority of the time, the few "crisis-state" periods and the long repair tails that follow significantly affect our overall assessment of market efficiency (if quantification is desired, the "crisis state" can be operationally defined as the share of days on which the aforementioned composite anomaly index exceeds a certain threshold, but this chapter does not measure that share, and the "overwhelming majority / few" here is an illustrative statement rather than a precise statistic). It reminds us that the market's efficiency loss is lasting and that the impact of one crisis takes a long time to be eliminated. Moreover, the post-crisis regulatory response is an important factor prolonging the repair period. Take the LUNA/UST collapse: the regulatory uncertainty produced by the subsequent enforcement actions (including the arrest warrant for Do Kwon and the SEC's securities-classification ruling on LUNA/UST) suppressed arbitrage capital's willingness to re-enter, constituting an external recovery resistance beyond market microstructure. This slow repair process itself constitutes an important source of the frictions and deviations that persist in the market over the long run.
18.9 The evolution of anomalies and implications for market design
The analysis running through this chapter has revealed a series of persistent anomalies in the perpetual futures market that record the history of arbitrage forces being obstructed along different dimensions. These anomalies are not static, unchanging features, however. On the contrary, they form a panorama of dynamic evolution: some old deviations gradually fade as market infrastructure matures, some stubborn deviations persist over the long run because they arise from the market's deep structural constraints, and, at the same time, new market innovations continually give rise to new anomalies of varied forms. The purpose of this section is precisely to survey this dynamic picture systematically and to distill from it normative implications for future market design: what exactly can be repaired through institutional improvement, and what is a fundamental cost that must be accepted under the current architecture.
Understanding the evolutionary trajectory of anomalies is a core yardstick for assessing a market's maturity. A market's progress in efficiency is most intuitively reflected in the speed and breadth with which it eliminates price deviations. This section therefore unfolds along three temporal dimensions: reviewing the anomalies that are fading, examining those that persist, and looking ahead to those that are emerging (Table 18-9). Finally, we converge all of this on a practical question: how does one design a better market?
| Evolution category | Representative anomaly | Current status | Driving factor |
|---|---|---|---|
| Fading | Cross-exchange spread among leading exchanges | Narrowed from about 3.5% (2017–2018 sample, Makarov-Schoar [17]) to 1–3 bps (2025) | Entry of high-frequency trading, API standardization |
| Fading | Calendar effects (weekend effect) | Essentially eliminated | 24/7 quantitative funds and automated strategies |
| Fading | Excess returns of basis arbitrage | Annualized returns fell significantly from 30%–80% | Coincided with the expansion of protocolized arbitrage tools such as Ethena (causality pending proof) |
| Persistent | CEX–DEX structural residual | Shrinking but not to zero | Physical confirmation-time limit of the blockchain |
| Persistent | Long-term positive bias in funding rates | Changing slowly | Retail-heavy participant structure |
| Persistent | Regulation-segmented pricing zones | Requires regulatory change | Capital controls and a non-unified regulatory framework |
| Emerging | CME/ETF dual-track pricing | Formed after 2024 | Approval and listing of Bitcoin spot ETFs |
| Emerging | Concentration risk of protocolized arbitrage | Developing | TVL concentration of protocols such as Ethena |
| Emerging | Microstructure effects of AI trading agents | Early stage | AI strategy convergence and algorithmic gaming |
Table 18-9. A panorama of the evolution of perpetual futures market anomalies (Data source: constructed by the author from public market data and the literature)
Table 18-9 places the principal anomalies of the perpetual futures market into three categories according to their evolutionary trajectory: fading, persistent, and emerging. The anomalies in the fading category (such as the cross-exchange spread among leading exchanges narrowing from 3.5% to 1–3 bps) confirm, through the marked convergence of their magnitude, the gradual strengthening of arbitrage forces. The anomalies in the persistent category (such as the CEX–DEX structural residual and regulation-segmented pricing zones) mark the boundaries that arbitrage forces cannot cross under the current market architecture. The anomalies in the emerging category (such as CME/ETF dual-track pricing and the concentration risk of protocolized arbitrage) reveal how structural change in the market creates new efficiency gaps even as it eliminates old deviations. Together, the three categories form a panorama of the dynamic evolution of market efficiency.
18.9.1 Fading anomalies
The market is not standing still; the fruits of arbitrageurs' work are clearly visible over time. Some anomalies that were significant in the market's early stages have narrowed greatly in magnitude, or even nearly disappeared, as the arbitrage infrastructure has advanced and capital has deepened. These fading anomalies are the strongest evidence for testing the AIH framework of Chapter 16: arbitrage returns, as compensation for the infrastructure services arbitrageurs provide, tend to decline as the cost of those services falls.
The most typical example is the cross-exchange spread among leading exchanges. In the early days of the crypto market, the Bitcoin spread between different exchanges often reached several percent; Makarov and Schoar's study based on 2017–2018 data recorded cross-market spreads as high as several percentage points (about 3.5%) [17] (2020 is the year of that paper's publication), which provided rich profits for early cross-exchange arbitrageurs. As high-frequency trading firms entered, API interfaces were standardized, and features such as cross-exchange unified accounts became widespread, the latency and cost of executing cross-exchange arbitrage were compressed sharply. By 2025, the Bitcoin perpetual futures spread among first-tier exchanges such as Binance, OKX, and Bybit had, under normal market conditions, stabilized within an extremely narrow band of 1–3 bps (0.01%–0.03%), approaching the theoretical cost lower bound of cross-exchange arbitrage. The convergence of the spread from the percentage level to the basis-point level amply demonstrates the remarkable success of arbitrage capital and technology in "leveling" the surface of market prices.
Another anomaly that has been almost entirely "arbitraged away" is calendar effects, such as the "weekend effect" or holiday effect widespread in the early market. In the market's early days, because the participant structure was dominated by retail investors and institutional traders took weekends off, the market's liquidity and pricing efficiency declined systematically on weekends, causing volatility and spread patterns to show predictable intra-week variation. As 24/7 quantitative funds and automated trading strategies became the market's dominant force, however, any predictable pattern tied to a specific time was quickly identified and exploited until it was no longer profitable. Today, except during extreme events, the pricing behavior of major assets has essentially eliminated the significant difference between weekdays and weekends.
The excess returns of basis arbitrage likewise show a downward trend. In the bull market of 2020 to 2021, perpetual futures maintained a high positive basis against spot over the long run, providing arbitrageurs who shorted perpetual and bought spot with a significant annualized return as high as 30%–80%—this high return is itself a manifestation of insufficient arbitrage forces and the market's lack of enough capital to meet vigorous long demand. As protocolized arbitrage tools such as Ethena rose (see Section 18.2.4 for the mechanism), however, the market's short supply was greatly strengthened. Preliminary time-series evidence shows that after Ethena's TVL grew rapidly in 2024, the fluctuation center of both the basis and the funding rate of major assets' perpetual futures declined observably, consistent with the direction of the hypothesis that "protocolized arbitrage systematically compresses the bull-market positive basis." This co-movement, however, is not yet sufficient to establish causation: the same 2024 period was also overlaid with confounding factors such as the macro interest-rate environment and an overall market-regime shift, and attributing the decline in the basis center cleanly to Ethena still requires controlling for these confounders and supplementing the analysis with more rigorous econometric testing. On the premise of treating the direction of causation cautiously, one can say that a high-barrier arbitrage opportunity that once required professional hedge funds to access is being democratized by technological and protocol innovation, and one possible outcome is the fading of the related anomaly.
Behind every fading anomaly is a story of "strengthening arbitrage forces." Whether through the entry of more professional participants, the deployment of more abundant capital, or the application of more advanced technical tools, all are jointly filling the weak links in the market's efficiency network. These fading price deviations are the most powerful empirical support for the market's move toward maturity, verifying that arbitrage, as a corrective force, though delayed, ultimately takes effect.
18.9.2 Persistent anomalies
In sharp contrast to the anomalies that gradually vanish are certain structural anomalies that display pronounced stickiness, their form not having changed fundamentally over several years. The persistence of these anomalies does not mean that arbitrageurs are insufficient or that the market has failed; on the contrary, they delimit the boundaries that arbitrage forces cannot cross—the structural constraints determined by the market's core architecture, the laws of physics, or fundamental institutional barriers.
The CEX–DEX spread is the best example illustrating this class of anomaly. As described in Section 18.7.3, the "structural arbitrage residual" rooted in the blockchain's physical confirmation time cannot be reduced to zero—it is the quantifiable efficiency cost paid for "decentralization" and "trustlessness," and even as technological advances such as L2 scaling, high-performance appchains, and low-latency oracles continually compress latency, it can only be narrowed and not eliminated, and therefore stays sticky over the long run (its full mechanism and the efficiency-decentralization trade-off are detailed in Section 18.7.3).
The long-term positive bias in funding rates is another stubborn structural anomaly. As analyzed in Section 18.3.1, its root is the "structural premium" determined by the retail-heavy participant structure, which compensates shorts for the counterparty risk and contrarian risk they bear; as long as the "retail-heavy, institution-neutral" participant structure does not undergo a fundamental reversal, this anomaly will persist (its causes are detailed in Section 18.3.1).
The segmented pricing zones created by regulatory barriers are the structural anomaly hardest to shake at the institutional level. As described in Section 18.4.3, the Korean "kimchi premium" persists because of strict capital controls and foreign-exchange restrictions. South Korea's Virtual Asset User Protection Act of 2023 further regulated the operations of domestic exchanges, but the reporting and approval obligations for large cross-border transfers under the Foreign Exchange Transactions Act were not relaxed as a result; moreover, this control does not treat all sizes alike—small personal transfers face lower friction, whereas the large, frequent cross-border capital deployment needed to support institutional-scale arbitrage remains costly in compliance terms. This "scale-dependent barrier" precisely explains why the kimchi premium, although it does not reach a fully segmented level thanks to the presence of small arbitrageurs, still significantly exceeds what transaction costs can explain. The elimination of this class of anomaly (together with the systematic difference between CME/Coinbase and Binance/OKX caused by U.S. investors being restricted from accessing offshore exchanges) depends not on technology or capital but entirely on the coordination and unification of regulatory frameworks among the world's major economies, and a fundamental breakthrough is unlikely in the foreseeable future.
In addition, as described in Section 18.5.1, the "inefficiency zone" of altcoin perpetual futures is a structural anomaly stemming from the "long-tail distribution" of liquidity—the order books of the vast number of small- and mid-cap tokens are extremely shallow, so even when arbitrageurs spot a significant deviation, they cannot execute effectively because of the enormous trading-impact cost; this efficiency stratification determined by liquidity stratification is a structure that forms spontaneously in the market and is not easily changed by external intervention (see Section 18.5.1).
These persistent anomalies remind us that we cannot simply regard every price deviation as "market failure." They should instead be seen as "equilibrium outcomes" under specific constraints. They are the monetized expression of the "friction cost" the market must pay to keep functioning under its existing technology, institutions, and participant structure. Eliminating them requires not "moral suasion" of arbitrageurs but systematic change to the constraints themselves.
18.9.3 Emerging anomalies
The market's evolution not only eliminates old anomalies but also creates new ones. Every major change in market structure—such as the introduction of a new product, the application of a new technology, or the entry of a new participant—may open new "fissures" even as it reshapes the efficiency map. We are currently in an era of change driven jointly by ETFs, protocolized arbitrage, and AI trading, and a series of unprecedented new anomalies is emerging.
The approval and listing of Bitcoin spot ETFs in the United States in early 2024 was an important structural event for the crypto market in recent years. While opening a compliant gateway to the mainstream financial world, it also created a wholly new, still-forming structural anomaly: the "dual-track pricing" of the CME/ETF system and the offshore perpetual futures system. As analyzed in Section 18.6.2, these two systems differ fundamentally in regulatory framework, trading hours, settlement currency, and settlement cycle: the segmentation between SEC regulation and offshore regulation, the mismatch between the New York trading session and round-the-clock trading, the difference between dollar settlement and USDT/USDC settlement, and the lag between T+1 settlement and instant settlement. Together, these differences form an "institutional obstacle" that is hard to surmount, obstructing effective cross-system arbitrage. As a result, the two markets frequently give inconsistent pricing signals for the same underlying asset (Bitcoin). Especially while the U.S. market is closed, the offshore perpetual futures market becomes the world's only continuous pricing center, and lacking the "price anchor" of the ETF and CME futures, its price is more prone to deviation from regional news or liquidity shocks. This new fissure caused by institutional segmentation and time mismatch did not exist before 2024, and its evolution will become a core topic of market-structure research in the coming years.
The rise of protocolized arbitrage likewise cuts both ways. Protocols represented by Ethena, through their enormous capital volume, effectively play the role of an "anomaly-suppression mechanism" under normal market conditions, systematically reducing the fluctuation of the basis and the funding rate. This model of "protocolizing" and "centralizing" arbitrage activity, however, also carries the risk of creating a new type of crisis dynamics: once the market shifts into a sustained, deep negative funding-rate environment and triggers a large-scale wave of redemptions, the protocol is forced to close out its enormous short perpetual futures positions en masse within a short time, which could push the basis to an unprecedented, extreme one-directional level, forming a new type of transient anomaly triggered by the protocol's own mechanism (the full exposition of this "redemption → forced unwinding → extreme basis" mechanism is in Section 18.2.4). This risk of the "protocol being forced into large-scale unwinding" has not yet occurred in reality but is entirely possible in theory, and it reveals that market innovation, while raising efficiency, may redistribute and concentrate tail risk in more complex forms.
The gradual spread of artificial intelligence (AI) trading agents portends another important microstructural change. On one hand, AI can identify and eliminate existing arbitrage opportunities—especially the tiny ones hidden in vast data—through greater speed and more complex models, further accelerating the fading of traditional anomalies. On the other hand, when the market's main participants shift from human traders to AI agents of every kind, the gaming among them may create wholly new microstructural patterns that humans struggle to understand. For example, strategy convergence and resonance may arise among AIs. This risk is not entirely new; the literature has documented the instability that algorithmic-strategy crowding caused in traditional markets. Kirilenko et al.'s analysis of the 2010 "Flash Crash" shows that the same-direction behavior of algorithmic traders was a key amplifier of the price collapse [18] ("2010" in the text refers to the year of the event; the authoritative analysis is the version published in The Journal of Finance in 2017). But AI agents introduce a new dimension: when major models are trained on overlapping training datasets, they may share a structural bias regarding market-regime shifts. This shared bias is invisible under normal conditions, but when a real macro-regime shift occurs, all models may emit the same trading signal simultaneously, producing a "slow-motion" liquidity evaporation—unlike a millisecond-scale flash crash, this is a correlated flow shock lasting several hours, and it may be more destructive because it operates below traditional anomaly-detection thresholds; alternatively, the complex camouflage or deception strategies that AIs adopt to game one another may leave non-random "fingerprints" in the price series, constituting a wholly new anomaly based on algorithmic gaming. The dual-sided effect of AI—both terminator of anomalies and potential creator of new ones—marks the frontier of the evolution of market efficiency.
The core insight is that anomalies form a dynamically balanced ecosystem. Every advance of the market—whether product innovation, protocol innovation, or technological innovation—simultaneously eliminates some old arbitrage space and, by changing market structure, creates new efficiency gaps. The assessment of market efficiency therefore cannot rest on the analysis of a static snapshot in time but must turn to the continual tracking of the dynamic evolution of anomalies.
18.9.4 From anomalies to institutional improvement
The ultimate purpose of analyzing anomalies is not only to understand the world but to change it. Translating the empirical analysis of the causes and evolution of anomalies above into normative recommendations for market design is the final destination of this chapter. For market designers and regulators, the core question is this: faced with the many and varied market anomalies, which are defects that can be "repaired" through institutional and technical improvement, and which are "costs" we must accept that stem from fundamental trade-offs in the market's architecture?
On repairable anomalies: the root of some anomalies lies in the imperfection of current institutional design or technical facilities, and they can be mitigated or eliminated through a clear path. We can rank these institutional-improvement measures along the two dimensions of "scope of impact" and "feasibility," forming a pragmatic reform roadmap (Table 18-10).
| Anomaly type | Core cause | Institutional/technical improvement required | Scope of impact | Feasibility/timeline |
|---|---|---|---|---|
| 8-hour settlement pulse | Discrete funding-rate settlement cycle | Shorten the settlement cycle to 1 hour or continuous settlement | Medium | High / already under way |
| DEX oracle latency | Oracle update frequency and on-chain confirmation time | Low-latency oracles (such as Pyth) + high-performance appchains | High | High / short-to-medium term (1–3 years) |
| Cross-exchange spread and rate splitting | Capital fragmentation and low margin efficiency | Cross-exchange margin mutual recognition or unified clearing (such as ClearToken) | High | Medium / medium term (3–5 years) |
| Slow negative-basis repair | High friction in the spot coin-borrowing market | Develop more efficient, more liquid centralized or decentralized lending markets | Medium | Medium / medium term (3–5 years) |
| Core-periphery pricing gradient | Counterparty risk of small and mid-sized exchanges | Introduce an independent exchange credit-rating system and proof-of-reserves standards | Medium | Medium / medium term (3–5 years) |
| Regulation-segmented pricing zones | Capital controls and a non-unified regulatory framework | Coordination and mutual recognition of regulatory frameworks among the world's major economies | Very high | Low / long term (more than 5–10 years) |
Table 18-10. Repairable anomalies and the corresponding institutional-improvement roadmap (Data source: constructed by the author from public market data and the literature)
A priority sequence is clearly visible from this roadmap. Upgrading oracle technology and shortening the settlement cycle are the improvement measures with the highest feasibility at present, and their impact is significant. Emerging DEXs such as Hyperliquid have, through hourly or even more frequent settlement, significantly weakened the "settlement-timing effect" brought by traditional 8-hour settlement. Likewise, the new generation of oracles and appchain architectures is compressing the CEX–DEX latency gap from the second level to the sub-second level. These are technology-driven improvements already under way.
In the medium term, cross-exchange margin mutual recognition is the core measure for solving capital fragmentation and the amplification of anomalies during crises. At present, arbitrageurs must post large amounts of margin at each exchange, greatly reducing capital efficiency. If net settlement of cross-exchange margin could be achieved through a third-party clearinghouse (analogous to LCH or CME Clearing in traditional finance), it would greatly free up arbitrage capital and strengthen the market's resilience under stress. Projects such as ClearToken are exploring in this direction. Achieving cross-exchange margin mutual recognition, however, requires not only overcoming the coordination game and trust problems among exchanges but also having the participating institutions obtain central counterparty (CCP) clearing qualification in major jurisdictions (such as CCP recognition under the EU's EMIR framework or DCO registration in the United States), and these regulatory-approval processes are themselves highly uncertain. In an optimistic scenario, preliminary bilateral netting arrangements may appear within 3–5 years, but the timeline for establishing a comprehensive multilateral clearing system is hard to predict.
In the long term, the coordination of global regulatory frameworks is undoubtedly the most far-reaching reform, capable of fundamentally eliminating the segmented pricing zones caused by regulatory arbitrage and market segmentation. This touches the core of each nation's financial sovereignty, however, and is the most difficult, beyond what market forces themselves can determine. Table 18-11 summarizes the expected progress of the improvement measures above along the temporal dimension.
| Temporal dimension | Eliminable anomaly | Improvement required | Current progress |
|---|---|---|---|
| Short term (1–2 years) | 8-hour settlement pulse | Shorten the settlement cycle to 1 hour or continuous settlement | Hyperliquid and others have implemented more frequent settlement |
| Short term (1–2 years) | DEX oracle latency | Low-latency oracles + high-performance appchains | New-generation oracles such as Pyth and Stork have been deployed |
| Medium term (3–5 years) | Cross-exchange spread and rate splitting | Cross-exchange margin mutual recognition or unified clearing | Projects such as ClearToken are exploring |
| Medium term (3–5 years) | Slow negative-basis repair | More efficient lending markets | Decentralized lending protocols continue to develop |
| Medium term (3–5 years) | Core-periphery pricing gradient | Independent credit-rating system and proof of reserves | Third-party ratings such as Kaiko are gradually improving |
| Long term (more than 5–10 years) | Regulation-segmented pricing zones | Coordination and mutual recognition of global regulatory frameworks | Regulatory progress varies by country; coordination is extremely difficult |
Table 18-11. The temporal dimension of anomaly elimination and current progress (Data source: constructed by the author from public market data and the literature)
Table 18-11 reorganizes the institutional-improvement measures of Table 18-10 along the temporal dimension, dividing them into three tiers—short term (1–2 years), medium term (3–5 years), and long term (more than 5–10 years)—and noting the current implementation progress of each. Tables 18-10 and 18-11 cover the same set of six improvement measures, the former emphasizing "scope of impact / feasibility" and the latter "temporal dimension / current progress"; the two are complementary rather than independent conclusions. The specific time spans given in the tables (such as 1–2 years and 3–5 years) are the author's subjective judgment and ordinal ranking (near/medium/far term) based on the current state of the industry, not the output of any forecasting model, and readers should understand them as relative priorities rather than precise time predictions. A priority sequence can be read from them: technology-driven improvements (such as oracle upgrades and shortened settlement cycles) are already in the implementation stage and are expected to produce observable efficiency gains in the relatively near term; institution-coordination improvements (such as cross-exchange margin mutual recognition) must overcome the coordination game within the industry and are in a medium-term exploratory stage; and reforms involving the unification of global regulatory frameworks are, because of their inherent political complexity, unlikely to achieve a fundamental breakthrough in the foreseeable future.
On the other hand, some anomalies are irreparable. Not all anomalies can be repaired. Some are fundamental costs the market must pay in pursuing particular objectives (such as decentralization and censorship resistance). They stem from an irreconcilable "trade-off triangle," not a temporary technical defect.
A typical example is the CEX–DEX structural arbitrage residual. As described in Sections 18.7.3 and 18.9.2, as long as the blockchain's physical confirmation time is nonzero, a decentralized system can never surpass a centralized one in speed, and this ineliminable tiny latency constitutes the efficiency lower bound of decentralized finance. Its normative implication is that pursuing extreme decentralization and trustlessness requires accepting this efficiency "discount," and trying to eliminate it entirely is tantamount to abandoning decentralization itself. This is a philosophical choice about "what one wants" and "what one is willing to give up," not an engineering problem.
Second, the theoretical lower bound of information asymmetry dictates that arbitrage opportunities never fully disappear in theory. The paradox of informational efficiency proposed by Grossman and Stiglitz in 1980 [19] rests on a key premise: acquiring and processing information is costly. Under this premise, if market prices already fully reflect all information, then no trader can earn excess returns by collecting and analyzing information, and so no one has an incentive to engage in this costly activity. Yet once no one collects information, prices no longer reflect information and the market becomes inefficient again. The equilibrium outcome of this paradox is that the market must retain an "inefficiency" gap large enough that information collectors' expected returns just cover their information costs. Mapping this logic onto the crypto perpetual futures market, we note an important difference: the information-cost structure of the crypto market differs fundamentally from that of the traditional equity market. The openness and transparency of on-chain data lower the acquisition cost of some information, but the market's fragmentation (dozens of exchanges, multiple blockchains) and 24/7 uninterrupted trading greatly raise the cost of monitoring and processing information. The net effect is that the equilibrium point of informational efficiency in the crypto market may be higher than in traditional markets—that is, the "minimum arbitrage return" required to maintain market efficiency is higher. The Grossman-Stiglitz paradox therefore theoretically constrains the possibility of fully eliminating anomalies: complete efficiency is a logically unattainable ideal, and the crypto market's distinctive information-cost structure further raises this ineliminable efficiency lower bound.
Finally, participant heterogeneity is an endogenous feature of the market ecosystem, hard and unnecessary to eliminate. The participant composition of different markets (retail investors, institutions, arbitrageurs, industrial capital) differs naturally, and their risk appetites, information channels, trading motives, and behavioral patterns vary widely. This heterogeneity is the source of the market's depth and breadth, but it also inevitably causes systematic differences in pricing logic across different markets (such as CEX vs. DEX, CME vs. offshore perpetual). For example, the long-term positive bias in funding rates is rooted in the persistent preference difference between retail investors and institutions. Attempting to "unify" the behavior of all participants in some way is not only unrealistic but would also harm the market's diversity and vitality.
Reflecting from anomalies to institutional improvement ultimately leads us to recognize the boundaries of market design. It requires us to distinguish "the doable" from "the undoable," to focus our energy on the areas where technical and institutional innovation can genuinely improve market resilience and efficiency, while also understanding and respecting the ineliminable efficiency losses determined by the market's fundamental trade-offs.
18.10 Chapter summary
This chapter has systematically analyzed the six categories of persistent market anomalies that arise in the perpetual futures market from constrained arbitrage activity: the basis anomaly, the funding-rate anomaly, the cross-exchange anomaly, the cross-asset anomaly, the term-structure anomaly, and the CEX–DEX anomaly. The analysis is not intended to declare the market "inefficient" but to reveal a more accurate understanding: market efficiency is always in a contest with various inherent, dynamic constraints, and anomalies are the most direct reflection of that contest.
The core conclusions of this chapter can be distilled into five interconnected layers. First, at least six categories of persistent anomalies exist in the perpetual futures market that can be systematically quantified and attributed; they are not isolated, random market noise but a stable reflection of market microstructure and macro dynamics. Second, the "constraint–anomaly mapping" method proposed in this chapter is the cornerstone of the entire analysis: most market anomalies can, to a large extent, be traced to the seven-dimensional constraint framework laid out in Chapter 17, and understanding the roots of an anomaly often requires returning to an analysis of the constraint itself; at the same time, it must be acknowledged that for some anomalies (such as the long-term positive bias in funding rates), the constraint merely amplifies an equilibrium deviation that already exists rather than creating the anomaly out of nothing—the method is therefore a mechanistic attribution, not a rigorous causal identification for each case. Third, the "anomaly persistence spectrum" forms a non-exclusive continuum along the three characteristic forms of transient, cyclical, and structural (rather than three mutually exclusive bins), revealing that different anomalies have markedly different temporal characteristics and repair mechanisms, and that the same broad category of anomaly may fall at different positions on the spectrum depending on state or direction. The transient form reflects the market's instability under extreme stress, the cyclical form reveals the predictable friction endogenous to institutional design, and the structural form reflects the fundamental trade-offs and costs in the market's architecture. Fourth, the crisis-dynamics analysis uses the single case of LUNA/UST in May 2022 to illustrate the core prediction of Chapter 17's risk-resonance model: during extreme market turmoil, multiple categories of anomalies worsen almost in synchrony and infect one another, forming a positive feedback loop that causes the nonlinear amplification of price deviations—this mechanism is consistent with the single-case observation, but its generality awaits testing through multi-case comparison. Fifth, the landscape of anomalies is itself in a process of continual dynamic evolution: some anomalies are gradually fading with technological progress and capital deepening, others persist over the long run as durable features of structural constraints, and new anomalies keep emerging as market structure evolves.
Specifically, different anomalies correspond to different constraint forms and temporal characteristics. The basis anomaly presents a cyclical positive bias in bull markets and manifests as transient negative-basis stickiness in crises, the two pointing respectively to different combinations of margin and liquidity constraints. The long-term positive bias in funding rates stems from a structural asymmetry in participant structure, while its 8-hour settlement effect is rooted in a specific institutional-design parameter. From the residual spread among leading exchanges that approaches the theoretical lower bound, to the segmented pricing zones formed by regulatory barriers, to the permanent efficiency gap between CEXs and DEXs arising from the physical confirmation-time limit, each category of anomaly corresponds to a specific constraint form and its unique manifestation along the time dimension.
As the final chapter of Part 6, "Arbitrage: Boundaries and Limits," this chapter, together with the two preceding chapters, completes the tracing of the arbitrage mechanism from theory to reality across its entire course. Chapter 16 displayed the precision of the mechanism, including six categories of strategy, a layered ecosystem, and three-layer efficiency transmission; Chapter 17 displayed the instability of the mechanism, covering the seven-dimensional constraints, risk resonance, and nonlinear collapse; this chapter has revealed the domains the arbitrage mechanism cannot cover: persistent price deviations, pricing deviations sharply amplified in crises, and the structural efficiency loss that is a permanent cost of the market's architecture. The evolution of the anomaly landscape shows that the market as a whole is developing toward higher efficiency: from the roughly 3.5% cross-exchange spread recorded by Makarov-Schoar on 2017–2018 data to the single-digit-basis-point residual of 2025, from manual cross-exchange arbitrage to protocolized arbitrage, and from isolated CEXs to a CEX–DEX efficiency-transmission channel, arbitrageurs continually mend the weak links in the efficiency-transmission network. But some links, because of the fundamental limits of the laws of physics or the institutional framework, may never be eliminated entirely. Identifying and distinguishing these different layers of constraint and anomaly is precisely the core analytical framework that the three chapters of this part have sought to provide.
The analysis of this chapter will be extended in later parts. The phenomenon of a sharp decline in liquidity caused by arbitrageurs' exit will receive a more systematic theoretical analysis in Part 7's treatment of "liquidity"; the volatility clustering and cross-market contagion during the eruption of anomalies will be placed in a broader theoretical context in Part 8's analysis of "volatility"; and this chapter's tracing of the evolution of anomalies also provides the necessary empirical material for Part 9's analysis of market quality.
References
[1] Seo, M. H., Koo, B., & Yang, Y. F. (2024). Nonlinear dynamics of Kimchi premium. Economic Modelling, 135, 106726. https://doi.org/10.1016/j.econmod.2024.106726
[2] Zhivkov, P. (2026). The two-tiered structure of cryptocurrency funding rate markets. Mathematics, 14(2), 346. https://doi.org/10.3390/math14020346
[3] Shleifer, A., & Vishny, R. W. (1997). The limits of arbitrage. The Journal of Finance, 52(1), 35–55. https://doi.org/10.1111/j.1540-6261.1997.tb03807.x
[4] Liu, J., Makarov, I., & Schoar, A. (2023). Anatomy of a run: The Terra Luna crash (NBER Working Paper No. 31160). National Bureau of Economic Research. https://doi.org/10.3386/w31160
[5] Christin, N., Routledge, B. R., Soska, K., & Zetlin-Jones, A. (2022). The crypto carry trade (Working Paper). Carnegie Mellon University. https://www.andrew.cmu.edu/user/azj/files/CarryTrade.v1.0.pdf
[6] He, S., Manela, A., Ross, O., & von Wachter, V. (2024). Fundamentals of perpetual futures (Working Paper, Revise & Resubmit at Review of Financial Studies). Washington University in St. Louis. https://doi.org/10.48550/arXiv.2212.06888
[7] Kaiko. (2026). Kaiko exchange ranking. Retrieved March 6, 2026, from https://www.kaiko.com/indices/exchange-ranking
[8] Agio Ratings. (2026, February 18). Crypto credit ratings: How institutions measure counterparty and asset risk. Agio Ratings. https://www.agioratings.io/insights/crypto-credit-ratings-how-institutions-measure-counterparty-and-asset-risk
[9] McGinley, I. (2023, September 11). Enforcement by enforcement: The CFTC's actions in the derivatives markets for digital assets [Keynote speech]. U.S. Commodity Futures Trading Commission. https://www.cftc.gov/PressRoom/SpeechesTestimony/opamcginley1
[10] Engle, R. (2002). Dynamic conditional correlation: A simple class of multivariate generalized autoregressive conditional heteroskedasticity models. Journal of Business & Economic Statistics, 20(3), 339–350. https://doi.org/10.1198/073500102288618487
[11] Barbon, A., & Ranaldo, A. (2021). On the quality of cryptocurrency markets: Centralized versus decentralized exchanges. arXiv. https://doi.org/10.48550/arXiv.2112.07386
[12] Nadler, M., Schuler, K., & Schär, F. (2025). Blockchain price oracles: Accuracy and violation recovery. Journal of Corporate Finance, 95, 102908. https://doi.org/10.1016/j.jcorpfin.2025.102908
[13] Daian, P., Goldfeder, S., Kell, T., Li, Y., Zhao, X., Bentov, I., Breidenbach, L., & Juels, A. (2020). Flash Boys 2.0: Frontrunning in decentralized exchanges, miner extractable value, and consensus instability. In 2020 IEEE Symposium on Security and Privacy (SP) (pp. 910–927). IEEE. https://doi.org/10.1109/SP40000.2020.00040
[14] Qin, K., Zhou, L., & Gervais, A. (2022). Quantifying blockchain extractable value: How dark is the forest? In 2022 IEEE Symposium on Security and Privacy (SP) (pp. 198–214). IEEE. https://doi.org/10.1109/SP46214.2022.9833734
[15] Briola, A., Vidal-Tomás, D., Wang, Y., & Aste, T. (2023). Anatomy of a stablecoin's failure: The Terra-Luna case. Finance Research Letters, 51, 103358. https://doi.org/10.1016/j.frl.2022.103358
[16] Forbes, K. J., & Rigobon, R. (2002). No contagion, only interdependence: Measuring stock market comovements. The Journal of Finance, 57(5), 2223–2261. https://doi.org/10.1111/0022-1082.00494
[17] Makarov, I., & Schoar, A. (2020). Trading and arbitrage in cryptocurrency markets. Journal of Financial Economics, 135(2), 293–319. https://doi.org/10.1016/j.jfineco.2019.07.001
[18] Kirilenko, A., Kyle, A. S., Samadi, M., & Tuzun, T. (2017). The flash crash: High-frequency trading in an electronic market. The Journal of Finance, 72(3), 967–998. https://doi.org/10.1111/jofi.12498
[19] Grossman, S. J., & Stiglitz, J. E. (1980). On the impossibility of informationally efficient markets. The American Economic Review, 70(3), 393–408. https://www.jstor.org/stable/1805228