In May 2022, the crypto market underwent a profound systemic crisis that offers instructive empirical material for understanding the true nature of the risks in perpetual futures arbitrage. In the preceding months, the funding rate on Bitcoin perpetual futures had remained persistently positive, and many basis arbitrageurs had built delta-neutral positions on that footing—buying spot and shorting an equivalent notional amount of perpetual futures—to capture the basis and collect funding payments. Throughout this chapter, the basis is defined as the perpetual futures price minus the spot price: a positive basis denotes a perpetual premium, and a negative basis denotes a perpetual discount. In a low-volatility environment, the strategy performed steadily and was widely regarded as a low-risk source of yield. The representative scenario below—which combines the characteristic features of several historical crises, including May 2022—illustrates the strategy's fragility under extreme market conditions (the specific figures are illustrative; a review based on public data appears in Section 17.9.1).
Within a few days, however, market conditions reversed sharply. Over a 72-hour window, the funding rate plunged from roughly +0.03% per 8 hours to −0.10% per 8 hours, and arbitrageurs' positive cash flow abruptly turned into a persistent drain on capital. At the same time, the steep fall in the Bitcoin price triggered margin calls, while the unrealized gains on the short perpetual-futures leg could not, under the settlement mechanism, effectively serve as margin—a structural contradiction. When arbitrageurs tried to close out under the combined pressure of funding rate reversal and margin calls, market liquidity had already dried up severely, and the basis had widened from −50 basis points before the crisis to −500 basis points. A strategy that was, in theory, fully hedged produced a realized loss of 15% to 30% within a single week. Over the same period, the systemic collapse of the Terra/UST algorithmic stablecoin system reinforced the lesson: every "risk-free" strategy that depends on a particular institutional design will expose its intrinsic fragility under extreme market stress.
These events reveal a fundamental fact that runs through the entire crypto-finance system: under the current institutional and technical structure, no genuinely "risk-free arbitrage" exists. This is the symmetric counterpart to the Arbitrage Infrastructure Hypothesis (AIH) advanced in Chapter 16 (see Section 16.1.3). Chapter 16 positioned arbitrageurs as the central custodians of market efficiency; this chapter focuses on the structural risks they face—for when arbitrageurs collectively retreat in the face of intolerable risk, the transmission mechanism of market efficiency breaks down systemically.
To answer systematically the question of where the limits of arbitrage lie, this chapter develops an analytical framework it calls the arbitrage constraint topology.1 Starting from the sources of risk, the framework decomposes perpetual futures arbitrage into seven core constraint dimensions: margin and forced liquidation; funding rate reversal; counterparty and platform risk; execution and timing risk; liquidity depletion; smart contract and oracle risk; and regulatory and compliance risk. The chapter analyzes the internal mechanism of each dimension in turn and shows how, under extreme market conditions, these dimensions undergo risk resonance that drives a nonlinear collapse in arbitrage capacity. That arbitrage returns remain persistently positive can be explained, to a large degree, as the joint product of constraints (which limit both the scale of and the appetite for arbitrage) and risk compensation (the pricing of tail and resonance risk). Dimensions such as margin and funding rate reversal supply an earnable risk premium, whereas dimensions such as regulation and market access sustain spreads primarily by shrinking the pool of eligible capital. Because the two operate through different mechanisms, they should not be lumped together as a single "premium."
17.1 The theoretical framework of arbitrage risk
In the idealized picture drawn by financial theory, arbitrage is the central mechanism through which a market restores equilibrium. In that framework, arbitrageurs step in the instant a price deviation appears, eliminate the mispricing through "risk-free" trades, and earn a profit in the process. Chapter 16 described precisely how this mechanism weaves a complex web of efficiency in cryptocurrency markets, and in the perpetual futures ecosystem in particular. A central theoretical question nonetheless remains: if arbitrage is truly "risk-free," why do arbitrage opportunities persist—and in some periods even grow unusually rich? Why is the market's efficiency gap never fully closed?
The answer lies not in any deficiency of arbitrageurs' skill or in market irrationality, but in a more fundamental structural constraint: in the real world, no absolutely "risk-free" arbitrage exists. Every seemingly flawless arbitrage is conducted not in a theoretical vacuum but embedded within a complex constraint structure composed of capital, time, technology, and rules. This section reframes the analysis—from the textbook illusion of "risk-free" arbitrage to a more explanatory theory of arbitrage risk built around the notion of constraint. The analysis shows that arbitrageurs' capacity to correct mispricings is systematically limited by structural constraints along multiple dimensions. Understanding the sources, mechanisms, and interactions of these constraints is the key to understanding the upper bound on efficiency in perpetual futures markets.
17.1.1 The theory of the limits of arbitrage
The three core assumptions of "pure arbitrage" in classical finance—unlimited capital, instantaneous and costless execution, and certain convergence—are all systematically violated in perpetual futures markets. Capital is constrained by margin requirements, execution is subject to latency and slippage, and the absence of an expiry date in perpetual futures breaks, at the most fundamental level, the certainty of price convergence.
It is precisely this pronounced gap between theory and reality that gave rise to an important branch of financial economics: the theory of the limits of arbitrage. The seminal contribution is the paper by Shleifer and Vishny (1997) [1]. They observed that real-world arbitrage—especially arbitrage carried out by professional fund managers deploying other people's capital—faces two core risks. The first is fundamental risk: even if an asset's price ultimately reverts to its fundamental value, new adverse information may arrive during the reversion and widen the deviation further. The second is noise-trader risk: markets contain large numbers of irrational noise traders whose collective sentiment or behavior can keep pushing prices away from fundamental value in the short run, making the mispricing more severe. The core insight of Shleifer and Vishny is that the greatest threat to an arbitrageur is not an error in judging an asset's ultimate value, but the risk of being liquidated by a temporary, large mark-to-market loss before prices revert. When arbitrageurs must report performance to their capital providers, the pressure of such short-term losses is amplified and can force them to close positions at the least opportune moment, turning a theoretically profitable strategy into a realized loss.
Building on Shleifer and Vishny, the theory of the limits of arbitrage has been extended in several important directions. DeLong, Shleifer, Summers, and Waldmann (1990) [2] were the first to build a formal model of noise-trader risk, proving that even when arbitrageurs' valuation judgments are entirely correct, the persistent presence of noise traders can sustain price deviations over the long run. Xiong (2001) [3] further analyzed the fragility of convergence traders during funding-liquidity crises, showing how leveraged arbitrageurs can be forced to close positions at the worst possible moment under the pressure of margin calls. Liu and Longstaff (2004) [4] rigorously proved that even when a spread is certain to converge eventually, the optimal arbitrage strategy must still limit position size substantially, because uncertainty along the intermediate path can lead the arbitrageur to be liquidated before convergence occurs. These contributions provide a solid academic foundation for analyzing the constraints on perpetual futures arbitrage: the absence of an expiry date amplifies the dilemma in the Liu–Longstaff model—from "convergence known, path uncertain" to the far more severe challenge of "convergence itself uncertain."
This framework offers a key resolution of the Grossman–Stiglitz paradox. The paradox holds that if markets are fully informationally efficient, no one has an incentive to gather information, because information cannot be turned into profit; yet if no one gathers information, how can the market become efficient at all? The theory of the limits of arbitrage identifies precisely the frictions that prevent arbitrageurs from fully eliminating market inefficiency. Because arbitrage faces capital constraints, execution risk, and uncertainty about price convergence, arbitrageurs cannot—and are unwilling to—arbitrage every mispricing without limit. Arbitrage returns can therefore be viewed as compensation for bearing these "limits of arbitrage" risks. The arbitrage opportunities that persist, never fully eliminated, in turn motivate professional investors to discover and study them, thereby sustaining the market in a dynamic equilibrium of "partial efficiency" [5].
17.1.2 The distinctive risk profile of perpetual futures
Chapter 16 argued for the institutional advantages of perpetual futures, but these same institutional features are also the source of risk. Every institutional advantage of perpetual futures corresponds to a potential risk exposure.
The expiry date of a traditional deliverable futures contract gives arbitrageurs a guarantee of certain price convergence and sets a clear temporal boundary on their risk exposure.
Because perpetual futures have no expiry date, the basis may, in theory, never converge. The arbitrageur's core risk shifts from "misjudging direction" to "running out of capital before the spread converges." Risk exposure changes from a finite horizon to a potentially unlimited one, which fundamentally reshapes the paradigm of risk management.
Accompanying this is uncertainty in the source of returns. As a random variable, the funding rate can flip negative rapidly when market sentiment reverses, turning the strategy's source of return into a persistent cost. This risk—the reversal of the return source—is the core structural risk facing perpetual futures arbitrageurs.
This analysis does not imply that the perpetual futures price will deviate from spot without limit. The funding rate mechanism itself constitutes a soft convergence force: when perpetual futures trade at a sustained premium, the funding that longs pay to shorts makes holding the premium position economically more expensive over time, which endogenously restrains the deviation from widening indefinitely. Under a balanced structure of market participants, moderate leverage, and active market makers, this anchoring mechanism generally works effectively. Yet the soft convergence force operates within clear boundary conditions: when market sentiment becomes highly synchronized—for example, in a panic-driven, one-sided rush to short—and the long-short balance becomes severely skewed, the funding rate's penalty may be insufficient to offset the expected profit from directional speculation, and this anchoring mechanism (the funding rate's streaming anchor, as described in Chapter 16) can fail systemically. It is precisely within such failure windows that the basis shifts from mild mean reversion to sustained, one-directional divergence—the core risk examined in this section.
Table 17-1 contrasts the essential differences between deliverable futures and perpetual futures across the dimensions of arbitrage risk.
| Risk dimension | Deliverable futures arbitrage | Perpetual futures arbitrage |
|---|---|---|
| Convergence certainty | Forced convergence at expiry | No certain point of convergence |
| Holding period | Finite (until expiry) | Theoretically unlimited |
| Stability of return source | Holding to expiry locks in a certain convergence return | Funding rate fluctuates randomly, and its direction can change |
| Margin risk | Finite-horizon exposure | Open-ended exposure |
| Risk of return-source reversal | Low (the basis will eventually converge) | High (the funding rate can reverse for extended periods and by large magnitudes) |
Table 17-1. Comparison of arbitrage-risk dimensions between deliverable futures and perpetual futures (Data source: compiled by the author)
Table 17-1 reveals the defining characteristic of perpetual futures arbitrage risk: the risk borne by "time" in traditional arbitrage is transferred to "capital," and the higher arbitrage return is precisely the necessary compensation for this structural risk.
17.1.3 The arbitrage constraint topology
This chapter proposes the arbitrage constraint topology: a list of seven principal risk categories organized around the institutional features and market structure of perpetual futures, whose overall structure is shown in Figure 17-1. These seven constraints form an open list that is additive and overlapping rather than a strictly mutually exclusive and collectively exhaustive (MECE) taxonomy. The dimensions are not partitioned by a single uniform criterion (some by the object of risk, others by cause); a particular risk—such as the collateral basis risk discussed in Section 17.10—may, depending on context, be placed within an existing dimension or treated as a supplementary one; and some risks, such as maximal extractable value (MEV) and API-key compromise, may straddle several dimensions. The framework aims to integrate seemingly isolated risk factors into an interconnected logical network, thereby providing a clear map for the identification, quantification, and management of risk.
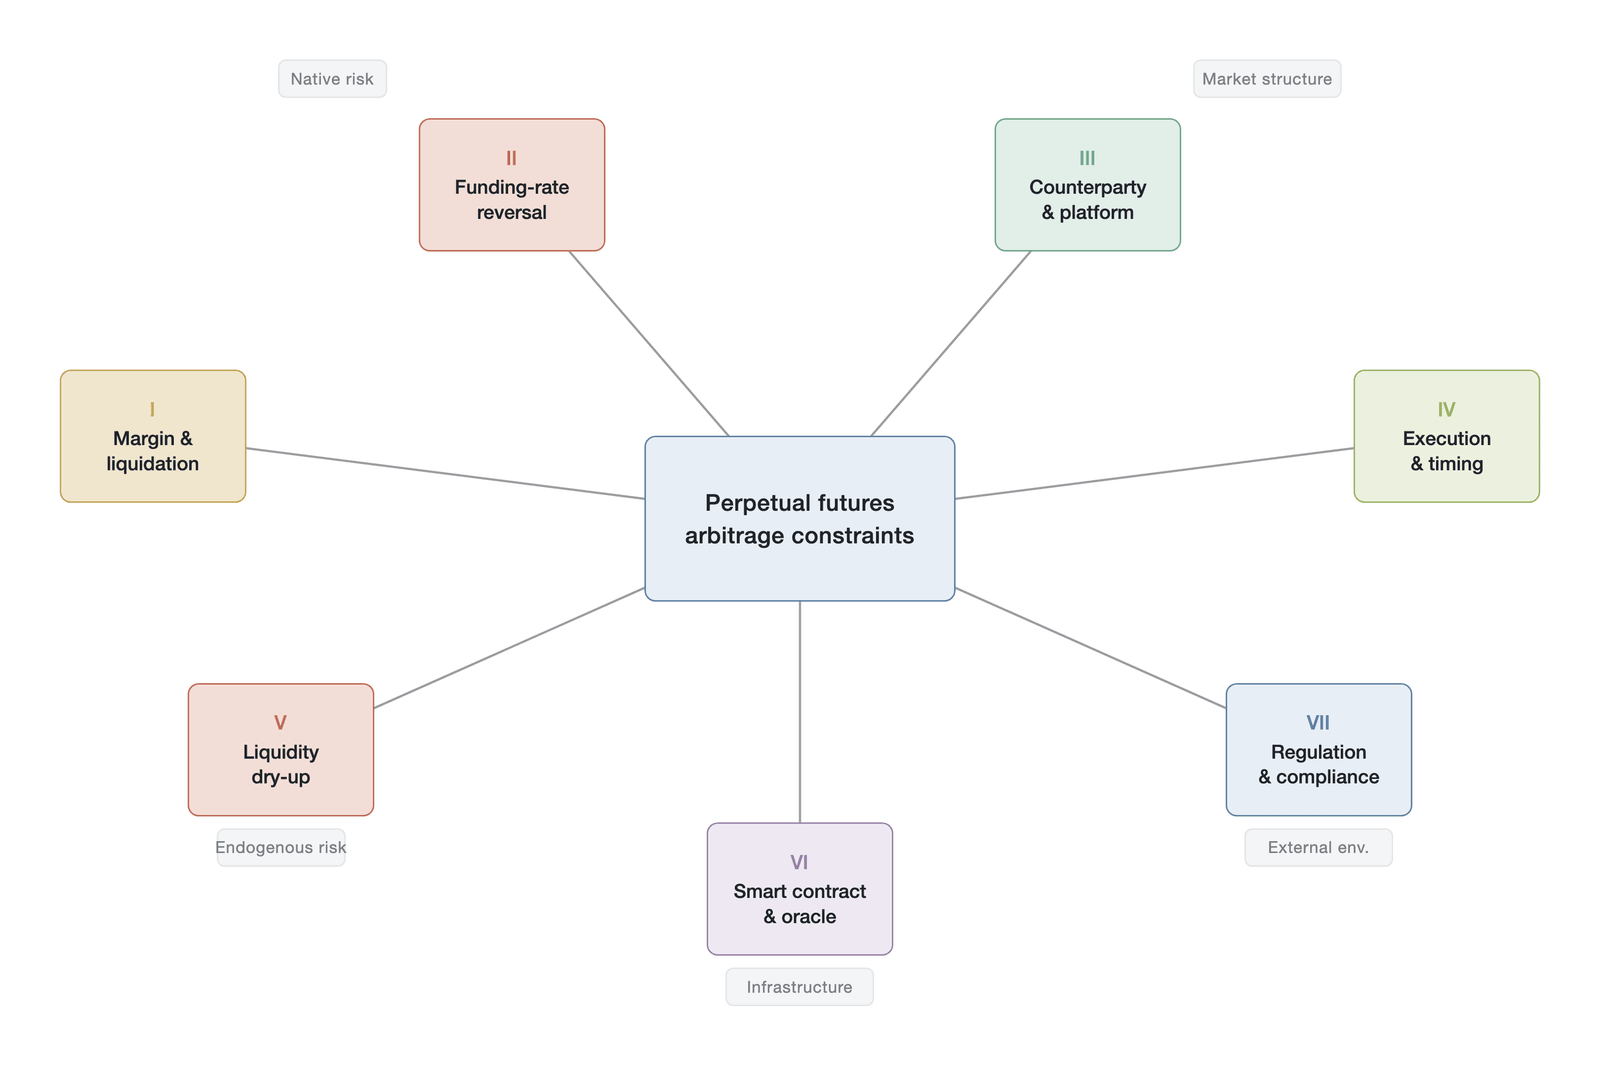
Figure 17-1. Overview of the arbitrage constraint topology (Data source: structural schematic drawn by the author; the seven constraints form an open, additive, and overlapping list rather than a mutually exclusive and collectively exhaustive set)
Figure 17-1 presents the seven constraint dimensions in a star-shaped radial structure, together with their assignment to five categories—native, market-structure, endogenous, infrastructure, and external-environment (the specific classification of each dimension appears in Table 17-2 and below). The seven spokes are joined through a central hub, revealing that the constraints are interdependent rather than isolated from one another.
These seven dimensions make up the list of risks that limit the force of arbitrage (their classification and institutional roots are summarized in Table 17-2, and the transmission relationships among them appear in Figure 17-26). They are as follows.
| Dimension | Constraint | Core mechanism | Institutional root | Detailed discussion |
|---|---|---|---|---|
| I | Margin and forced liquidation | Leverage magnifies exposure, leading to insufficient margin and triggering forced liquidation, which terminates arbitrage positions at the worst possible moment. | High-leverage design; the mark price mechanism | Section 17.2 |
| II | Funding rate reversal | The funding rate, a source of return, turns negative, so the cost of carrying a position shifts from a positive return to a persistent cash outflow. | The intrinsic randomness of the funding rate anchoring mechanism | Section 17.3 |
| III | Counterparty and platform | An exchange collapse, an API outage, or a freeze on funds makes one "leg" of an arbitrage position vanish instantly, destroying the hedge structure. | Market fragmentation; the absence of a central counterparty | Section 17.4 |
| IV | Execution and timing | Trade legs across multiple platforms and contracts cannot be perfectly synchronized, producing slippage, partial fills, and price deviation. | Physical latency; network congestion; differences in exchange performance | Section 17.5 |
| V | Liquidity depletion (in its extreme form, the "liquidity black hole") | Under extreme market volatility, liquidity evaporates rapidly, so arbitrageurs cannot exit at reasonable prices and may even be caught in a stampede. | The endogeneity of arbitrageurs' own behavior; collective action | Section 17.6 |
| VI | Smart contract and oracle | For on-chain perpetual futures, code vulnerabilities, oracle manipulation, or cross-chain bridge attacks can cause asset losses or render a strategy ineffective. | The rigidity of "code is law"; dependence on external data | Section 17.7 |
| VII | Regulation and compliance | Sudden changes in laws and regulations can block certain trading routes, spike compliance costs, or even force a platform to halt service. | The uncertainty and fragmentation of the global regulatory environment | Section 17.8 |
Table 17-2. The arbitrage-constraint taxonomy and its core mechanisms (Data source: compiled by the author)
The taxonomy is designed to follow a layered logic from the inside out. The margin-and-forced-liquidation and funding-rate-reversal dimensions are the native risks of the perpetual futures institution: they arise directly from its core mechanism design and are the fundamental risks that distinguish it from other derivatives. The counterparty-and-platform and execution-and-timing dimensions are market-structure risks, determined by the current reality of crypto markets—many coexisting exchanges and the absence of a unified clearing infrastructure. The liquidity-depletion dimension is an endogenous risk: it is not imposed from outside but generated by the collective behavior of the arbitrageur population, reflecting positive-feedback effects within the system. The smart-contract-and-oracle dimension is a technical-infrastructure risk, applying mainly to decentralized derivatives protocols. Finally, the regulation-and-compliance dimension is an external-environment risk, representing the macro-level uncertainty emanating from the real-world legal system.
The key insight of this topological framework is that it reveals the common origin of the high returns and high risks of perpetual futures arbitrage. The two most central risks—the margin-and-forced-liquidation and funding-rate-reversal dimensions—are almost absent, or present only very mildly, in traditional futures arbitrage. It is precisely to compensate for these additional and profound risks that the market must offer perpetual futures arbitrageurs a higher expected return. This is consistent with the AIH of Chapter 16: arbitrageurs' excess returns are not costless gains but a "service fee" collected, in their role as providers of market infrastructure, for bearing systemic risk.
17.1.4 The temporal structure of risk
Having constructed the seven-dimensional spatial topology of risk, we must also introduce the dimension of time to observe how this structure evolves dynamically. Arbitrage constraints are not static: their intensity and their correlations change dramatically as the market regime shifts. As shown in Figure 17-2, the temporal structure of risk can be divided into three principal states: normal, stressed, and resonant.
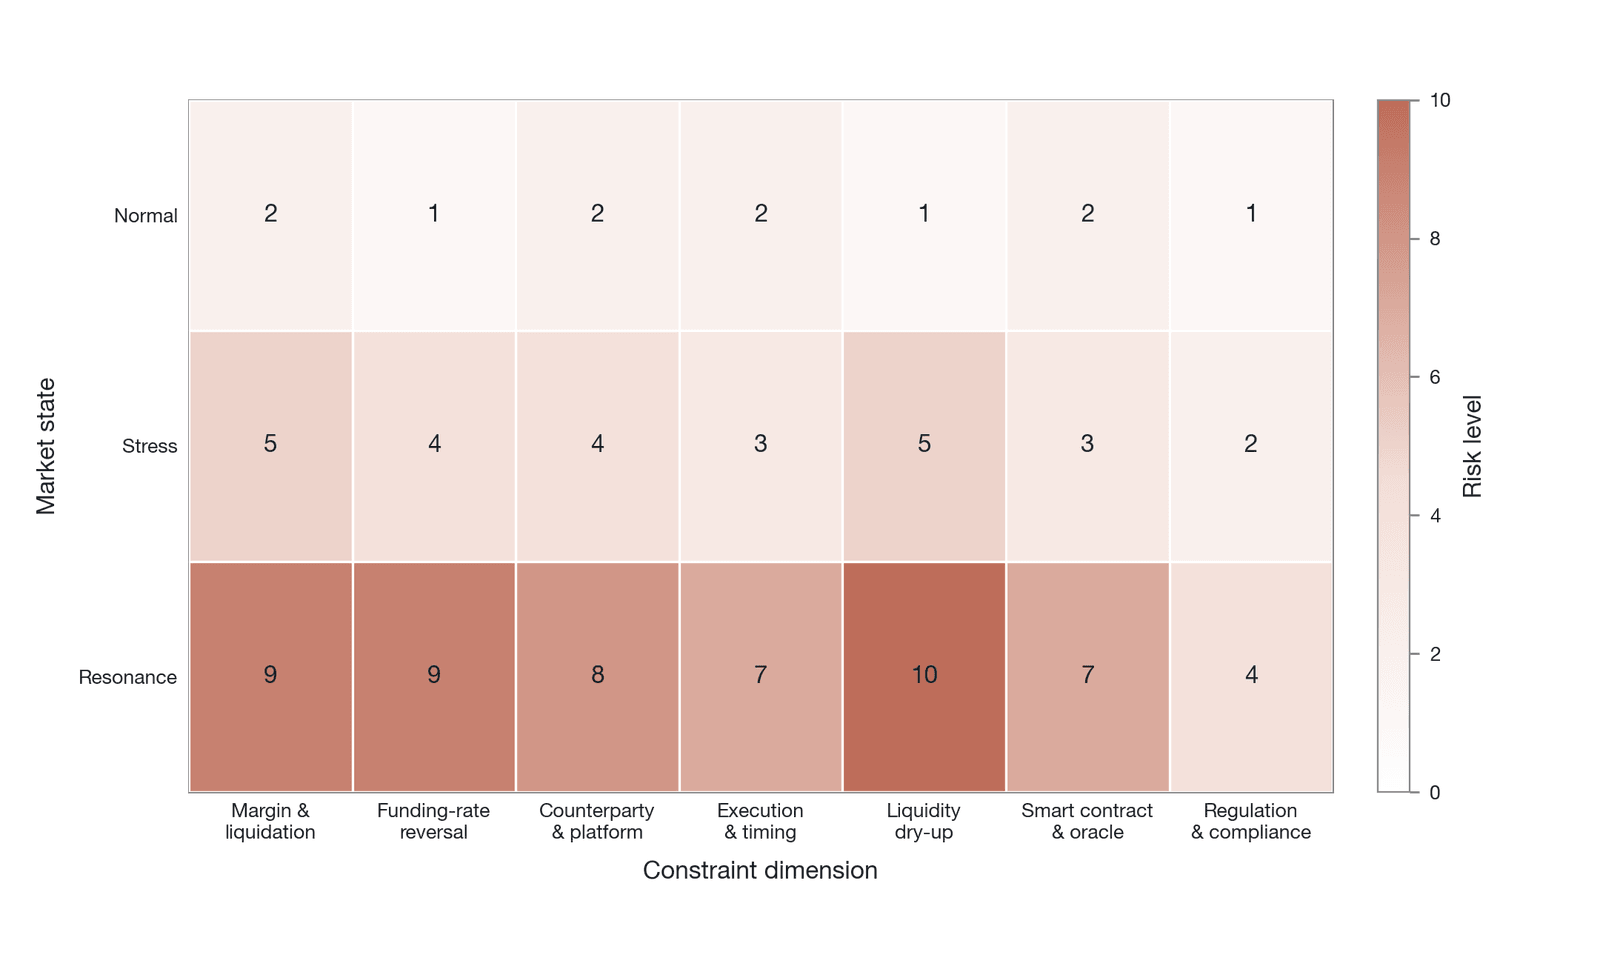
Figure 17-2. A classification framework for arbitrage risk (Data source: drawn by the author; the values shown are the author's risk ratings on an ordinal 1–10 scale, not empirical data)
In a normal market, the seven constraints are independent of one another and low in intensity. The funding rate fluctuates steadily around a small positive value, market liquidity is ample, price movements are mild, and platforms operate stably. In this environment, risk is identifiable, measurable, and largely manageable. Arbitrageurs can hedge most of it through careful calculation and diversification; arbitrage proceeds smoothly, and market efficiency is maintained at a high level. Arbitrage here more closely resembles a systematic, quantitative operation.
When the market suffers a shock—say, a sudden and large price pullback—the system enters the stressed state. Several constraint dimensions now tighten markedly. Violent price swings cause the pressure in the margin-and-forced-liquidation dimension to spike, and many positions face margin calls or the threat of forced liquidation. Market panic may drive the funding-rate-reversal dimension, so that positive cash-flow returns narrow or even turn negative. At the same time, a surge in trading volume can trigger risk in the execution-and-timing dimension, and slippage and latency become severe. In the stressed state, risks are no longer isolated: they begin to interconnect, though a severe chain reaction has not yet formed. Arbitrageurs' profit margins are compressed, they are forced to cut position sizes to survive, and overall market efficiency begins to decline noticeably.
The highest-risk state—and the core of this chapter's theoretical contribution—is the resonant state. When the market suffers an extreme shock, such as a black-swan event, the system may jump from the stressed state to the resonant state (as shown in Figure 17-3). Now the constraints in several dimensions, or even all seven, are activated simultaneously; they no longer add up in a simple linear fashion but form destructive positive-feedback loops that amplify one another, causing arbitrage capacity to contract nonlinearly and abruptly (the dimension-by-dimension transmission chain and the empirical review appear in Section 17.9). Arbitrageurs, who normally serve as market stabilizers, now face pressure on their own survival and may even become a force that intensifies the market collapse. It is precisely during risk resonance that the transmission mechanism of market efficiency is severely obstructed and a cluster of extreme price anomalies (examined in detail in Chapter 18) emerges.
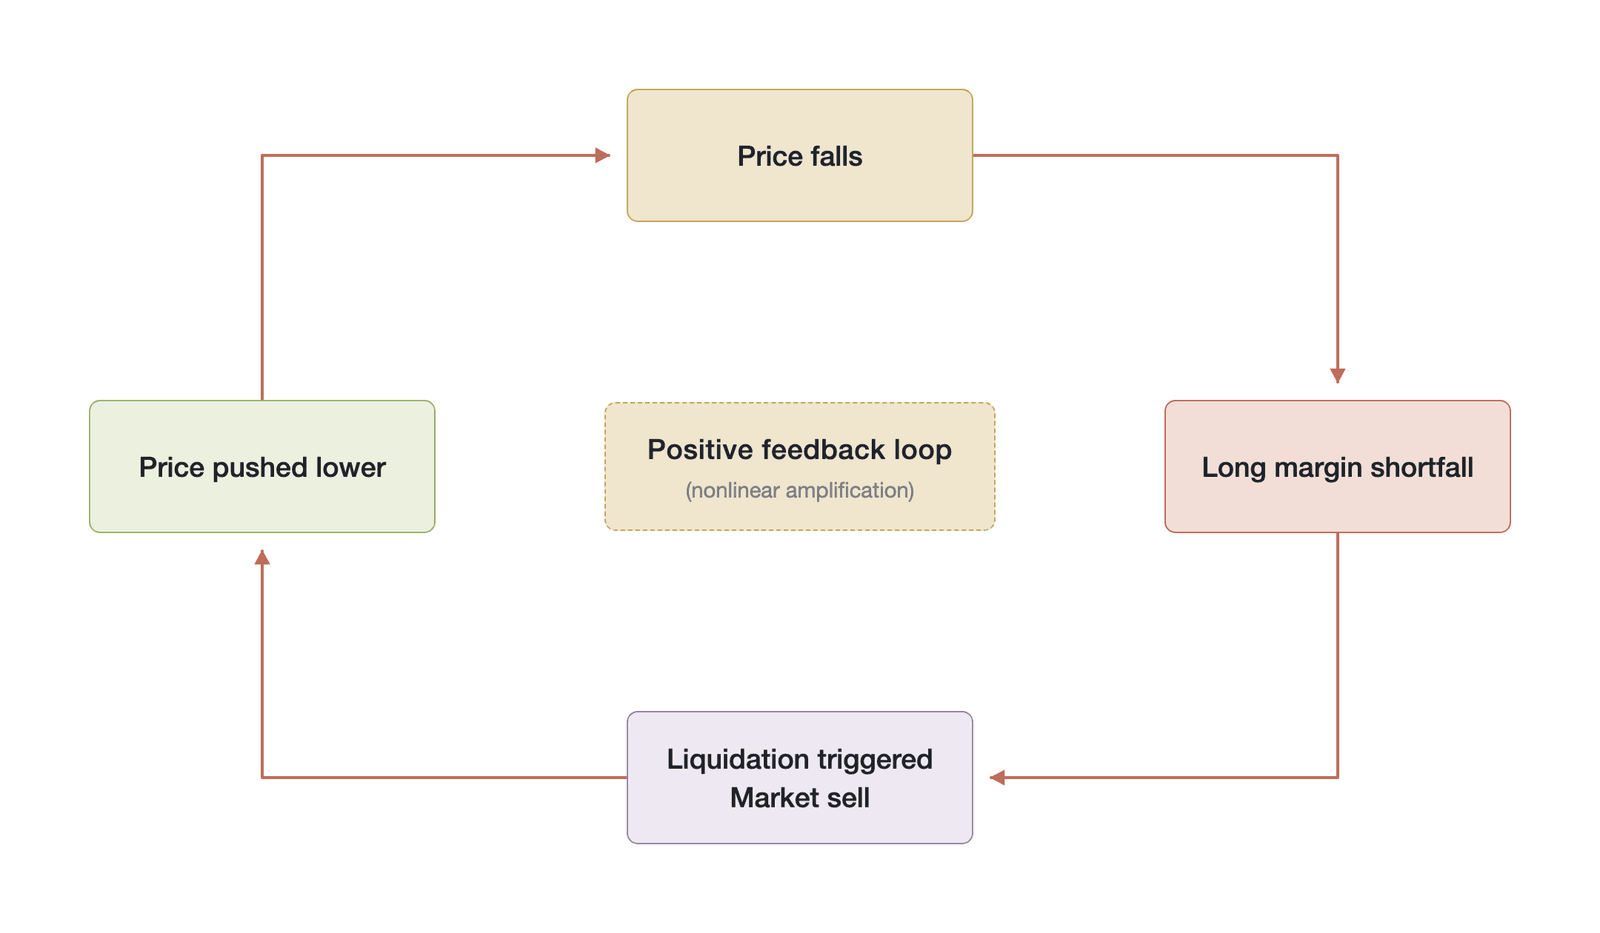
Figure 17-3. Schematic of the price–margin–liquidation positive-feedback loop in the risk-resonance state (Data source: conceptual mechanism schematic drawn by the author, not empirical data)
Understanding this temporal structure of risk—from independence in the normal state, to tightening in the stressed state, to nonlinear amplification in the resonant state—is the key to understanding why crypto markets appear highly efficient most of the time yet reveal extreme fragility at critical moments. It marks the boundary of the arbitrage mechanism's power to maintain efficiency, and it provides the dynamic, macro-level backdrop for each specific constraint dimension explored below.
To make this three-state framework operational, one must identify observable indicators of regime transition. Candidate indicators include the z-score of the funding rate (its deviation from the historical mean, in standard deviations), the ratio of market-wide liquidation volume to open interest, the intraday coefficient of variation of order-book depth, and the dispersion of the basis across exchanges. When several of these indicators simultaneously cross their respective historical-percentile thresholds, this can be read as an early-warning signal that the system is transitioning from normal to stressed, or from stressed to resonant. This approach is consistent in methodological spirit with the Markov regime-switching model of Hamilton (1989) [6], although a formal estimation of a three-state model for crypto markets still awaits future empirical research.
17.2 Margin and forced liquidation
The margin regime is a core component of the perpetual futures design. Through leverage, it magnifies capital efficiency and lets traders participate in the market at a scale far exceeding their principal. Yet the margin regime is also the most direct constraint on arbitrage. It turns a theoretically delta-neutral strategy into a practical problem bounded by capital management and the ability to forecast risk. The health of the margin account directly determines whether an arbitrage position can survive, and the forced-liquidation mechanism sets a hard boundary condition on the failure of an arbitrage strategy. This section examines four core aspects of the margin-and-forced-liquidation dimension, showing how it fundamentally limits the scale of arbitrage and, under specific conditions, gives rise to systemic market risk.
17.2.1 How margin constrains the scale of arbitrage
In perpetual futures markets, the margin regime directly determines the maximum position size an arbitrageur can deploy, constituting the first hard ceiling on the scale of arbitrage. Analyzing spread data across major exchanges, Makarov and Schoar (2020) [7] found that the capture rate of cross-exchange arbitrage opportunities is far below theoretical expectations, and that many viable spreads go unexecuted because capital cannot be redeployed across platforms in time. This finding demonstrates the systematic constraining effect of the margin regime on the force of arbitrage.
A rational arbitrageur must keep effective leverage far below the maximum the exchange permits, preserving an ample safety buffer against potential mark-to-market losses (see Figure 17-4). Although mainstream perpetual futures platforms commonly offer nominal leverage as high as 100x or even 125x, a prudent arbitrageur, for reasons of survival, typically keeps effective leverage well below that ceiling—say, between 3x and 10x—to retain a sufficient margin of safety. In practice, the leverage available to arbitrageurs is further and systematically suppressed by exchanges' tiered-margin regimes. On major exchanges, margin requirements are not a fixed ratio but rise in steps with the notional size of the position. Consider an illustrative tier structure (the exact tiers vary by exchange): at a low notional value, the initial margin rate may be as little as 1% (corresponding to roughly 100x maximum leverage), but as notional value rises into the millions of dollars, the initial margin rate may climb to 5% (roughly 20x), and at still larger sizes may require more than 10%. This means that the effective leverage ceiling faced by large arbitrage institutions is systematically lower than that of small participants, and their capital efficiency is markedly suppressed by the tier system. Tiered margin thus imposes another structural constraint on scaling arbitrage: the larger the position, the higher the marginal margin requirement and the lower the return on capital. On this illustrative basis, an arbitrageur with $1 million of capital may prudently run a position of only about $3 million to $10 million—far short of the $100 million that would be theoretically possible in an unconstrained case. In this way, the margin regime substantially compresses an individual arbitrageur's capacity to deploy capital.
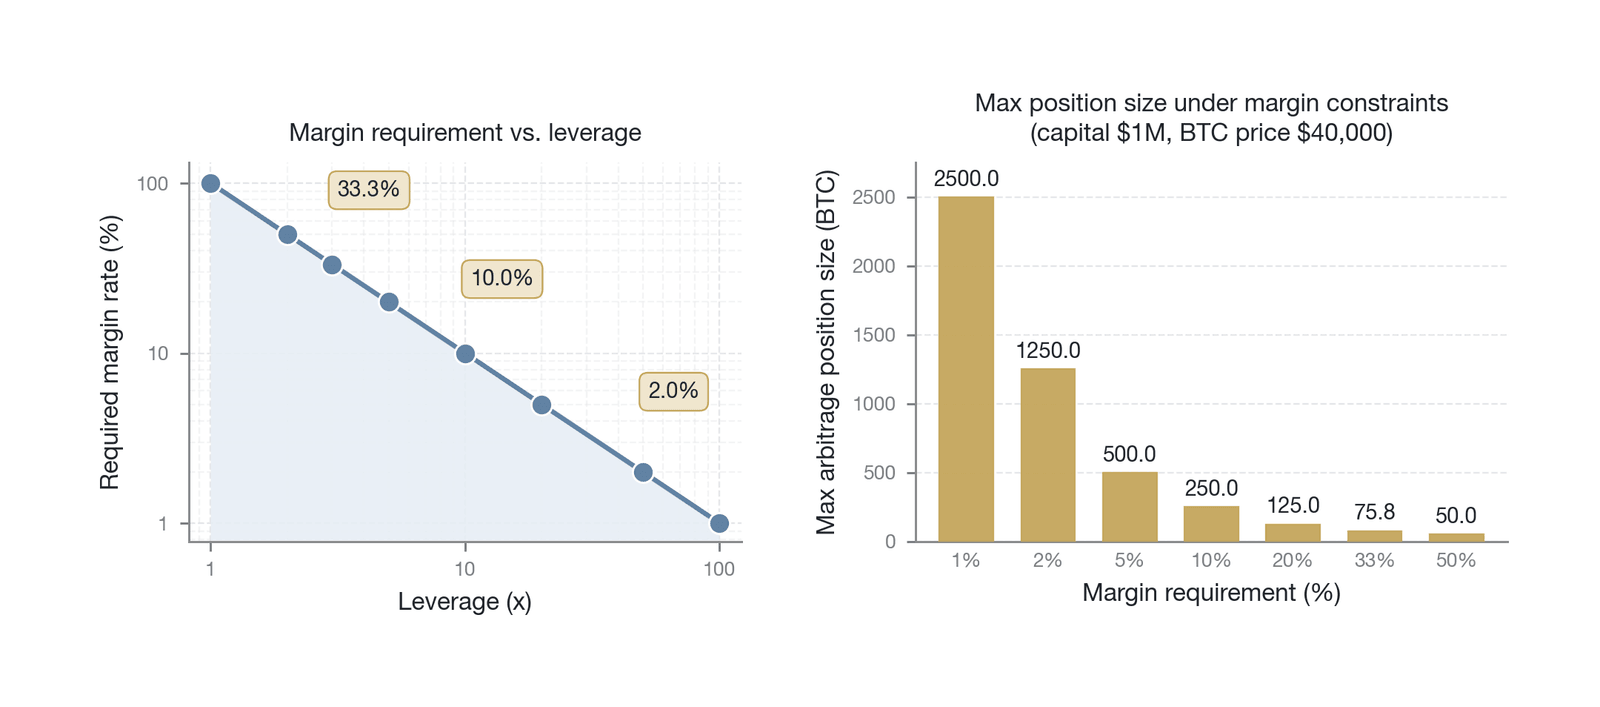
Figure 17-4. The relationship between leverage and margin requirements (Data source: drawn by the author)
Figure 17-4 reveals the key trade-off between leverage and the liquidation buffer: the higher the leverage, the narrower the price cushion before forced liquidation. At 5x leverage, the price must move roughly 20% against the position to trigger liquidation; at 20x, an adverse move of only about 5% is enough to wipe it out. A rational arbitrageur must carefully weigh capital efficiency against the probability of survival.
This constraint affects different types of arbitrage strategy very differently. For a basis trade conducted within a single exchange—for example, holding a spot long and a perpetual futures short on the same platform simultaneously—an exchange that offers portfolio margin can net the risks of the two positions and thereby lower the overall margin requirement. For the great majority of strategies that must be executed across platforms, however, the margin constraint is magnified several times over. Cross-exchange basis arbitrage (Section 16.5), for instance, requires establishing positions on two separate exchanges, so sufficient margin must be pre-funded on both. Funding rate arbitrage (Section 16.7) likewise faces margin pressure on both ends. For more complex multi-leg strategies, such as triangular arbitrage (Section 16.6), capital may need to be deployed across three or more trading pairs or platforms, and total capital demand is the sum of the margin requirements of all legs rather than the margin on the net exposure. CEX-DEX arbitrage (Section 16.9) involves two entirely different systems of capital commitment—a centralized margin account on the centralized-exchange (CEX) side and an on-chain collateral pool on the decentralized-exchange (DEX) side—which further compounds the complexity of capital management. This fragmentation of the margin regime is examined more fully in Section 17.2.4.
17.2.2 The cascading-liquidation mechanism
Brunnermeier and Pedersen (2009) [8] revealed the deep linkage between margin constraints and market liquidity: when falling asset prices tighten margin, traders are forced to sell, which pushes prices down further and triggers additional margin calls—a margin spiral. This mechanism is especially pronounced in perpetual futures markets.
If the margin regime is a static constraint on capital, forced liquidation is a dynamic mechanism that amplifies risk. It is not merely the failure of one trader's risk management but a market mechanism with pronounced negative externalities and positive-feedback characteristics. Under extreme conditions, a single large forced-liquidation event is fully capable of triggering a market-wide wave of liquidations—a liquidation cascade.
The mechanism of a liquidation cascade is a textbook positive-feedback loop. When market prices fall sharply, the margin levels of many highly leveraged long positions drop below the maintenance margin requirement, and the positions are taken over by the exchange's liquidation engine. To close these risky positions as quickly as possible, the liquidation engine typically dumps them onto the market with market orders or aggressive limit orders (see Figure 17-5). This description reflects a simplified model of early exchange liquidation mechanisms. The liquidation engines of modern major exchanges have evolved into multi-layered designs. The first layer is progressive deleveraging: when the margin ratio falls to a warning line, the system forcibly closes only part of the position to bring leverage back to a safe level, rather than liquidating the whole position at once. The second layer is algorithmic execution: for large positions, the engine uses iceberg orders or a time-weighted average price (TWAP) strategy to execute in tranches and reduce market impact. The third layer is market-maker takeover: some exchanges maintain a liquidation-takeover engine that allows designated market makers to absorb liquidated positions at prices better than the bankruptcy price. In the DEX arena, liquidation mechanisms take different forms: dYdX v4 uses Dutch-auction liquidations, while GMX relies on a keeper network to trigger liquidations and carries an inherent delay. Although these buffering mechanisms work effectively in most market swings, in a systemic crisis—when liquidation volume grows exponentially over a short interval—every line of defense in the layered design can be breached one by one, and the process still degenerates into large-scale, market-impact selling. In an environment where liquidity has already contracted markedly, these large sell orders rapidly consume the depth on the bid side and intensify downward price pressure. The further fall in price then trips the liquidation lines of a new batch of leveraged positions, prompting still larger market selling, and the cycle repeats to form a self-reinforcing downward spiral. In the process, market liquidity is rapidly drained, the bid-ask spread widens sharply, and subsequent liquidations must execute at worse prices—compounding the destructive power of the entire cycle.
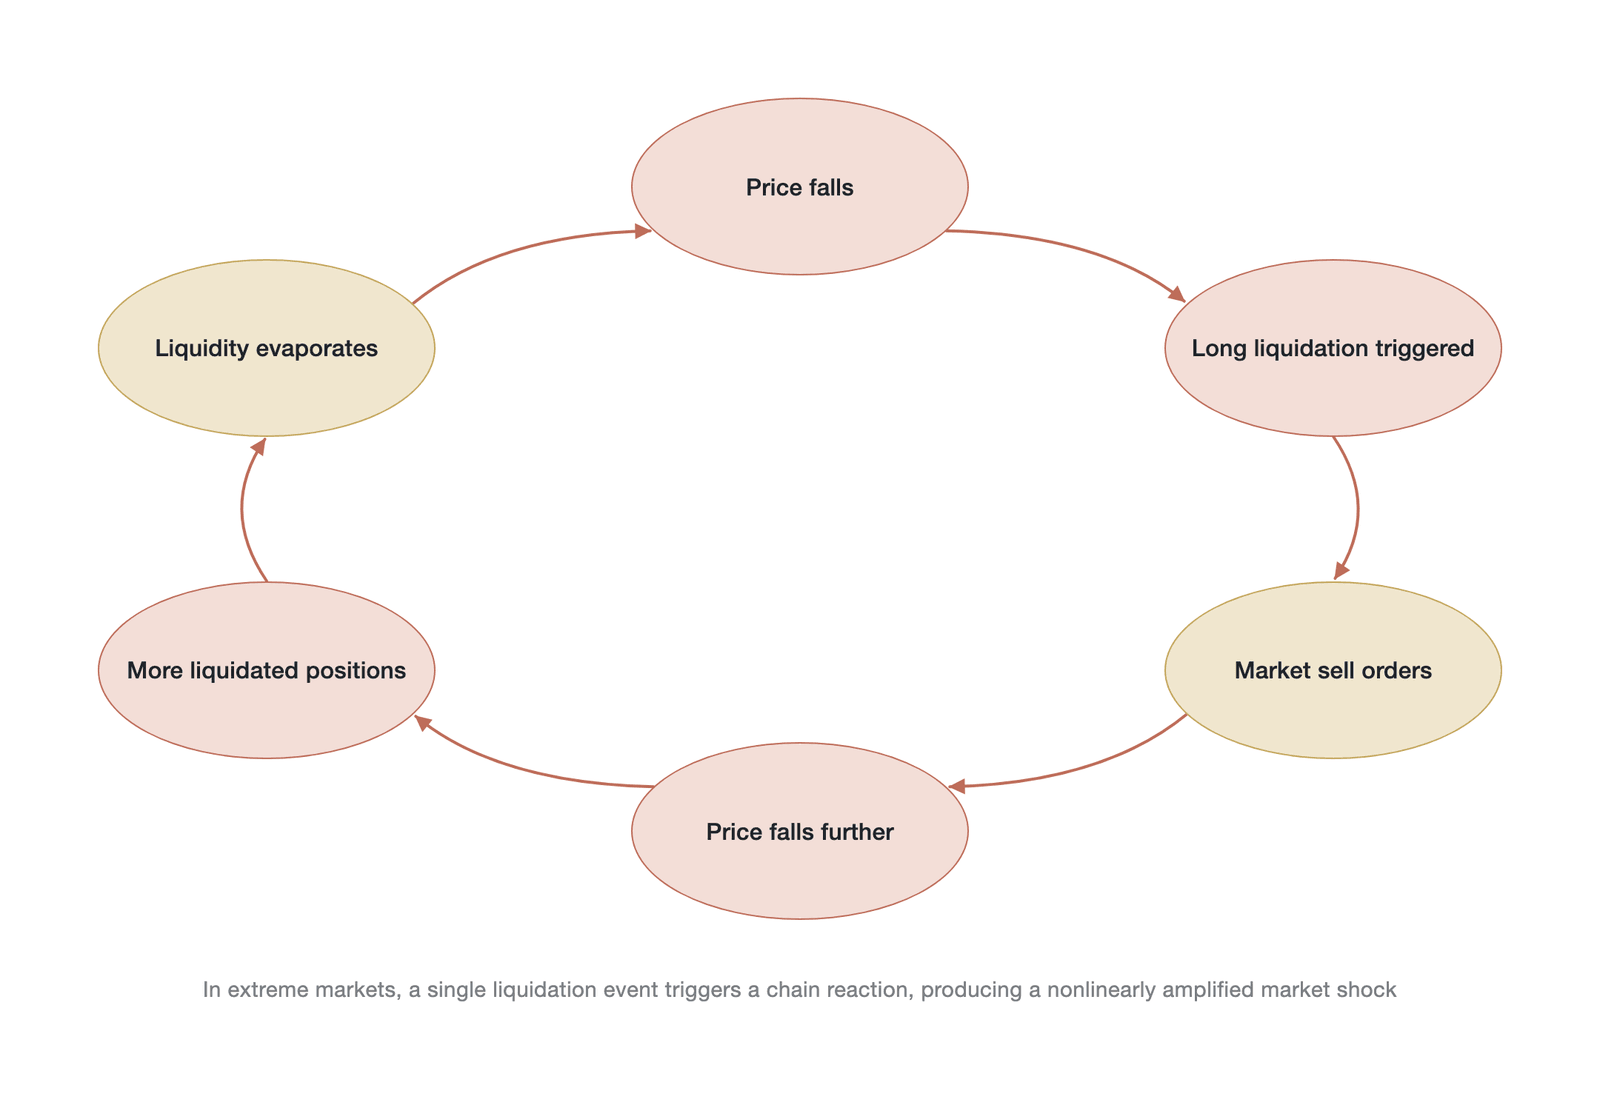
Figure 17-5. Schematic of the positive-feedback-loop mechanism of a liquidation cascade (Data source: mechanism schematic drawn by the author, not empirical data)
For arbitrageurs, the impact of a liquidation cascade is especially significant. A standard basis arbitrageur's position—a spot long plus a perpetual futures short—is, in theory, market-neutral, so price movements alone should not affect its net value. When a liquidation cascade occurs, however, this theoretical neutrality often breaks down. On the one hand, a steep price decline can shrink the value of the spot asset; if that spot is also pledged as collateral for other positions, it directly increases the arbitrageur's overall margin pressure. On the other hand, a more immediate risk arises: even if the arbitrageur's perpetual futures short is sitting on unrealized gains as prices fall, the liquidation of a long position held on the same exchange—belonging, say, to an unrelated statistical-arbitrage strategy—may exhaust all the margin in the account and force the profitable short to be closed as well, or vice versa. A more dangerous scenario still is when the liquidation of an arbitrageur's position on Exchange A leaves the overall strategy no longer delta-neutral, exposing naked directional risk on the other leg at Exchange B. If Exchange B then also experiences violent price swings through market contagion, the arbitrageur may face the extreme case of large losses on both sides at once.
The mark price mechanism—praised in Chapter 15 for preventing manipulation and protecting traders—can also produce unintended adverse effects in a liquidation cascade, giving rise to what may be called a latency trap. The mark price is far from a simple moving average. On Binance, for example, it is the median of three candidate prices: two are computed from the spot index price plus a moving average of the funding-rate basis, and the third is the bid-ask midpoint of the contract. This design means a funding-rate component is embedded in the mark price, so that under extreme conditions the mark price itself may deviate from spot. In analyzing a liquidation cascade, one must distinguish two deviations of different natures. The first is the lagged deviation of the mark price relative to the spot index price, which reflects the inertia of the smoothing mechanism and is the direct cause of the latency trap. The second is the deviation of the perpetual futures traded price relative to the mark price, which reflects the quality of price discovery and the state of immediate liquidity within the perpetual futures itself. The causes and risk implications of the two deviations are entirely different. Because the mark price changes more smoothly than the latest traded price on any single exchange, in a normal market it effectively filters out local, transient price aberrations and prevents traders from being liquidated by a malicious "wick." When the market moves sharply in one direction, however—for example, in a cliff-edge price drop—the smoothing property of the mark price inevitably lags the true, rapidly changing market price. Many positions have therefore already reached their liquidation line in real terms, but because the mark price has not yet "caught up," the liquidation is delayed. On the surface, this delay gives traders a buffer, but in practice it can allow liquidation pressure to accumulate further. When the market keeps falling and finally drags the mark price across the liquidation threshold, the positions whose liquidation was delayed have grown to an enormous quantity; they are then thrown onto the market simultaneously, delivering a single, far more violent shock and amplifying the destructive power of the liquidation cascade exponentially.
17.2.3 The temporal constraint of no expiry date
A widely circulated market adage holds that "the market can remain irrational longer than you can remain solvent." (The line is often misattributed to Keynes, but no definitive source appears in his writings; the earliest traceable formulation is by the investment analyst A. Gary Shilling in the 1980s.) In the world of perpetual futures arbitrage, this maxim can be rewritten precisely as: "The basis can remain dislocated longer than an arbitrageur's margin can last." Behind it lies a fundamental difference in risk structure between perpetual futures and traditional deliverable futures—the open-ended risk exposure created by the absence of an expiry date, the time trap.
For a traditional deliverable-futures arbitrageur, the strategy carries an implicit and ultimate guarantee of certainty: the delivery date at expiry. However violently the basis between futures and spot swings during the holding period—driven by sentiment, supply-demand imbalances, and the like—once the delivery date arrives, the design of the delivery mechanism ensures that the two prices must converge. As long as the arbitrageur has enough margin to "ride out" the finite interval from opening the position to the delivery date, the arbitrage return is ultimately certain. The expiry mechanism gives the arbitrageur a guarantee that the strategy will eventually converge.
Perpetual futures shatter this certainty completely. Because they have no delivery date, their price is anchored entirely by the "streaming" mechanism of the funding rate rather than by a fixed "endpoint." This mechanism is the core advantage that lets perpetual futures track the spot price continuously, but from a risk perspective it constitutes a significant structural hazard. With no expiry date to force final convergence, the basis between the perpetual futures price and the spot price can, in theory, deviate forever. For a basis arbitrageur—buying spot and shorting perpetual futures, say—if the basis (perpetual price minus spot price) moves from negative to ever more deeply negative, the short perpetual leg keeps generating unrealized losses. Because no definite "future date" guarantees that the basis will revert, the arbitrageur must bear these unrealized losses on their own margin for an indefinite period. The consumption of capital along the time dimension is continuous and cumulative (see Figure 17-6). The cost of capital accumulates linearly over time and may ultimately exhaust the entire margin, forcing the arbitrageur out through liquidation before the basis finally reverts.
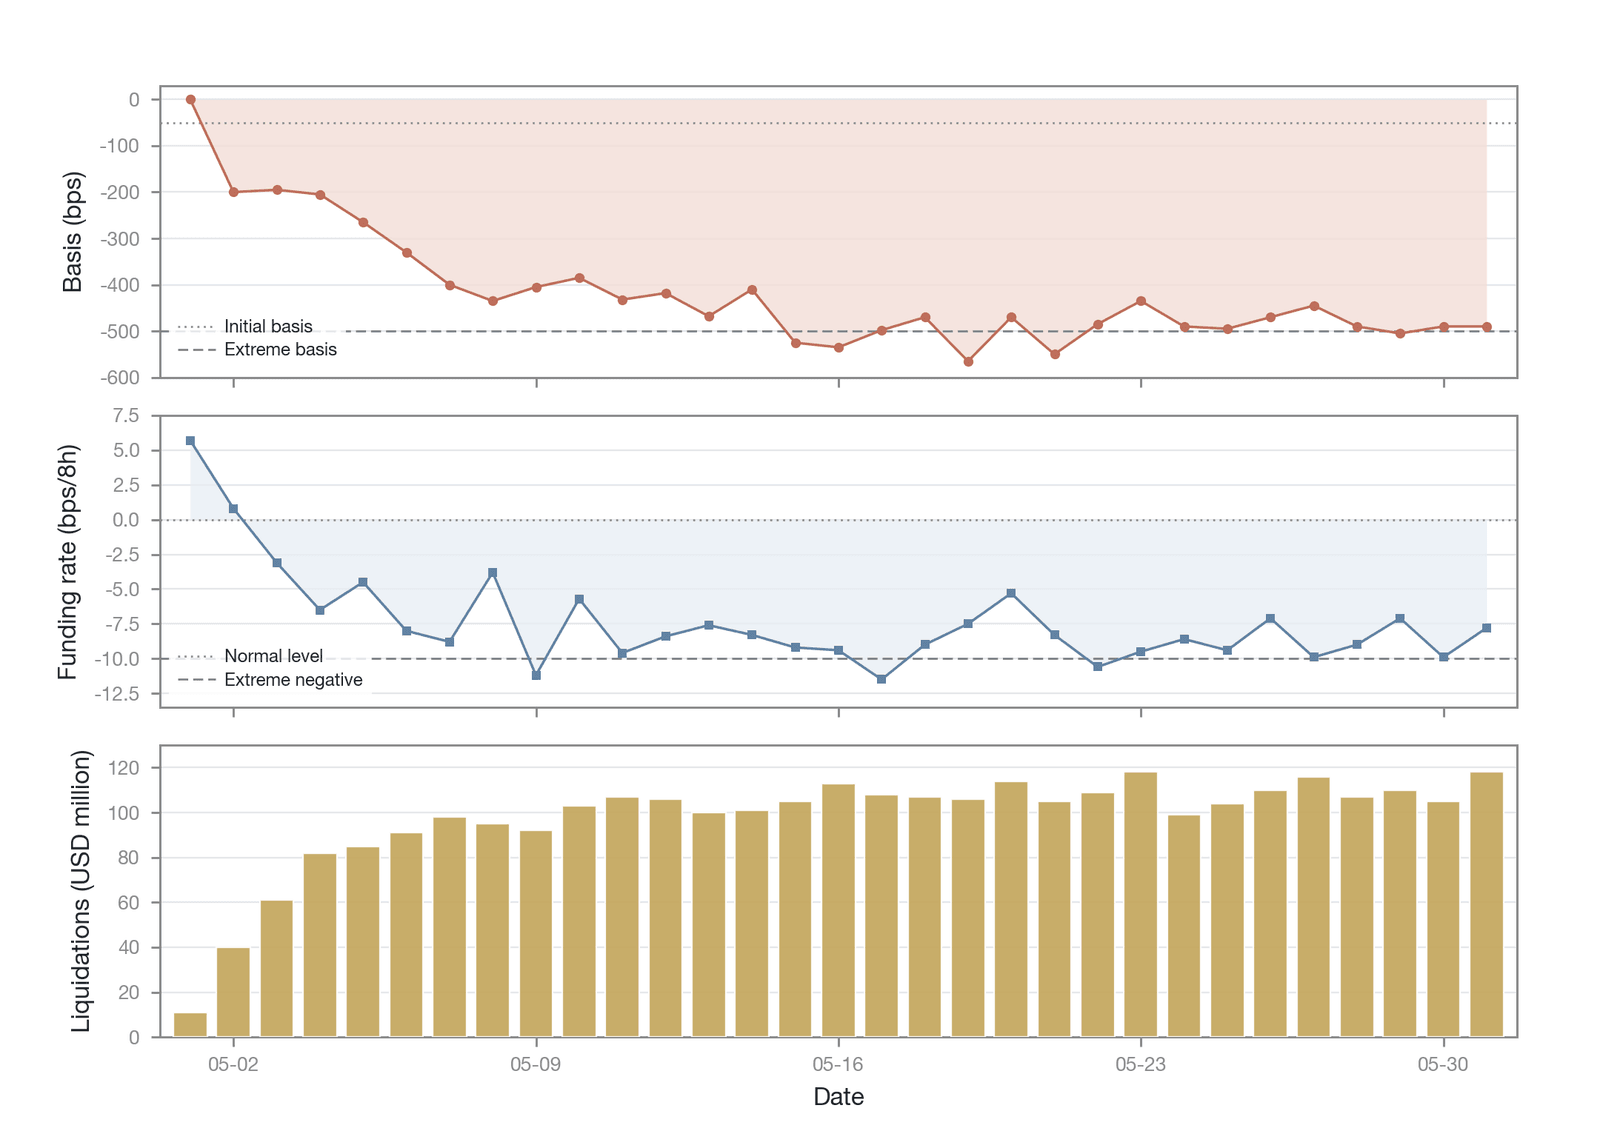
Figure 17-6. The evolution of the perpetual futures basis, funding rate, and liquidation volume during the market turmoil of May 2022 (Data source: representative series sketched by the author; the magnitudes—the basis widening from about −50 bps to below −500 bps and the rate turning deeply negative—are consistent with the text, and are not day-by-day empirical data)
Historical data have repeatedly confirmed the practical impact of this temporal constraint. In the market turmoil triggered by the LUNA/UST collapse in May 2022, the basis on Bitcoin perpetual futures widened sharply within a few weeks from around −50 basis points to below −500 basis points. For basis arbitrageurs who had entered beforehand, this meant their short positions came under enormous unrealized-loss pressure. At the same time, extreme market panic flipped the funding rate from positive to deeply negative, so they had not only to top up margin against the unrealized losses but also to keep paying steep funding to the longs. The source of return became a persistent cost, and margin was eroded from both sides. Many strategies that were robust under normal conditions exhausted all their margin reserves under this dual pressure of a widening basis and negative funding. Successive episodes of market extremes have repeatedly set new records for the duration and magnitude of basis dislocation. Together, these extremes constitute the "tail scenario" that arbitrageurs must take seriously and prepare for when designing their margin-management strategies. Their core risk is never a misjudgment of direction—the strategy is neutral by construction—but the exhaustion of capital before the mean reversion they firmly believe in actually occurs.
17.2.4 Cross-exchange margin fragmentation
Unlike traditional financial markets, where portfolio margining and netting are achieved through a central clearinghouse, today's cryptocurrency markets lack a comparable mechanism for optimizing capital efficiency across platforms. The market is highly fragmented: each centralized exchange is an independent, closed clearing system (see Figure 17-7) with its own account structure, risk engine, and clearing process. This means a profitable position on one exchange cannot automatically offset the margin requirement of a losing position on another. For traders engaged in cross-exchange arbitrage, this is a significant constraint on capital efficiency.
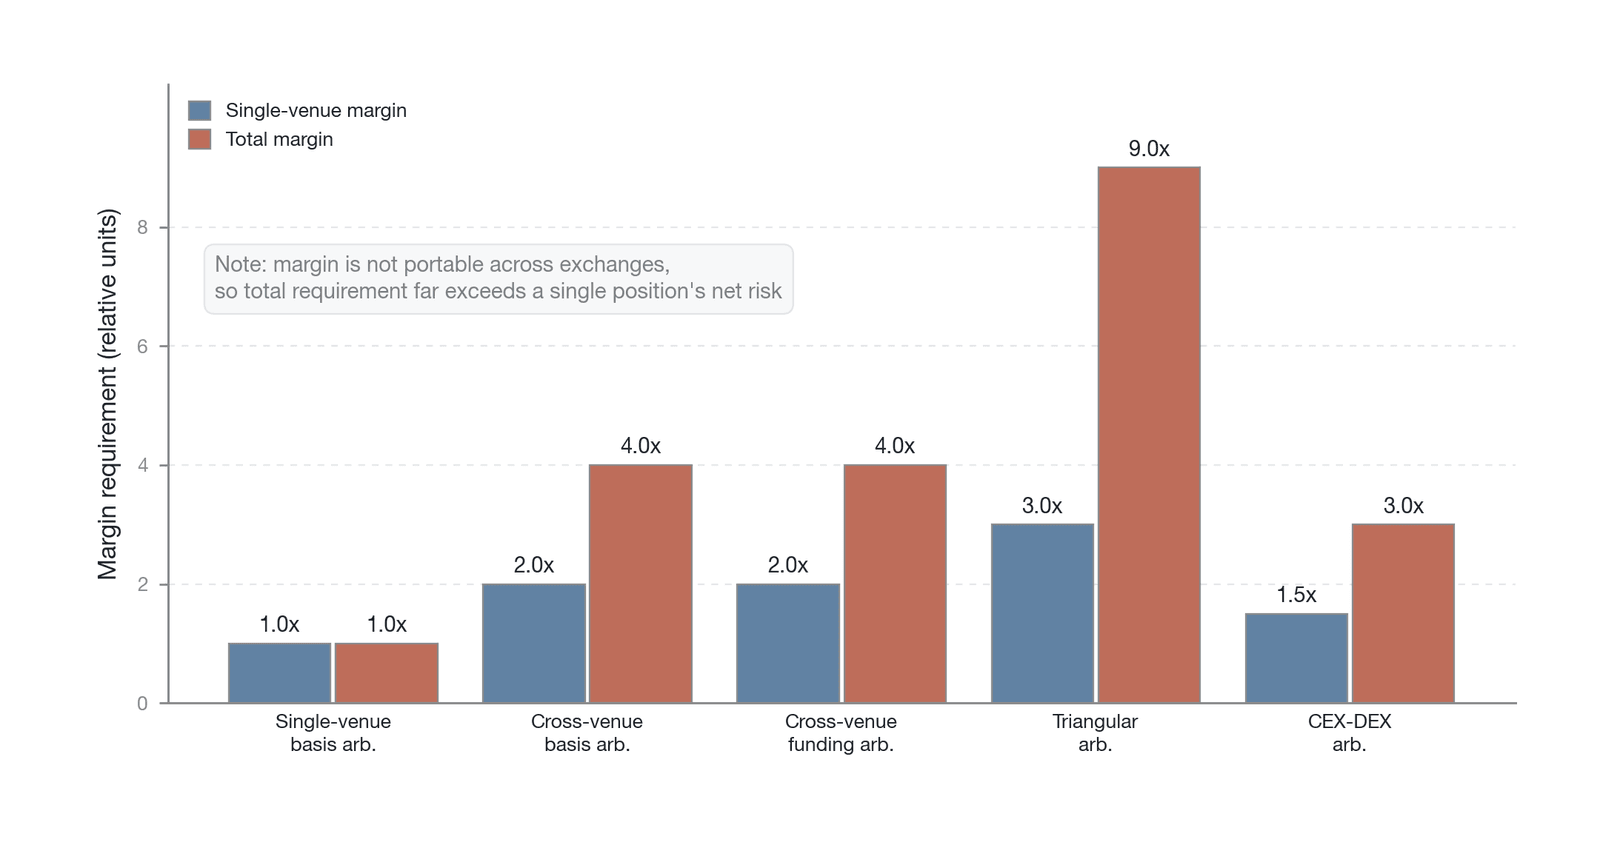
Figure 17-7. Schematic of the structure of cross-exchange margin fragmentation (Data source: structural schematic drawn by the author; the relative multiples are illustrative values, not empirical data)
As the figure shows, in a fragmented market structure an arbitrageur must maintain a separate margin account on each independent exchange, and gains and losses cannot flow automatically between them. When one end incurs an unrealized loss and requires additional margin, the unrealized gain at the other end cannot be called upon in real time; the arbitrageur must redeploy funds manually through on-chain transfers or a withdrawal-and-deposit process—a procedure exposed to serious timing risk when markets are moving violently.
Suppose an arbitrageur finds that the BTC perpetual futures price on Binance is higher than the BTC spot price on Coinbase. The arbitrageur must simultaneously buy BTC spot on Coinbase and short BTC perpetual futures on Binance. Although the net exposure of the combined position is close to zero, sufficient funds must be deposited on both Coinbase and Binance: Coinbase needs cash to buy the spot, and Binance needs margin to open the short. If the market price rises, the Binance short generates an unrealized loss and requires additional margin; meanwhile, although the Coinbase spot is appreciating, that unrealized gain cannot be recognized by Binance's margin system and cannot automatically cover Binance's margin shortfall. The arbitrageur must manually withdraw from Coinbase and transfer to Binance—a process that is both slow and, when markets are moving violently, fraught with operational risk. To keep the strategy running robustly, therefore, the arbitrageur is forced to pre-fund each participating exchange with a large amount of "idle" margin far exceeding what the actual net risk requires, held in reserve for contingencies. As a result, total capital committed may be several times the margin that the net exposure alone would require, which markedly lowers the return on capital and directly limits the total scale of arbitrage opportunities the trader can pursue.
In recent years, some exchanges have introduced so-called unified margin accounts or portfolio-margin features, which let users pledge multiple crypto assets in the account as unified collateral and allow gains and losses to offset one another across different coins and product lines (spot, perpetual futures, options). This alleviates capital fragmentation within an exchange to some degree and improves capital efficiency on a single platform. For the heart of crypto-market arbitrage, however—cross-exchange arbitrage—the problem remains unsolved. As long as exchanges remain independent clearing entities, cross-platform margin cannot be pooled. This is a core competitive advantage of large, well-capitalized trading institutions—top high-frequency trading firms and market makers—over small and midsize arbitrageurs. Their vast capital lets them pre-fund enormous sums across all major exchanges, enabling them to capture the fleeting cross-exchange opportunities that demand the highest capital efficiency—a domain ordinary participants can scarcely reach.
In practice, professional arbitrage firms have developed tools that partly mitigate cross-exchange margin fragmentation. Crypto prime-brokerage providers, such as FalconX and Hidden Road, offer cross-exchange netting and credit lines that let institutional clients adjust their effective margin levels across platforms without physically moving funds. Off-exchange settlement networks, such as Copper ClearLoop, reduce the need to shuttle funds by custodying capital with an independent third party while the client trades across multiple exchanges. Yet these intermediary services introduce a new counterparty risk of their own. As the impact of the FTX collapse on institutions that used its settlement infrastructure revealed, reliance on intermediary services can become a new node for transmitting systemic risk in a crisis.
17.2.5 A quantitative framework for the margin constraint
The margin constraint is not merely a qualitative risk factor but a mathematical problem that can be quantified precisely. For a rational, risk-averse arbitrageur, the objective is not to maximize the return on any single trade but to seek long-term, steady capital growth subject to a given probability of survival (that is, of not being liquidated). This naturally raises a central quantitative question: given the capital base, the margin requirements, and the expected distribution of future market volatility (particularly basis volatility), what is the optimal size of the arbitrage position?
Building such a quantitative framework requires the joint consideration of several key parameters. The first is the exchange's margin rules, including the initial margin rate and the maintenance margin rate; these two ratios directly define the upper bound on leverage and the threshold that triggers liquidation. The second is the arbitrageur's own total capital and risk appetite; as shown in Figure 17-8, the latter can be expressed as the maximum drawdown one is willing to bear or an acceptable probability of liquidation (for example, wishing to keep the probability of being liquidated within the next year below 1%). The third, and most central, input variable is the estimate of the future volatility of the target spread (such as the basis). This estimate cannot rest on the historical average alone but must fully account for the fat tails of the distribution—the fact that the likelihood of extreme, low-probability events is far higher than a normal distribution predicts. Drawing on tools designed to characterize the tail of a distribution, such as extreme value theory, rather than simply applying a normality assumption, is essential to computing a sufficiently robust margin level.
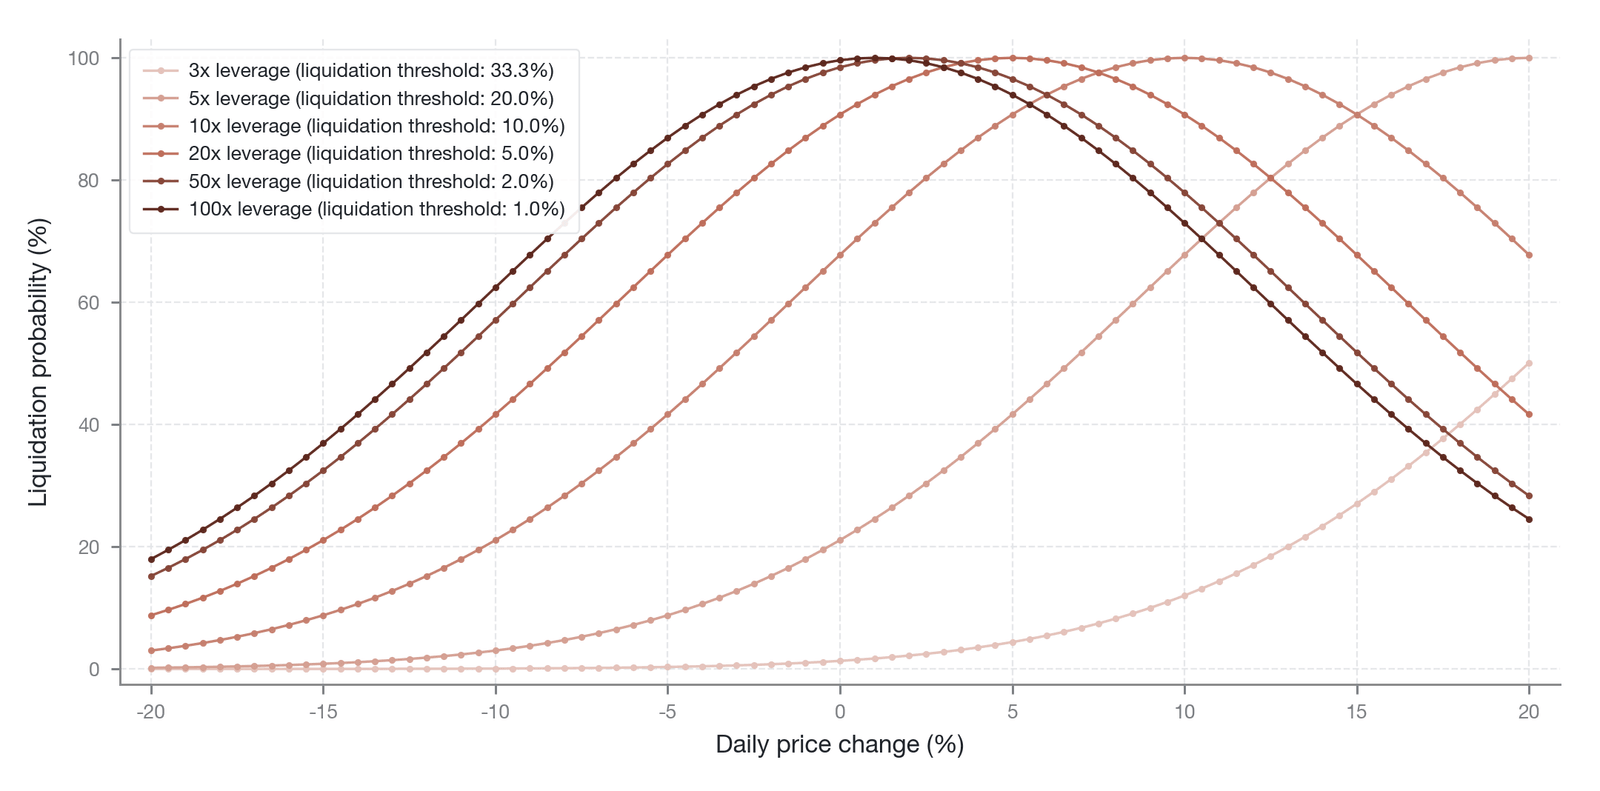
Figure 17-8. The relationship between the magnitude of intraday price movement and the probability of liquidation across leverage levels (Data source: drawn by the author; an illustration of modeling based on extreme value theory, not empirical data)
The figure illustrates the relationship between the magnitude of intraday price movement and the probability of liquidation across leverage levels. The higher the leverage, the smaller the price move needed to trigger liquidation (the liquidation threshold is only about 1% at 100x leverage, versus about 33.3% at 3x); hence, for the same market volatility, a highly leveraged position has a markedly higher probability of liquidation than a low-leverage one. Modeled with extreme value theory, the curve highlights the fragility of highly leveraged arbitrage positions in the face of tail price movements—the fundamental reason a rational arbitrageur must deliberately hold effective leverage far below the ceiling.
In a simplified model, consider a basis-arbitrage strategy whose risk stems mainly from an adverse widening of the basis. The daily volatility of the basis, σ, can be estimated from historical data or from options-implied volatility. If the arbitrageur uses L-times leverage, the initial margin rate is 1/L. An adverse move in the basis large enough to cause liquidation is approximately (1/L) × (1 − MMR/IMR)—that is, IMR − MMR, where IMR is the initial margin requirement and MMR the maintenance margin requirement. Given the probability distribution of basis movements, one can compute the probability that, on any given day, the basis moves beyond this liquidation threshold. Conversely, given an acceptable single-day liquidation probability P_target (0.01%, say), one can back out the maximum safe leverage L_safe permissible under that risk constraint. The optimal arbitrage position size is then total capital multiplied by L_safe.
The core insight of this quantitative framework is that the risk-adjusted optimal position is typically far smaller than the position that could be built in an "unconstrained" ideal world. The force of arbitrage is systematically and endogenously "discounted." This provides a solid microfoundation for the theory of the limits of arbitrage set out in Section 17.1. Precisely because every rational arbitrageur imposes this kind of self-constraint, the market's efficiency gap is never fully or instantly closed, and arbitrage returns therefore persist as compensation for margin risk. The framework also makes clear the dynamic relationship between risk and efficiency: when market volatility intensifies or exchanges raise margin requirements, the safe leverage L_safe that every arbitrageur computes falls systematically, the market-wide total of arbitrage positions contracts, and market efficiency declines predictably. This mechanism is the microfoundation for how a tightening of constraints maps directly into a lower upper bound on market efficiency, echoing the efficiency spectrum framework established in Chapter 15.
The framework above implicitly assumes that basis movements are independent and identically distributed across periods. Empirical research shows, however, that basis series exhibit pronounced autocorrelation and volatility clustering: extreme deviations are often not isolated single-day events but successive shocks lasting several days. A more robust analytical tool than the single-day liquidation probability is therefore the first-passage-time distribution—the time it takes for the margin balance to fall from its initial level below the liquidation threshold for the first time. This approach captures path-dependent risk and provides a more prudent basis for setting the margin buffer.
17.3 Funding rate reversal
The funding rate mechanism gives basis arbitrageurs a persistent source of positive carry. Yet it is here that the intrinsic contradiction in the perpetual futures design is most fully revealed. The funding rate that serves as the source of arbitrage return is not itself a fixed parameter but a random variable that swings sharply with market sentiment, supply and demand, and price expectations. When market conditions reverse, the anchoring mechanism abruptly changes direction—from a source of profit to a persistent drain on capital. This chapter calls this phenomenon funding rate reversal.
To understand the mechanism of funding rate reversal precisely, it helps to recall how the rate is computed. The standard funding rate has two components: the interest rate component (usually fixed at 0.01% per 8 hours, reflecting the interest differential between holding stablecoins and holding crypto assets) and the premium component (which measures the deviation of the perpetual futures price from the spot index). The final funding rate is typically further bounded by a clamp function to prevent the rate from diverging without limit under extreme conditions. Different exchanges set different rate bounds: Binance, for example, caps each period's rate within the [−2%, +2%] band, and Bybit's limits are broadly comparable. These bounds seem immaterial in a normal market, but under extreme conditions they constitute a key institutional constraint: they effectively cap the loss from any single funding period and thus limit, to a degree, the instantaneous destructive power of a rate reversal. Even with the single-period rate capped, however, extreme negative rates over many consecutive periods can still erode margin fatally through their cumulative effect—precisely the tail risk of funding-rate polarization discussed below.
This section examines a risk dimension unique to perpetual futures arbitrage. Unlike traditional deliverable-futures arbitrage, in which the basis converges deterministically over time, the funding rate faced by perpetual futures arbitrageurs is fundamentally uncertain. When the funding rate on which the arbitrageur relies for return reverses, it not only drives profit to zero but can inflict substantial losses in a short period. We begin with the negative funding rate trap latent in a positive-carry strategy and, through a quantitative analysis of historical funding-rate data, reveal the tail risk of its polarization. We then take the Ethena protocol as a case study to examine the systemic fragility exposed when scaled-up, protocol-level arbitrage meets sustained negative funding. Finally, the section shows how funding rate reversal and the margin pressure discussed in the previous section form a cross-amplifying effect—a risk resonance of considerable destructive power—providing the first concrete illustration of why arbitrage capacity collapses nonlinearly in extreme markets.
17.3.1 The negative funding rate trap
The return model of the basis-arbitrage strategy rests on a key implicit assumption: that the funding rate will remain positive. When the market environment changes drastically, this assumption fails.
At that point, the negative funding rate trap is sprung. In a panic sell-off, investors rush into the perpetual futures market to short as a hedge or a speculation, demand for short positions surges, and the perpetual futures price falls to a deep discount to spot. By the logic of the funding-rate calculation, the rate quickly turns negative in order to balance the long and short sides. The cash flow that once served as a source of return now reverses: it is the shorts—the basis arbitrageurs—who must pay the longs. The positive-cash-flow structure the arbitrageur built not only stops producing income but turns into a persistent negative cash flow.
The problem does not end there. Funding rate reversal usually coincides with a sharp fall in the underlying asset's price, which subjects the basis arbitrageur to double or even triple pressure. First, negative funding is a direct and continuing operating cost that erodes the position's capital. Second, although the short perpetual futures leg earns unrealized gains as prices fall, the equivalent spot holding suffers a real loss. The symmetry of this profit-and-loss settlement depends heavily on the margin-account mode the arbitrageur uses. Under isolated margin, each position's profit and loss is accounted for separately, and the short's unrealized gain indeed cannot be automatically released as available margin for other positions. Under cross margin, the unrealized profit and loss of all positions on the same exchange jointly determine the account's available balance, and the short's unrealized gain can offset the spot-side pressure to some degree. Under a unified margin account (such as the portfolio-margin feature some exchanges offer), profit-and-loss hedging across product lines is more efficient still. Yet however optimized the within-exchange account mode may be, the settlement asymmetry in the cross-exchange case always persists—and it is this that is the core vulnerability through which margin pressure is amplified in a crisis. When an arbitrageur's spot loss on Exchange A cannot be offset by the unrealized gain on perpetual futures at Exchange B, the spot loss is reflected immediately in account equity, whereas the unrealized gain on the perpetual futures leg cannot be fully released as available margin until the position is closed. This mismatch in settlement timing significantly increases margin pressure, as discussed in Section 17.2. Finally, when the arbitrageur, unable to bear the continuing negative-funding cost and margin pressure, tries to close out, they often find that market liquidity has dried up, producing enormous exit slippage, and the basis may already have widened far beyond expectations. A mathematically flawless delta-neutral strategy thus turns, under real-world constraints, into an adverse position that steadily consumes capital.
17.3.2 The tail risk of funding-rate polarization
Understanding the negative funding rate trap cannot stop at the qualitative level; a quantitative analysis is needed to grasp the true magnitude of the risk. Because the funding rate is a derivative of a market price, the statistical distribution of its time series reveals the source of its risk. Unlike an idealized random process that follows a normal distribution, the funding rate on perpetual futures exhibits pronounced leptokurtosis and fat tails, meaning that extreme events—rates far above or far below the average—occur with a probability well beyond what a normal distribution predicts.
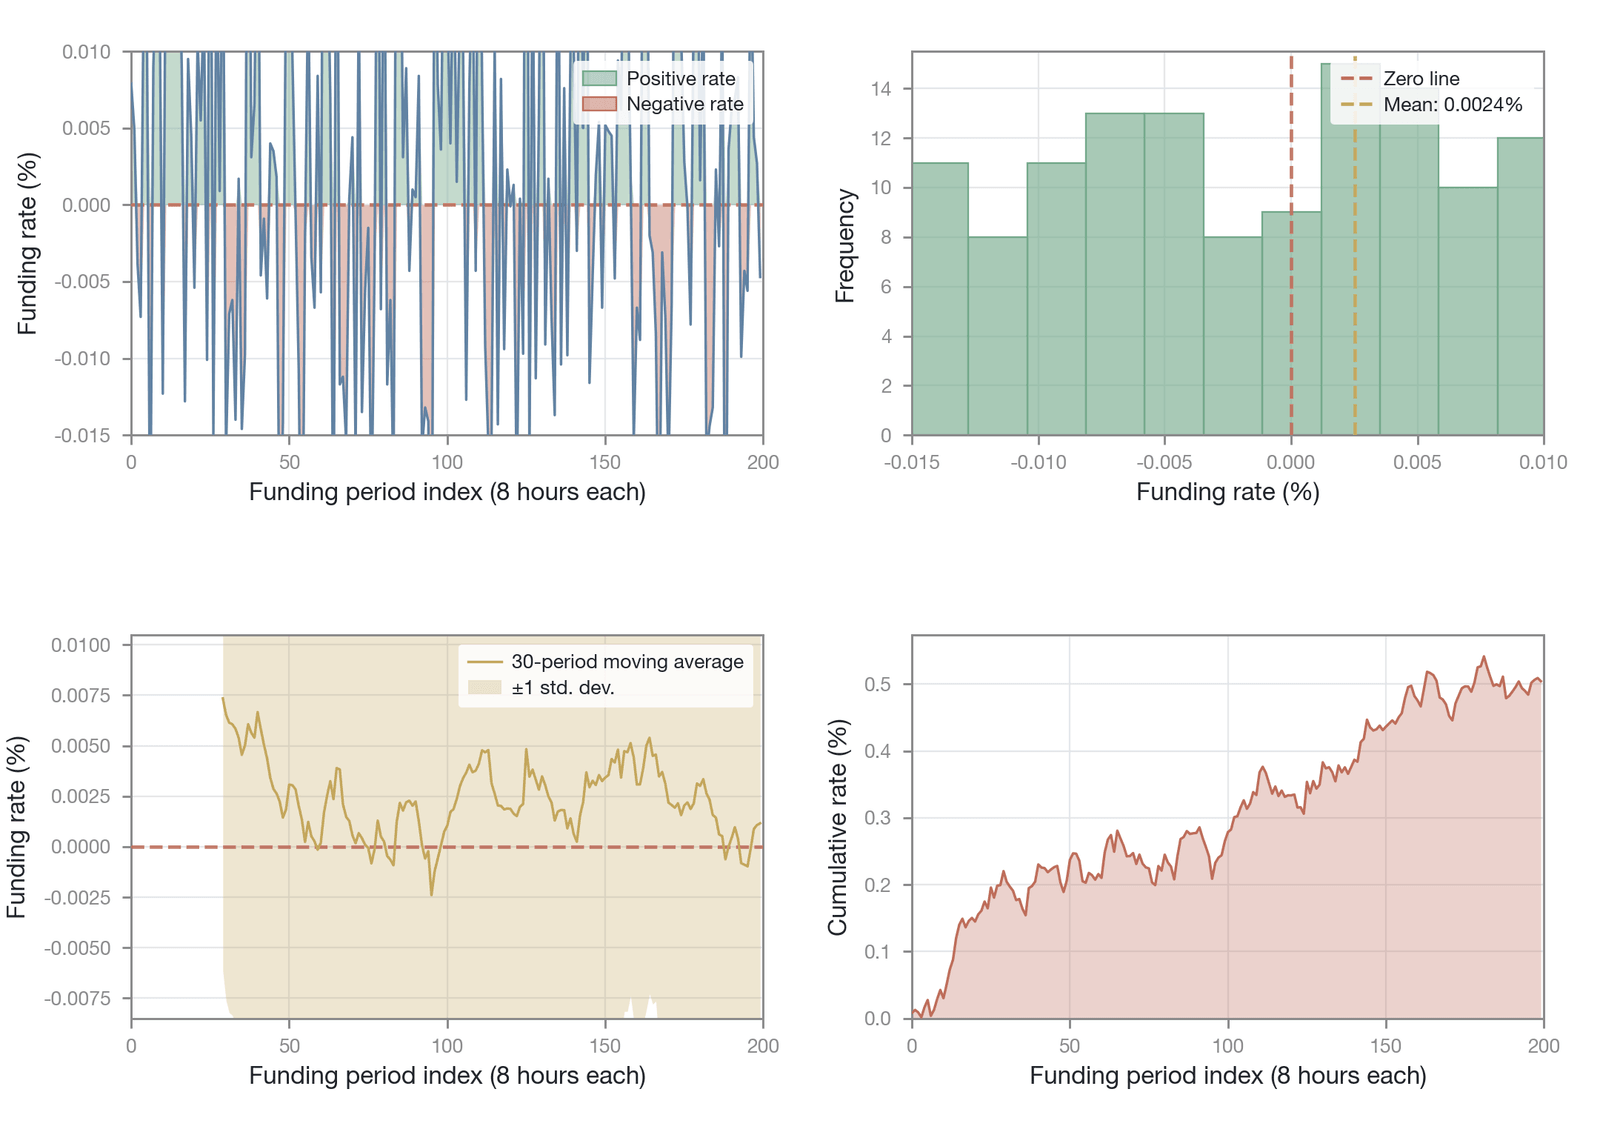
Figure 17-9. The statistical distribution and fat tails of the funding rate on BTC perpetual futures (Data source: drawn by the author; simulated/illustrative data based on extreme value theory, not empirical; for the fat-tail phenomenon shown, see Coinglass [9])
The four panels of Figure 17-9 together display the leptokurtosis and fat tails of the BTC funding rate: the rate clusters mostly near zero, while the extreme negative-rate events in the tail of the distribution pose the gravest threat to a basis-arbitrage strategy.
This fat-tailed distribution means that relying on the historical average rate to assess a strategy's expected return is seriously misleading. The historical mean masks the destructive potential of extreme events. A strategy that appears to yield 10% annualized may, in a single extreme negative-funding episode lasting several days, lose months' or even a year's worth of profit. Stress testing therefore becomes an indispensable part of an arbitrageur's risk management. The essence of a stress test is to simulate the maximum loss an arbitrage position might face, and its ability to survive, under extremely adverse market conditions.
A simple stress-test framework can be built as follows. Consider a basis-arbitrage position at 10x leverage, with an initial margin requirement of 10% and a maintenance margin requirement of 5%. The question is how long the position can avoid forced liquidation when it meets a run of extreme negative funding. As a stress-test example, assume an extreme negative-funding scenario (the parameter magnitudes can be referenced to historical runs of negative funding, but the figures below are assumed values set for illustration): an average funding rate of −0.05% over 21 consecutive settlement periods (that is, 7 days). Over those 7 days, the arbitrageur's total cost is 21 × −0.05% = −1.05%. For a 10x-leveraged position, a 1.05% loss of notional principal consumes 10.5% of the initial margin (10%). Extending the extreme assumption to 42 consecutive settlement periods (14 days), the cumulative loss reaches 2.1% of notional principal and consumes 21% of the initial margin, materially eroding the margin buffer and driving the position toward the maintenance-margin line. This calculation makes clear that, in an extreme rate-reversal scenario, the fragility of a highly leveraged arbitrage position is sharply amplified.
This leads to an important qualification of the mean-reversion property of the funding rate discussed in Chapter 16. Chapter 16 noted that the presence of arbitrage causes the funding rate to revert to its mean over the long run. This is correct in theory, but for a real arbitrageur in the market it can be a dangerous oversimplification. The key problem is that the speed and path of mean reversion are highly uncertain. As the widely circulated adage warns, "the market can remain irrational longer than you can remain solvent." Before the funding rate reverts to its long-run mean, a leveraged arbitrageur may already have been liquidated for want of margin. A quantitative assessment of tail risk, and a capital buffer sized accordingly, is therefore the decisive dividing line between the professional arbitrageur and the amateur.
17.3.3 Ethena and sustained negative funding
Once basis arbitrage is run at scale and packaged into a protocol, the risk of funding rate reversal takes on a systemic character. The Ethena protocol packages the "hold spot, short perpetual" basis trade into the synthetic dollar USDe, and the yield to sUSDe holders derives almost entirely from positive funding on perpetual futures.
The fragility of this model is laid bare when the funding rate reverses. When market sentiment turns and the rate goes negative, the protocol's source of return instantly becomes a cost of carry. This triggers a clear chain of risk transmission: negative funding lowers the sUSDe yield, and rational holders begin to redeem USDe. Through a behavioral-finance lens, this redemption process is likely to be highly nonlinear: when the sUSDe yield declines mildly, most holders tend to wait and see (the joint effect of anchoring and the disposition effect); but once the yield falls below some psychological threshold—below zero, say, or below the rate on a traditional money-market fund—it can trigger the self-fulfilling run described by Diamond and Dybvig (1983) [10], and redemptions escalate in an instant from a trickle to a flood. The protocol is then forced to close its short positions on the market to meet redemptions; the large-scale unwinding pushes the perpetual futures price up and drives the funding rate more negative still; and more holders redeem in panic. This positive-feedback loop—negative funding → redemptions → unwinding → still more negative funding—is the core systemic risk facing protocol-level arbitrage.
In addition, Ethena's collateral mix includes liquid staking derivatives such as stETH, which introduces an extra risk layer independent of the funding rate: in an episode of extreme market panic—such as the Celsius/3AC events of June 2022—stETH can trade at a marked discount to ETH, further eroding the value of Ethena's collateral and compounding the shock from funding rate reversal. A detailed analysis of this risk layer appears in Section 17.10.
During the market correction of April 2024, this transmission mechanism received an initial confirmation: on-chain data from Ethena Labs (2024) [11] show a marked increase in USDe redemptions, though this did not escalate into a full-blown run at the time. A complete analysis of Ethena's risk exposure—including the "too big to unwind" paradox created by its concentration, the item-by-item mapping onto the seven-dimensional constraint topology, and a detailed review of the April 2024 stress test—is developed in Section 17.10.
17.3.4 The cross-amplification of funding and margin
If funding rate reversal and margin pressure are challenges the arbitrageur meets along two separate dimensions, then when both dimensions are activated at once, the destructive power they generate is not a simple linear sum but a cross-amplifying effect with the character of resonance. This resonance is the key to understanding why arbitrage strategies collapse nonlinearly in extreme markets, and it is the first concrete instance of the risk resonance model examined in depth later in this chapter.
The mechanism of this cross-amplification can be analyzed by reconstructing a typical market-crash scenario.
A sharp market decline triggers the initial pressure. The market meets sudden bad news, and prices begin to fall steeply. For an arbitrageur holding a "buy spot, short perpetual" basis position, the delta-neutral structure begins to be tested. Although the short perpetual leg earns unrealized gains as prices fall, the spot holding is suffering a real loss. As noted earlier, because of the asymmetry in the settlement mechanism, the spot loss directly reduces account equity, whereas the unrealized gain on the perpetual leg often cannot be fully counted as available margin until the position is closed. The arbitrageur's margin level therefore begins to fall, bringing initial pressure from the margin-and-forced-liquidation dimension.
On top of this, panic drives the funding rate to reverse. As panic spreads, large numbers of investors rush into the perpetual futures market to short, and the funding rate flips quickly from positive to negative. The funding-rate-reversal dimension is now activated. The arbitrageur's former source of return has instantly become a continuing cost, and with every funding settlement period the account's margin is passively consumed.
When these two pressures act together, the cross-amplification of the double pressure emerges. The arbitrageur is now trapped by the superposition of two pressures. On the one hand, the continuing price decline steadily widens the loss on the spot side and keeps pressing on margin. On the other, the persistently negative funding rate keeps consuming margin. These two originally independent sources of pressure now form a vicious cycle: negative funding accelerates the consumption of margin, so the arbitrageur approaches the maintenance-margin line faster and is more easily liquidated; at the same time, the increased margin pressure sharply reduces the arbitrageur's capacity to withstand the shock of continued negative funding. A position that could originally have endured weeks of negative funding may, against the backdrop of a large spot-price decline, be liquidated within a few days.
This cross-amplification markedly shortens the arbitrageur's "survival time." A position that could hold up under pressure along a single dimension becomes extraordinarily fragile when the two pressures resonate. It captures the core idea of the limits-of-arbitrage theory: the arbitrageur's risk stems not from any logical flaw in the strategy but from the fact that, under real-world constraints, they "exhaust the capital needed to hold the position before the basis converges or the market returns to rationality." The resonance of funding rate reversal and margin pressure is precisely the catalyst and accelerant of this capital-consumption process, revealing how, in a complex financial system, risk propagates across dimensions and ultimately produces systemic instability. This lays an important intuitive foundation for the more comprehensive risk resonance model built in Section 17.9.
17.4 Counterparty and platform risk
In the risk topology of perpetual futures arbitrage, if margin and funding-rate risks are structural constraints endogenous to the contract's design, then counterparty and platform risk is the fragility of the infrastructure on which arbitrageurs themselves depend. Traditional financial markets manage and dissolve counterparty risk through the institutional innovation of the central counterparty (CCP), letting traders concentrate on market risk itself. In the current cryptocurrency market structure, however, there is no industry-wide central counterparty. Each centralized exchange is an independent, externally unaudited, self-regulating clearing center and asset custodian. This fragmented structure means that any cross-exchange arbitrage position is not merely a judgment about a market spread but an implicit trust that two (or more) platforms will remain financially sound, operationally fair, and technically available. When that basis of trust dissolves, an arbitrage strategy—however mathematically perfect—fails instantly.
This section examines three core manifestations of platform risk: the outright collapse of an exchange, temporary functional failures (such as a withdrawal freeze), and, as the last line of defense, insurance-fund depletion and the auto-deleveraging mechanism. Together, these risks constitute the highest-risk "broken-leg" scenario in arbitrage trading—when one leg of a hedge fails through platform risk and the other is left fully exposed to market swings.
17.4.1 Lessons from the FTX collapse
The collapse of FTX in November 2022 gave the entire crypto market its most painful and profound case study of platform risk. For arbitrageurs who relied on cross-platform operations, the FTX collapse was no distant piece of industry news but a direct blow to their trading positions. It vividly illustrated how, when one of the platforms a strategy depends on suddenly fails, a carefully constructed hedge can turn in an instant into a fully exposed, one-sided bet.
Consider a typical basis arbitrageur's situation. During a broadly bullish period, the arbitrageur buys 10 BTC of spot on Binance while shorting BTC perpetual futures on FTX at an equivalent notional. This is a textbook delta-neutral strategy: movements in the spot price are fully hedged by the profit and loss on the perpetual futures, and the arbitrageur's return comes mainly from the persistently positive funding rate on FTX. When FTX abruptly announced a suspension of user withdrawals on November 8, however, the risk character of this strategy changed fundamentally.
As panic spread, the BTC price began to plunge. The value of the arbitrageur's spot long on Binance shrank rapidly, producing a large unrealized loss. Ordinarily, that loss would be hedged by the unrealized gain on the short perpetual position at FTX. But by now FTX account information was inaccessible, and the short's "profit" was merely a number on a screen—it could not be closed, still less withdrawn. The arbitrageur could neither transfer the FTX gain to Binance to cover the spot loss nor close the short on FTX and sell the spot on Binance to terminate the whole strategy. As a result, the short leg meant to serve as a hedge was effectively "dead," leaving only the Binance spot long to bear all the market's downside alone. A "risk-free" arbitrage strategy degenerated in an instant into a naked long position.
FTX's subsequent bankruptcy proceedings and regulatory filings revealed the root of the problem. According to charges by the Commodity Futures Trading Commission (CFTC) and bankruptcy filings, the platform had a shortfall in customer assets on the order of $8 billion, and its affiliated trading firm, Alameda Research, had misappropriated about $10 billion of customer funds [12]; early media reports likewise indicated that at least $1 billion to $2 billion of customer funds was unaccounted for [13]. This meant that even though the arbitrageur's short position showed a profit on paper, the money was long gone from the exchange's vault. Platform risk here revealed its most extreme form: the outright default of the counterparty—the exchange itself.
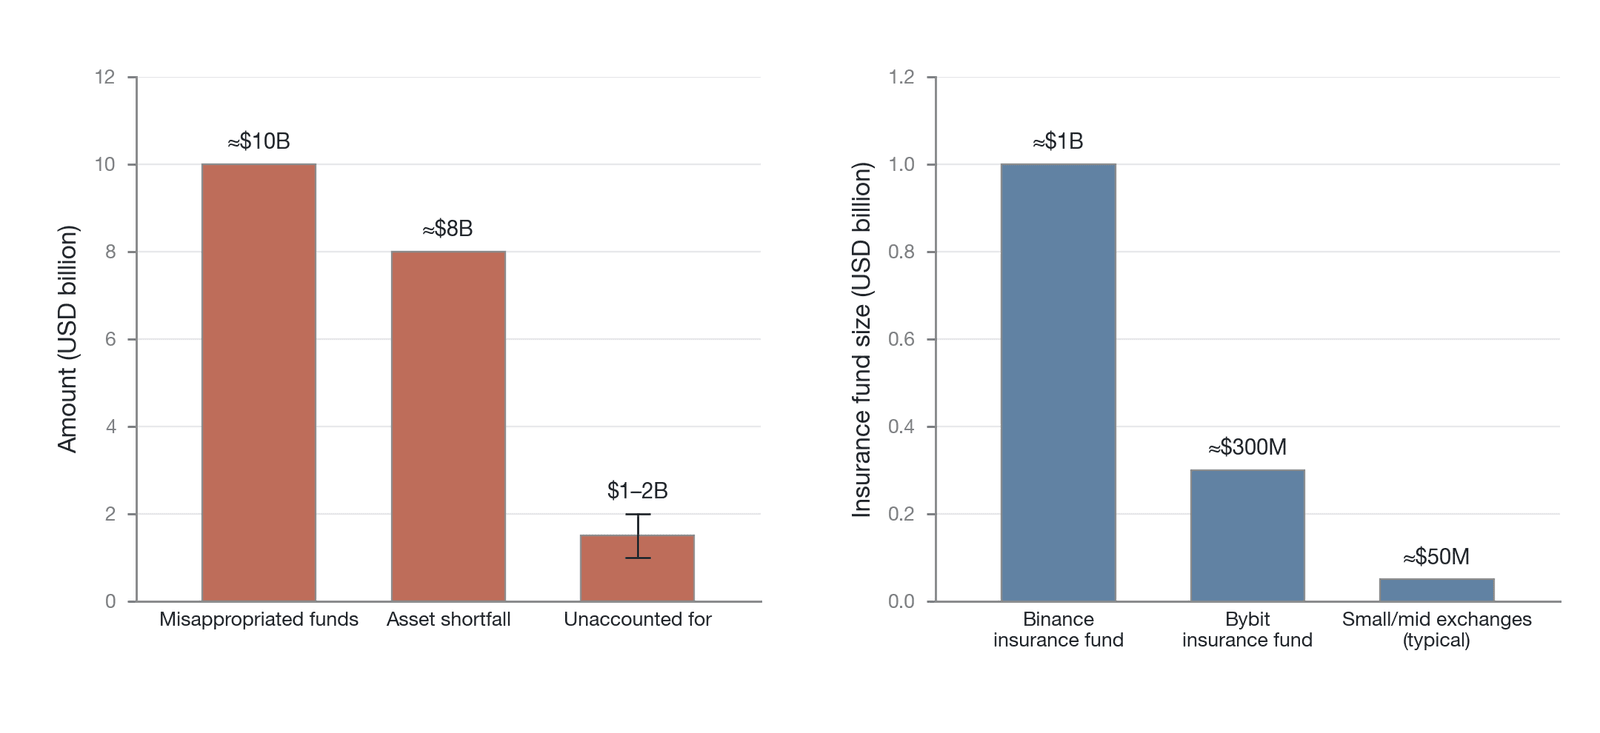
Figure 17-10. Comparison of counterparty-risk characteristics across exchanges (Data source: compiled by the author)
The left panel of Figure 17-10 depicts the enormous asset shortfall at the time of the FTX collapse (its magnitude is given above [12]), against which any hope of recovering funds from the platform faced serious obstacles. This warns all market participants, and arbitrageurs in particular, that they must treat an exchange's solvency risk as a core consideration. Unlike traditional financial institutions, the great majority of crypto exchanges are financially opaque and lack independent third-party audits, and their "proof of reserves" often fails in practice to reflect their true liabilities in full.
More important, the FTX episode was not a unique black swan in crypto history. As Figure 17-11 shows, platform-risk events—exchange failures, hacks, and regulatory shutdowns—have been common over the past several years. From the collapse of Mt. Gox to the recent withdrawal suspension at BlockFills, these events together form a clear pattern: platform risk is a persistent, far-from-rare endogenous risk in the structure of crypto markets. For cross-exchange arbitrageurs, this means the success of a strategy depends not only on the convergence of a spread but also on whether every trading platform they rely on survives this game of attrition.
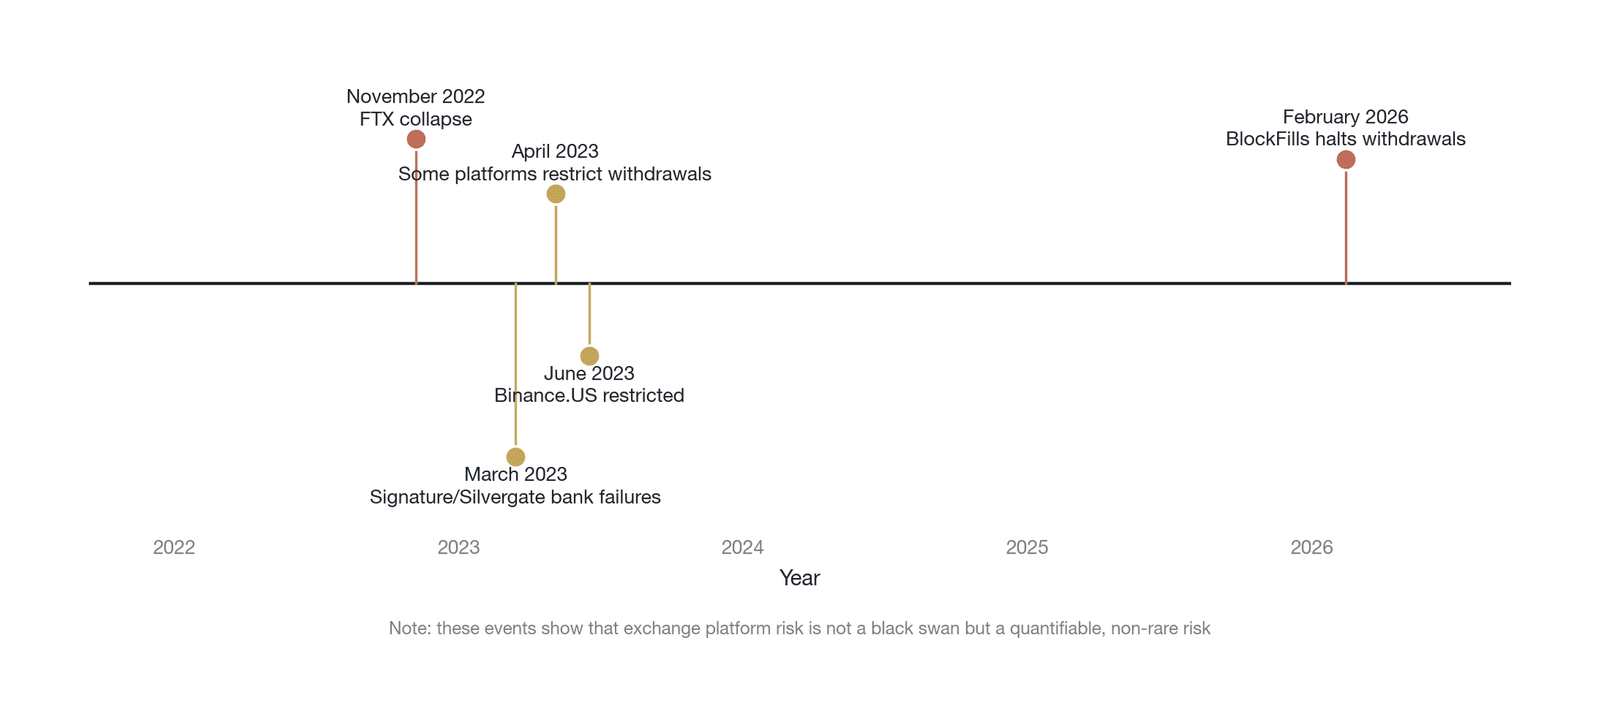
Figure 17-11. A timeline of platform-risk events at crypto exchanges (2022–2026) (Data source: compiled by the author from public reports; for the FTX collapse, see [12]; for the restrictions on Binance.US, see [14])
The assessment of platform risk should therefore not be a binary "present-or-absent" judgment but a probabilistic evaluation grounded in the historical frequency of events, an exchange's operational transparency, its corporate-governance structure, and the regulatory environment of its jurisdiction. Every cross-exchange arbitrage is an act of dispersing capital across multiple trading platforms of differing credit risk, and the failure of any one of them can cause the entire strategy to fail badly.
17.4.2 Withdrawal restrictions and frozen funds
Compared with the extreme case of an outright exchange collapse, a more common and more insidious platform risk is a temporary functional failure, the most typical of which is a suspension of withdrawals. Amid violent market swings or under regulatory pressure, an exchange may unilaterally announce a suspension of user withdrawals of all or some assets. Although such an action does not necessarily mean the platform is near bankruptcy, its destructive power is just as severe for an arbitrageur to whom every second counts. It creates a temporary "liquidity trap" within the arbitrageur's funding network, severing the flow of capital between platforms and thereby dissolving the basis for cross-market hedging.
Return to the cross-exchange arbitrage setting. What lets an arbitrageur maintain risk neutrality across markets is, at its core, the ability to move funds freely between platforms to meet the margin requirements of different positions. When the market price rises, for instance, the spot long leg of a cross-exchange basis position earns an unrealized gain while the short perpetual leg incurs an unrealized loss and may face a margin call. The arbitrageur must then withdraw part of the profit from the exchange holding the spot and transfer it to the exchange holding the perpetual futures to keep the short from being liquidated. The free flow of funds is the core precondition for sustaining the entire hedge.
Once the exchange holding the perpetual futures announces a withdrawal suspension, however, this critical channel is blocked. Even if the arbitrageur is well capitalized overall, they cannot inject funds into the account that is generating losses. This creates a structural dilemma: a trader who is well capitalized globally may nonetheless be forcibly liquidated on a single platform because of a local liquidity shortage. In June 2023, after the U.S. Securities and Exchange Commission (SEC) sued Binance.US, the platform announced a suspension of its dollar withdrawal channel [14], which directly broke the path of arbitrage strategies that relied on it for fiat deposits and withdrawals. Similarly, many exchanges have over the years briefly suspended deposits and withdrawals of particular tokens for reasons such as technical upgrades, wallet maintenance, or responses to hacks—each a direct threat to strategies that rely on those tokens for arbitrage.
Beyond restrictions the exchange imposes deliberately, funds-in-transit risk is another form of liquidity trap. When the network is extremely congested, an ordinary on-chain transfer may take tens of minutes or even hours to confirm. During this in-transit period, the arbitrageur can neither use the funds nor recall the transaction. The market price may already have moved violently, and a position that needed additional margin may long since have been liquidated. This delay, rooted in the performance bottlenecks of the blockchain network itself, further compounds the uncertainty of moving funds across platforms.
The core harm of withdrawal restrictions and frozen-funds risk, therefore, is that they break the assumption that "capital is a single, unified whole" and split the arbitrageur's capital into mutually isolated "risk islands." On each island, every position must bear its margin pressure alone, without support from profitable positions on other platforms. This sharp decline in capital efficiency forces the arbitrageur to hold excess margin far above normal levels on every platform, systematically reducing the scale and efficiency of capital deployment across the entire arbitrage industry—and explaining why many seemingly profitable spreads are so slow to be fully closed.
17.4.3 Insurance-fund depletion and auto-deleveraging
In the risk-management system of a perpetual futures exchange, the insurance fund and the auto-deleveraging (ADL) mechanism are the last two lines of defense against the shock of mass liquidations. Both, however, were designed to protect the exchange from bankruptcy rather than to protect individual traders. Under extreme conditions, when the insurance fund is depleted and auto-deleveraging is triggered, platform risk appears in a more paradoxical form: it no longer punishes the losers but achieves a cold "socialization of losses" by forcibly closing the winners' positions. For arbitrageurs, this means the most solid, profitable leg of their strategy may be precisely the one that ends up bearing the market's risk of last resort.
The insurance fund's core function is to absorb bankruptcy losses—losses on a forcibly liquidated position that exceed all of its margin. When such a shortfall arises, the uncovered portion is borne by the insurance fund. The fund is capitalized mainly from two sources: the exchange's own injected capital, and the "surplus" generated by liquidation orders that fill at prices better than the bankruptcy price. As shown in the right panel of the earlier figure, the insurance funds of major exchanges typically range from tens of millions to hundreds of millions of dollars. In normal market swings, this is enough to cover sporadic bankruptcy losses. In a systemic flash crash or short squeeze, however, when thousands of positions are liquidated densely within a short interval, the total loss they generate can rapidly drain the entire insurance-fund pool.
When the insurance-fund balance falls to zero or a preset danger threshold, the auto-deleveraging mechanism is activated. The logic of auto-deleveraging is direct (see Figure 17-12): since there is no longer any common fund to fill the losses, the system must find those in the market who are "able" to bear them. Who is most able? Those holding profitable positions in the prevailing market direction. Using a complex ranking algorithm, the system sets deleveraging priority by a combined ordering of the profit-and-loss ratio and effective leverage. The ranking algorithms differ markedly across exchanges: Binance ranks by the product of profit percentage and a leverage percentile; Bybit ranks by the product of profit-and-loss percentage and effective leverage, so that rank = PnL% × effective leverage; and OKX's ranking logic differs again. These differences mean that the same arbitrageur may face very different ADL risk on different exchanges: a position that ranks near the top and is highly likely to be deleveraged on one exchange may rank lower and be relatively safe on another. This differentiated deleveraging risk is an important factor the arbitrageur must weigh when choosing platforms and allocating positions. Starting from the highest-ranked, the algorithm then forcibly closes the winners' profitable positions one by one. These positions fill not at the current market price but at the bankruptcy price of the original losing position that caused the shortfall. In this way, part of the winners' profit is used to cover the losers' shortfall, ensuring the exchange operates with zero loss.
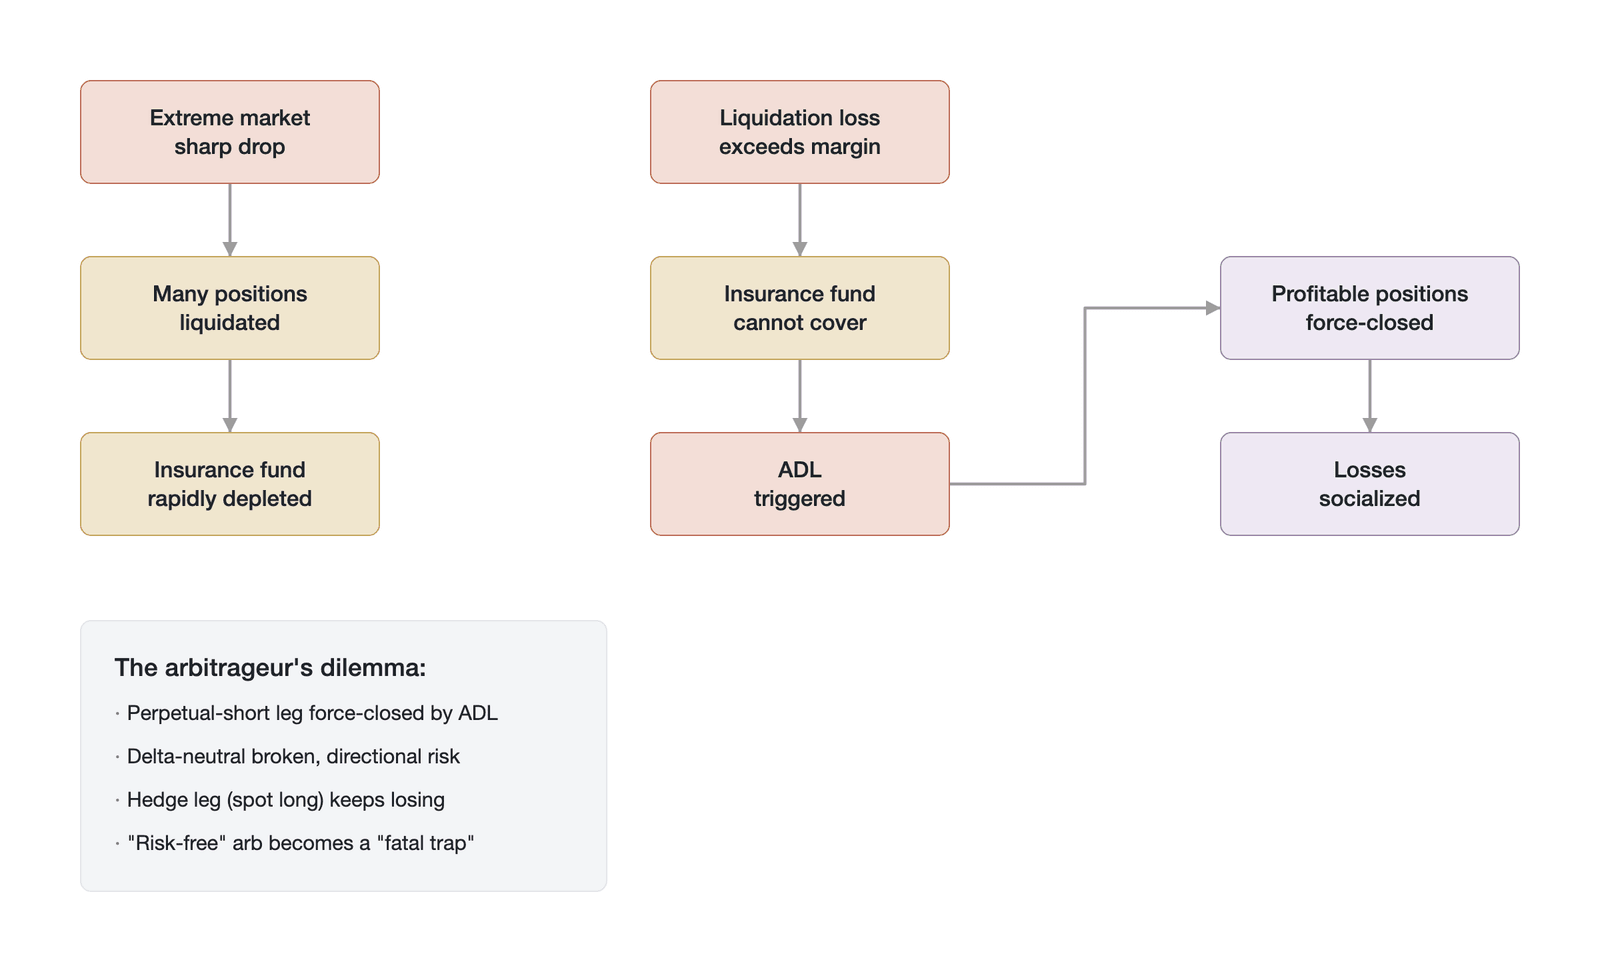
Figure 17-12. Schematic of the auto-deleveraging trigger mechanism and profit-ranked deleveraging (Data source: drawn by the author, referencing Bybit [15])
The figure clearly shows the trigger path of the auto-deleveraging mechanism and its serious impact on arbitrageurs. For a basis-arbitrage strategy running in a falling market (long spot, short perpetual futures), the short perpetual leg is generating large unrealized gains. To the auto-deleveraging system, this highly profitable short is the perfect "counterparty" to cover the losses from the many longs being liquidated across the market. The short is therefore highly likely to be selected and forcibly closed by the ADL system. As a result, the arbitrageur not only fails to realize the expected profit but falls once again into the broken-leg predicament: the short leg that hedged the risk vanishes, leaving only the spot long that is generating continuing losses. A strategy that should have been robust in a falling market ends up suffering a major loss at the hands of auto-deleveraging.
The existence of auto-deleveraging fundamentally challenges the intuition that "to be profitable is to be safe." It reveals a counterintuitive rule of crypto derivatives markets: in an extreme crisis, the first to be sacrificed may not be the weakest but those holding the largest unrealized gains. By virtue of their market-neutral design, arbitrageurs often end up among the few winners in a chaotic market—which is precisely what makes them the ADL system's top targets for "requisition." This asymmetry of risk is a core variable that every perpetual futures arbitrageur must understand deeply and incorporate into their risk model.
17.4.4 The broken-leg scenario
Combining the three platform risks above—the outright collapse of an exchange, the temporary freezing of operational functions, and, finally, forced closure through auto-deleveraging—we can construct a unified risk framework: the broken-leg scenario. Its core idea is that for any hedge built on multiple platforms and multiple positions (multiple "legs"), the most fragile link is the platform that keeps those legs operating in coordination. Any platform event that causes one leg to fail involuntarily unbalances the entire strategy and exposes it to raw market risk.
The essence of broken-leg risk stems from the deeply rooted "asset fragmentation" and "risk siloing" of the crypto market structure. Unlike traditional financial markets, where assets are held centrally at institutions such as the Depository Trust & Clearing Corporation (DTCC), crypto assets are scattered across hundreds of independent exchange wallets. This means that in a cross-exchange arbitrage, the spot-long leg and the perpetual-short leg are entirely separate, both physically and legally. When one exchange runs into trouble, the other has neither the obligation nor the ability to "see" or "compensate" the trader's losses elsewhere.
The broken-leg scenario can be graded into three levels according to the severity of the platform risk.
A Level 1 break (a functional break) is triggered by problems such as withdrawal restrictions, funds-in-transit delays, or an API disconnection. Here the arbitrage position itself has not disappeared, but the trader has lost the ability to move margin between platforms and rebalance risk. The coordination among the strategy's legs is temporarily interrupted, and the position can be passively liquidated for want of margin in one location.
Above this, a Level 2 break (a forced break) is triggered by the auto-deleveraging mechanism. Here the strategy's profitable leg is forcibly closed by the system: not only is the hedge structure destroyed, but this comes at the cost of sacrificing realized profit. The trader is exposed to directional risk and loses gains that should have been locked in.
The most destructive is a Level 3 break (a fundamental break), triggered by events such as an exchange collapse, a hack, or a regulatory shutdown. Here all assets held on that exchange may be permanently lost, producing the most direct and complete loss of principal.
These three levels affect different types of arbitrage strategy differently. For arbitrage conducted purely within a single exchange (such as a spot-versus-perpetual basis trade on the same exchange), platform risk is concentrated and single-point: the trader need only assess the reliability of that one platform. For the great majority of arbitrage types, however—cross-exchange spread arbitrage, funding rate arbitrage, and even CEX-DEX arbitrage spanning CEXs and DEXs—the risks are additive. The trader must face not only the CEX's human-management, operational, and solvency risks but also the DEX's smart-contract-vulnerability, oracle-manipulation, and on-chain-congestion risks. The more platforms a strategy spans, the more potential "break points" it has, and the fragility of the entire arbitrage structure grows exponentially.
A mature arbitrageur's risk model must therefore include a quantitative assessment of the probability of a broken leg. Such an assessment should weigh multiple dimensions: the exchange's reputation rating, the ratio of insurance-fund size to total open interest, the historical frequency of withdrawal freezes, the history of ADL triggers, technical stability, and regulatory clarity. Ultimately, arbitrage returns also embed a substantial premium for bearing the fragility of platform infrastructure. In perpetual futures trading, assessing and managing platform risk matters more than judging market direction.
17.5 Execution and timing risk
In the frictionless world of theoretical finance, arbitrage is portrayed as an elegant, instantaneous process: the moment a price dislocation appears, the arbitrageur simultaneously buys the undervalued asset and sells the overvalued one at zero cost and zero delay, locking in a risk-free profit. The reality of perpetual futures markets, however, differs markedly from this idealized model. As this chapter has repeatedly stressed, the gulf between theory and practice is made up of a series of demanding constraints, and execution and timing risk is one of the most microscopic yet consequential of them. It reveals a key fact: in a real trading environment built of fiber-optic cable, microwave towers, and globally distributed servers, "almost simultaneous" is never the same as "simultaneous." A delay of milliseconds—or even microseconds—is enough to turn a mathematically perfect arbitrage strategy into a gamble fraught with uncertainty.
The core thesis of this section is that every arbitrage strategy involving multiple trade "legs"—whether across maturities, markets, or assets—rests its profitability on a fragile assumption: that all legs can be executed synchronously at the expected prices and times. When that assumption breaks, risk is never far behind. Execution risk is not a single risk but a complex matrix composed of slippage, latency, and partial fills. It springs from the fragmented structure of the market, the technical heterogeneity of different trading venues, and the ever-intensifying race for speed in the high-frequency arena. Understanding this constraint dimension is the key to understanding why so many theoretically available arbitrage opportunities cannot be exploited in reality, and why market efficiency always confronts a nearly insurmountable "last mile."
17.5.1 Slippage, latency, and partial fills
The success or failure of a multi-leg arbitrage strategy depends on the precision of execution. Any deviation from the expected execution directly erodes, or even wholly offsets, the anticipated arbitrage profit. Such deviation takes three principal forms—slippage, latency, and partial fills—which together constitute what is called inter-leg risk.
Slippage risk refers to the adverse gap between the actual average fill price of a large order and the best quote at the time the order was placed. When liquidity is thin or the market is highly volatile, a market order may "punch through" several price levels in the order book, producing an average fill far worse than expected. For a strategy such as arbitrage, whose profit margins are usually thin, a few basis points of slippage can turn it from profitable to unprofitable. A cross-exchange opportunity with an expected return of 5 basis points, for example, is doomed the instant it executes if each side incurs 3 basis points of slippage.
In practice, slippage is only one component of execution cost. A complete arbitrage profit-and-loss analysis must cover four core cost categories. First, trading fees: on major exchanges the taker fee is typically 0.04%–0.06%, so two-sided execution consumes total fees of roughly 0.08%–0.12%. Second, slippage and market-impact costs, whose magnitude, as discussed above, depends heavily on the market state and the position size. Third, the time cost of funding: within the window from spotting the opportunity to fully establishing the position, the rate may already have changed. Fourth, the cost of moving funds: for a cross-exchange strategy this includes the gas fees of on-chain transfers, and for a CEX-DEX strategy it includes bridging fees and the potential time cost of funds in transit. Take a typical cross-exchange basis trade: assuming an expected basis return of 10 basis points, two-sided fees of about 10 basis points, and two-sided slippage of about 4 basis points, the net return is only about −4 basis points. This explains why a small basis is actually unprofitable once all costs are counted, and it provides a microfoundation for the existence of the limits of arbitrage.
Latency risk arises from the time it takes from spotting an arbitrage opportunity to having the order filled in the exchange's matching engine. Though measured in milliseconds or even microseconds, this interval is, in a high-frequency environment, long enough to allow significant price movement. It spans several stages: signal processing, algorithmic decision-making, network transmission, and internal processing at the exchange (see Figure 17-13). In a market where prices change from instant to instant, any delay can cause the opportunity to vanish before the order arrives. Aquilina, Budish, and O'Neill (2022) [16] showed that, in traditional financial markets, the latency-arbitrage race has reached the microsecond scale. Although crypto markets still lag in overall speed, the core logic is the same: execution speed is the decisive variable in a strategy's success or failure.
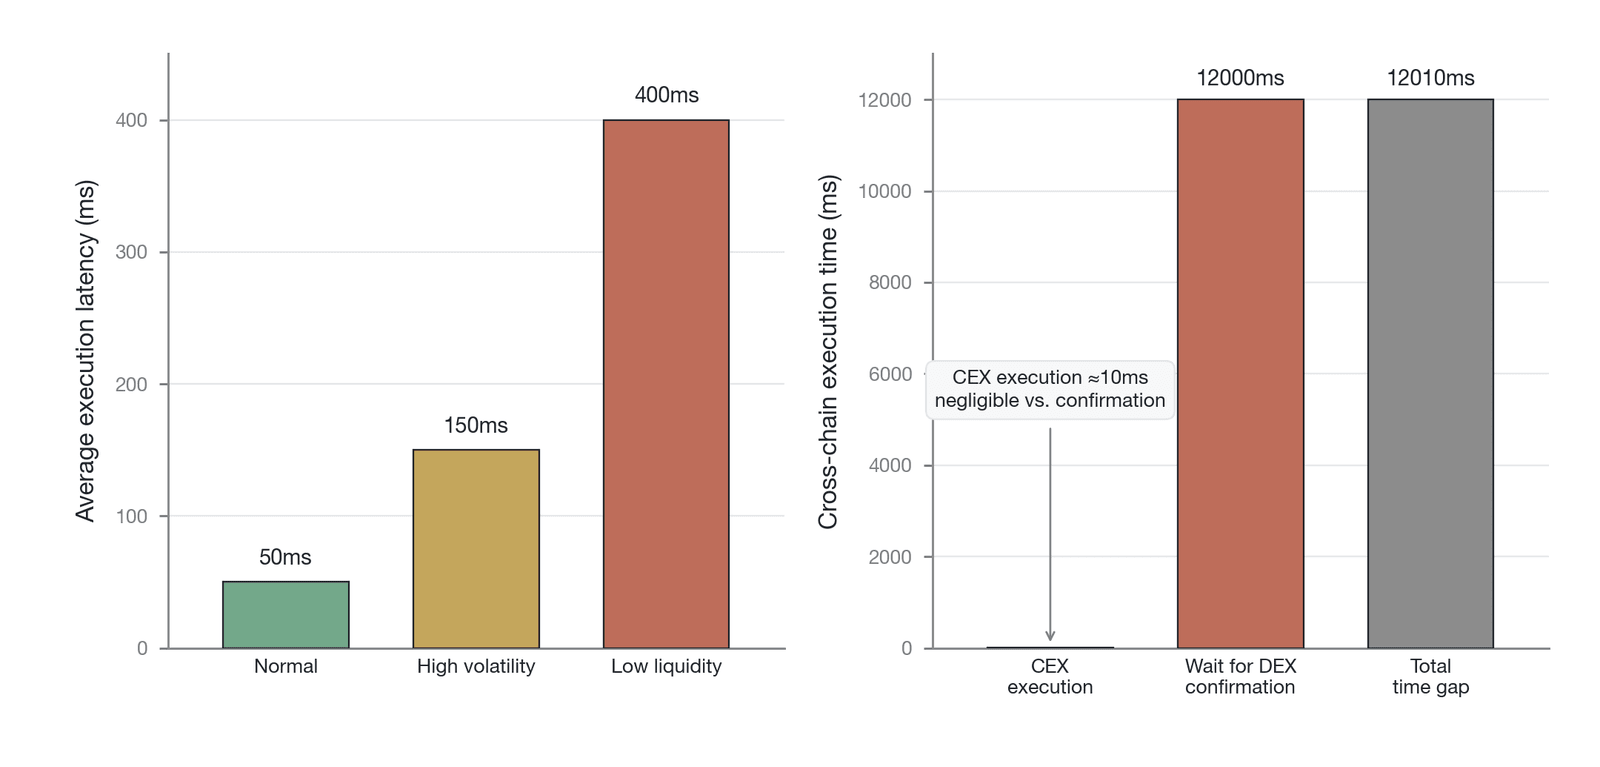
Figure 17-13. Comparison of latency across exchanges and networks (Data source: drawn by the author; the latencies are representative illustrative values, not empirical data)
As the figure shows, execution latency is closely tied to the market environment: under normal conditions, average latency stays in the tens of milliseconds, but when the market enters high volatility or liquidity depletion, the matching engine and network channels come under strain, and latency spikes to hundreds of milliseconds. This both magnifies the risk of price movement during execution and directly worsens slippage, forming a vicious cycle.
Partial-fill risk is one of the most destructive situations in a multi-leg strategy. When an arbitrageur tries to execute two or more legs simultaneously, the order on one side may fill completely while the order on the other fills only partially or fails outright. This turns a risk-hedged, delta-neutral position into a naked, one-sided exposure in an instant. In a basis trade, for example, if the short perpetual leg fills successfully but the spot-buy leg fails amid violent price swings, the arbitrageur is directly exposed to a fall in the asset's price, and the position's character shifts from arbitrage to unprotected directional speculation.
Together, these three risks form the core of inter-leg risk. Quantifying it requires precisely measuring the average time gap and price deviation between the fills of the legs under different market states. For a CEX-DEX arbitrage strategy, execution on the CEX side may complete within a few milliseconds, but execution on the DEX side is bound by the block-confirmation time of the target blockchain and may take several seconds or longer. This structural time asymmetry exposes the arbitrageur to enormous uncertainty, leaving them fully exposed to price movements in the CEX market throughout the long window of waiting for the DEX transaction to confirm.
17.5.2 The coordination problem of triangular arbitrage
If the execution risk of a two-leg arbitrage is linear, the coordination problem of triangular arbitrage is markedly magnified. Section 16.6 discussed the pricing mechanism of triangular arbitrage; this section focuses further on its execution coordination. Note that the "spot–futures–perpetual triangular arbitrage" defined in Section 16.6 is a variant across the term structure, whereas this section uses currency triangular arbitrage to illustrate the coordination problem: it captures the internal inconsistency of pricing by trading consecutively across three asset pairs (for instance, selling A/B, buying A/C, and selling C/B). Both are triangular arbitrage, but they span different types of boundary. The success of this strategy requires the three trades to be completed in a near-perfect timed relay, and a break in any link leads to serious adverse consequences.
The execution window for triangular arbitrage is very brief, typically lasting only milliseconds. This demands that the arbitrage system not only complete three separate trades at high speed but also monitor each leg's execution status in real time and dynamically adjust the order parameters of the last two legs based on the fill of the first. It is a highly complex coordination task (see Figure 17-14). When the system detects an opportunity among BTC/USDT, ETH/BTC, and ETH/USDT, for instance, it immediately sends the first-leg trade. Within the tens of milliseconds from placing that order to confirming its fill, however, the market may already have changed. If the fill price or quantity of the first leg deviates from expectations, the mathematical basis of the entire arbitrage chain is already shaken. The algorithm must then decide in an instant: abort the strategy and accept the small loss and exposure the first leg may bring, or execute the remaining two legs in the hope that subsequent market movement will make up the loss—which may equally lock in a larger loss.
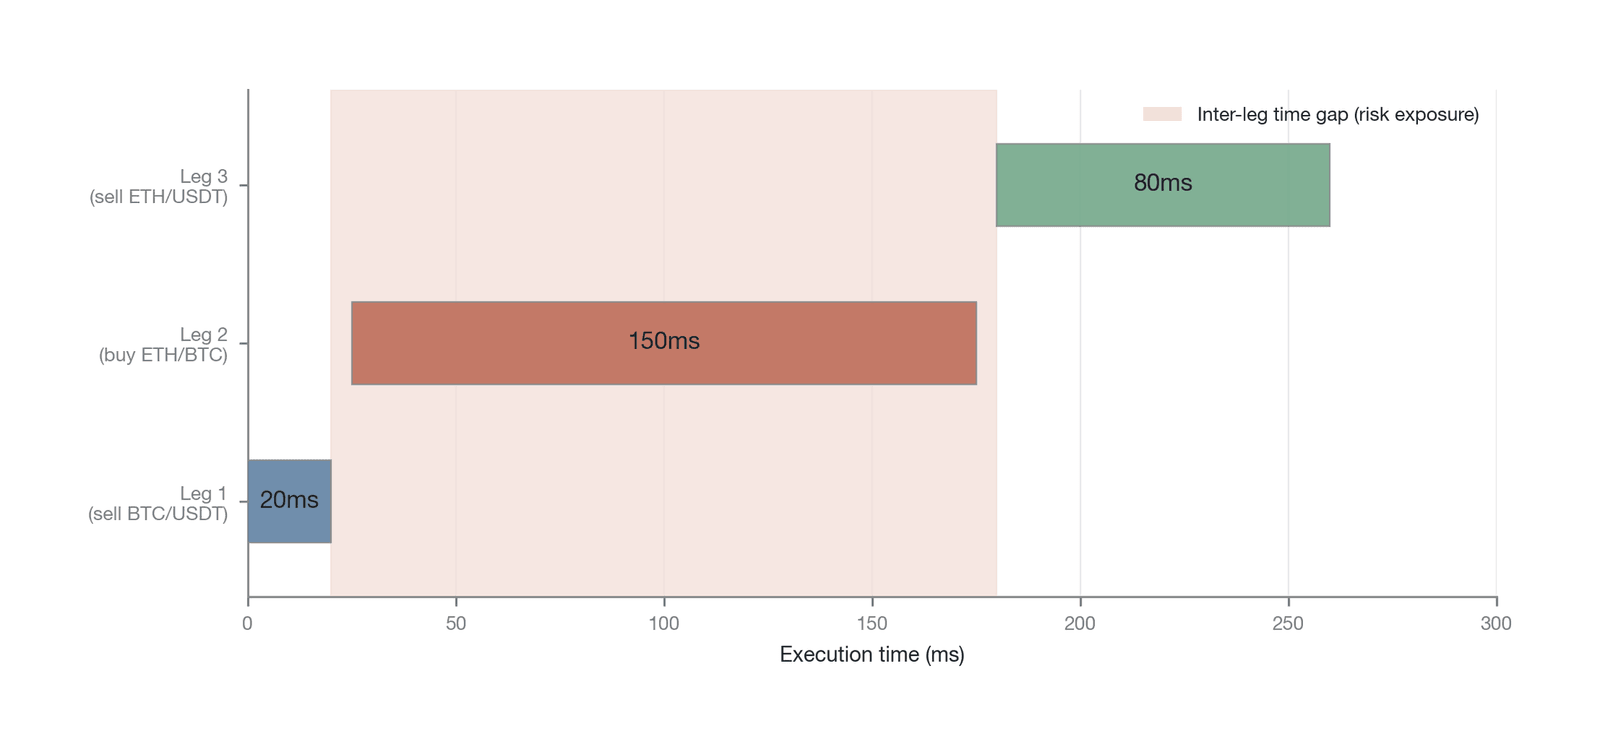
Figure 17-14. Schematic of the timing of three-leg triangular-arbitrage execution and the inter-leg risk-exposure window (Data source: drawn by the author; the execution times of the legs are illustrative values, not empirical data)
As the figure shows, throughout the window between the fill of the first leg and the fill of the third, the arbitrageur's position is incompletely hedged and exposed to market swings; the longer this window, the greater the probability that the strategy fails.
Recent academic research provides strong empirical evidence for this difficulty. A study of high-frequency data from Binance found that although theoretical triangular-arbitrage opportunities appear frequently (4,879 were identified during the study period), once real-world frictions—transaction costs, the limited depth of the order book, and execution latency—are taken into account, the net profit of these opportunities is negligible, tending toward zero [17] (see Figure 17-14). This indicates that centralized cryptocurrency exchanges are already highly efficient at the microstructural level, an efficiency shaped precisely by the fierce execution race among countless high-frequency arbitrageurs. After transaction costs and execution frictions are counted, these theoretically available opportunities are viable only for top participants with the lowest latency and the best order-execution algorithms; for ordinary market participants, they are unattainable in practice.
As crypto markets converge with traditional finance, this coordination problem grows more complex. An arbitrage chain involving a Bitcoin spot ETF—arbitraging among the ETF, CME futures, and perpetual futures, say—introduces a new "time-window mismatch" risk. Perpetual futures trade 24/7, whereas CME futures and ETFs have defined opening and closing hours. This mismatch in trading sessions means the arbitrageur cannot hedge the position at any arbitrary moment, accumulating enormous overnight risk while the traditional venues are closed—no longer a purely execution problem but a structural, institutional obstacle.
17.5.3 CEX-DEX cross-chain execution risk
CEX-DEX arbitrage (see Section 16.9) takes execution risk into an entirely new dimension, because it straddles two very different technical paradigms—centralized and decentralized. The CEX execution environment is closed, fast, and deterministic, whereas DEX execution is open, comparatively slow, and probabilistic. This structural difference is the core source of CEX-DEX arbitrage risk.
The most conspicuous risk is the vast asymmetry in execution speed. On a CEX, a trade typically confirms within milliseconds. On a DEX, the transaction must wait to be packed into a block and confirmed on-chain. This time varies by blockchain (see Figure 17-15), and two levels must be distinguished: soft confirmation (the transaction is provisionally accepted by the sequencer or validators) and hard finality (a definitive confirmation that the transaction cannot be rolled back). On Solana, a single slot is produced in roughly 400 milliseconds, but optimistic confirmation takes about 1.5 seconds and full finality (confirmation across 32 slots) about 12–13 seconds. On mainstream Layer-2 networks such as Arbitrum and Optimism, a sequencer's soft confirmation can complete within seconds, but withdrawing assets to L1 requires a challenge period as long as 7 days (optimistic rollups) or a proof-verification period of several hours (ZK-rollups). For a CEX-DEX arbitrageur, the key decision is which level of confirmation to accept: waiting only for soft confirmation shortens the execution window but bears the risk that a block reorganization rolls the transaction back, whereas waiting for hard finality provides certainty but greatly lengthens the window of risk exposure [18]. This means that after the arbitrageur completes one leg on a CEX, they must bear the market exposure of the CEX-side position for seconds—or even a dozen-odd seconds—while awaiting on-chain confirmation of the DEX-side transaction.
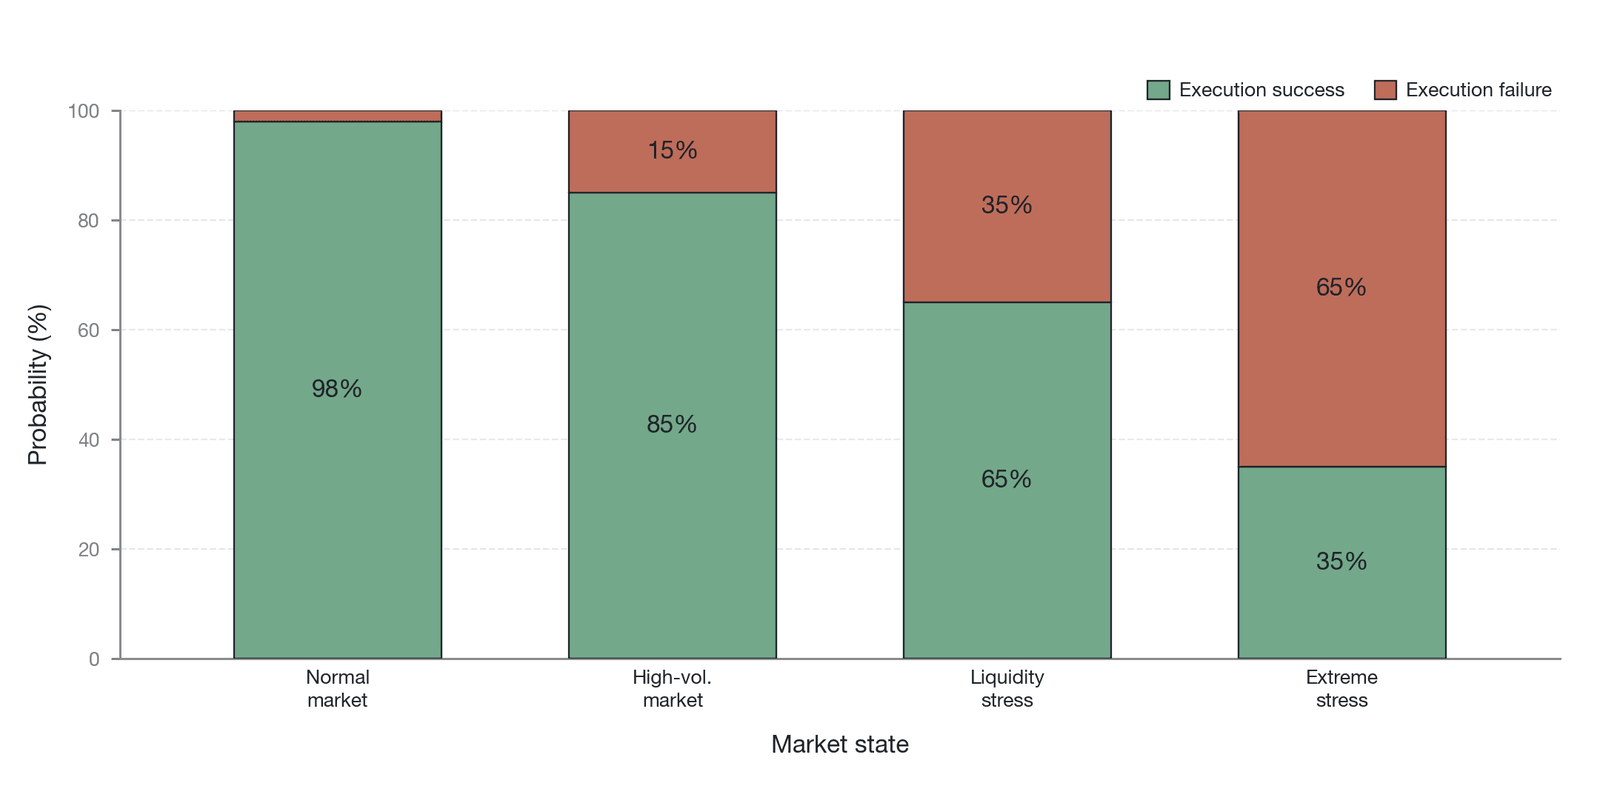
Figure 17-15. The execution success rate of CEX-DEX trades under different market conditions (Data source: drawn by the author; the success rates are illustrative values assumed by the author, not empirical; for mechanism background, see Daian et al. [18])
Worse still, the success of a DEX transaction is not guaranteed: as the figure shows, its execution success rate falls markedly as the market state deteriorates (during high volatility or network congestion, gas prices spike and competition for block space raises the probability of failure). A modeling study of Ethereum CEX-DEX arbitrage shows that the probability of a DEX transaction executing successfully is the key decision variable determining whether an arbitrageur enters [18] (see Figure 17-15). A higher risk of failure systematically deters arbitrageurs, causing the CEX-DEX spread to widen persistently and market efficiency to decline.
Beyond latency and failure risk, the DEX environment introduces a distinctive MEV risk. Because of the blockchain's transparency, all pending transactions—sitting in the mempool—are publicly visible before confirmation. This creates opportunities for professional MEV participants known as searchers. When a CEX-DEX arbitrageur's transaction appears in the mempool, a searcher can immediately recognize the profit opportunity and front-run it by paying a higher gas fee, completing the arbitrage ahead of the original arbitrageur and causing the latter's transaction to fail as prices change. Alternatively, they can mount a more sophisticated sandwich attack, placing one trade in each direction immediately before and after the arbitrageur's transaction to manipulate the price and drain all the profit from the original trade. In this environment, the CEX-DEX arbitrageur is racing not only against the market price but also against MEV searchers in a competitive game under information asymmetry. Recent empirical research jointly conducted by researchers at Flashbots, the Ethereum Foundation, and others [19] shows that CEX-DEX arbitrage remains one of the largest sources of MEV on Ethereum to this day—its transactions occupy less than 2% of block space yet contribute more than 15% of block value—which is ample evidence of how intense the competition is.
Beyond these risks, the volatility of gas fees adds enormous cost uncertainty to CEX-DEX arbitrage. In active markets, the gas price on Ethereum can multiply several times over within minutes. A trade that was profitable can turn into a loss because of an unexpectedly high gas fee. Although a flash loan can achieve atomic arbitrage within a single transaction on a single blockchain—so that all legs either succeed together or fail and revert together, eliminating inter-leg risk—this mechanism cannot be applied to cross-chain or CEX-DEX settings. As soon as funds must cross a trust boundary, atomicity ceases to exist, and execution risk necessarily appears.
17.5.4 High-frequency competition and technical risk
Along the execution-and-timing dimension, competition takes its ultimate form in an endless arms race over speed. High-frequency trading is a class of strategy that relies on a sub-millisecond speed advantage to capture tiny price spreads. For high-frequency trading firms, a lead of even a millionth of a second can mean millions of dollars in annualized returns. This competition drives the continual iteration of trading technology, but it also markedly raises the barrier to entry for arbitrage and gives rise to new, systemic technical risks.
The core of this arms race is cutting latency. To gain a physical edge, high-frequency trading firms spare no expense. A typical strategy is colocation—placing one's own trading servers in the same physical data center as the exchange's servers to minimize network latency (see Figure 17-16). In traditional financial markets, this service is costly. In crypto markets, though the structure differs, server hosting near core exchanges is likewise a scarce resource. Going further, to connect exchanges in different geographic locations (Chicago and New Jersey, say), high-frequency trading firms invest in dedicated microwave transmission networks, because microwaves propagate through air about 40% faster than light through fiber. The construction and maintenance of such infrastructure routinely costs hundreds of thousands, or even millions, of dollars a year [20].
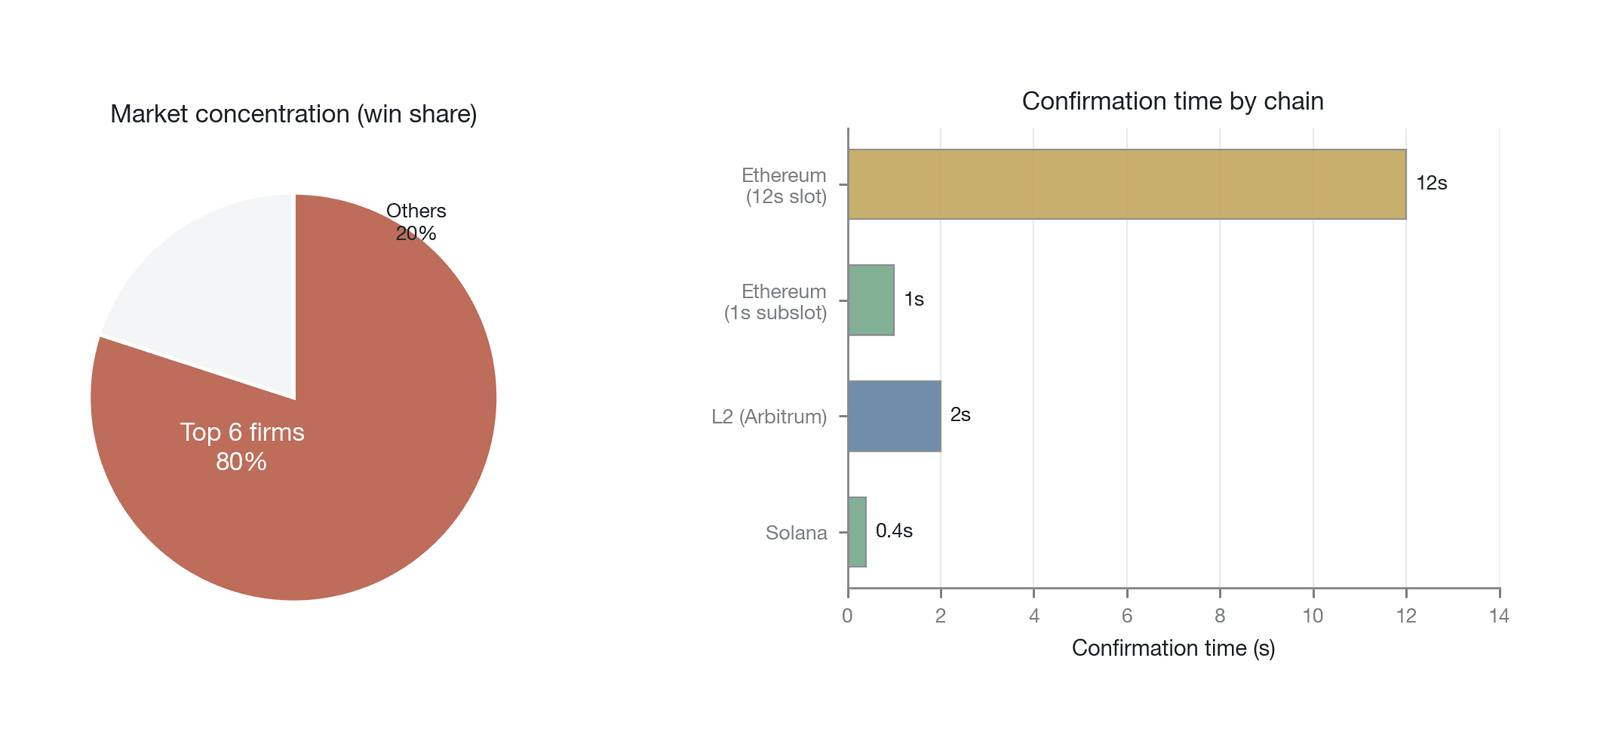
Figure 17-16. Market concentration in the latency-arbitrage race and confirmation times across blockchains (left: the top six firms account for more than 80% of race wins and losses, per Aquilina, Budish, and O'Neill [16]; right: confirmation times per chain are public parameters, compiled by the author)
Algorithmic optimization is another key to the race: high-frequency firms burn their trading logic into hardware chips such as FPGAs to eliminate microsecond-scale latency. The direct consequence is a highly concentrated market—an authoritative study of the London Stock Exchange found that latency-arbitrage races occur on average once per minute per stock, are usually decided within 5–10 microseconds, and are won and lost by the top six firms more than 80% of the time [16] (see Figure 17-16). The great majority of tiny arbitrage opportunities are thus captured by the fastest participants, leaving very limited opportunities for everyone else.
Yet the relentless pursuit of execution speed introduces a new systemic fragility: heavy dependence on complex technical systems markedly increases operational risk. When the high-frequency trading infrastructure—the whole apparatus of algorithms, proprietary networks, and API connections—suffers even a small malfunction, the consequences can be severe. A wrong algorithm parameter, an unexpected network outage, or an unplanned update to an exchange's API can lead an unmonitored system to build up an enormous erroneous position within seconds. The 2012 episode in which Knight Capital lost $440 million in 45 minutes to a faulty trading algorithm and was ultimately driven into insolvency is a classic case of this risk. In crypto markets, which trade 24/7 and are more volatile, the risk of such technical failures can only grow. For the institutions that invest the most in the speed race, the core source of risk is precisely the complex technical systems on which they depend.
Beyond algorithmic and hardware failure risk, automated arbitrage systems face a distinctive security threat: API-key compromise. Arbitrage bots need exchange API keys to execute trades automatically, and these keys are usually granted full trading permissions. A key may be stolen through an accidental public commit to a code repository, a phishing attack, or a supply-chain vulnerability in a third-party tool. Once a key falls into an attacker's hands, they can use the arbitrageur's account to execute malicious trades—buying a low-liquidity token at an extreme price, for example, to complement a counterparty position of their own—causing not only direct financial loss but also, through the anomalous trading pattern, potentially tripping the exchange's risk controls and freezing the account. In 2023, several incidents of bulk account theft caused by key leaks at third-party service providers together produced losses of tens of millions of dollars. For professional arbitrageurs who rely on automated trading across multiple platforms, API-key management—including tiered permissions, IP-whitelist binding, withdrawal limits, and key-rotation mechanisms—has become an indispensable foundation of operational risk management.
In sum, execution and timing risk is the microstructural constraint on arbitrage in perpetual futures markets. It turns a theoretically risk-free return into a comprehensive test of technical capability, capital scale, and risk management. Small differences in execution latency directly determine the feasibility of an arbitrage strategy and ultimately define the practical upper bound on the efficiency the market can attain.
17.6 Liquidity depletion
The funding-liquidity spiral model of Brunnermeier and Pedersen (2009) [8] provides an important theoretical foundation for understanding the liquidity depletion examined in this section. The model holds that market liquidity and funding liquidity are locked in a mutually reinforcing positive-feedback relationship: when market liquidity declines, asset-price volatility rises and margin requirements increase, which in turn tightens funding liquidity, forces traders to cut positions, and ultimately worsens market liquidity further.
In the complex ecosystem of perpetual futures markets, liquidity is often treated as an exogenous, given background parameter. This view overlooks a fundamental fact: liquidity is not naturally occurring but is, to a large extent, an endogenous variable, shaped jointly by the collective behavior of market participants. Here arbitrageurs play a contradictory dual role—providing market depth and integrating fragmented liquidity pools into an interconnected network when the market runs smoothly, yet withdrawing en masse under extreme stress (this endogenous mechanism is detailed in Section 17.6.1). This is exactly how the liquidity-depletion dimension (Dimension V) behaves under extreme conditions, and this chapter calls its extreme form the liquidity black hole: an endogenous, systemic risk that is set off by arbitrageurs' own behavior and ultimately turns severely against them.
This section examines the internal mechanism of this risk dimension. We first explore the endogeneity of liquidity, revealing the core contradiction whereby arbitrageurs act simultaneously as suppliers of and demanders for liquidity. We then dissect the stampede mechanism, explaining how, under the pressure of collective position-closing, the market falls into a self-reinforcing positive-feedback loop. Next we show the vast differences in liquidity across assets—liquidity stratification—and how this stratification creates a discontinuity in arbitrage feasibility between mainstream coins and altcoins. Finally, through a review of crisis moments, we quantify the severe consequences of liquidity evaporation and a sharply widening basis, revealing the predicament in which arbitrageurs, when they need to exit, face a severe shortage of counterparties.
17.6.1 The endogeneity of liquidity
As Chapter 16 argued, through their cross-market, cross-product trading, arbitrageurs objectively perform an infrastructural function: integrating fragmented liquidity and adding to order-book depth.
In analyzing the endogeneity of liquidity, it is worth distinguishing the different contributions of two types of participant. Market makers directly constitute order-book depth through continuous two-sided quoting, and their withdrawal immediately widens spreads and collapses depth; arbitrageurs contribute liquidity indirectly through cross-market directional trading, and their withdrawal shows up more as a decline in the efficiency of price transmission across markets. In a crisis, market makers, facing heightened inventory risk and adverse selection, tend to pull their quotes first, while arbitrageurs are forced to close positions under margin pressure. Their synchronized exit strikes the order book from both the supply side (the market makers) and the demand side (the market orders generated by arbitrageurs closing out), producing the double-edged effect of liquidity depletion.
Yet the liquidity created by arbitrage carries a fundamental fragility: it is conditional and precarious. It springs not from a long-run conviction about an asset's future value but merely from the existence of a profitable spread. This means that once the economic incentive to hold the arbitrage strategy disappears, or even turns negative, this liquidity withdraws in an instant, far faster than a long-term investor acting on fundamental analysis. When the funding rate turns from positive to negative, the basis arbitrageur no longer has an incentive to hold the short; when a sharp rise in volatility erodes the thin margins of statistical arbitrage, they quickly close out and exit. At that moment, the arbitrageur completes the shift from a supplier of liquidity to a demander of it.
A basis arbitrageur trying to close a short perpetual position needs a willing buyer to appear in the market. An arbitrageur trying to unwind a cross-exchange position needs to find counterparties in both markets at once to complete the exit. Under normal conditions this is usually not a problem, because there are always other types of participant—speculators, long-term investors—willing to take the other side. The crux is that when the market conditions that trigger a collective arbitrageur exit arise (a systemic price crash or a violent rate reversal, say), these external liquidity providers also tend to seek safety, pull their orders, and even join the selling. This creates a grave situation: at the very moment arbitrageurs most need liquidity to exit their positions, external liquidity is drying up, while internal liquidity—the other arbitrageurs—far from helping, becomes a competitor for the limited exit resources.
This endogeneity means that the order-book depth we see on an exchange's interface—the apparent liquidity—is largely an illusion of abundance. It contains a great deal of highly unstable, conditional liquidity contributed by arbitrageurs. Once the market environment deteriorates, this liquidity withdraws quickly, exposing the market's true native liquidity, which is far shallower than the surface suggests. The phenomenon can be understood as a tragedy of the commons in financial markets. For each individual arbitrageur, the most rational choice when a risk signal appears is to close out immediately and preserve capital. When all arbitrageurs act on the same logic, however, their collective behavior converges into a vast, one-directional wave of position-closing that drains market liquidity in an instant, causing slippage to surge and transaction costs to soar. Each individual's rational choice ends in a collective, irrational disaster: the market falls into a liquidity vacuum in which no one can exit at a reasonable price. Understanding the endogeneity of liquidity is a key part of understanding systemic risk in perpetual futures markets, for it reveals why, under extreme stress, the market can shift rapidly from an efficiently functioning state to a dysfunctional, seized-up, and inefficient one.
17.6.2 The stampede mechanism
The endogeneity of liquidity provides the theoretical basis for understanding market fragility, and the stampede mechanism is that theory's dynamic, destructive manifestation in the real world. It describes how, when many arbitrageurs try to close positions at once because of a common trigger, the market falls into a strong positive-feedback loop that ultimately leads to the complete evaporation of liquidity and a violent decoupling of prices. This process is not a simple linear sum but a self-reinforcing, accelerating, nonlinear collapse.
A typical trigger scenario often begins with a seemingly harmless market change. After a period of bull market, say, sentiment abruptly reverses and prices begin to fall noticeably. This decline first triggers margin-and-liquidation risk (the margin-and-forced-liquidation dimension), forcing some highly leveraged arbitrageurs to cut positions. More important, sustained panic selling drives the perpetual futures funding rate quickly from a stable, small positive value to a large negative one (the funding-rate-reversal dimension). For the large population of basis arbitrageurs, this is a decisive signal. The core profit source of their "buy spot, short perpetual" strategy is collecting a positive funding rate. When the rate turns negative, their position shifts from one that generates a positive return each day to one that steadily consumes capital. Closing out is now no longer an option for risk management but a necessary act to keep the strategy alive.
The first and most sensitive arbitrageurs therefore begin to act. They must complete two operations at once: sell the spot and buy (close) the short perpetual. Under normal conditions, these two operations offset one another and have limited net effect on the market price. In an environment of collective panic, the situation is entirely different. A flood of spot sell orders pours into an already fragile market and pushes the spot price lower still. At the same time, a flood of perpetual futures buy orders (the closing flow) tries to push the perpetual price up at the other end. The combined force of the two drives the perpetual price from a positive premium to a negative one relative to spot—a sharp widening of the basis. A basis that was only −10 basis points may widen to −100 or even −500 basis points within a few hours.
The sharp deterioration of the basis deals a second blow to the other arbitrageurs still in the market. Although their positions are mathematically delta-neutral, the enormous negative basis means their portfolios show huge unrealized losses. Worse, these losses directly strike their margin accounts and intensify the liquidation pressure already present. Few choices remain: either cut losses immediately, accept the loss incurred, and join the closing crowd, or post enormous additional margin in the hope that the basis will eventually converge. In an environment of severely deficient market confidence, the great majority choose the former. A second and a third, larger wave of closing floods follow in succession, pushing the spot price down further and dragging the perpetual price up, widening the basis more sharply still. A strong positive-feedback loop is thereby formed.
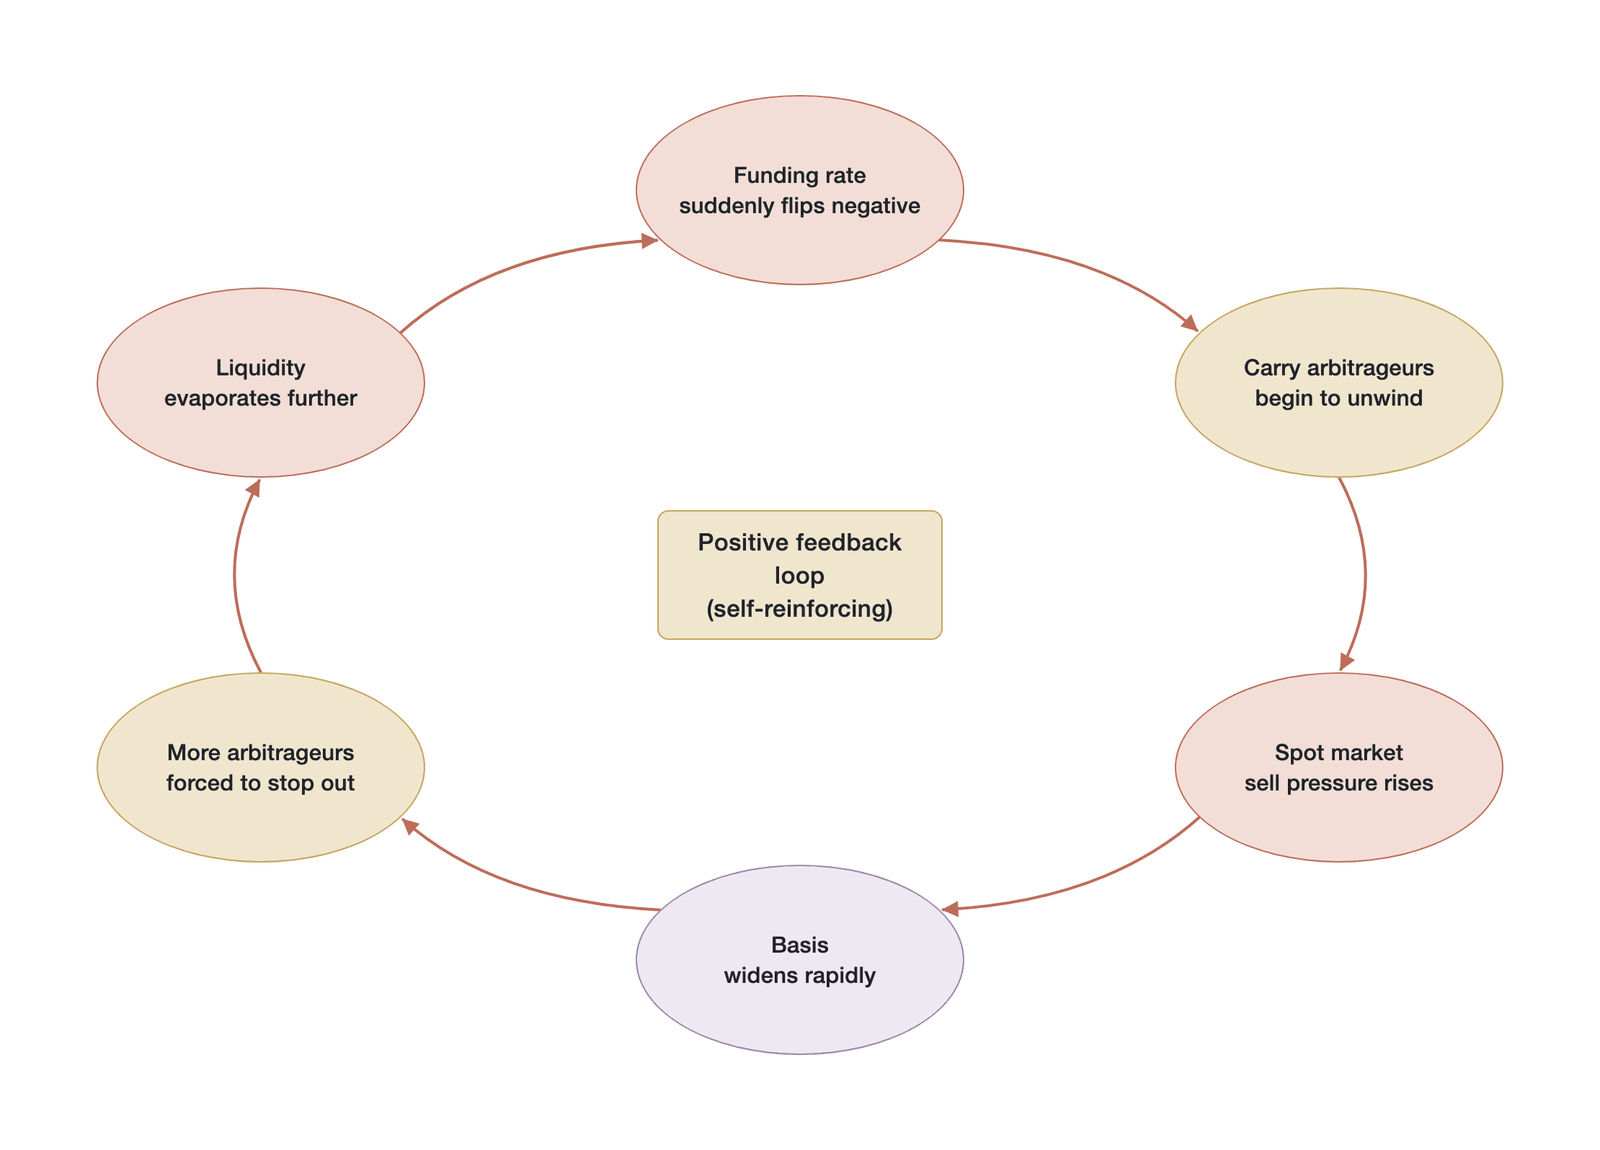
Figure 17-17. Schematic of the positive-feedback-loop mechanism by which funding rate reversal triggers an arbitrageur stampede (Data source: mechanism schematic drawn by the author, not empirical data)
Figure 17-17 depicts the arbitrageur stampede triggered by funding rate reversal as a positive-feedback loop: the sudden flip to a negative rate forces carry arbitrageurs to close out, spot selling pressure mounts and the basis widens rapidly, and the wider negative basis in turn forces more arbitrageurs to cut losses and exit, evaporating liquidity further—the loop reinforcing itself. It is this loop that turns a collective exit in a crisis into an unstoppable stampede, so that the actual cost of closing out far exceeds any estimate based on normal-market data.
This process is a concentrated expression of the risk of crowded trades in financial markets. In his American Finance Association presidential address, Stein (2009) [21] rigorously argued that even a market composed of fully rational, well-informed arbitrageurs can become overcrowded because participants cannot observe one another's position sizes: each individual's optimal decision produces systemic fragility at the collective level. Khandani and Lo's (2011) [22] empirical analysis of the quant-fund stampede of August 2007 showed further that when large numbers of traders using similar strategies are forced to cut positions within the same time window, their collective behavior can drain liquidity within hours, producing market dynamics highly isomorphic to the crypto-market stampede described in this section. When too much capital chases the same seemingly risk-free strategy, the strategy's exit path itself becomes the largest exposure. Large numbers of participants trying to exit the same strategy at once cause exit costs to rise sharply. In crypto markets, this effect is magnified further by the scale of protocol-level arbitrage vehicles. When a protocol manages billions or even tens of billions of dollars of basis-arbitrage positions, any decision it makes to close out in a crisis is enough to sway the entire market decisively. If Ethena were forced into a large-scale unwind to cope with negative funding and user redemptions, the selling volume of this single entity might exceed what the market can absorb within any reasonable slippage. This concentration risk means that a protocol's self-rescue can turn into a market-wide stampede, imposing severe negative externalities on other small and midsize arbitrageurs. In the end, as all arbitrageurs rush for the exit together, the market exhausts its last trace of liquidity, order-book depth contracts sharply, and spreads widen to extremes.
17.6.3 Liquidity stratification
The risk of a liquidity black hole is not evenly distributed across all crypto assets. On the contrary, it exhibits a pronounced layered structure, which this chapter calls liquidity stratification. This phenomenon is especially prominent in perpetual futures markets, where it carves a deep gulf between the mainstream coins (Bitcoin, Ethereum) and the broad universe of altcoins, directly determining the feasibility and risk exposure of arbitrage strategies across assets. For an arbitrageur, choosing which asset to deploy a strategy on matters far more than choosing the strategy itself, because an asset's liquidity tier fundamentally defines the upper bound on its risk.
At the top of the market sit Bitcoin and Ethereum. Their perpetual futures markets have the highest level of liquidity in the world, with daily volumes routinely reaching tens or even hundreds of billions of dollars. Vast volume, deep order books, and extremely narrow bid-ask spreads together make for a relatively robust trading environment. This means that even in extreme periods of violent volatility, liquidity, though it declines markedly, usually does not evaporate entirely. An arbitrageur managing a multimillion-dollar position can still, after paying some slippage, find enough counterparties to complete an exit. This provides a basic cushion for arbitrage, letting the various strategies applied to BTC and ETH (basis arbitrage, cross-exchange arbitrage) operate effectively most of the time and keeping their market efficiency high.
One tier down are the mainstream altcoins with high market capitalization and strong consensus, such as SOL and DOGE. Although the perpetual futures markets of these assets are far smaller than those of BTC and ETH, they usually still have daily volumes in the billions of dollars and reasonable market depth. When the market is calm (see Figure 17-18), arbitrage on these assets is feasible, though its potential slippage costs and execution risk are markedly higher than for the top assets. The liquidity buffer of these markets is significantly thinner, however. Once the market enters the stressed state, their liquidity contracts far faster than that of BTC and ETH, spreads widen quickly, and the impact cost of large orders rises sharply. For arbitrageurs, this means deploying a strategy on these assets requires more conservative position sizing and more sensitive risk monitoring.
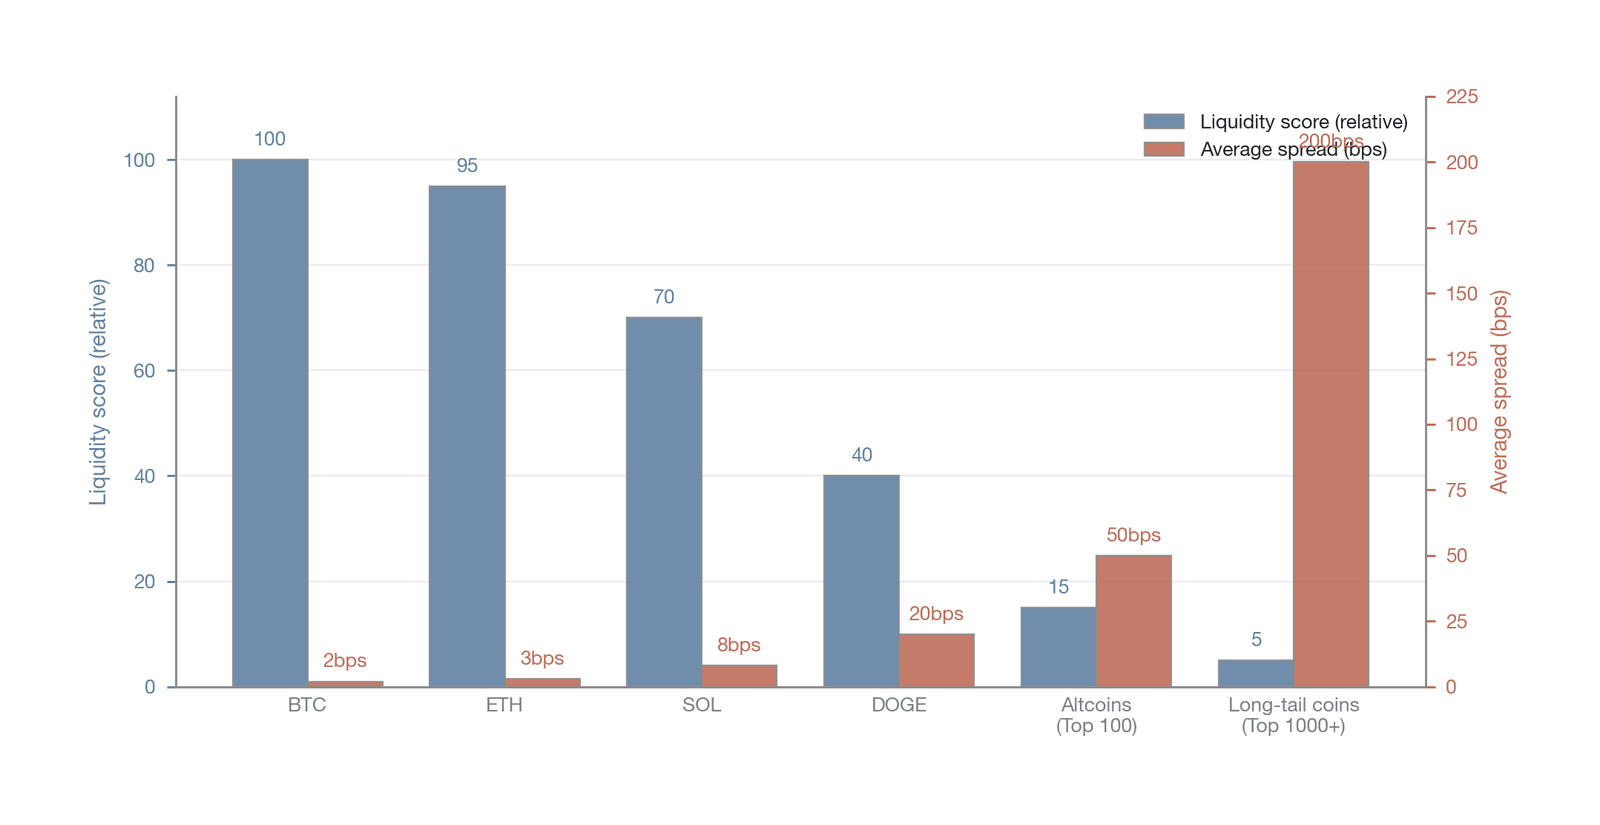
Figure 17-18. The liquidity-stratification structure and arbitrage feasibility of different asset classes (Data source: drawn by the author; the tier scores are relative illustrative values, not empirical data)
The true discontinuity appears among the lower-tier altcoins and long-tail assets. For a typical altcoin ranked outside the top 100 by market capitalization, perpetual futures daily volume may be a mere few million dollars or even less. Order-book depth is severely lacking, and the gap between the best bid and best ask may exceed 50 basis points. In such a market, even arbitrage under normal conditions faces significant difficulty. A trade of a few tens of thousands of dollars can move the price noticeably, so that the theoretical arbitrage margin is entirely consumed by slippage at the execution stage. More dangerous still, a thin order book creates the conditions for price manipulation: a large holder can distort the mark price by concentrated buying or selling and trigger unexpected liquidations of other traders. For arbitrageurs seeking opportunities in such markets, the risk is not only insufficient liquidity but also the ever-present uncertainty of being deliberately targeted for manipulation. In a crisis, liquidity in these markets falls almost instantly to zero, trading seizes up entirely, and any attempt to close out can scarcely obtain a reasonable fill. This directly produces a vast gradient in the efficiency spectrum along the "asset dimension": the mainstream-coin market is relatively efficient, while the long-tail-asset market is full of persistent arbitrage opportunities that cannot be eliminated because of the liquidity constraint.
This liquidity stratification is an important complement to the Arbitrage Infrastructure Hypothesis. It reveals that the coverage of arbitrageurs' "infrastructure" is limited. They tend to build and maintain it in the most liquid "core regions," where the risk-return ratio is highest. In the vast, illiquid "periphery," the absence of arbitrage leaves these markets chronically inefficient and fragile. When assessing the risk of an arbitrage strategy, therefore, one must consider it within the liquidity tier of its target asset. A strategy that runs robustly on BTC, if simply copied onto some altcoin, may well fail when it meets a liquidity black hole.
17.6.4 Liquidity evaporation in a crisis
If liquidity stratification is the static structure of risk, then in a market crisis we can observe the devastating process by which this risk structure is dynamically activated. Several major crises in history—the "Black Thursday" of March 2020, the "May 19 crash" of 2021, and the collapses of LUNA and FTX in 2022—all provide excellent cases for quantifying how liquidity evaporates into thin air and how the basis dislocates sharply. These historical data are not merely a confirmation of theory but the ultimate stress test of every arbitrageur's risk-management capability.
In the opening stage of a crisis, the most visible change in the indicators is the sharp shrinkage of order-book depth. Take the BTC perpetual futures on a major exchange: under normal conditions, the cumulative resting orders within 1% above and below the midpoint may total hundreds of millions of dollars, providing an ample buffer. As Figure 17-19 shows, however, when systemic panic spreads, large numbers of market makers and passive liquidity providers pull their orders and seek safety. The order book thins rapidly, the once-continuous ladder of quotes becomes fragmentary, and huge "vacuum zones" appear between adjacent price levels. Liquidity evaporation means that a market order of ordinarily moderate size may now punch through several price levels, causing enormous market impact and slippage. For an arbitrageur anxious to close out, this means their exit cost grows exponentially.
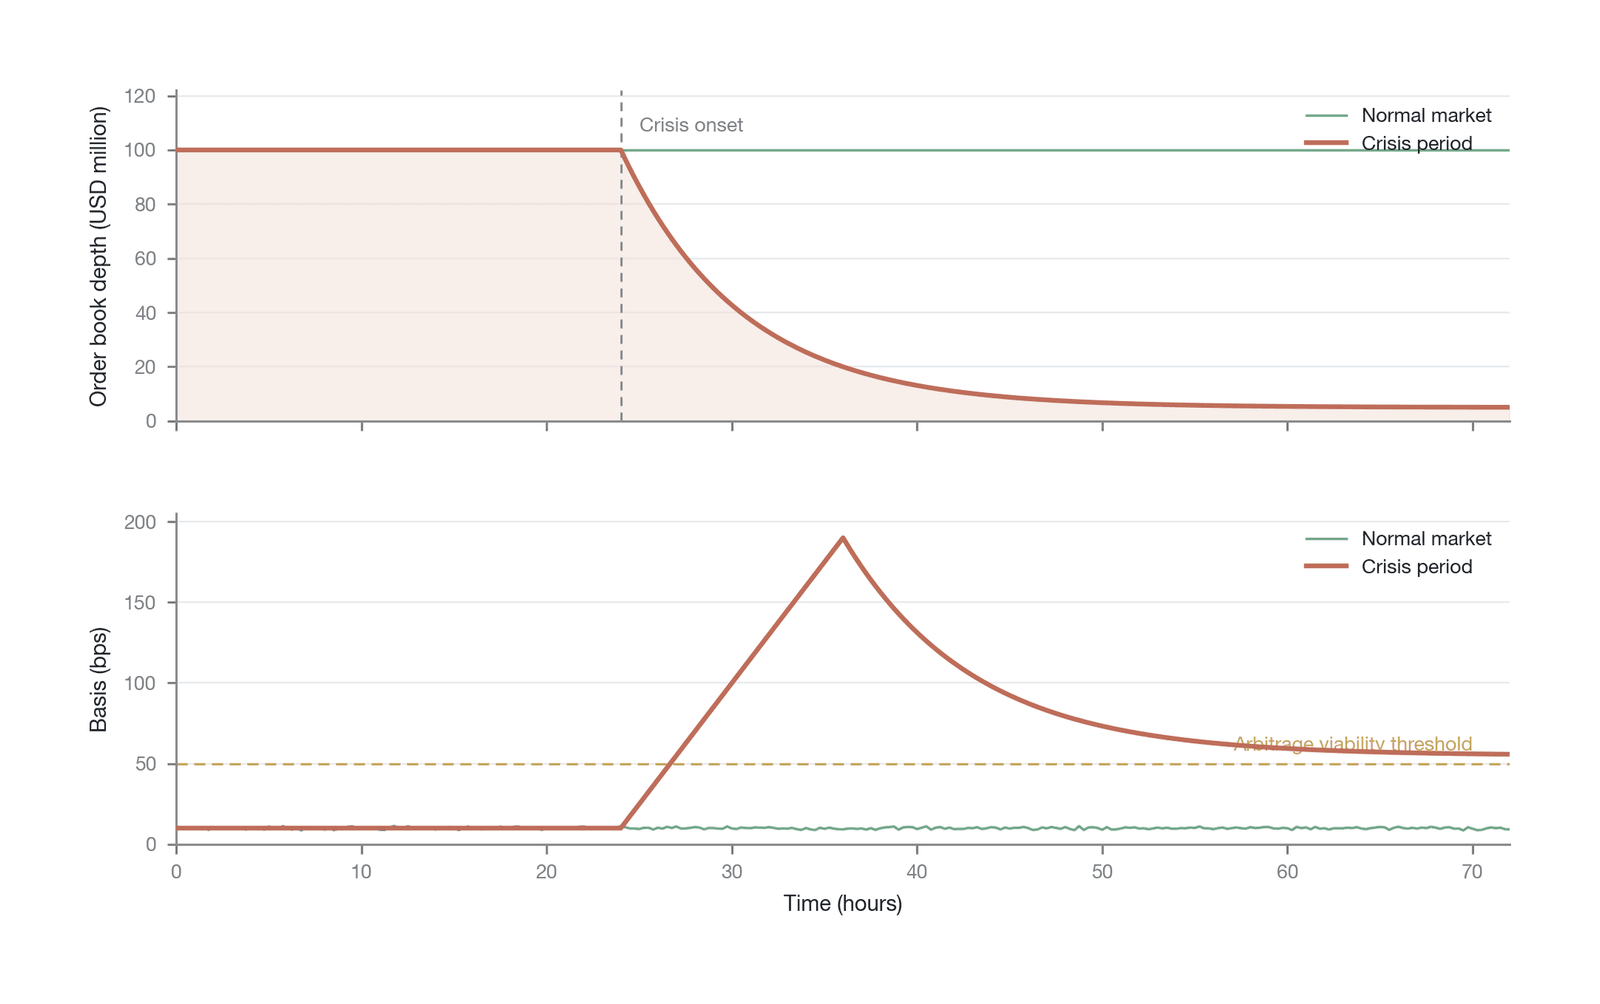
Figure 17-19. Schematic of the cascade reaction triggered by mass liquidations (Data source: schematic drawn by the author, not empirical data)
Figure 17-19 contrasts the evolution of liquidity in normal and crisis periods as a time series: after the crisis erupts, order-book depth collapses to an extremely low level within hours, while the basis crosses the boundary of arbitrage feasibility and spikes to an extreme high before slowly receding. The synchronized deterioration of the two shows that, at the very moment arbitrageurs most need to exit, market depth and executability collapse together, and the cost of exit grows exponentially.
Accompanying liquidity evaporation is a sharp widening of the basis. The stampede mechanism causes the spot and perpetual futures prices to diverge violently. At the peak of a crisis, the discount (negative basis) of perpetual futures relative to spot can reach an extreme degree. In a normal market, a basis of −50 basis points (−0.5%) already counts as a significant arbitrage opportunity, but in the extreme "Black Thursday" conditions of March 2020, the XBTUSD perpetual futures on BitMEX traded at a discount of about −12%, or even deeper, relative to spot (the exact instantaneous extreme varies by data source). Notably, this extreme discount was not driven entirely by market forces: on March 13, immediately afterward, BitMEX halted trading for about 25 minutes because of a distributed denial-of-service attack, and the interruption led market makers to pull orders heavily once the platform resumed, causing order-book depth to plunge. This extreme discount was therefore, to a large extent, the product of a resonance between liquidity depletion (Dimension V) and platform risk (Dimension III)—a representative case consistent with this chapter's risk-resonance mechanism (it should be noted that the DDoS outage was an idiosyncratic exogenous factor specific to this event, and the generality of the model still rests on the earlier multi-case comparison of "different starting points, same terminal state"). A dislocation of this magnitude far exceeds what any basis-arbitrage strategy can withstand. The portfolio value of every arbitrageur holding a "buy spot, short perpetual" position suffered enormous losses within a very short time, directly triggering a large wave of forced liquidations. These liquidation orders further intensified selling pressure, formed a vicious cycle, and ultimately caused the market's pricing mechanism to fail severely, if temporarily. This offers a compelling explanation of the direct cause of the basis anomaly examined in Chapter 18 (see Section 18.2): it was not that arbitrageurs failed to see the opportunity, but that, in the face of a liquidity black hole, they could scarcely execute the arbitrage at a reasonable price.
In a liquidity black hole, arbitrageurs of different sizes behave in markedly divergent ways. Large, well-capitalized arbitrage institutions—professional market makers and high-frequency trading firms—by virtue of their greater risk tolerance and more advanced execution systems, can often recognize the risk signals early in a crisis (see Figure 17-20) and begin to reduce their positions in an orderly, staged manner. They exit gradually, splitting large orders into many small ones and using algorithms to execute at different points in time so as to minimize market impact. Small and midsize arbitrageurs and retail investors, by contrast, tend to react more slowly and have weaker risk management. By the time they finally recognize the danger and begin to close out in panic, part of the market's liquidity has already been consumed by the exit of the large institutions, and they face worse prices and higher slippage. The smallest participants—those on high leverage whose margin is already near the liquidation threshold—often do not even get the chance to close out voluntarily before the exchange's liquidation engine forcibly closes them out. This divergence in exit paths further deepens the market's unfairness and ultimately shapes the evolution of the liquidity black hole: from orderly retreat, to panic selling, to a final liquidation cascade.
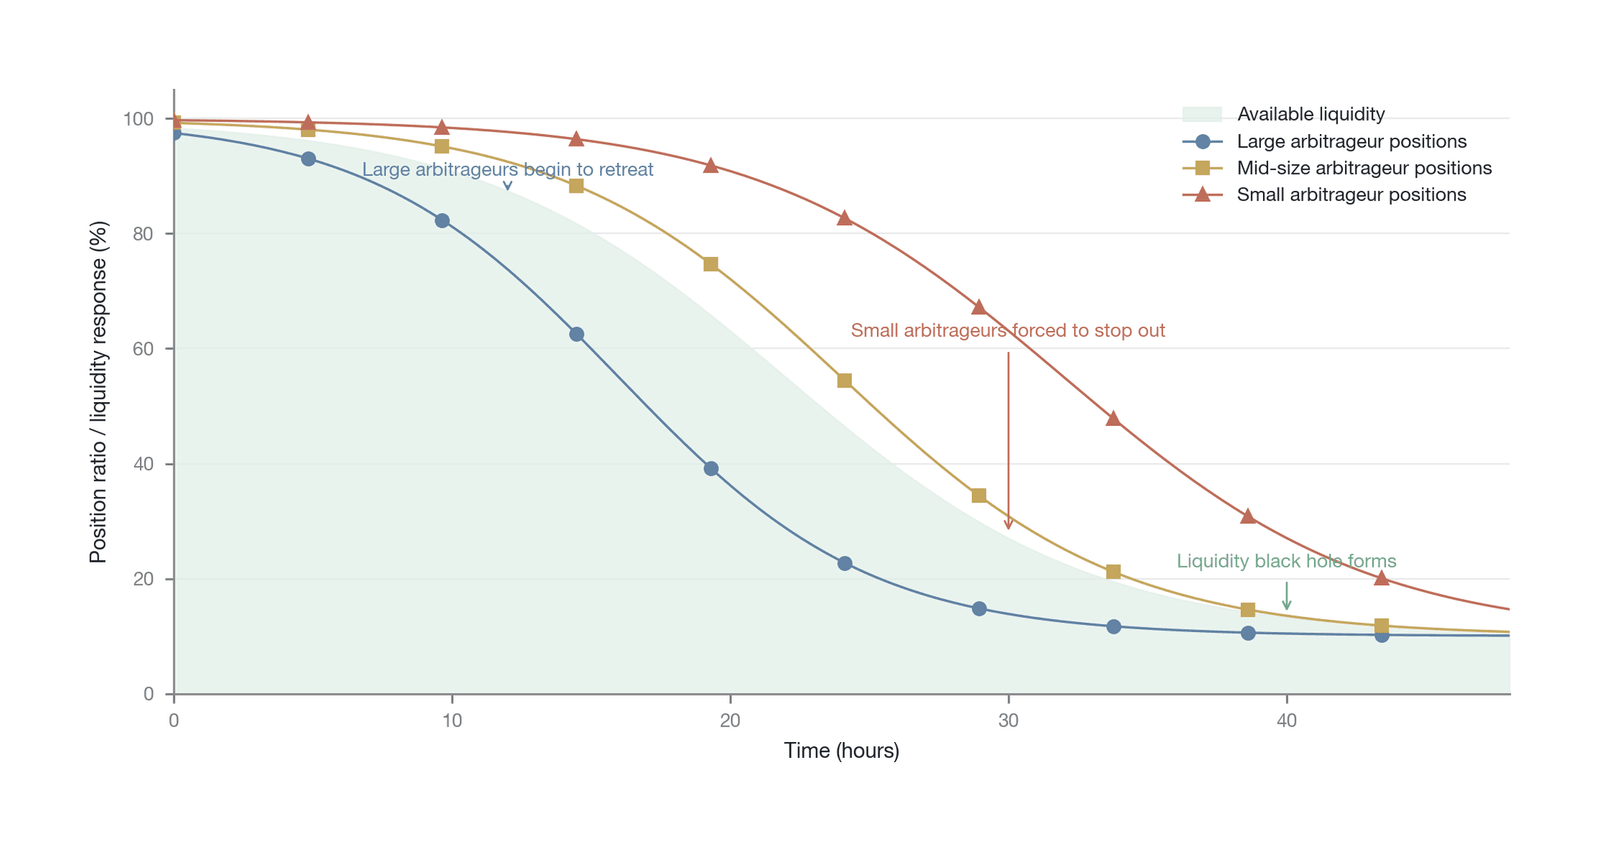
Figure 17-20. Divergence in the exit behavior of arbitrageurs of different sizes during a crisis (Data source: schematic drawn by the author, not empirical data)
In sum, the liquidity black hole is a concentrated expression of the endogenous fragility of perpetual futures markets. It is rooted in the conditional nature of the liquidity arbitrageurs provide, triggered through the stampede mechanism of collective position-closing, and differentiated in its destructive power by the liquidity stratification across assets. In a crisis, liquidity evaporation and a sharply widening basis together constitute systemic pressure on arbitrageurs, turning a theoretically "risk-free" strategy into an exposure that produces severe losses. For anyone hoping to survive over the long run in perpetual futures markets, a deep understanding and respect for this constraint dimension is an indispensable first lesson.
17.7 Smart contract and oracle risk
When arbitrage extends to decentralized exchanges, the risk topology undergoes a structural shift. In a CEX environment, technical risk shows up mainly as recoverable failures such as API latency or system downtime; in the DeFi ecosystem, smart contract and oracle risk rises to become the central concern. Once a vulnerability or design flaw in the code is exploited, the consequences are immediate, destructive, and often irreversible.
For an arbitrageur who relies on a DEX, the safety of their position hangs entirely on the robustness of the underlying smart contract, the accuracy of the oracle's price feed, and the integrity of the cross-chain infrastructure. Unlike in a CEX environment, once technical risk in DeFi materializes it often leads directly to a permanent loss of assets. This section systematically analyzes the internal mechanism of this constraint dimension along four aspects: smart-contract vulnerabilities, oracle manipulation, cross-chain bridge security risk, and the uncertainty of protocol governance.
17.7.1 Smart-contract vulnerabilities
The smart contract is the cornerstone of a DEX perpetual futures protocol, defining in code all the core logic—trading, liquidation, funding-rate calculation, and margin management. Yet any small vulnerability in these complex contracts can become the breach through which an attacker drains the protocol's funds (see Figure 17-21). History has proved repeatedly that even well-known protocols audited over many rounds can scarcely be wholly immune to logical flaws or novel attack techniques (although some cases achieve partial recovery through a protocol pause, a white-hat return, or an on-chain freeze via tracing, the losses are in most cases irrecoverable). According to a tally of reproduced exploits (DeFiHackLabs), in 2024 alone there were more than 150 contract-attack incidents caused directly by smart-contract vulnerabilities of various kinds, producing economic losses of more than $328 million.
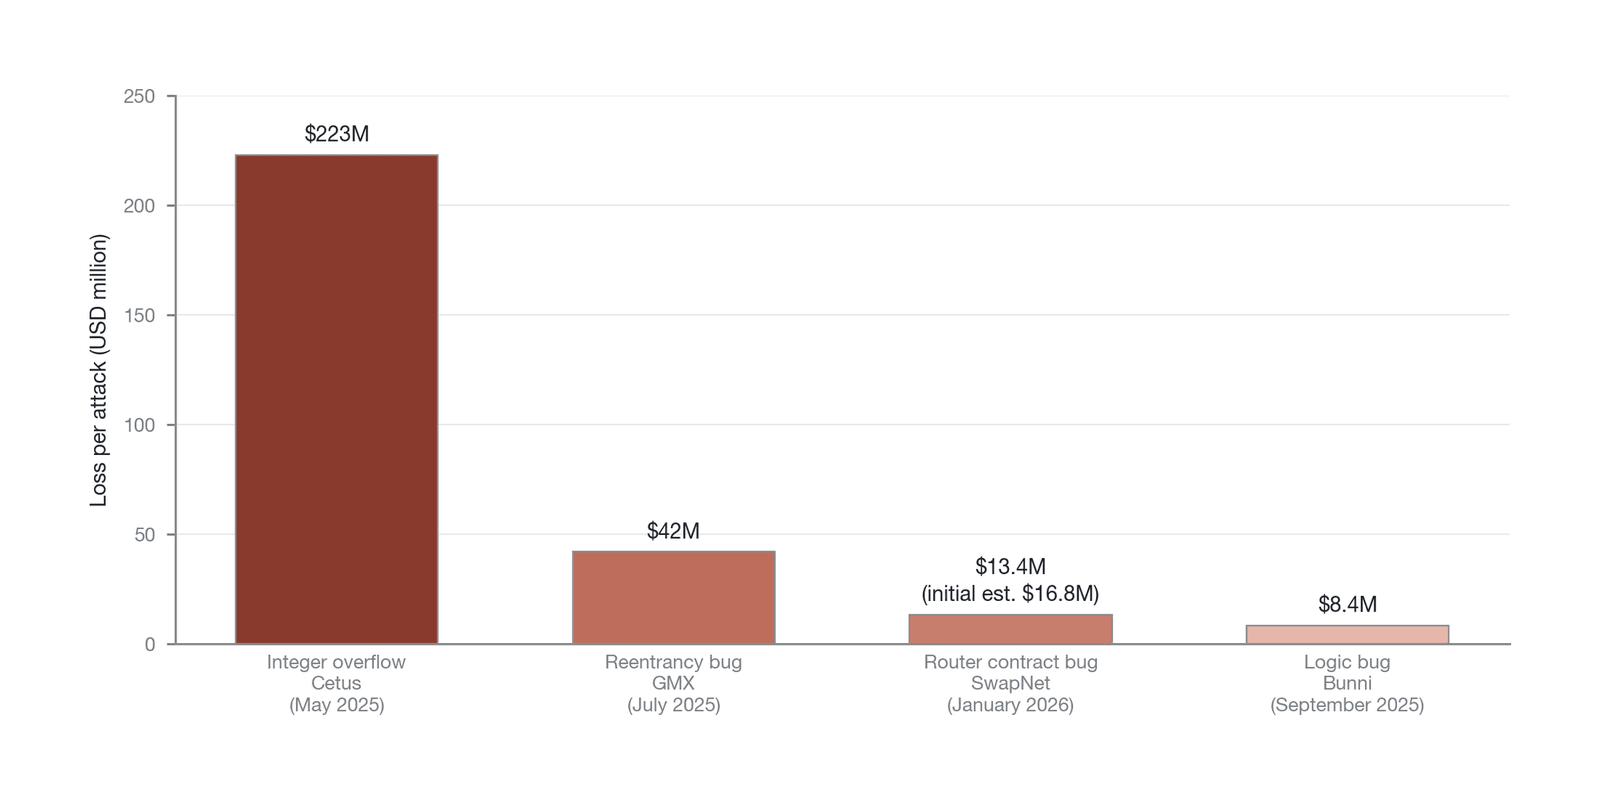
Figure 17-21. Comparison of single-incident losses from smart-contract attacks on major DEX protocols, 2025–2026 (for GMX, see [23]; for Bunni, see [24]; for SwapNet, see [25]; Cetus and others from reviews of public incidents; source: compiled by the author)
For arbitrageurs, this risk is concrete and severe. When a DEX perpetual futures protocol is attacked through a vulnerability, the most immediate consequence is the theft of the protocol's liquidity pool or treasury. The July 2025 attack on GMX, for example, caused asset losses of more than $42 million [23], while the September 2025 attack on Bunni DEX directly forced the protocol to shut down permanently, unable to cover an $8.4 million shortfall [24]. In such cases, a position an arbitrageur holds on that DEX—long or short—can become worthless or impossible to close in an instant. If that position is part of a cross-market arbitrage strategy (a CEX-DEX basis trade, say), then the sudden break of its "leg" on the DEX turns the hedge on the CEX side, in an instant, into a fully exposed, high-risk naked position. The arbitrageur not only loses their principal on the DEX but must urgently manage the exposure at the other end—which, in a violently moving market, easily triggers a second loss.
Attacks take many forms—from using a flash loan to manipulate prices and trigger abnormal liquidations, to finding a calculation error in the contract logic and opening a position at zero cost, to bypassing the margin-check mechanism to withdraw excess funds. In January 2026, for example, the DEX aggregator Matcha Meta was attacked through a vulnerability in the SwapNet routing contract it had integrated; according to the official post-mortem, the actual loss was about $13.4 million [25] (an initial on-chain estimate had run as high as $16.8 million but was later revised down after verification). These events highlight a stark reality: when an arbitrageur interacts with a DEX protocol, they are in effect passively trusting thousands of lines of code written by anonymous or semi-anonymous developers. This trust is fragile: once a flaw in the code is exploited, the arbitrageur not only fails to realize the expected profit but may face the extreme risk of losing all of their principal.
For a trader deploying an arbitrage strategy across both a CEX and a DEX, a smart-contract vulnerability on the DEX side translates directly into naked directional exposure on the CEX side: the sudden disappearance of the DEX leg means the CEX hedge instantly loses its protection.
17.7.2 Oracle manipulation
Oracle risk is the core vulnerable link connecting a DEX protocol to the outside world (see Figure 17-22). DEX perpetual futures need an oracle to obtain the reference price of a trading pair on external markets (usually the major CEXs), and this price is the key basis for computing the mark price, determining the funding rate, and triggering forced liquidation. The accuracy and manipulation-resistance of the oracle directly determine the fairness and security of the protocol. Yet the oracle has itself become a core attack vector, and its manipulation generates "false arbitrage signals" that lure arbitrageurs into a carefully designed trap.
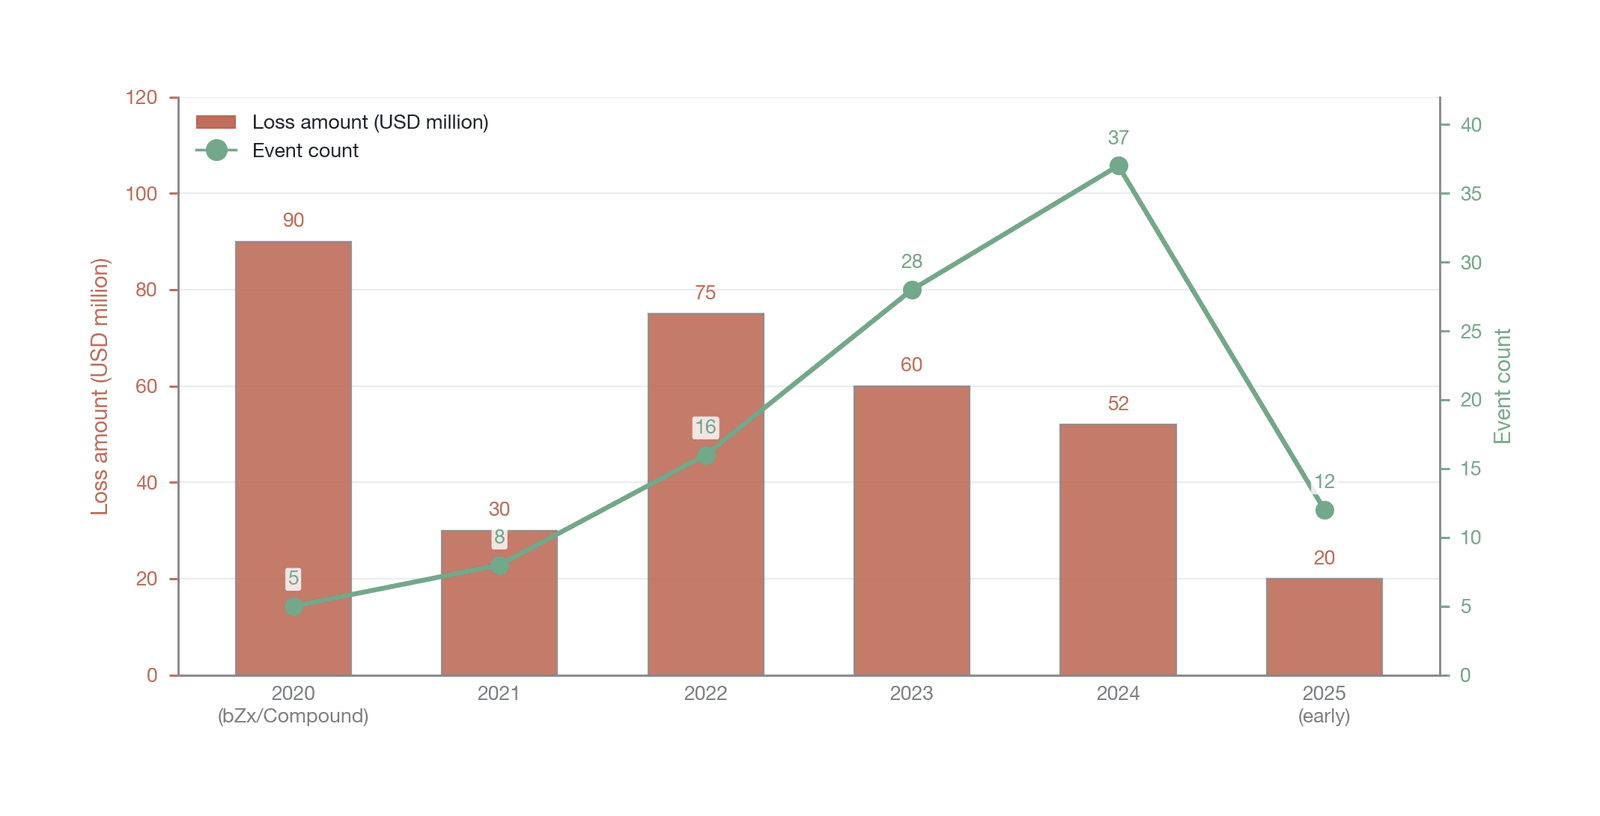
Figure 17-22. The historical evolution of oracle-manipulation attacks: loss amounts and incident counts, 2020–2025 (Data source: drawn by the author; the $52 million loss and 37 incidents in 2024 [26] and the $89 million Compound loss in 2020 [27] are empirical anchor points, while the other years are representative illustrative trend values, not year-by-year empirical data)
The typical technique of oracle manipulation is for an attacker to use a flash loan to obtain a huge sum of temporary capital within a single on-chain transaction, then execute a large swap in a shallow DEX liquidity pool, instantly distorting the pool's asset ratio and quoted price. If the target perpetual futures protocol's oracle relies on that pool's time-weighted average price as its reference source, the manipulated price is transmitted into the protocol. This produces two destructive consequences. First, it can cause the positions of many innocent users within the protocol to be liquidated erroneously as the mark price swings violently, with the attacker profiting as the liquidator. Second, it creates a huge but entirely false CEX-DEX spread. Automated arbitrage programs immediately seize on this "golden opportunity" and rush into the market to close the spread. But by the time the arbitrageur's trade fills on the DEX, the attacker has long since traded in the opposite direction on the CEX to return the price to normal. In the end, the arbitrageur's DEX trade fills at a heavily manipulated price while the hedge at the other end can only execute at the normal price, producing a substantial loss—and that loss is precisely the attacker's source of profit.
Since bZx suffered the first large-scale flash-loan oracle attack in 2020, such incidents have recurred without pause. Historical data show that oracle manipulation has become one of the leading attack vectors in DeFi, causing losses of as much as $52 million in 2024 [26]. Even a top-tier DeFi protocol such as Compound suffered nearly $89 million in abnormal liquidations in 2020 because of a problem with its oracle price source [27]. This risk dimension reveals a paradox of CEX-DEX arbitrage: arbitrageurs are supposed to be the correctors of market prices, yet in a scenario of oracle manipulation they become the ones harvested by the distorted price. The existence of this risk forces CEX-DEX arbitrageurs to build a careful analysis of the oracle mechanism into their strategy and to set aside a risk premium for the possibility of such "signal poisoning."
From the perspective of a CEX arbitrageur, the false spread signal produced by oracle manipulation directly threatens the effectiveness of a cross-market strategy: a position built on a contaminated price signal will produce an unhedgeable loss once the price returns to its true level.
17.7.3 Cross-chain bridge security risk
As the DeFi ecosystem expands across multiple chains, CEX-DEX arbitrage and purely on-chain arbitrage increasingly rely on cross-chain bridges to move assets between different blockchains. A cross-chain bridge is the critical infrastructure connecting isolated value networks (see Figure 17-23), letting an arbitrageur buy an asset on Ethereum and then quickly move it to a DEX on an emerging public chain to sell, capturing the cross-chain spread. Yet cross-chain bridges have become the most fragile and most frequently attacked infrastructure in the entire DeFi ecosystem.
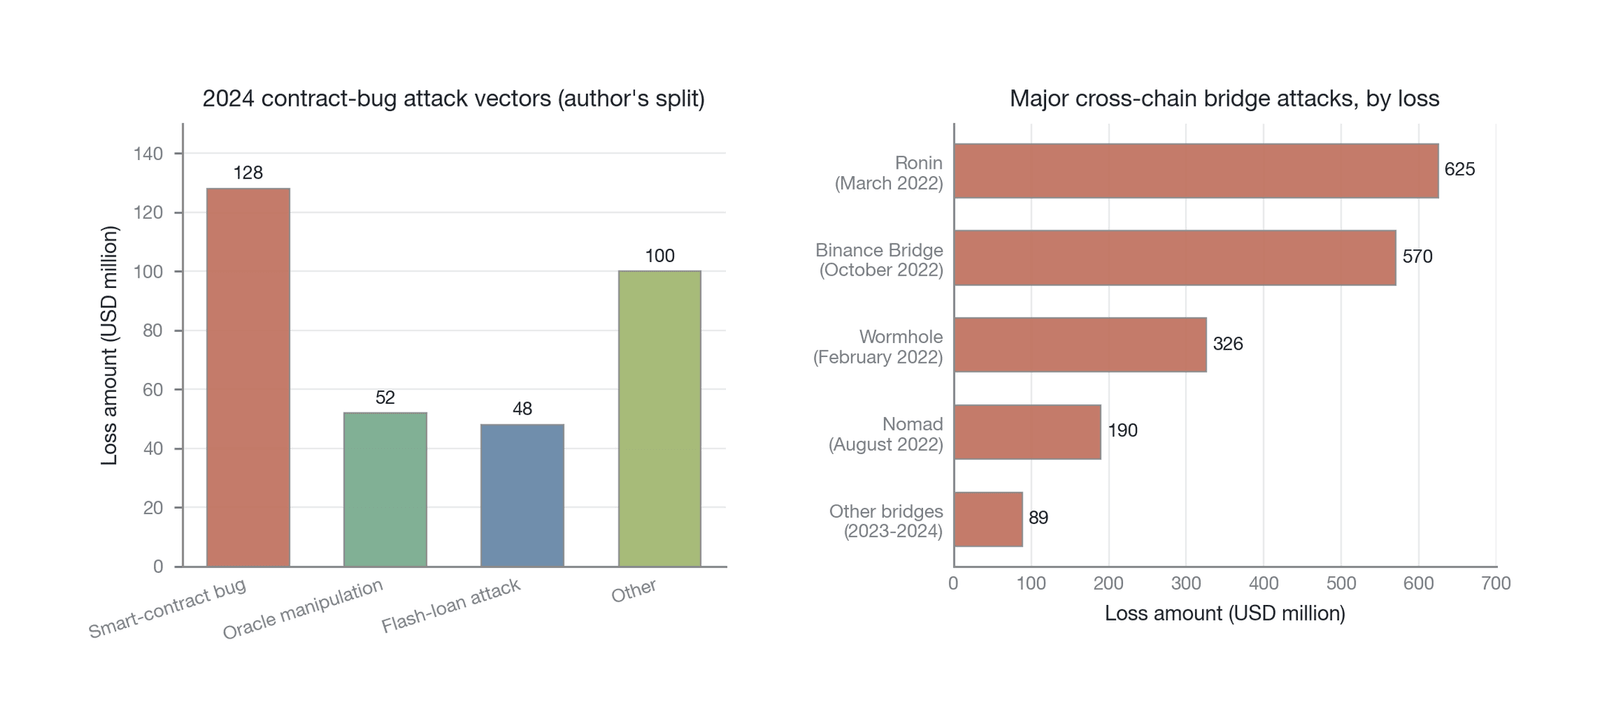
Figure 17-23. The distribution of contract-vulnerability attack vectors in 2024 (left, broken out by the author) and historical losses from major cross-chain bridge attacks (right, per FX Empire/Chainalysis [28])
The technical implementation of a cross-chain bridge is exceptionally complex, involving custody, locking, minting, and burning, and its security model is far more challenging than that of a single-chain application. Attackers can steal huge sums from a bridge by compromising validator nodes, exploiting smart-contract vulnerabilities, or stealing private keys. The data show enormous losses: according to Chainalysis figures cited by FX Empire, more than $2 billion of assets were stolen in just 13 major cross-chain bridge attacks [28], including the historic thefts of about $625 million from the Ronin Bridge and about $326 million from Wormhole. In addition, about $570 million was stolen from BNB Chain (Binance Bridge) in October 2022 (which occurred after the window of the statistics above and is therefore not counted among the 13). The losses from these events often far exceed those from an attack on a single DeFi application.
For traders who rely on cross-chain bridges for arbitrage, this risk is systemic. If a bridge is attacked while a sum of funds is moving through it from Chain A to Chain B, those in-transit funds may be frozen or even lost permanently. The arbitrage loop is thereby interrupted: the position the arbitrageur has already established on Chain A loses its hedge on Chain B and is instantly exposed to market risk. Consider a statistical-arbitrage strategy that plans to go long on a DEX on Polygon and short on a DEX on Solana: if its funds are stolen while bridging through Wormhole, the basis of the entire strategy ceases to exist. The arbitrageur must not only bear the loss of funds but also face an incomplete, risk-laden portfolio. This worry that a "main thoroughfare" might collapse at any moment markedly limits both the capital committed to cross-chain arbitrage and the appetite for it, allowing spreads between different blockchain ecosystems to persist—a major source of market segmentation and efficiency loss.
For an arbitrageur on the CEX side, cross-chain bridge risk means their arbitrage capital carries an uncontrollable window of exposure during transfer: while in transit, the funds can neither be used to hedge nor be recalled in an emergency.
17.7.4 Protocol-upgrade and governance risk
The final aspect of technical-infrastructure risk is the risk inherent in the seemingly benign processes of protocol upgrades and decentralized governance themselves. Unlike traditional software, a DeFi protocol's "upgrades" and "rule changes" are usually decided by token holders through decentralized governance votes. Although this model empowers the community, it also introduces new uncertainties and attack vectors.
One obvious risk is that a protocol upgrade may itself introduce new vulnerabilities. In fixing old problems or adding new features, developers may inadvertently create new security holes. More dangerous still, a protocol's upgrade authority—usually controlled by a multi-signature wallet—may be compromised. After the FTX collapse of November 2022, the upgrade key of Serum, the core Solana-ecosystem DEX that FTX controlled, was leaked, forcing the entire community into an emergency hard fork to prevent a malicious upgrader from seizing full control of the protocol. For arbitrageurs who relied on Serum to trade, this meant that the underlying market rules and codebase they depended on underwent an involuntary, uncertainty-laden change overnight.
A deeper hazard comes from the possibility that the decentralized governance process itself is manipulated. An attacker can borrow governance tokens in bulk on the market to launch a malicious proposal—amending fee parameters in their own favor, whitelisting themselves to bypass certain restrictions, or even proposing outright to transfer the protocol treasury's funds to themselves. Although mechanisms now guard against such blatant attacks, subtler governance risks remain. Contentious proposals over protocol revenue distribution or the adjustment of key parameters (such as the liquidation penalty or the choice of oracle), for instance, can cause the protocol's rules to change dramatically. The fierce dispute within the Aave community over its governance structure and revenue distribution in late 2025 highlighted how internal conflict within a DAO can create uncertainty about a protocol's future direction. Because arbitrageurs' strategies are often based on the precise calculation of current protocol parameters, any unexpected rule change can render a carefully designed arbitrage model useless in an instant. This governance risk means that arbitrageurs must not only analyze code but also, like political analysts, constantly follow community developments and governance proposals—adding yet another new and hard-to-quantify constraint dimension.
For a CEX trader who builds an arbitrage position on DEX perpetual futures, governance risk means the underlying parameters of the strategy may be changed without warning, rendering a carefully calibrated hedge ratio or rate model useless in an instant.
17.7.5 Sequencer and validator risk
With the rapid rise of on-chain order-book DEXs such as Hyperliquid and dYdX v4, a new technical-infrastructure risk is emerging: centralization risk at the sequencer and validator level. Hyperliquid uses a centralized sequencer for order matching and transaction ordering, while dYdX v4 runs on a dedicated chain built on the Cosmos SDK, producing blocks by consensus among a validator set. These designs outperform traditional Ethereum-mainnet DEXs, but they also introduce a distinctive risk dimension.
A centralized sequencer faces three risks: a single point of failure that can halt the entire DEX at a critical moment; the sequencer operator's theoretical ability and incentive to front-run user trades; and the possibility that the sequencer censors particular transactions or traders. In the March 2025 episode in which Hyperliquid handled anomalous trading in the JELLY token (which produced a peak unrealized loss of about $12 million in its liquidity vault, consistent with the figure in Section 16.4.3), the validators voted collectively to delist the JELLY perpetual and forcibly liquidate the relevant positions at a non-manipulated internal settlement price, provoking a broad debate over whether a "decentralized exchange" is truly decentralized. For traders deploying an arbitrage strategy on such a platform, this means the safety of their positions depends not only on market risk and smart-contract risk but also on governance decisions at the sequencer/validator level—a risk that also exists on a CEX but is especially paradoxical in a DEX context.
For a trader who builds an arbitrage position on DEX perpetual futures, sequencer risk means that both the fairness of their trade execution and the platform's availability depend on a de facto centralized link—a significant tension with the promise of decentralization.
Smart-contract flaws, oracle dependence, cross-chain bridge fragility, governance uncertainty, and the centralization risk of sequencers and validators together define the distinctive technical risks of DeFi arbitrage and explain the persistence of the efficiency gap between CEXs and DEXs, and between different chains.
17.8 Regulatory and compliance risk
Regulatory and compliance risk has a distinctive external character within the seven-dimensional constraint topology. Unlike constraints determined endogenously by market structure, such as margin or liquidity, regulatory risk arises from the ambiguity of legal interpretation, the exclusivity of licensing, and the suddenness of policy shifts, directly raising compliance costs and blocking particular trading routes [29].
This section analyzes, along four dimensions—cross-jurisdictional compliance costs, exchange access restrictions, the uncertainty of tax treatment, and sudden regulatory events—how this external constraint systematically limits the range over which arbitrage can be deployed and how, in extreme cases, it resonates with the other, endogenous risk dimensions.
17.8.1 Cross-jurisdictional compliance costs
In the early stages of the cryptocurrency market's development, regulatory differences across jurisdictions were regarded as an arbitrage opportunity. Arbitrageurs exploited the ambiguity in different countries' definitions of digital assets, establishing entities in lightly regulated jurisdictions to escape heavy compliance burdens. With the full implementation of the European Union's Markets in Crypto-Assets (MiCA) Regulation in 2025 and the enactment of the U.S. GENIUS Act, however, this "regulatory arbitrage" is turning into a heavy "compliance tax." A tightening global regulatory framework means that any arbitrage firm hoping to operate at scale must maintain compliance in several jurisdictions at once.
This surge in compliance costs directly weakens the marginal return of arbitrage strategies. According to industry survey data (such as Chainalysis's annual compliance report), the ratio of compliance spending to revenue at leading arbitrage firms rose markedly between 2023 and 2026. This spending covers anti-money-laundering monitoring systems, the cost of licenses in multiple countries, and complex tax-reporting infrastructure. When compliance costs exceed the expected return of a particular cross-exchange strategy, arbitrageurs are forced to abandon that route, allowing a price gap that could otherwise have been closed to persist. The phenomenon is especially clear in euro-stablecoin arbitrage: because MiCA imposes strict reserve and distribution requirements on compliant stablecoins, the euro-stablecoin basis on compliant exchanges is often markedly higher than on unregulated offshore platforms. This spread stems not from market inefficiency but from the pricing of compliance-cost risk.
What affects perpetual futures arbitrageurs more directly is the differing restrictions various jurisdictions place on derivatives leverage and retail access. Whether perpetual futures constitute a "swap" under the jurisdiction of the CFTC remains contested, and this uncertainty exposes U.S. entities to legal risk when they participate in offshore perpetual futures trading. Japan's Financial Services Agency has imposed especially strict limits on crypto derivatives, cutting the retail leverage ceiling to 2x (a sharp reduction from the previous 25x in 2020). The regulatory frameworks of Hong Kong and Singapore define "professional investor" status for derivatives traders strictly, excluding many small and midsize arbitrage teams from these highly liquid market nodes. These differentiated access thresholds directly reduce the total capital that can participate in arbitrage in a given market, and thus structurally limit the speed at which cross-jurisdictional spreads are repaired.
17.8.2 Access restrictions and route blockage
Regulation-driven access restrictions are blocking the free-flow-of-funds routes on which arbitrage depends. To meet local regulatory requirements, many exchanges have imposed strict geofencing and identity-based access restrictions. For cross-exchange arbitrageurs, this means they may be unable to open accounts on both ends at once, or must circumvent the restrictions through complex legal structures, which further raises operational risk.
In perpetual futures especially, jurisdictions differ sharply in their limits on leverage and retail participation. The regulatory frameworks of Hong Kong and Singapore, for example, define professional status for derivatives traders strictly, excluding many small and midsize arbitrage teams from these highly liquid nodes. When a major price deviation appears between a restricted exchange and the global market, the lack of enough qualified arbitrageurs greatly slows the repair of the basis. This "access blockage" is especially severe in extreme markets, because it prevents outside capital from entering the stressed region to arbitrage in the opposite direction, thereby intensifying that region's liquidity depletion and its chain of liquidations.
17.8.3 The uncertainty of tax treatment
Tax risk is the most insidious constraint arbitrageurs face. In perpetual futures trading, the receipt and payment of funding, the settlement of mark-price gains, and the deductibility of liquidation losses are characterized entirely differently under different countries' tax laws. Many jurisdictions have yet to issue clear tax guidance for the financial innovation of perpetual futures, exposing arbitrageurs to enormous risk of retroactive taxation.
The uncertainty of tax treatment directly affects arbitrageurs' capital-allocation decisions. In some countries, perpetual futures gains may be treated as ordinary income (with a top rate exceeding 40%), while losses are subject to strict limits on deductibility. This asymmetric tax structure can turn a mathematically neutral delta-arbitrage strategy into one with a negative expected value after tax. Moreover, the cross-chain conversion of assets in cross-chain arbitrage may, under some tax laws, be treated as a "disposal event," generating an unnecessary tax burden. To avoid these potential risks, arbitrageurs often deliberately steer clear of particular assets or particular execution routes, and this tax-driven risk aversion shows up, at the macro level, as pricing distortions in particular trading pairs.
17.8.4 The shock of sudden regulatory events
Sudden regulatory events constitute an acute shock to the arbitrage system. An abrupt turn in regulatory policy—from an order to delist a coin to sanctions on a protocol—can destroy one end of an arbitrage position within a very short time.
Suppose a major jurisdiction suddenly announces a withdrawal ban on non-compliant stablecoins; the event would cause those stablecoins to trade at a severe discount on local exchanges. In this hypothetical scenario, although arbitrageurs might see an enormous buying opportunity, the severed withdrawal route would prevent funds from flowing to offshore markets to close out, and the force of arbitrage would be paralyzed in an instant. Such a regulatory shock not only creates risk but also, by altering market expectations, triggers a collective retreat of arbitrageurs. Here regulatory risk resonates violently with liquidity risk (the liquidity-depletion dimension) and counterparty risk (the counterparty-and-platform dimension), causing market efficiency to collapse completely within hours. This regulatory uncertainty is an indelible "sovereign risk premium" in arbitrage returns, and it is a key factor in explaining why the upper bound on crypto-market efficiency can never reach the level of traditional finance.
This hypothetical is not a mere thought experiment. In February 2024, the Nigerian authorities detained Binance executives and restricted the platform's local operations, causing severe price dislocations in Nigerian naira trading pairs while arbitrageurs, cut off from fiat deposit and withdrawal channels, could not step in to correct them. In the same year, SEC enforcement actions against several major exchanges led to the suspension or delisting of some trading pairs, directly blocking the arbitrage routes that relied on them. These real events confirm the immediate paralyzing effect of a sudden regulatory event on the force of arbitrage.
17.9 The risk resonance model
In a normal market, the seven constraint dimensions above can each be addressed separately through risk-management techniques. When extreme market stress appears, however, the linkages among these dimensions change qualitatively, forming a positive-feedback chain reaction that generates systemic risk far exceeding the simple sum of the individual dimensions—risk resonance.
Risk resonance reveals the mechanism by which market efficiency collapses nonlinearly in a crisis: when resonance occurs, the total risk of the arbitrage system amplifies in a superlinear, self-reinforcing manner, arbitrageurs' room to operate is sharply compressed, and the market's pricing mechanism seizes up. This section first uses an empirical analysis of the systemic crisis of May 2022 to show how risk resonance manifests in reality, then constructs a risk transmission matrix to identify the key transmission paths, and finally builds a theoretical model from two angles: the nonlinear amplification effect and the phase-transition critical point.
17.9.1 A resonance analysis of the May 2022 crisis
The collapse of the Terra/LUNA ecosystem in May 2022 provides a representative empirical case for observing risk resonance. In that systemic crisis, we can see clearly how the seven-dimensional arbitrage constraints described above were activated simultaneously within a mere 72 hours, amplified one another, and ultimately caused a systemic collapse in the market's arbitrage capacity.
The event was triggered by the initial depegging of the algorithmic stablecoin UST. Against the extremely fragile macro backdrop of the crypto market at the time, however, this initial disturbance quickly evolved into a full-blown crisis of confidence. As the Bitcoin price fell, a chain of reactions was set off that bound the previously independent risk dimensions tightly together.
The crisis transmission began with the activation of risk in the margin-and-forced-liquidation dimension. As the BTC price fell rapidly from the $40,000 region, the margin levels of many arbitrage positions that used BTC as collateral or as a hedging asset—especially the popular basis trade (buy BTC spot, short perpetual futures)—dropped sharply (see Figure 17-24). Every fall in price meant a shrinkage in the value of the spot side, forcing arbitrageurs to post additional margin or face forced liquidation. This directly compressed arbitrageurs' capital buffers and sharply reduced their capacity to withstand subsequent shocks.
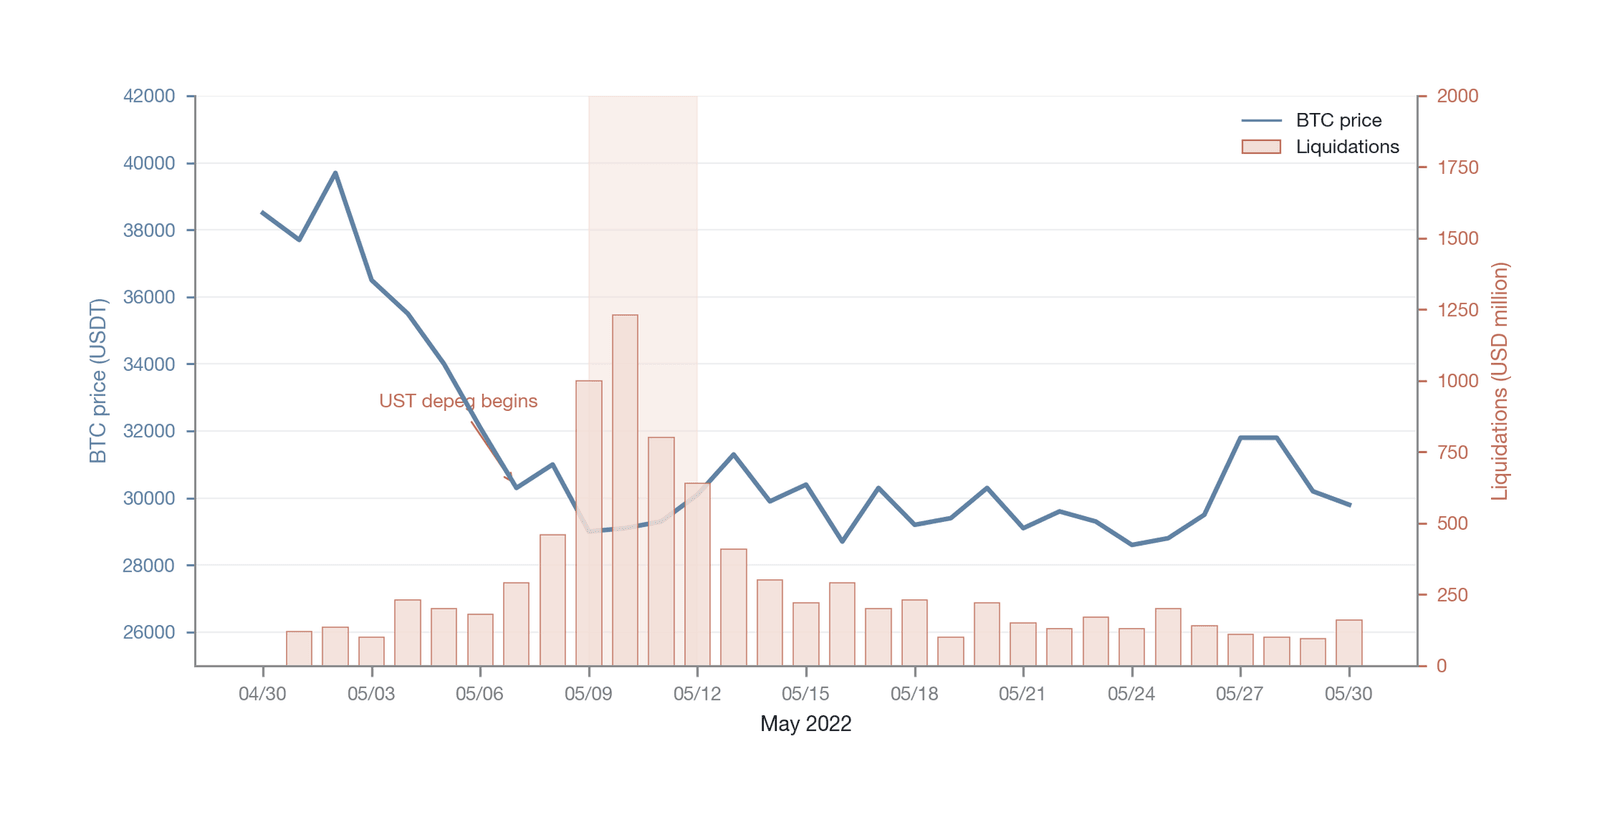
Figure 17-24. The BTC price decline and mass liquidations of May 2022 (Data source: Coinglass [9]; a representative series, not calibrated day by day)
Figure 17-24 overlays the BTC price path and market-wide liquidation volume to show their synchronized relationship. The data indicate that between May 9 and May 12, the BTC price fell sharply from the $35,000 region to around $26,000, a cumulative decline of more than 25%. At the same time, single-day market-wide perpetual futures liquidations exceeded several billion dollars on both May 10 and May 12, with short liquidations and long liquidations alternating—reflecting the violent swings in market direction and the wholesale collapse of arbitrageurs' margin.
As margin came under pressure, risk in the funding-rate-reversal dimension was activated in turn. Driven by market panic, large numbers of traders rushed into the perpetual futures market to short as a hedge, pushing the perpetual futures price to a steep discount to spot. This drove the funding rate—previously positive and a source of stable cash flow for basis arbitrageurs—rapidly negative, to extreme levels (consistent with the scenario at the start of this chapter, plunging from a normal positive value of about +0.03% per 8 hours to a deeply negative −0.10% per 8 hours). Overnight, the strategy's source of return became a continuing cost, which not only eroded profit but, more important, accelerated the consumption of margin, stacking severely on top of the pressure in the margin-and-forced-liquidation dimension.
Risk in the liquidity-depletion dimension also emerged rapidly in this process. When arbitrageurs tried to close out and cut losses under the dual pressure of margin and funding, they found the market lacked enough counterparties to absorb their closing orders. Large numbers of participants trying to exit at once caused bids to withdraw quickly and market depth to shrink sharply. As a result, the basis (the price difference between perpetual futures and spot) widened in an instant from tens of basis points to hundreds or even thousands. This meant not only enormous slippage losses on closing out; for many strategies that rely on basis convergence, the extreme divergence of the basis was itself a severe blow.
Under the pincer of these three pressures, the counterparty-and-platform-risk dimension did not escape either. Amid extreme volatility and the pressure of large-scale fund outflows, some centralized exchanges experienced withdrawal delays or even suspensions. This posed a serious threat to cross-exchange arbitrageurs who needed to move funds flexibly among multiple platforms (see Figure 17-25) to meet margin requirements. Frozen funds meant they could not transfer capital from the profitable leg to the losing leg, and a position still hedged in logic faced the risk of a single-leg forced liquidation at the operational level because its capital was severed.
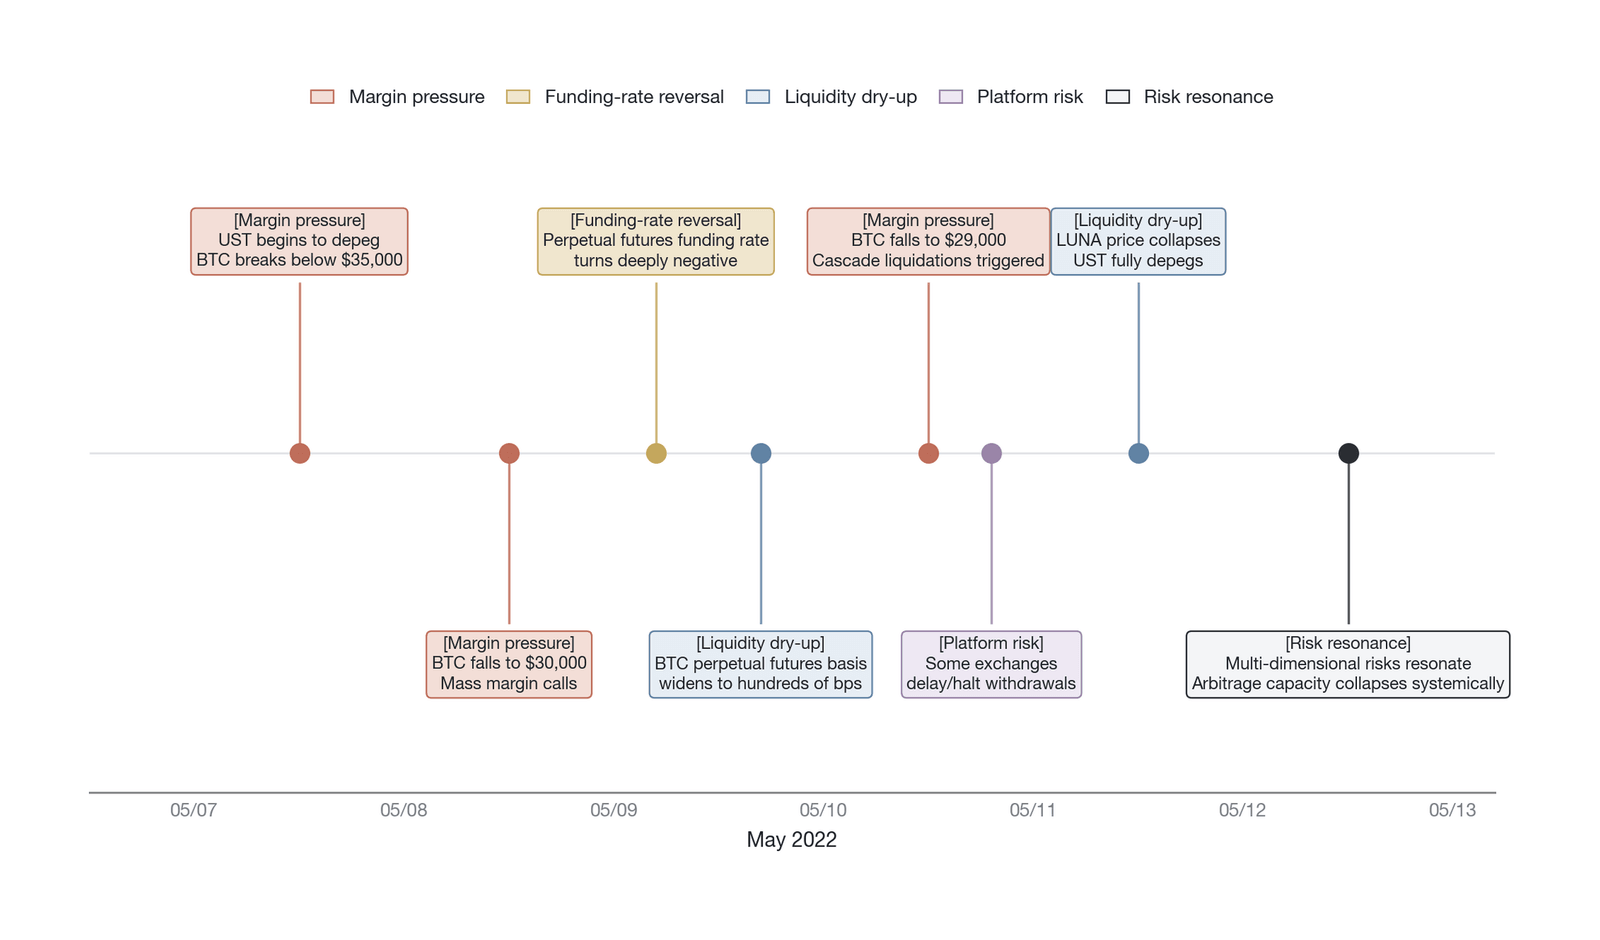
Figure 17-25. A timeline of the May 2022 crisis (Data source: compiled by the author)
Figure 17-25 reconstructs, as a timeline, the day-by-day evolution of the crisis from May 6 to May 13, 2022, clearly showing the temporal sequence in which the risk dimensions were activated one after another: the UST depegging sparked market panic (May 8) → the funding rate turned negative (May 9) → mass liquidations began (May 10–11) → exchange withdrawal delays appeared (May 12). This temporal structure shows that risk resonance does not occur instantaneously but forms and reinforces itself gradually within a window of 48 to 72 hours.
In this crisis, the four core risk dimensions—margin pressure, rate reversal, liquidity evaporation, and platform risk—were no longer independent problems but formed a self-reinforcing positive-feedback loop. Falling prices triggered margin calls and deepened market panic; panic drove the funding rate negative and depleted liquidity; and depleted liquidity made closing out extraordinarily difficult and costly, further magnifying losses, potentially triggering more liquidations, and again pushing prices down. It was precisely this multi-dimensional simultaneous activation and positive feedback that made arbitrage capacity collapse from normal levels to near zero within a few days, with market efficiency collapsing systemically along with it.
Notably, although execution and timing risk (Dimension IV), smart contract and oracle risk (Dimension VI), and regulatory and compliance risk (Dimension VII) were not the main drivers of the May 2022 crisis, this does not mean the three were unimportant. Execution risk was relatively muted in this crisis mainly because the crisis propagated far faster than arbitrageurs' normal trading cadence: most arbitrageurs were forcibly liquidated before they even had a chance to execute a close, so execution latency did not become the bottleneck. Smart-contract risk was not significantly activated because the main battleground of this crisis was the CEXs rather than DEX perpetual futures protocols, on-chain derivatives being a small market share at the time. As for regulatory risk, May 2022 predated the formation of a global crypto regulatory framework, and regulatory action was neither a trigger nor an amplifier of this crisis. In future systemic crises, however, as the market share of DeFi derivatives grows and the global regulatory framework tightens, the probability that these three dimensions are activated simultaneously will rise markedly; at that point, the dimensions of risk resonance will expand from four toward all seven, and its destructive power will multiply accordingly.
Comparing the analysis above with the FTX collapse of November 2022 further tests the generality of the risk resonance model. Unlike the LUNA/UST crisis, which was driven by margin pressure and funding rate reversal, the FTX crisis was initially triggered by counterparty and platform risk (Dimension III)—the collapse of the exchange's own solvency. Yet the transmission paths of the two crises converge on the same destination: FTX's withdrawal suspension severed arbitrageurs' fund-redeployment channels (activating Dimension III), which set off panic selling and a sharp price fall (activating Dimension I, margin pressure); the ensuing panic drove the funding rate to extreme negative values (activating Dimension II); and the collective exit of market makers and arbitrageurs drained liquidity market-wide (activating Dimension V). The key difference between the two lay in the initial triggering dimension and the transmission sequence: the LUNA crisis followed the endogenous path "margin → funding → liquidity," whereas the FTX crisis followed the exogenous-shock path "platform → margin → funding → liquidity." But both ultimately converged on the same resonant terminal state—a multi-dimensional positive-feedback loop producing a systemic collapse in arbitrage capacity. This pattern of "different starting points, same terminal state" provides strong support for the general explanatory power of the risk resonance model.
17.9.2 The risk transmission matrix
The May 2022 case vividly demonstrated the destructive power of risk resonance, but the transmission mechanism behind it is not entirely random. Different risk dimensions have intrinsic linkages of differing strength, and some combinations are naturally more prone to forming positive-feedback loops. To understand this more systematically, we can construct a risk transmission matrix that qualitatively assesses the amplifying effect on other dimensions' risk when the risk in one dimension is triggered.
The core idea of the matrix is to assess a cross-impact coefficient: when a crisis occurs in one dimension, to what degree does it aggravate the crisis in the others? We focus mainly on the four most central endogenous risk dimensions in a crisis (see Figure 17-26): margin pressure, funding rate reversal, platform risk, and liquidity evaporation.
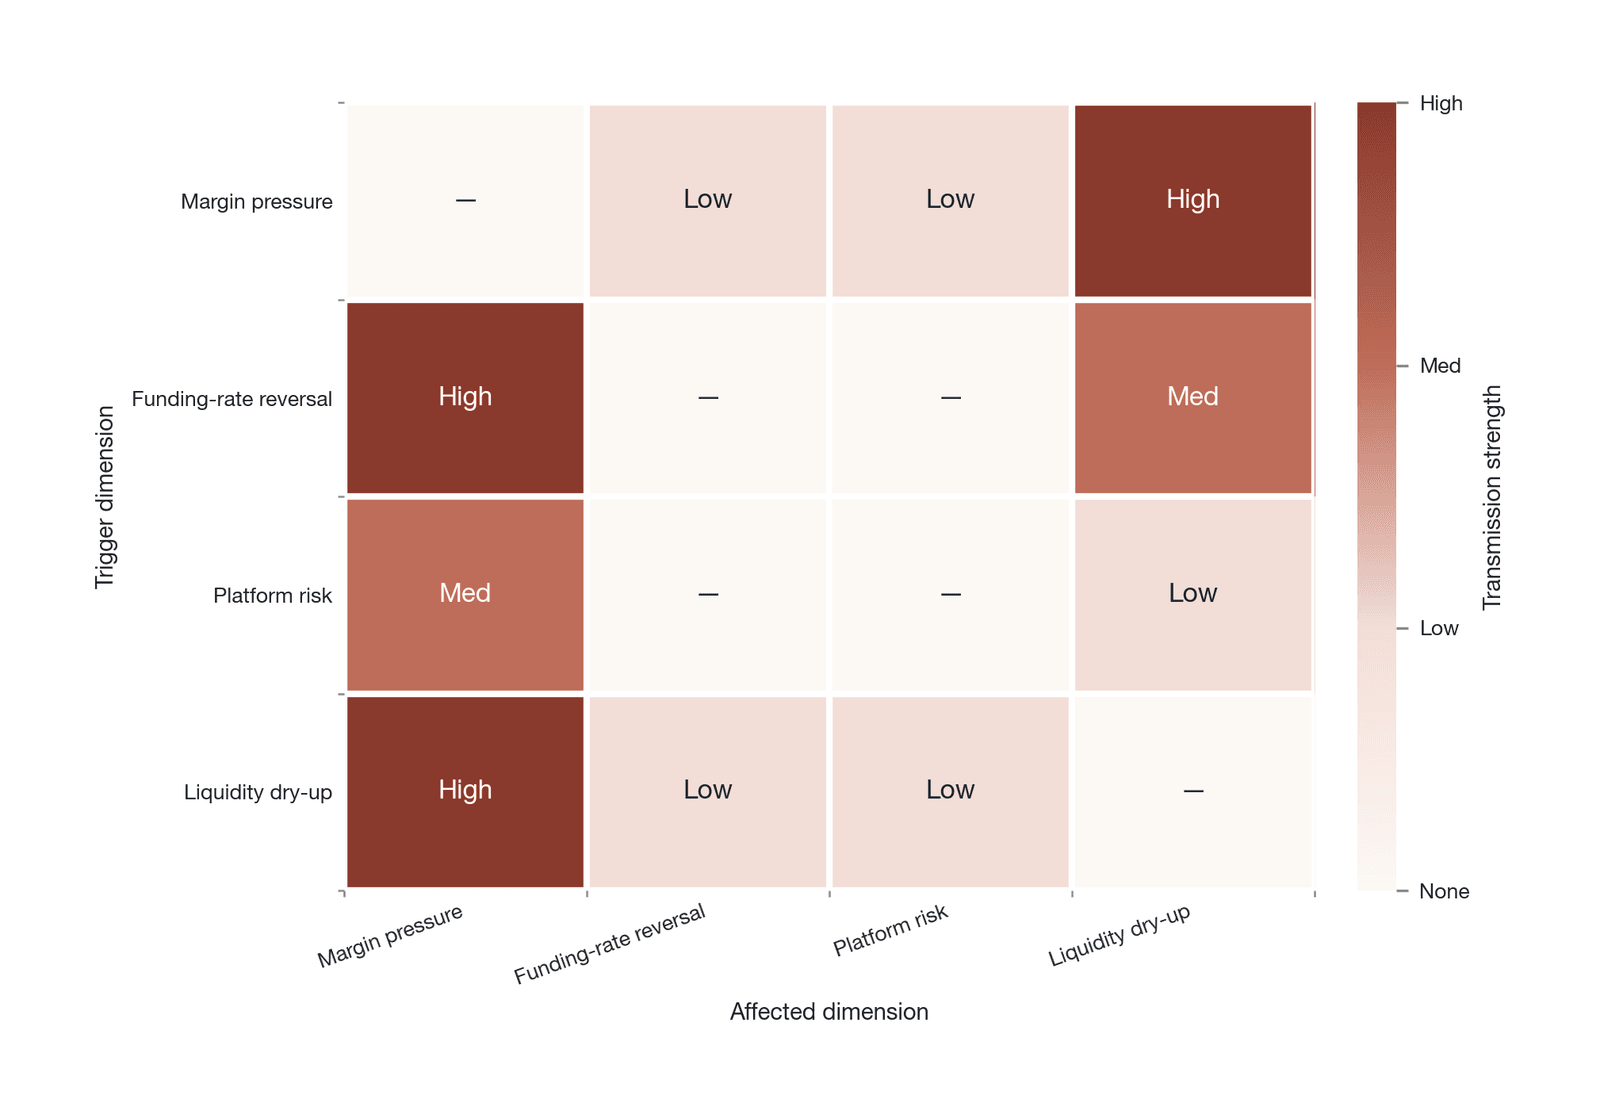
Figure 17-26. The risk transmission matrix (Data source: conceptual schematic drawn by the author; the intensities are qualitative assignments)
Based on a retrospective analysis of four major crises—March 2020, May 2021, May 2022, and November 2022—we can annotate each path in the transmission matrix with a qualitative transmission strength (strong/medium/weak, serving only as the visual scale of Figure 17-26 and not to be read as a statistical estimate). Of these, the transmission from margin pressure to liquidity evaporation is strongest (the direct impact of forced liquidation on order-book depth); the reverse transmission from liquidity evaporation to margin pressure is the next strongest (the accelerating effect of amplified slippage on margin consumption); the transmission from funding rate reversal to margin pressure is strong (the erosion of the capital buffer by sustained negative funding, consistent with Figure 17-26 and the "significant one-directional amplification" discussed below); and the transmission from platform risk to margin pressure is of medium-to-low strength (the blocking effect of frozen funds on cross-platform margin redeployment). A sample of only four crises falls far short of what is needed to identify precise coefficient differences to two significant figures, so only qualitative ordinal ranks, not specific numbers, are given here. Rigorous coefficient estimation awaits future work using the CoVaR method (Adrian & Brunnermeier, 2016) [30] to measure the conditional value-at-risk contribution among dimensions, or a DCC-GARCH model to characterize the time-varying nature of the dynamic conditional correlations among dimensions. Transmission paths also differ markedly across crisis types: in a margin/funding-driven crisis (such as May 2022), the transmission strength of the "margin → liquidity" path may approach the upper bound of the estimates above; whereas in a platform-risk-driven crisis (such as November 2022), the "platform → margin" path may become the dominant channel. The single coefficient values above should therefore be understood as a summary description across crisis types and should be adjusted, in any specific risk assessment, to the triggering characteristics of the stress scenario.
Several key transmission paths and positive-feedback loops can be observed in the matrix. The strongest two-way amplification exists between margin pressure and liquidity evaporation. When violent price swings raise margin pressure, a flood of passively triggered forced-liquidation orders pours into the market and consumes the limited liquidity in an instant, intensifying risk in the liquidity-depletion dimension. Conversely, when liquidity evaporation widens spreads and thins market depth, arbitrageurs' slippage costs on closing out rise sharply, which directly enlarges the real losses on their positions, consumes margin faster, and intensifies pressure in the margin-and-forced-liquidation dimension. This "margin–liquidity" spiral is one of the most typical positive-feedback loops in a market collapse. On top of this, funding rate reversal exerts a significant one-directional amplification on both margin pressure and liquidity evaporation. When the funding rate turns from positive to negative and reaches extreme levels, it directly accelerates the consumption of basis arbitrageurs' margin and thus markedly intensifies pressure in the margin-and-forced-liquidation dimension; at the same time, sustained negative funding forces large numbers of arbitrageurs to abandon the strategy collectively and exit, and this collective, one-directional closing is itself an enormous shock to market liquidity, intensifying risk in the liquidity-depletion dimension. The polarization of the funding rate acts as a catalyst in the risk-transmission chain. The distinctive role of platform risk deserves special attention. Although the direct amplification coefficient of platform risk (such as withdrawal restrictions) appears low in the matrix, it performs a risk-entrenchment function. When other risk dimensions have already been activated, the appearance of platform risk severs the key channels through which arbitrageurs redeploy capital between markets, so that margin pressure that could have been relieved through cross-market operations becomes unmanageable—entrenching and amplifying a local problem. Its aggravating effect on margin pressure is indirect but severe.
Through this matrix, we can see clearly that risk resonance is not a simple linear sum. An initial shock (a price decline, say) first activates margin pressure; margin pressure then activates liquidity risk through a strong transmission path, while a shift in sentiment activates funding-rate risk; and the three act together to turn the arbitrageur's situation sharply for the worse. If platform risk is layered on at this point, the probability that the entire arbitrage system collapses rises steeply. Understanding these key transmission paths is essential for risk management and stress testing: it tells us that what deserves attention is not the isolated impact of any single risk but the possibility that these high-coefficient paths are activated simultaneously.
The choice of dimensions in the 4×4 matrix above reflects the empirical characteristics of the crises of 2020–2022, but as market structure evolves, the three excluded dimensions are taking on growing systemic importance. The execution-and-timing dimension may become a crisis amplifier in a market increasingly dominated by high-frequency arbitrage; the smart-contract-and-oracle dimension is highly likely to be activated in the next systemic crisis as the market share of DeFi perpetual futures grows (as with Hyperliquid's rapid rise in 2024–2025); and the regulation-and-compliance dimension, as the global regulatory framework tightens, may at any moment become a trigger or amplifier of a crisis. A forward-looking risk-assessment framework should construct the full 7×7 transmission matrix, paying particular attention to two paths that have not yet been fully exposed in the historical sample but could prove highly destructive in the future market structure: "oracle manipulation → liquidation cascade → liquidity evaporation" and "sudden regulatory event → trading-route blockage → liquidity fragmentation."
17.9.3 The nonlinear amplification effect
The most central feature of the risk resonance model is its nonlinearity. In a normal market, the constraints an arbitrageur faces can be treated as approximately linear: a 10% increase in the margin requirement, for example, may reduce the optimal position size by a corresponding 10%. Risk is predictable and manageable, and its effect is proportional to the strength of the trigger. Once the market enters the resonant state, however, this linear, additive logic breaks down. The total risk of the system grows far faster than the simple sum of the growth rates of the individual sub-risks, exhibiting a superlinear, self-reinforcing amplification (here "superlinear" means growing faster than a linear sum, not an exponential function in the strict sense).
The root of this nonlinear amplification lies in the positive-feedback loops described earlier. In a simple linear system, input A produces output B and input C produces output D, so total output is B + D. In a nonlinear system with positive feedback, however, input A produces output B, output B in turn strengthens inputs A and C, and the output D produced by input C may also strengthen input A. The various parts of the system excite one another, forming a self-accelerating loop whose final output is far greater than B + D.
A functional relationship makes this more intuitive. If "market stress" (combining factors such as price volatility and fund outflows) is placed on the horizontal axis and "total arbitrage capacity" on the vertical, the relationship between the two is not a straight line but an S-shaped curve (as shown in Figure 17-27), which undergoes a sharp nonlinear change near a certain point.
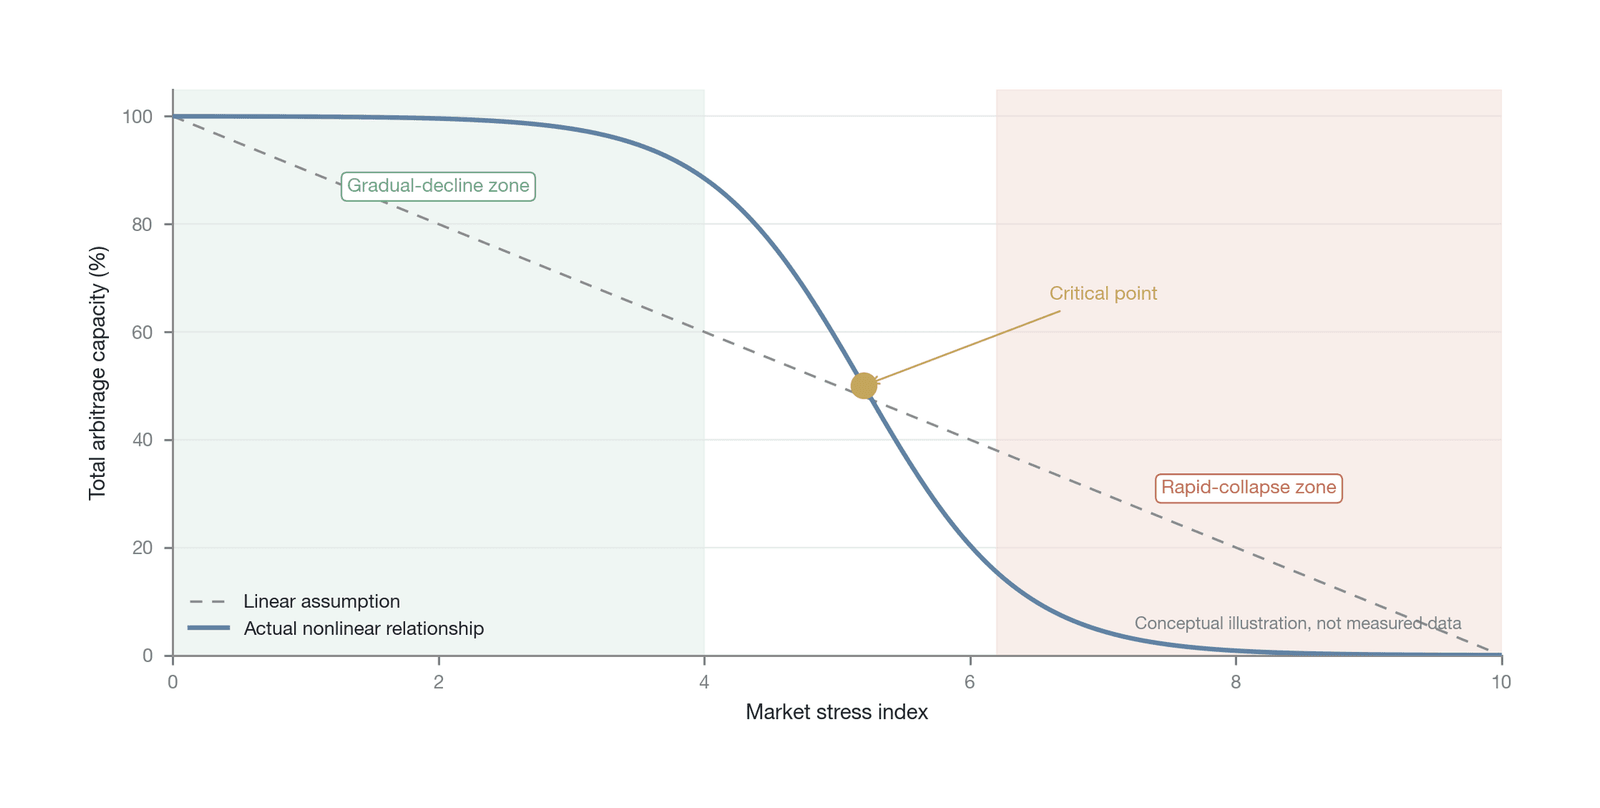
Figure 17-27. The nonlinear relationship between arbitrage capacity and market stress (Data source: conceptual schematic drawn by the author, not empirical data; the axes are illustrative scales)
The nonlinear relationship above can be characterized heuristically through a conceptual system of simultaneous equations that captures the positive-feedback structure between margin pressure and liquidity depletion (it must be stressed that the equations below serve only to express the logical structure of this feedback formally; their parameter calibration, numerical solution, and phase-diagram analysis are left to future empirical research, and this section makes no quantitative estimate of them):
t = f(M_t < M{\text{threshold}})
Here Mt is the arbitrageur's margin balance at time t, ΔPt is the change in the underlying price, rt is the current funding rate, N is the notional size of the position, and Lt is market liquidity (available order-book depth). The parameter α captures the intensity of the shock from price movement to margin, β captures the speed at which the funding rate consumes margin, and η captures the amplifying effect of liquidity depletion on execution cost; here α and η are scaling coefficients that convert price and liquidity shocks into the currency units of margin (with ΔPt taken as a percentage change). The term max(−rt, 0) is used rather than |rt| because only a negative rate consumes the short arbitrageur's margin; as Lt approaches zero, the η term tends to infinity, reflecting the explosive growth of closing costs inside a liquidity black hole. When Mt falls below the threshold Mthreshold, forced liquidation is triggered, and the liquidation orders consume liquidity at the coefficient γ. This system of equations reveals the core of resonance: the exhaustion of margin triggers liquidation (the third equation), liquidation consumes liquidity (the second equation), and falling liquidity amplifies slippage and thereby accelerates margin consumption (feeding back into the η term of the first equation), forming a self-reinforcing collapse spiral. This model is a simplified endogenous-risk framework that does not incorporate the transmission effects of external macro-liquidity conditions (such as the dollar interest-rate environment or the global risk-appetite cycle), a direction for further extension.
The model contains two starkly different regions.
In the gradual-decline region, market stress is rising but has not yet triggered strong positive feedback among the risk dimensions. Arbitrageurs may need to reduce leverage somewhat or absorb some extra slippage, but their core arbitrage function still operates. The impact of risk is roughly linear, and arbitrage capacity declines in proportion to the rise in market stress. At this stage, market efficiency has declined somewhat, but the pricing mechanism has not yet failed.
Once market stress crosses a certain critical point, however, the system enters the rapid-collapse region. This critical point marks the simultaneous activation of several core positive-feedback loops (such as the "margin–liquidity" spiral). Now any small additional pressure can be amplified disproportionately by the system's internal amplification mechanisms. Arbitrage capacity no longer declines gradually but collapses sharply and nonlinearly. Once the key positive-feedback loops are activated, the system undergoes a chain-like collapse of capacity at great speed. At this stage, the sum of the risks is far greater than the sum of the parts, because the risks no longer combine by addition but by multiplication.
The events of May 2022 are a faithful portrait of this nonlinear amplification. Before May 8, the market was already under pressure, but the arbitrage system was still functioning normally. After the two key events—the UST depegging and the funding rate turning negative—the system quickly crossed the critical interval, and arbitrage capacity contracted sharply to near-standstill over the following 48 hours. This explains why market collapses are always so rapid and exceed expectations: the process is not gradual but more like a phase transition of state (a physics analogy denoting the rapid jump of a system from one state to another—also understandable as a regime shift—rather than a thermodynamic phase transition in the strict sense).
17.9.4 The phase-transition critical point
The turning point at which arbitrage capacity shifts from linear decline to nonlinear collapse marks the phase transition of the risk state from "manageable" to "uncontrollable" (a physics analogy, here and below; also understandable as a regime-transition interval, for which this chapter provides no identifiable critical exponent or scaling law). Understanding the nature of this turning point has important analytical significance for all market participants, and for risk managers and regulators in particular. It tells us that linear risk models built on normal-market data may fail in a crisis, because they cannot capture this state-jump behavior. The observable indicators proposed in Section 17.1.4 (the funding-rate z-score, the ratio of liquidation volume to open interest, the coefficient of variation of order-book depth, and the dispersion of the cross-exchange basis) can serve as ex ante early-warning proxies for this transition interval, but what the current framework provides is a "combination of early-warning signals," not a critical point that can be located precisely.
This critical point is not a fixed number but a dynamic threshold determined jointly by market structure, participant behavior, and the macro environment. We can, however, identify some common catalysts that are often the key triggers pushing the system across the critical point.
The first type of catalyst is the synchronization of collective behavior. In a normal market, arbitrageurs behave in diverse ways—some entering, some exiting—which sustains the market's liquidity and stability. When a sufficiently strong external or internal shock appears (such as a collective turn to negative funding), however, it becomes a powerful coordinating signal that leads large numbers of previously independent arbitrageurs to make the same decision at the same time—collectively closing basis-arbitrage positions, for example. This synchronization of behavior is the direct cause of a liquidity black hole and a stampede, and a key step in driving the system into the nonlinear-collapse region. In crypto markets, the speed of this synchronization is markedly accelerated by the real-time transparency of social media and on-chain data. Unlike in traditional financial markets, the core information of crypto markets—liquidation volume, funding rates, changes in a protocol's total value locked (TVL), and the on-chain operations of whale addresses—is broadcast to the entire market in real time through Twitter/X, Telegram groups, and data dashboards such as Coinglass and DefiLlama. This ultra-rapid diffusion of information lets a "coordinating signal" reach all market participants worldwide within minutes, compressing a panic-transmission process that might take hours or even days in traditional markets into a very short window. The transparency of on-chain data becomes a double-edged sword here: it improves informational efficiency in a normal market, but in a crisis it becomes an efficient medium for transmitting panic, accelerating the phase transition from the stressed state to the resonant one.
The second type of catalyst is the failure of core infrastructure. Within the framework of the Arbitrage Infrastructure Hypothesis, large arbitrageurs and core exchanges are themselves key nodes in the network that transmits market efficiency. When these nodes fail—whether for internal reasons (such as the FTX collapse) or under external pressure—the effect is far more than the removal of one participant. It damages the topology of the entire network, severs many arbitrage routes, and causes a systemic breakdown in the transmission of efficiency. The failure of a core node has a global impact, enough to push the entire system into an uncontrollable state.
The third type of catalyst is the procyclicality of risk models. The risk-management models used by many institutional and individual investors are themselves procyclical. When market volatility rises, for example, a model calls for reducing leverage and cutting positions. When everyone uses similar models and acts at the same time (see Figure 17-28), this collective "de-risking" itself creates greater risk. This paradox is highly consistent with the endogenous risk theory of Danielsson, Shin, and Zigrand (2004) [31]. They argued that when market participants use similar risk-measurement tools (such as value-at-risk, or VaR, models) to manage their portfolios, the positive-feedback loop of rising volatility → the model calls for cutting positions → collective selling → volatility rises further makes risk itself an endogenous variable rather than an exogenous background parameter. Adrian and Shin (2010) [32] showed further that the procyclical leverage adjustment of financial intermediaries is the core transmission mechanism of this endogenous risk. In crypto markets, because exchanges' automatic liquidation engines and tiered-margin regimes functionally play the role of risk models in traditional finance, this procyclicality is institutionally embedded in the market structure itself. It intensifies selling pressure and liquidity depletion, forming a "risk management produces risk" paradox that accelerates the system's crossing of the critical point.
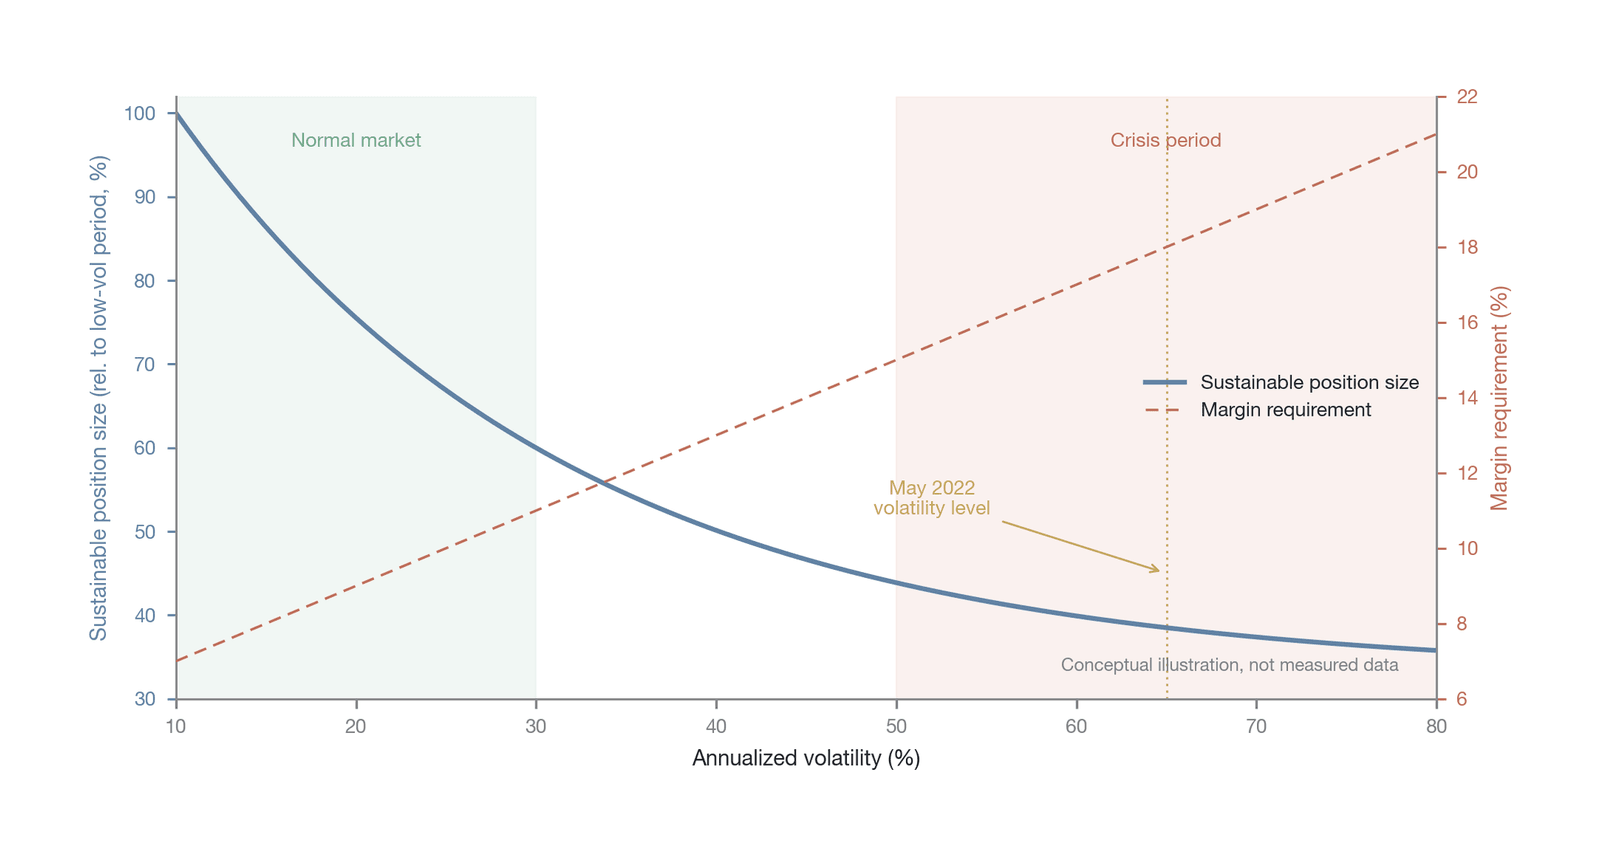
Figure 17-28. The suppressive effect of the margin constraint on arbitrage position size (Data source: drawn by the author; a theory-based conceptual illustration, not empirical data)
Figure 17-28 quantifies the amplifying effect of risk-model procyclicality: as annualized volatility rises, the safe position size computed by the model steadily contracts, and this contraction is steepest in the low-to-moderate volatility range—each step up in volatility cuts the position sharply. When volatility rises to crisis levels (such as the roughly 65% of May 2022), the position size has already been suppressed to a very low level, and further decline flattens out. This means that it is precisely in the phase of a mild rise in volatility that large numbers of arbitrageurs, driven by their risk models, cut positions in concert within the same time window. This risk-model-driven synchronized deleveraging becomes the key catalyst pushing the market toward the critical point.
The consequences of the phase transition from "manageable" to "uncontrollable" are profound. Once the critical point is crossed, the market's self-repair mechanism fails. As endogenous providers of liquidity, arbitrageurs retreat collectively when their own survival is at stake, making the recovery of liquidity extraordinarily difficult. A collapse of trust—in an exchange or a stablecoin, say—is harder still to rebuild in the short term. This explains why, after a major crisis, the market's level of efficiency (reflected in various spreads and bases) often takes weeks or even months to recover slowly. The system's collapse is asymmetric: the collapse may take only hours, whereas rebuilding trust, restoring capital, and repairing the arbitrage network take weeks to months. This pronounced time asymmetry between collapse and recovery is an important feature of risk resonance and the nonlinear phase transition.
17.10 A risk anatomy of the Ethena protocol
The Ethena protocol raises the basis-arbitrage mechanism from an individual strategy to a protocol-level, scaled-up operation, making it a representative case for analyzing how arbitrage constraints map into systemic risk. This section takes Ethena as its subject, reviews the risk-exposure characteristics of its arbitrage mechanism, maps the seven constraint dimensions onto its operating structure, and tests the explanatory power of the analytical framework above through the real stress test of April 2024. A note on the division of labor: Section 16.4.3 addressed Ethena's mechanism design and its "arbitrage-as-a-service" model, whereas this section turns to its risk anatomy; Section 17.3.3 raised the "negative funding → redemption → unwinding → still more negative funding" feedback loop and the collateral basis risk, which this section develops systematically without repeating the mechanism details.
As Chapter 16 described, Ethena constructs the delta-neutral synthetic asset USDe by holding an equivalent amount of spot assets while simultaneously opening a short perpetual futures position of equal size, providing yield while suppressing the perpetual futures premium.
When we turn to the risk dimensions, however, this "source of efficiency" immediately reveals its symmetric character as a source of risk. Ethena is, in essence, a scaled-up positive-carry position, which means its dependence on the funding rate is absolute. In a bull or normal market, strong demand for long leverage ensures that the short side continues to receive positive funding, which is treated as the protocol's profit. When sentiment reverses, however, this profit instantly becomes a steep cost of carry. Unlike an individual arbitrageur, Ethena—a giant entity managing billions of dollars of assets—faces not the simple failure of a strategy but a protocol-level systemic fragility. This fragility arises because it has frozen what was originally dispersed, dynamic arbitrage into a rigid protocol architecture dependent on scale effects, which makes it prone to triggering risk resonance at extreme moments.
To assess Ethena's risk profile quantitatively, we can map the seven-dimensional constraint topology of this chapter directly onto its operating mechanism. Begin with margin and forced liquidation (the margin-and-forced-liquidation dimension). Although Ethena uses full collateralization and keeps leverage low on the CEX side, the reality that cross-exchange margin cannot be pooled forces it to pre-fund capital across multiple platforms. When the market swings violently—especially when the mark price and the market price diverge—Ethena must redeploy funds in real time to meet margin calls, and any delay at the execution level can cause a single-leg position to be forcibly liquidated, instantly exposing enormous delta risk.
Ethena also faces an additional and material risk not explicitly classified within the seven-dimensional constraint topology: collateral basis risk. The liquid staking derivatives in its portfolio, such as stETH, are not rigidly pegged 1:1 to the underlying asset, ETH. In a systemic crisis, the secondary-market liquidity of stETH can shrink sharply, driving its price well below that of ETH (in June 2022, stETH traded at a discount of more than 5% at one point). This depegging at the collateral level pushes Ethena's actual collateralization ratio below its nominal level, intensifying margin pressure and, in an environment of funding rate reversal, creating a double squeeze of "rate erosion plus collateral shrinkage."
Funding rate reversal (the funding-rate-reversal dimension) is the most direct threat Ethena faces. When the market enters a period of panic, a negative funding rate means that USDe holders not only earn no yield but that the protocol itself must pay the market. Although Ethena has established a reserve fund as a buffer, the reserve's size relative to its TVL determines its capacity to withstand sustained negative funding. The liquidity black hole (the liquidity-depletion dimension) is especially prominent in the redemption scenario. Once negative funding triggers large-scale redemptions, Ethena must close its short positions on the secondary market and sell the spot, and this large-scale, one-directional operation easily sets off a stampede, sharply raising exit slippage, further eroding the reserve, and accelerating the depegging of USDe. Counterparty risk (the counterparty-and-platform dimension) and smart-contract risk (the smart-contract-and-oracle dimension) likewise cannot be ignored: the collapse of any partner exchange or a vulnerability in an on-chain contract can cause a systemic failure of the protocol's arbitrage structure.
Ethena's systemic importance can be estimated with a set of concentration metrics. At the peak of its TVL, Ethena's short perpetual futures positions accounted for a single-digit percentage of market-wide BTC/ETH perpetual open interest (about 5% of Ethereum perpetual open interest in early 2024; see Section 16.4.3), but on particular contracts at some centralized exchanges, industry estimates put its share of that contract's open interest at about 10%–15%. The following estimates its unwinding impact using a conservative, illustrative scenario (the parameters are assumed values used to convey magnitude, not a precise forecast). Suppose Ethena must fully unwind $5 billion of notional short positions within 7 days; that daily volume on BTC perpetual futures at major exchanges is about $20 billion (a magnitude referenced to industry statistics such as CoinGecko); and that crisis-period liquidity shrinks to 20%–30% of normal. Then its unwinding volume would account for a considerable share of the daily liquidity available in the crisis. Using a simplified square-root price-impact model (impact proportional to the square root of the ratio of unwinding size to market depth), a one-directional unwind of this scale might produce cumulative slippage on the order of tens to over a hundred basis points, eroding tens of millions to over a hundred million dollars of reserves. More important, one-directional buying of this scale (to close the short) would significantly push up the perpetual futures price and shift the market-wide funding rate, creating a spillover effect: "Ethena unwinds → funding fluctuates → other arbitrageurs unwind → liquidity deteriorates further."
In April 2024, the crypto market went through a notable correction, providing an excellent experimental window for observing Ethena's behavior under stress. As the Bitcoin price slid from its high, the market-wide perpetual futures funding rate fell rapidly within a few days from very high levels to zero and even negative. In the process, the annualized yield of sUSDe fluctuated violently. According to observed data, a yield that had exceeded 30% fell to single digits within a single week, at times even touching the minimum-yield protection floor set by the protocol. Specifically, the 7-day moving-average annualized yield of sUSDe fell rapidly from about 35% at the start of April (consistent with the publicly recorded historical peak of about 35%) within a few days, dropping to single digits and even recording a negative yield in some intervals. Over the same period, USDe traded at a slight negative premium on the secondary market (in major trading pools such as Curve); according to Ethena's own account of this stress test, for the great majority of the sell-off its market price held within about 20 basis points of $1. The period saw sizable net redemptions (the company disclosed that more than 100 million USDe were redeemed, roughly a single-digit percentage of the then-outstanding supply), and the protocol drew on its reserves to pay the short funding and maintain the sUSDe yield. Among the precise figures above, the supply and price metrics can be read directly from on-chain sources and DefiLlama, whereas the proportion of reserves consumed and the per-exchange open-interest shares are the author's estimates based on public data and should be treated with caution; the company also disclosed that total market open interest contracted by about 15% in a single day over the same period (a market-level figure, not Ethena's own reduction).
This stress test revealed the real effectiveness of Ethena's reserve mechanism. When the funding rate turned negative, the protocol began drawing on the reserve to pay the short funding, maintaining a positive—or at least zero—return for sUSDe holders. Although Ethena's TVL did not see large-scale outflows in this test, USDe traded at a slight negative premium in some decentralized trading pools, reflecting the market's concern about the protocol's solvency in a prolonged negative-funding environment. The event proved that although the reserve can buffer short-term rate fluctuations, it cannot resolve the capital-flight pressure created by structurally negative funding over the long run. This pressure transmits to the user side through a falling yield and then, through redemptions, presses back on liquidity at the exchange end, forming a textbook risk-feedback loop.
The Ethena case offers a profound lesson for understanding the systemic risk of protocol-level arbitrage. It shows the abrupt change in the nature of risk as arbitrage shifts from "dispersed and individual" to "scaled-up and protocol-level" [33]. At the individual level, arbitrage constraints are obstacles that limit profit; at the protocol level, they become a source of risk that can trigger systemic collapse. When an arbitrageur plays the dual role of stablecoin issuer and market-infrastructure provider at once, its retreat is no longer a simple taking of profit but a double shock to market liquidity and stability.
In addition, Ethena faces a seventh-dimension risk that has not yet been fully discussed: uncertainty over its regulatory characterization. As a redeemable token whose yield derives from an arbitrage strategy, sUSDe occupies a legal gray area in several jurisdictions. If sUSDe were deemed an investment contract in a major jurisdiction (meeting the criteria of the Howey test), its unregistered public offering would face serious legal consequences. More broadly, Ethena's model of pooling user funds and trading derivatives on CEXs could, in some jurisdictions, trigger the regulatory classification of a "collective investment scheme" or "managed fund" and thus require an asset-management license. What makes this regulatory-characterization risk distinctive is its sword-of-Damocles effect: even before any regulatory action actually occurs, the mere existence of regulatory uncertainty is enough to deter institutional capital, limit the protocol's growth in scale, and accelerate rational holders' redemption decisions in a market panic.
Ultimately, Ethena's success or failure hinges on its ability to control "risk resonance." If it can smooth funding fluctuations by introducing more diversified collateral and better risk-hedging tools, it will continue to advance the efficiency of crypto markets; if, on the other hand, it expands in scale far faster than its capacity to withstand risk grows, it may, in the next and more extreme market resonance, re-enact the systemic collapses of algorithmic-stablecoin history. This recognition carries important implications for risk assessment for both protocol designers and strategy participants.
17.11 Chapter summary
Around the analytical framework of the arbitrage constraint topology, this chapter has systematically deconstructed the seven core risk dimensions facing perpetual futures arbitrage: margin and forced liquidation; funding rate reversal; counterparty and platform risk; execution and timing risk; liquidity depletion; smart contract and oracle risk; and regulation and compliance risk. Each dimension reveals a systematic departure of "risk-free arbitrage" from what obtains in real markets.
The chapter's core theoretical contribution is the risk resonance model. Through an empirical review of the Terra/LUNA crisis of May 2022, with the FTX collapse of November 2022 as a comparison case, the chapter has argued that these constraint dimensions do not operate independently of one another but, under extreme conditions, activate one another and cross-amplify through positive-feedback mechanisms. What was observed in full in these two flagship crises was mainly the resonance of four core dimensions—margin, funding rate reversal, platform risk, and liquidity depletion; the three dimensions of execution, smart contract, and regulation are incorporated into the framework more in the form of "possible activation in a future market structure." In this sense, "seven-dimensional resonance" is a proposition that is theoretically extensible but not yet fully validated by history. The stacking of margin pressure and funding rate reversal, and the resonance of liquidity depletion and platform risk, together constitute a nonlinear risk-amplification network. This model explains why the decay of arbitrage capacity is not a linear, gradual process but exhibits a state-jump from "manageable" to "uncontrollable": when market stress breaks through a certain critical interval, the carrying capacity of the arbitrage system can contract sharply within a very short time.
The Ethena case study further tests the explanatory power of this framework. As a representative practice that raises basis arbitrage from an individual strategy to a protocol-level, scaled-up operation, Ethena's experience shows that the institutionalization of arbitrage magnifies the potential destructive power of risk resonance. When an arbitrageur takes on the multiple roles of stablecoin issuer and market-infrastructure provider at once, the constraints it faces are no longer merely boundary conditions on profit but structural weak points that can trigger the transmission of systemic risk.
The chapter's analysis provides the necessary risk-dimension complement to the Arbitrage Infrastructure Hypothesis of Chapter 16. If arbitrageurs are the central custodians of market efficiency, then arbitrage constraints define the structural upper bound on that efficiency. The persistence of arbitrage returns is, in essence, the risk premium the market pays arbitrageurs for bearing the seven-dimensional constraints and resonance risk. This recognition redefines arbitrage returns from "the residue of market inefficiency" to "reasonable compensation for bearing risk," providing a more complete theoretical foundation for understanding the efficiency frontier of crypto markets.
Looking ahead, the risk landscape of perpetual futures arbitrage will keep changing as market infrastructure evolves. At the institutional level, a cross-exchange unified-margin system, the introduction of a CCP mechanism, and the clarification of the regulatory framework promise to reduce the intensity of the margin, counterparty, and compliance constraints. At the technical level, the maturation of on-chain clearing infrastructure, stronger decentralization of oracle networks, and improved cross-chain interoperability will help ease the constraints of the execution, liquidity, and smart-contract dimensions. Yet the nonlinear character of risk resonance means that even if the constraint along a single dimension is eased, systemic risk may reaggregate through new transmission paths. Future research should further quantify the transmission coefficients among dimensions, build an operational early-warning model of risk resonance, and explore feasible paths for embedding risk-mitigation mechanisms at the level of protocol design.
References
[1] Shleifer, A., & Vishny, R. W. (1997). The limits of arbitrage. The Journal of Finance, 52(1), 35–55. https://doi.org/10.1111/j.1540-6261.1997.tb03807.x
[2] DeLong, J. B., Shleifer, A., Summers, L. H., & Waldmann, R. J. (1990). Noise trader risk in financial markets. Journal of Political Economy, 98(4), 703–738. https://doi.org/10.1086/261703
[3] Xiong, W. (2001). Convergence trading with wealth effects: An amplification mechanism in financial markets. Journal of Financial Economics, 62(2), 247–292. https://doi.org/10.1016/S0304-405X(01)00078-2
[4] Liu, J., & Longstaff, F. A. (2004). Losing money on arbitrage: Optimal dynamic portfolio choice in mispriced markets. The Review of Financial Studies, 17(3), 611–641. https://doi.org/10.1093/rfs/hhg029
[5] Gromb, D., & Vayanos, D. (2010). Limits of arbitrage. Annual Review of Financial Economics, 2(1), 251–275. https://doi.org/10.1146/annurev-financial-073009-104107
[6] Hamilton, J. D. (1989). A new approach to the economic analysis of nonstationary time series and the business cycle. Econometrica, 57(2), 357–384. https://doi.org/10.2307/1912559
[7] Makarov, I., & Schoar, A. (2020). Trading and arbitrage in cryptocurrency markets. Journal of Financial Economics, 135(2), 293–319. https://doi.org/10.1016/j.jfineco.2019.07.001
[8] Brunnermeier, M. K., & Pedersen, L. H. (2009). Market liquidity and funding liquidity. The Review of Financial Studies, 22(6), 2201–2238. https://doi.org/10.1093/rfs/hhn014
[9] Coinglass. (n.d.). Cryptocurrency market data and analytics. https://www.coinglass.com/
[10] Diamond, D. W., & Dybvig, P. H. (1983). Bank runs, deposit insurance, and liquidity. Journal of Political Economy, 91(3), 401–419. https://doi.org/10.1086/261155
[11] Ethena Labs. (2024). Ethena USDe analytics [Dashboard]. DefiLlama. https://defillama.com/protocol/ethena
[12] Investopedia. (2023, January 4). FTX crypto exchange collapse explained. https://www.investopedia.com/ftx-exchange-5200842
[13] Kharif, O. (2022, November 12). At least \$1 billion of client funds missing at failed crypto firm FTX. Reuters. https://www.reuters.com/markets/currencies/least-1-billion-client-funds-missing-failed-crypto-firm-ftx-sources-2022-11-12/
[14] Michaels, D. (2023, June 9). Binance.US halts dollar deposits after SEC crackdown. Reuters. https://www.reuters.com/technology/binanceus-halts-dollar-deposits-2023-06-09/
[15] Bybit. (n.d.). Auto-deleveraging (ADL). Bybit Help Center. https://www.bybit.com/en-US/help-center/s/article/Auto-Deleveraging-ADL
[16] Aquilina, M., Budish, E., & O'Neill, P. (2022). Quantifying the high-frequency trading "arms race." The Quarterly Journal of Economics, 137(1), 493–564. https://doi.org/10.1093/qje/qjab032
[17] Muck, M., Schmidl, T., & Wolf, J. (2025). Wish or reality? On the exploitability of triangular arbitrage in cryptocurrency markets. Finance Research Letters, 73, 106574. https://doi.org/10.1016/j.frl.2024.106574
[18] Daian, P., Goldfeder, S., Kell, T., Li, Y., Zhao, X., Bentov, I., Breidenbach, L., & Juels, A. (2020). Flash Boys 2.0: Frontrunning in decentralized exchanges, miner extractable value, and consensus instability. In 2020 IEEE Symposium on Security and Privacy (SP) (pp. 910–927). IEEE. https://doi.org/10.1109/SP40000.2020.00040
[19] Paradigm. (2025). The key neutrality of baselayer markets. Paradigm Research.
[20] Budish, E., Cramton, P., & Shim, J. (2015). The high-frequency trading arms race: Frequent batch auctions as a market design response. The Quarterly Journal of Economics, 130(4), 1547–1621. https://doi.org/10.1093/qje/qjv027
[21] Stein, J. C. (2009). Presidential address: Sophisticated investors and market efficiency. The Journal of Finance, 64(4), 1517–1548. https://doi.org/10.1111/j.1540-6261.2009.01472.x
[22] Khandani, A. E., & Lo, A. W. (2011). What happened to the quants in August 2007? Evidence from factors and transactions data. Journal of Financial Markets, 14(1), 1–46. https://doi.org/10.1016/j.finmar.2010.07.005
[23] Halborn. (2025). Explained: The GMX hack (July 2025). https://www.halborn.com/blog/post/explained-the-gmx-hack-july-2025
[24] CoinDesk. (2025, September 2). Bunni DEX halts smart contracts after exploit drains \$8.4M across chains. https://www.coindesk.com/web3/2025/09/02/bunni-dex-halts-smart-contracts-after-exploit-drains-usd8-4m-across-chains
[25] The Block. (2026, January 25). Matcha Meta sees \$16.8 million drained in SwapNet incident. https://www.theblock.co/post/386986/matcha-meta-swapnet-incident
[26] Three Sigma. (2025). 2024 most exploited DeFi vulnerabilities. https://threesigma.xyz/blog/exploit/2024-defi-exploits-top-vulnerabilities
[27] Decrypt. (2020, November 26). Oracle exploit sees \$89 million liquidated on Compound. https://decrypt.co/49657/oracle-exploit-sees-100-million-liquidated-on-compound
[28] FX Empire. (2022). Over \$2B lost in 13 separate crypto bridge hacks this year. https://www.fxempire.com/news/article/over-2b-lost-in-13-separate-crypto-bridge-hacks-this-year-1085594
[29] Hou, Y., & Liu, Y. (2023). Regulatory arbitrage and market efficiency in decentralized finance (Working Paper). https://doi.org/10.2139/ssrn.4567890
[30] Adrian, T., & Brunnermeier, M. K. (2016). CoVaR. American Economic Review, 106(7), 1705–1741. https://doi.org/10.1257/aer.20120555
[31] Danielsson, J., Shin, H. S., & Zigrand, J.-P. (2004). The impact of risk regulation on price dynamics. Journal of Banking & Finance, 28(5), 1069–1087. https://doi.org/10.1016/j.jbankfin.2003.06.002
[32] Adrian, T., & Shin, H. S. (2010). Liquidity and leverage. Journal of Financial Intermediation, 19(3), 418–437. https://doi.org/10.1016/j.jfi.2008.12.002
[33] Aramonte, S., Huang, W., & Schrimpf, A. (2021). DeFi risks and the decentralisation illusion. BIS Quarterly Review, September 2021, 21–36. https://www.bis.org/publ/qtrpdf/r_qt2112b.htm
Footnotes
- The term topology is borrowed here to emphasize the connective relationships and structural invariance among the risk dimensions, rather than in the strict sense of mathematical topology. The framework is concerned with how the relational structure among risk factors remains stable, or shifts abruptly, across different market states. ↩